Article

Assessing the Vulnerability of Rural Households to Floods at Pol-e Dokhtar Region in Iran

by
Somayeh Ahmadi
,
Rezvan Ghanbari Movahed
*,
Saeed Gholamrezaie
and
Mehdi Rahimian
Department of Agricultural Economics and Rural Development, Lorestan University, Khorramabad 6815144316, Iran
*
Author to whom correspondence should be addressed.
Sustainability 2022, 14(2), 762; https://doi.org/10.3390/su14020762
Submission received: 7 November 2021 / Revised: 14 December 2021 / Accepted: 15 December 2021 / Published: 11 January 2022

Abstract

:
The agricultural sector in rural areas is seriously affected by climate change, affecting agricultural production and farming communities. This paper investigates rural households’ vulnerability to floods in the seven agricultural-based regions of Pol-e Dokhtar, south of Lorestan Province, Iran. The primary data for the vulnerability indicators were collected from 322 households. Three main components of vulnerability, including exposure, sensitivity, and adaptive capacity, were measured using the obtained data. The weighting of indicators was done by the MSF method and using MATLAB software. The results showed that the social and economic characteristics of households affect their vulnerability to floods. The Jayder, Mamolan, and Afrineh regions, which were more exposed to floods, had less capacity for adaptation. The results showed that the most vulnerable communities could be described by characteristics such as low levels of agricultural insurance, limited access to credit, low levels of income diversification, high levels of unemployment, low levels of social capital, higher dependency ratios, and poor infrastructure. This research showed that diversified livelihoods have a significant effect on reducing farmers’ sensitivity to floods. The study proposes policy implications to increase resilience and reduce farmers’ vulnerability to floods. The government and other development partners should prioritize the most vulnerable areas by improving their access to finance and providing the technical assistance required for increasing their coping capacity.

1. Introduction

Flooding is a natural phenomenon that can have the greatest impact on the human population of the world [1]. However, it carries a greater risk for property damage than it does a lethal risk for people living in flood-prone areas [2]. Flooding is a threat to developing countries; therefore, they need to plan risk-management and coping strategies to mitigate its effects. For this reason, different studies have been carried out to assess the impacts of floods and the vulnerability and adaptation measures in Iran [3,4,5]. However, most studies have addressed flood vulnerability’s environmental and biophysical dimensions, and more have targeted impacts and adaptation strategies in urban areas. Few studies have focused on the social dimensions of flood vulnerability and coping strategies in rural areas (households, rural communities). About 80% of extremely poor people live in rural communities. Rural poverty is different from poverty in urban areas and is more severe [6]. The incomes of these people rely more on on-farm activities, the sale of agricultural production (crop, livestock), or agricultural wage employment. Their dependence on agriculture makes the rural poor very vulnerable to climate change [7]. Thus, it is suggested that poor people are expected to suffer the most from natural disasters such as floods. They do not have enough income to deal with the impacts of floods, and it is often not possible for them to fully recover after a flood [8,9].
The Inter-Governmental Panel on Climate Change (IPCC) considers vulnerability as the extent to which the system is sensitive to the negative impacts of climate change, including climate variability and severe weather events [10]. For mapping farmers’ vulnerability to climate variability and change at the local level, we used the IPCCs’ definition. The regions’ vulnerability was a function of adaptive capacity, sensitivity, and exposure dimensions [11]. Exposure is recognized as an external dimension of the vulnerability of a system to climate change [12]. Sensitivity is defined as the degree to which a system is affected either positively or negatively by a climate-related driver [13]. Adaptive capacity, also defined as coping capacity, the capacity of response, or capacity of adaptation, is the capability of a system to adjust to exposure (including extreme weather and climate events), mitigate potential losses and exploit opportunities, or deal with the impacts. The IPCC states that a comprehensive and integrated assessment of the vulnerability of hazard-prone areas is crucial to developing resilience measures and building adaptive capacity [14]. Assessing community resilience is an essential first step for reducing disaster risk in a community and enhancing its resilience to natural and human-induced disasters [15]. Therefore, there is a need to determine the vulnerability degree of communities to climate change. Vulnerability assessment is a complicated approach since it is affected by various economic, social, cultural, institutional, and political factors at the local level [16]. In other terms, vulnerability is influenced by multiple factors, such as housing situations, infrastructure, government policies, economic plans, social inequities, etc. Therefore, flood vulnerability is different for communities in different contexts [17]. Since vulnerability is a multidimensional approach, developing countries are likely to be more vulnerable than other countries due to the weakness of economic, organizational, and institutional factors that limit their resilience and recovery strategies [2]. In developing countries, devastating flood disasters are associated with bad river-basin planning, defective land-use planning, dysfunctional institutions, a lack of integrated policies, weak governance, and the improper use of resources near the rivers by people [18].
Pol-e Dokhtar County is located in the south of Lorestan Province and is one of the flood-prone areas of Iran. In recent years, the frequent occurrence of droughts has forced officials to neglect a natural hazard, flooding. In April 2019, the Pol-e Dokhtar County experienced the worst floods in Lorestan in the last 100 years. The water level in Pol-e Dokhtar reached the roofs of houses. Extensive floods and landslides destroyed rural roads, and cut off traffic, telecommunications, and water in the region. Bridges, people’s homes, agricultural land, and infrastructure were destroyed by the flood. The height of mud in some areas of Pol-e Dokhtar was between 59 and 118 inches. In the agricultural sector, the infrastructure of the livestock, poultry, and aquaculture sectors was most damaged. According to the initial estimate, the amount of damages in Pol-e Dokhtar County in different parts was about USD 118,750,742 [19]. This incident shows that floods and river flooding are inevitable due to the seasonal floods in Lorestan Province, especially the Kashan River, which is known as the most flood-prone river. Pol-e Dokhtar in southwestern Iran has a relatively warm and semi-arid climate, identified by heavy rain. The average annual rainfall in the area is around 397.2 mm; thus, it is one of the peripheric regions in Lorestan Province. Pol-e Dokhtar township has a rural population higher than the national average (more than 50%). However, most villages in this region face various problems and challenges and are considered one of the most deprived areas of Lorestan province [20]. Therefore, the occurrence of a flood event can directly affect the livelihood of farmers in this area.
An increasing number of studies have assessed vulnerability to climate change, particularly flood vulnerability. Antwi et al. [21] used rural participatory research approaches to develop four vulnerability categories (socio-economic, ecological, engineering, and political). They selected flood vulnerability indicators based on specific local characteristics and interaction with community stakeholders, and specialized knowledge from a social and ecological perspective. Fernandez et al. [22] suggested the GIS-MCDA approach to floods’ social vulnerability assessment. This study provides an opportunity to better understand and improve the monitoring of social vulnerability over space, identifying ‘hot spots’ that require adaptation policies. Komi et al. [23] introduced a community-based disaster risk index model to identify the main factors contributing to rural communities’ flood risk in the Oti River Basin, Togo.
Chaliha et al. [24] used a composite vulnerability index to quantify farmers’ vulnerability in Assam to floods. They quantified the indicators based on data from household surveys and rural participatory assessments (PRAs) in rural areas and secondary data sources. Uwakwe et al. [25] suggested depth–damage and spatial multi-criteria evaluation (SMCE) methods to assess the vulnerability of rural household buildings and populations during the flood event at Dennery Village. Nasiri et al. [26] compared different approaches to vulnerability assessment and concluded that the indicator-based approach offers a more precise vision of overall flood vulnerability in each area than other approaches. Blistanova et al. [27] combined multi-criteria analyses (MCA) and geographical information systems (GIS) tools to assess the flood vulnerability of the Bodva river basin located in the eastern part of Slovakia. Flood vulnerability was assessed in four classes: acceptable, moderate, undesirable, and unacceptable. Pham et al. [28] used the household vulnerability index method and a qualitative data analysis to assess the vulnerability level of smallholder farmers to flash floods. The results showed that farmers’ livelihoods are the most vulnerable to flash floods. Mucherera and Mavhura [29] introduced an interpretive approach to knowledge generation about flood survivors’ perspectives on vulnerability and mitigation measures. The results showed that a shortage of land, flood-based farming practices, and poverty are the key drivers of the smallholder farmers’ vulnerability to floods. Mudavanhu et al. [30] used a composite index approach to assess the vulnerability of rural households to floods in Zimbabwe. The results showed that the vulnerability of households was the result of the intersection of poor socio-economic conditions and physical exposure to floods. High levels of unemployment, low levels of education, an over-dependence on rain-fed smallholder farming, and the use of poor materials to build houses were key factors in flood vulnerability. Sam et al. [31] combined the livelihood vulnerability index (LVI) with the socio-economic vulnerability index (SVI) to assess the vulnerability of rural households to floods in India. They concluded that socio-demographic characteristics such as low literacy rates, high dependency ratios, and weak housing structures increase the vulnerability of rural households. You and Zhang [32] suggested a catastrophe theory method to assess social vulnerability to floods in China.
While most of the previous studies have tried to develop an appropriate framework for vulnerability assessment at a national scale, in our present study, we tried to focus on local levels, where the actual dynamics of vulnerability to flooding occur. Moreover, to our knowledge, no study has endeavored to investigate the social dimension of flood vulnerability in rural households in Iran. Therefore, this paper assesses farmers’ vulnerability to floods in the Pol-e Dokhtar districts in the Lorestan province. The main objectives of the current study were to (i) develop a household vulnerability index (HVI) to assess household flood vulnerability and to classify households according to their level of vulnerability, and (ii) compare the level of vulnerability among seven agricultural-based regions of Pol-e Dokhtar. The use of the MSF method in weighting the indicators is the scientific contribution of this study. This method eliminates the shortcomings of previous weighting methods such as Delphi, AHP, and PCA. The matrix-based statistical framework (MSF) method can minimize some built-in flaws in the present study, compared to other weighting methods. The main advantage of this method is that it directly decides to select the eigenvector as relative weights that accord with the largest eigenvalue. In addition, the current study measures the levels of vulnerability with socio-economic indicators that are field-based and theory-driven, and shows the importance of local differences in government planning.
Therefore, we try to answer the following research questions in this study:
  • To what extent are rural households vulnerable to floods in the study area?
  • Which rural areas are more vulnerable to floods, based on three components of flood vulnerability (exposure, sensitivity, and adaptive capacity)?

2. Materials and Methods
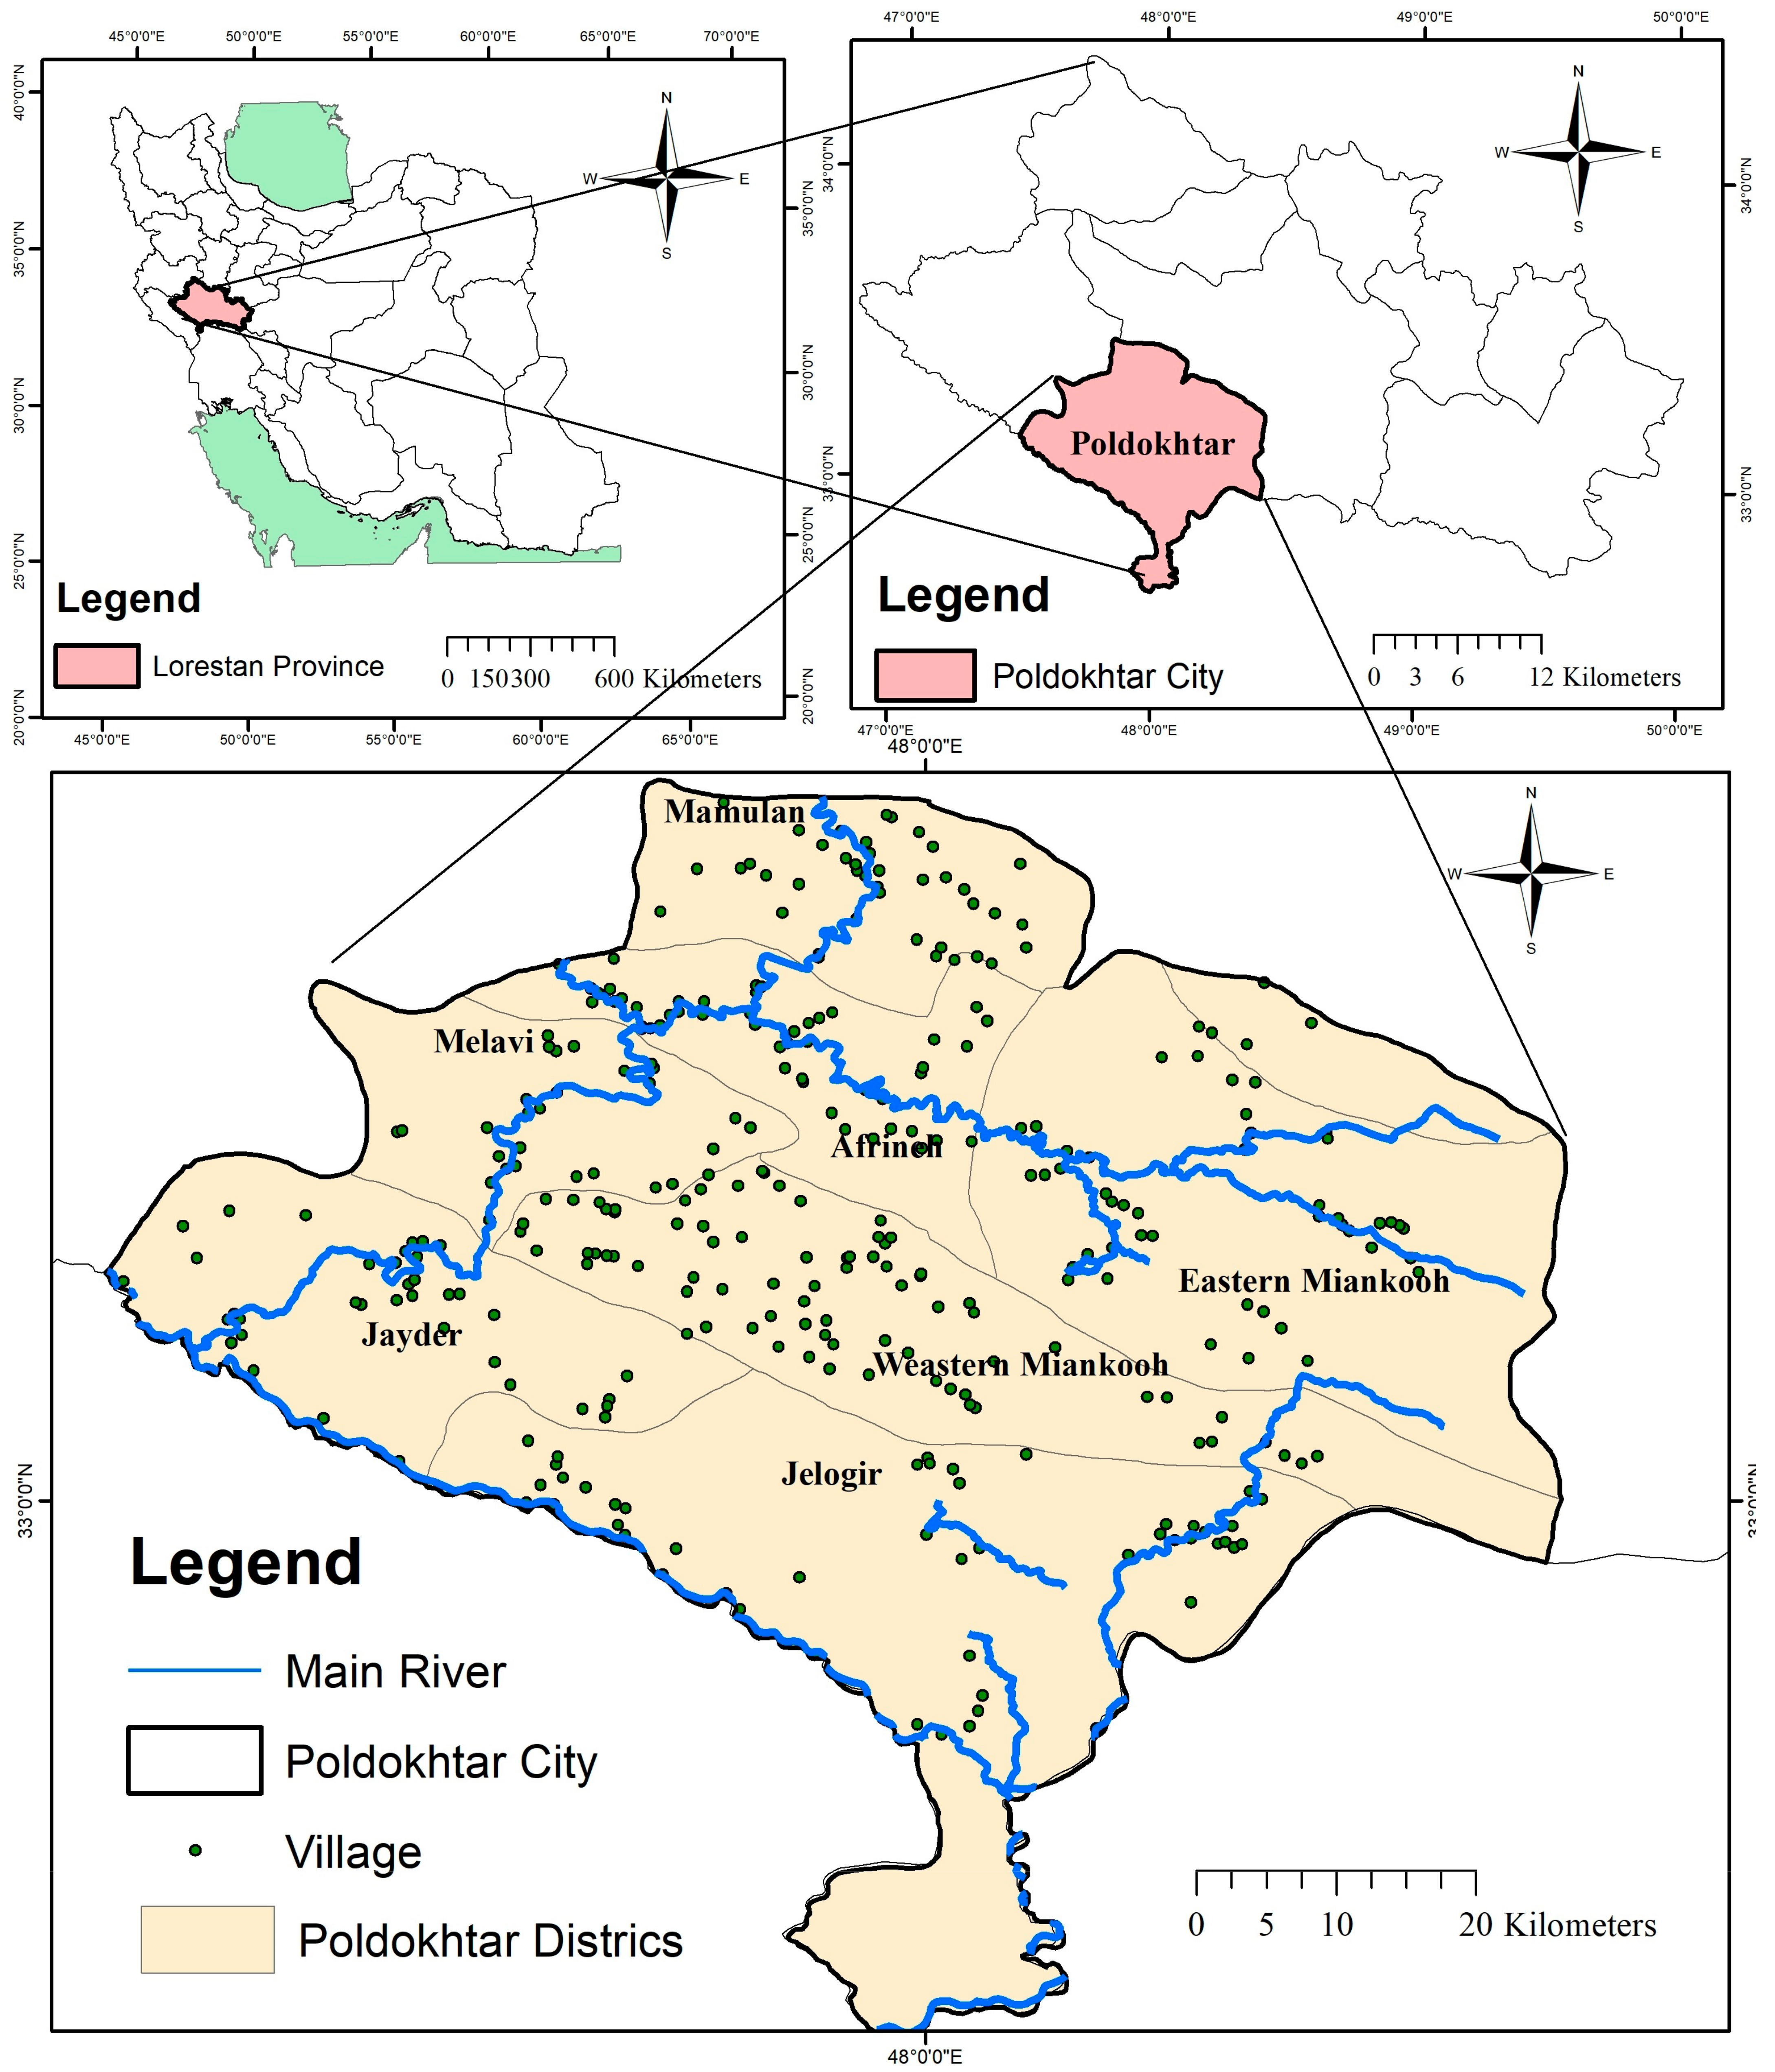
2.1. The Study Area

The study region, Pol-e Dokhtar, is located in the south of Lorestan Province, Iran. This region has a total population of 73,744, about 53.5% of whom live in rural areas. The district lies between longitudes 47°027′ W and 48°022′ W and latitudes 32°041’ N and 33°031´ N with an estimated area of about 3615 km2 (Figure 1). Due to being located in the outskirts of Lorestan province and near the Kashkan River, Pol-e Dokhtar is one of the most vulnerable regions to flooding. The Kashkan River basin is one of the critical sub-basins of the Karkheh catchment located in the middle part of the Zagros Mountains, with more than 9000 km2. With its entire catchment being located in Lorestan, the main branch of this river accounts for more than 30% of the province’s total area. The latest floods in the Kashkan River basin occurred in 2019. Heavy rains caused water levels to rise rapidly. In April 2019, the floods were exceptional in time and spatial distribution in the Kashkan basin. The Kashan River has experienced a water flow of over 5000 cubic meters per second at Pol-e Dokhtar Station. The climate of the district is warm and semi-arid. The mean annual rainfall of the region is between 450 and 650 mm, whereas the temperature ranges between 0 °C at night during the cold season and 48 °C during the day in the hot season. Pol-e Dokhtar County is divided into two administrative zones (Central and Mamolan) and seven districts, including Jaider, Jelogir, Melavi, Western Miankouh, Mamolan, Afrineh, and Eastern Miankouh. This county has 322 villages distributed in the seven districts mentioned above. Agriculture is the most common economic activity in this area, accounting for 80% of the jobs. Agriculture is small-scale, comprising crops (e.g., wheat, barley, maize, rice, beans, black fig, tomatoes, cucumbers and figs, and different vegetables), and animal husbandry (sheep, goats, cattle, and poultry).

2.2. Data Collection

We collected the data of households by a structured questionnaire. This questionnaire consisted of two parts: the first part gathered data about farmers’ personal and professional characteristics; the second part consisted of vulnerability indicators to calculate the levels of vulnerability indicators among farmers. We surveyed 322 households in the seven districts of Pol-e Dokhtar from March to July 2019. The heads of the households were selected as the main unit for collecting field data in this study. In this study, we used a two-stage stratified random sampling method. We stratified the population of households by district. Using proportionate sampling, we obtained a stratified random sample of 322 households.

2.3. Methods

In the present study, we used an index-based vulnerability assessment method [33]. This method is widely used since it allows for the incorporation of biophysical and socio-economic components of vulnerability, is relatively simple to conduct, and is easy to communicate to the public and to policymakers [34]. This method involves three sequential steps of vulnerability index construction: the selection of indicators, the normalization of indicators to a standard scale, and aggregation to a final value. Based on the available literature, indicators were selected based on a focus group discussion with the experts to measure exposure, sensitivity, and adaptive capacity among farmers in flood-prone areas.
After selecting the indicators and considering the environmental and socio-economic conditions of the Pol-e Dokhtar County and farmers’ households, we applied some adjustments. The indicators and sub-indicators are listed in Table 1.
In the next step, since each of the sub-components of vulnerability was calculated in various units, they were standardized using Equation (1) as an index.
I n d e x S d i = S d S min S max S min
where index Sdi = the index value of each sub-component, Sd = the real value of the of each sub-component of vulnerability, and Smax and Smin = the maximum and minimum values of each sub-component for major components of vulnerability, respectively. For variables that measure recurrences, such as the percentage of farmland covered by crop insurance, we set the minimum value to 0 and the maximum value to 100 percent. These minimum and maximum values were used to transform this indicator into a standardized value between 0 and 1 so that it could be integrated into the components of the VI.
Due to the relative importance of the several components of vulnerability, we must weigh the indicators appropriately. Weighting techniques such as Delphi and AHP have been extensively utilized and criticized because they could be interpreted differently in terms of the experience and knowledge of the participating experts [35]. This is also true for expert opinion-based weighting; weights may not be transferable from one region to another. Many weighting methods face bias issues, except for principal component analysis (PCA). Nevertheless, PCA has some shortcomings that can be overcome by the matrix-based statistical framework (MSF) method. Principal components are selected based on explaining the maximum variance present, which mathematically reduces the most important indicators in general. The relative weights of indicators produced by the PCA technique are unable to give importance to the impact of an individual indicator. On the contrary, the MSF method is suitable for any area and scientific studies to give relative weights to any group of indicators.
Therefore, we used the MSF method to weigh the indicators in the present study. This new method usefully achieves a simplified and interactive way of weighting compound hazards, vulnerability, and risk assessments for any region. The MSF was created based on the eigenvector according to the maximum eigenvalue from the correlation matrix, made from Pearson’s correlation coefficients. We constructed Pearson’s correlation coefficients from the summation of the squared matrix, which is the correlation between each of the variables. We used MATLAB software to analyze eigenvectors and eigenvalues. Therefore, the indicators’ weight was computed using the MSF. Accordingly, we determined the largest eigenvalue of indexes 2.26, 1.80, and 1.45 for exposure, sensitivity, and adaptive capacity indicators, respectively. Lastly, we used a comparative approach to calculate the relative weight of each indicator.
In the first step, MATLAB script was used to calculate Pearson’s correlation. Then a correlation matrix was developed that helped to find the matrix of the relative weights of the indicators. The intensity of the interrelationships between the indices affected the dependent relative weight matrix.
Using Equation (2), the correlation matrix was established, which is described as:
= 1 p x y p x z p y x 1 p y z p z x p z y 1
Using the above relation, a set of eigenvalues was formed, and with the largest eigenvalue, a set of eigenvectors was generated, which reflected the desired weights of indicators through the following sequences of Equations (3) to (5). This set of vectors gave the relative weights among the indicators [36].
To find the eigenvector, the following equations were applied, which are represented by:
A × W = λ m a x × W ;
where A is the correlation matrix defined in relation (3), representing the relation between the indicators, and w is the weight vector, which is mainly the eigenvector for the largest eigenvalue λmax.
To solve Equation (3), λ is needed to find the solution of Det (A − λI) = 0. Thus,
1 x y x 1 z y z 1 λ × 1 0 0 0 1 0 0 0 1 = 0
After solving the above Equation (4), a set of eigenvalues is formed. The desired eigenvector corresponding to the largest eigenvalue indicates the relative weights, and it is expressed as:
λ 1 λ 2 λ 3   L a r g e s t   e i g e n   v a l u e   w 1 w 2 w 3
A MATLAB script is used to analyze the eigenvalues associated with the eigenvectors.
To create the vulnerability index for each district, we summed up the index values of the sub-components for each vulnerability factor, and we determined the average. This was done using Equation (6):
M d = i = 1 n i n d e x S d i n
Here, Md is one of the major components for district d, the Sdi represents the sub-components, indexed by i, that make up the major component, and n is the number of sub-components in each major component. Once values for each of the major vulnerability components for a district were calculated.
M E c o n o m i c = i = 1 3 Number   of   Insured   Livestock + Crop   insurance + Access   to   credit 3
Then, using Equation (7), we calculated the vulnerability contributing factor CFi (exposure, sensitivity, or adaptive capacity) for the household i:
C F d = i = 1 10 W m i M d i i = 1 10 W m i
Here, CFd is one of the factors contributing to VI-IPCC (exposure, sensitivity, and adaptive capacity) for district d, Wmi is the weight of each major component, and Mdi are the major components for district d indexed by i.
Equation (7) can be expressed in expanded form as:
S e n s i t i v i t y = W H S H S + W L S L S + W I S I S + W F S F S W H S + W L S + W I S + W F S  
Sub-components of the sensitivity: HS = Human sensitivity, LS = Livelihood sensitivity, Is = Infrastructure sensitivity, FS= Financial sensitivity.
After calculating the contributing factors, we measured the vulnerability using the following formula [37]:
V I = A I E I + S I
where VI = vulnerability index, EI = exposure index, SI = sensitivity index.
After measuring VI, we calculated the distance between the lowest and highest scores and categorized the households into three groups in terms of the level of the calculated VI: low, moderate, and high vulnerability (Table 2).

3. Results and Discussion

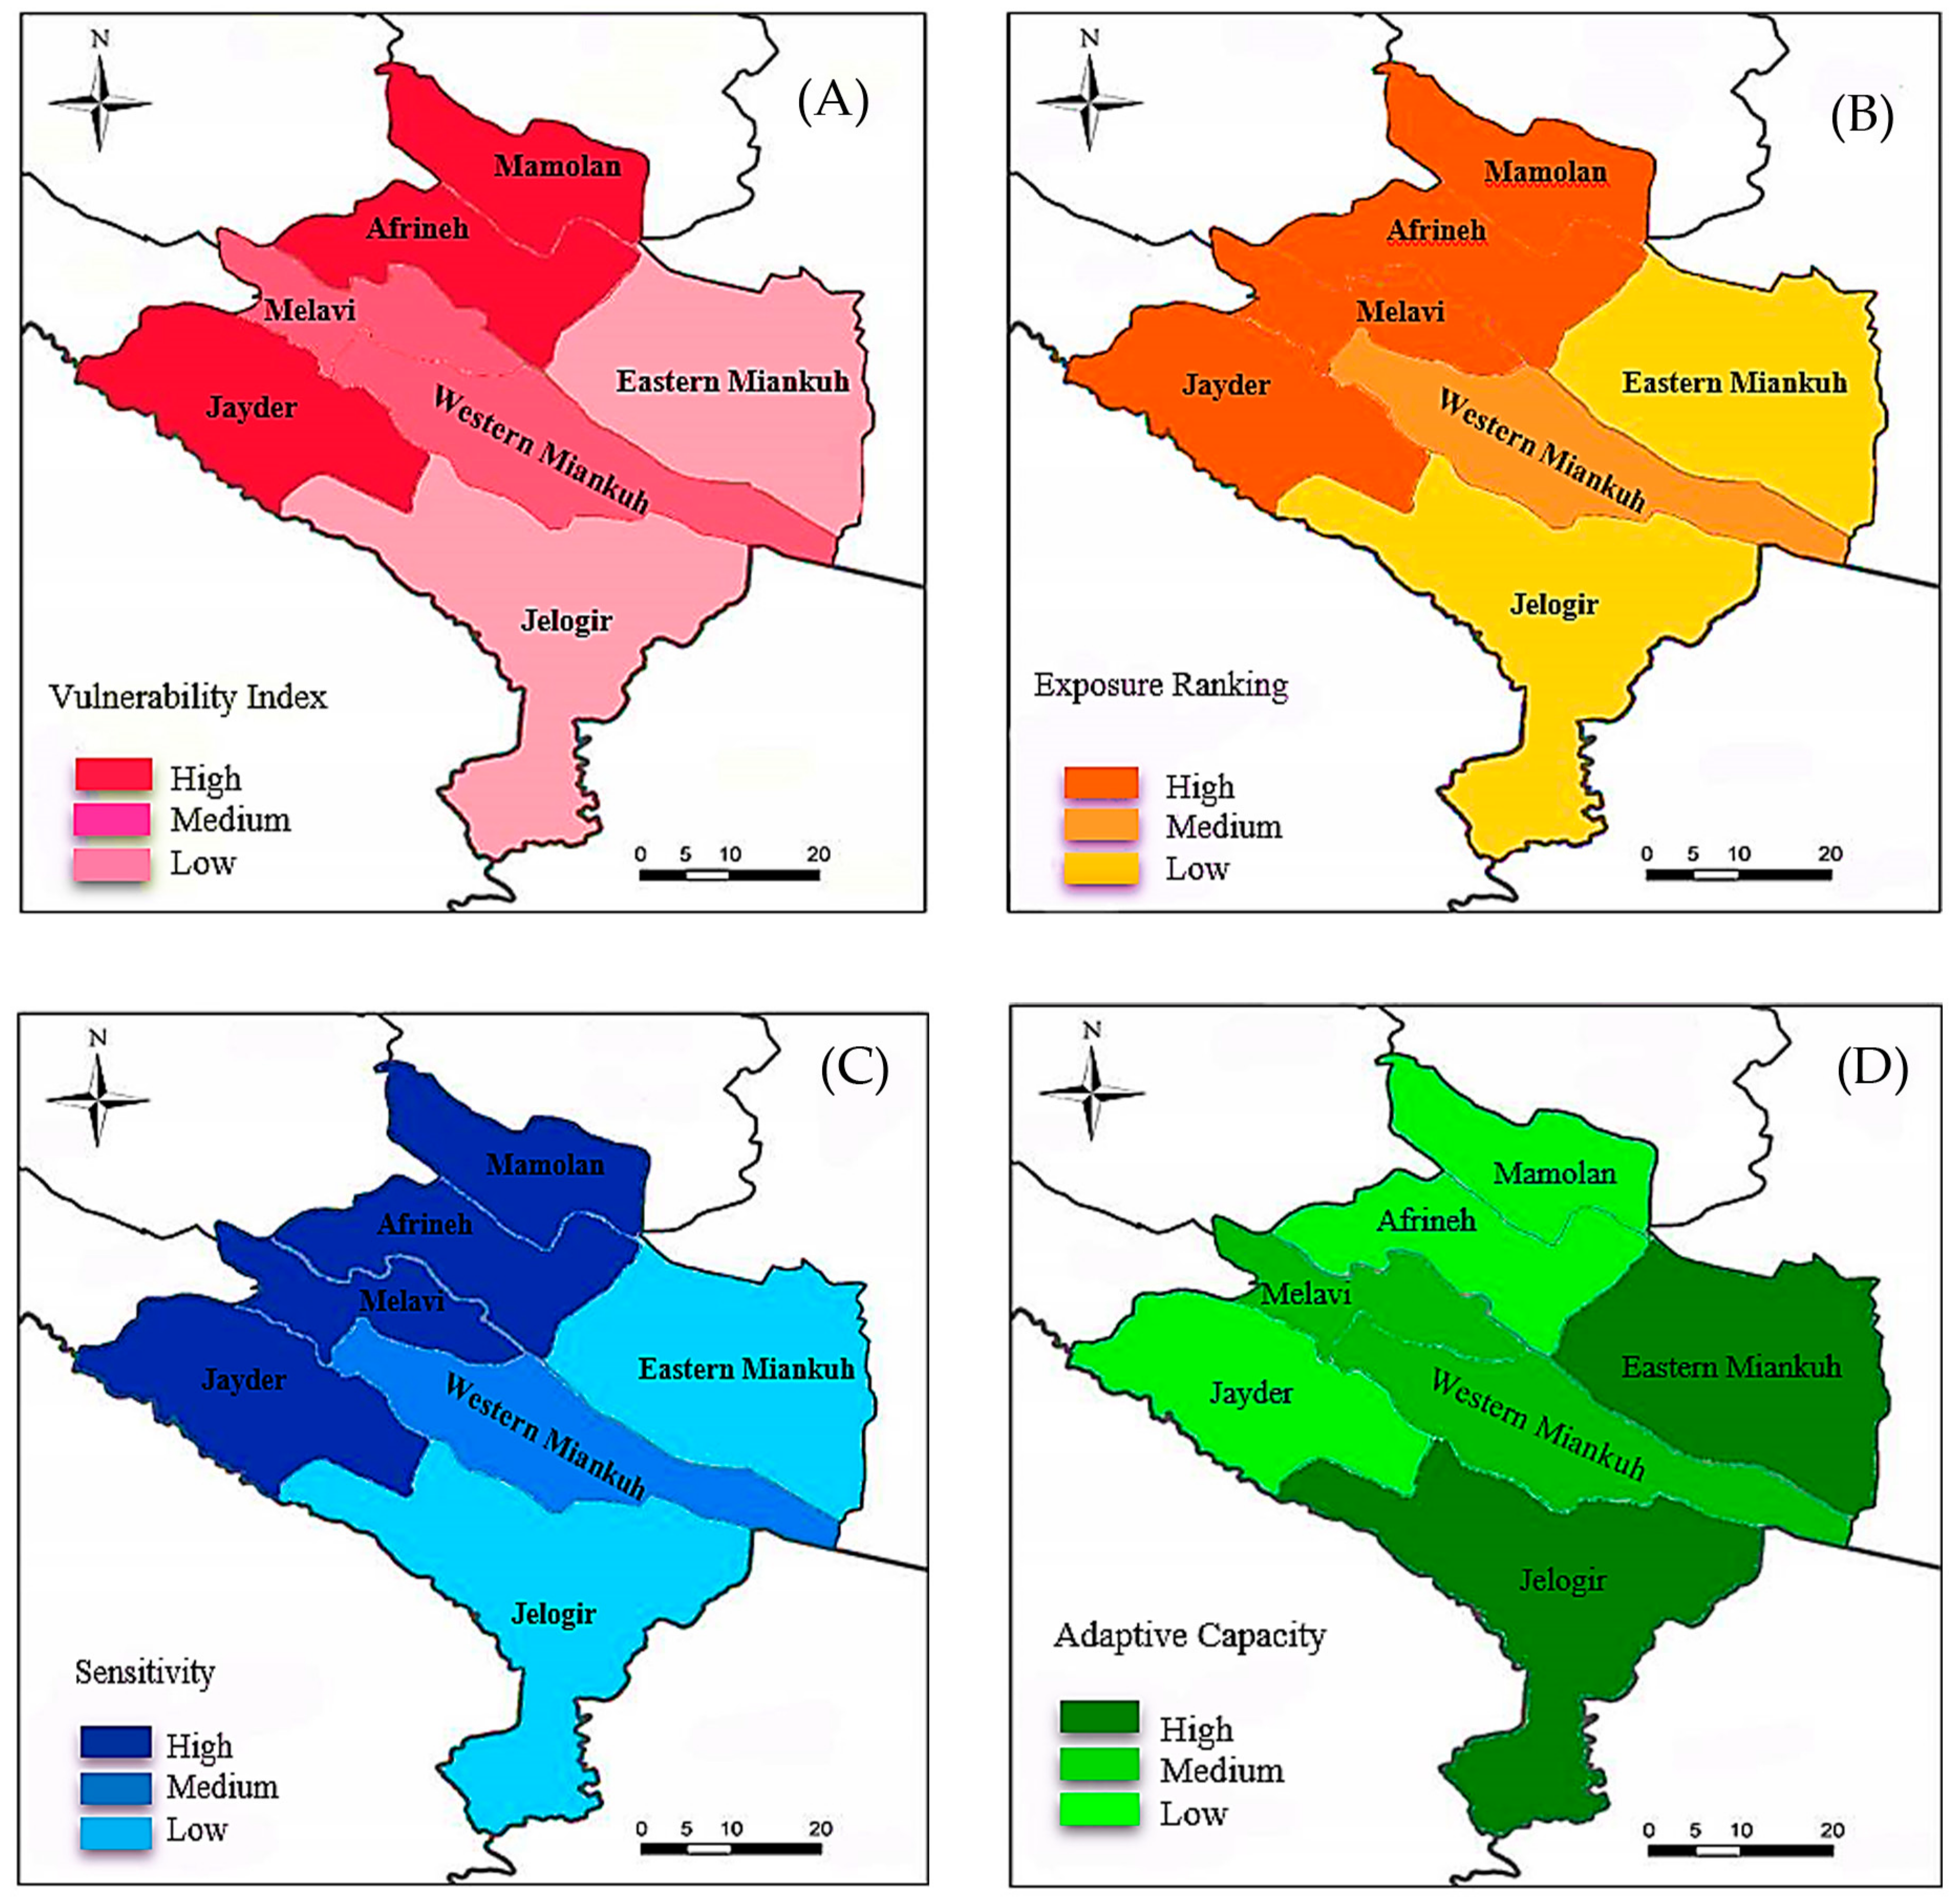
3.1. The Vulnerability of Rural Households

The households were classified into three categories, “high”, “medium”, and “low”, using the vulnerability index. (Table 3). In other words, highly vulnerable households are more exposed to floods, are sensitive, and have a low adaptive capacity. Households with less vulnerability can deal with the situation without any assistance from external sources. Low vulnerability households include those in need of immediate and temporary external assistance for recovery after a severe event. The results indicated that about 26% of households were slightly vulnerable to floods. Additionally, 32% of households had a low vulnerability, and 42% were specified as highly vulnerable to floods (Table 3). This difference in vulnerability classes can be due to variables such as access to credit, distance to the river, quality of housing structure, level of income diversification, dependency ratios, unemployment rates, participation in social networks, level of education, and participation in training courses on adaptation to climate change, which was also found in other studies [38,39,40,41]. Therefore, it is suggested that, to reduce the vulnerability of households and increase the adaptation capacity, the conditions of access and the availability of resources should be improved for all households in the study area, and infrastructure restrictions should be removed.
We obtained a vulnerability score for each of the seven districts (Table 4). The Jayder district showed the highest vulnerability to floods. It had a total score of −1.33, followed by Afrineh (−1.24), Mamolan (−1.19), Western Miankuh (−1.09), Melavi (−0.99), Jelogir (−0.41), and Eastern Miankuh (−0.28), as shown in Figure 2. Highly vulnerable regions, namely, Jayder, Mamolan, and Afrineh, are extremely close to the Kashkan River, and they are prone to the cycle of repeated flooding. These regions have a large amount of heavy and continuous rainfall, weak infrastructure, and a high rate of farmers who depend on river-front agriculture for their livelihood. Floods have caused considerable damage to properties and growing crops in these regions. Houses are badly damaged, and many fields of grain and most gardens are lost. Moreover, we can categorize these areas by weak houses, limited facilities, insufficient sources of income, unemployment, low social capital, and a high proportion of dependency ratios. Therefore, deficient infrastructure and human capacity reduce the ability of households to react to the negative consequences of floods. This finding is in line with the results of Thathsarani and Gunaratne [42] and Williams et al. [43], who concluded that poor people cannot afford all essentials and cannot withstand severe disasters. At the household level, limited financial resources negatively affect the capability of households to recover from overwhelming events in damaged regions. Generally, our findings indicated that vulnerability is higher in the areas with a lower level of adaptive capacity, a high level of exposure, and high sensitivity. Figure 2 shows the total vulnerability score and indicates differences among the seven districts.

3.2. Exposure Assessment

Among the seven districts, the average maximum value of total exposure was in the Jayder area (0.87), and the minimum was in the Eastern Miankuh district (0.50) (Table 4). By looking at the various sub-components for exposure, it can be seen that the longest time of flooding experienced in the last ten years has been in the Jayder region (0.68), and lowest in the Jelogir region (0.35). The longer the flood, the more riverside lands will be flooded, and the wider the range of damage. Increasing the duration of a flood means increasing the length of time that a farmer’s property and assets are at risk. Therefore, it seems that the amount of damage to rural household assets, which includes land, gardens, livestock, agricultural implements, etc., in the Jayder area is higher than in other areas. In the index for the average number of flood events experienced in the last ten years, Jayder had the highest index value, and Eastern Miankuh had the lowest value (see Figure 2). However, the seven studied districts in Pol-e Dokhtar did not indicate a significant difference concerning exposure. The results showed that the smallholder farmers of the Jayder, Mamolan, and Afrineh districts are more exposed to floods and variations in precipitation. These districts are located alongside the Kashkan River, and they are exposed to a higher incidence of flooding due to continuous heavy rainfall than Jelogir and Eastern Miankuh, which are further away from the Kashkan River. Few and Tran [33] confirmed that physical location is one major factor distributing risk effects in line with this finding. In rural areas, behavioral mistakes and a lack of awareness of dangers such as building houses alongside rivers and the encroachment of the river increase the risk of flood vulnerability [44]. Increasing riverbed encroachment in rural areas has become a major crisis. The protection of rivers in Iran is associated with various challenges. Despite weaknesses in water policy and legislation, the legislature’s island view of managing water resources, especially rivers, has led not only numerous institutions to play a role in protecting or licensing its exploitation, but this process has also contributed to inconsistencies and wrong decisions. In fact, if we see the construction of residential houses in the riverbeds, seizure and destruction, sand harvesting, violation of the quality of the river, and its change of use, the result goes back to the lack of integrated management of water resources. Management in which the lack of a basin view of water resources is evident. The establishment of an authoritarian management system and the absolute focus of problem solving in the center may have led to the neglect of the role of the catchment basin and local communities in this management. Therefore, the transition from the existing heterogeneous process requires reforming approaches and attitudes in policy making, law reform, and the establishment of catchment management in coordination with other stakeholders and, ultimately, the imposition of deterrent penalties in connection with river-basin crimes. Moreover, Jayder and Afrineh are located in the southern part of Pol-e Dokhtar, with wheat and barley farms in low-lying areas. Low-lying areas have poor drainage, so water from continuous rainfall floods their farms and damages their crops. Reports in these areas also indicate that the floods have severely damaged agricultural lands, orchards, farmland roads, pumping stations, and farmers’ pump motors. Therefore, taking measures such as creating small drainages in each plot of land, subsoiling or sward lifting, and increasing the height of hand pumps are among the measures that farmers can take as part of their flood preparedness.

3.3. Sensitivity Assessment

Based on the sensitivity index, the Jayder region indicated the highest total sensitivity (0.77), followed by Afrineh (0.75), Mamolan (0.73), Western Miankuh (0/68), Melavi (0.61), Jelogir (0.48), and Eastern Miankuh (0/41) (Table 4). The majority of households in the Jayder, Afrineh, and Mamolan districts were highly sensitive to flood impacts since floods have destroyed their farms, fig gardens, and houses. The level of income diversification is low in the Jayder, Mamolan, and Afrineh districts, compared to other districts in the study area. The households in these areas are highly dependent on agriculture as their major source of income. This dependence can have severe consequences for the villagers and put them in a vulnerable position. As Davies et al. (2009) report, rural people who depend on agriculture for their livelihood in times of stress and shock (e.g., floods and droughts) are more affected.
In contrast, the households in the Jelogir and Eastern Miankuh districts are engaged in other income-generating production activities, including livestock and poultry raising, government jobs, small business, and self-employment. These farmers are less vulnerable to the overall effects of climate change because they have more diverse resources to invest in coping strategies. Farmers who have diversity in crops and sources of income can create a low-risk subsistence basket and recover more easily and quickly in the face of climate change. An income resource diversification provides insurance for farmers at risk in the face of shock, while people who trust a single source of income are less able to deal with disasters (Ellis and Allison, 2004; Ellis and Freeman, 2004; Yazdanpanah et al., 2017; Paavola, 2008). [45,46,47,48]. The results showed that Jayder and Mamolan have more dependent members under 15 and over 65 years. Higher dependency ratios imply fewer people who can actively farm and engage in other livelihood activities than areas with lower dependency ratios. Households with a higher dependency ratio will have a greater burden on income members, resulting in reduced adaptation capacity (pya) [49].
Overall, the sensitivity analysis results showed that Jayder, Mamolan, and Afrineh are the most sensitive areas. This is, basically, due to the relatively high unemployment rates, the enormous proportion of farmers with small landholdings, the greatest percentage of households with insecure houses, higher dependency ratios, and low income diversification. In these areas, the unemployment rate is high due to the strong reliance on agriculture and its incomes and the lack of employment and income sources other than agriculture. The agricultural sector is not able to increase income much due to the limited and non-increasing amount of land. As reported by Corbov et al. [50], high unemployment rates contributed to an increased sensitivity to climate change. The unemployed are a group with special needs that are more dependent on other family members and government assistance. They may have less financial capital, and their houses may not be of sufficient quality and may not be protected by insurance [51,52]. Therefore, the search for other sources of income, given the potential of these areas, to diversify the rural economy and increase employment opportunities, is necessary.
Agriculture in these areas is characterized by the presence of a large number of small and marginal farmers with small farms. This reflects the fact that small-scale farmers suffer more damage than large-scale farmers, due to a more limited access to resources, less financial and information capacities, and the inability to cope with climate risks such as floods. Additionally, previous studies have shown that climate change negatively affects the well-being of most rural smallholder farmers. These effects have posed a major threat to the food security and livelihoods of most farmers in developing countries because most rural smallholder farmers depend on natural climatic sensitive resources for their livelihood [53,54,55,56]. Therefore, increasing efforts to help smallholder farmers cope with existing changes and adapt to future climatic conditions by agricultural officials and planners should be a priority.

3.4. Adaptive Capacity Assessment

The analysis of the total adaptive capacity showed a substantial variation among the seven rural areas. Jelogir (0.63) and Eastern Miankuh (0.61) have an adequate adaptive capacity due to strong social networks, relatively good infrastructure networks, access to credit, short distances to urban areas, higher education levels, and access to institutions (Table 4). Households who participated in social networks and group activities were more resilient to climate change-induced shocks because they had access to the critical resources (material and non-material) that are essential for diversification through their networks. Results from previous studies show that households rarely make adjustment decisions alone. Instead, adaptation decisions are often based on interactions between individuals and their collective activities, mediated through kinship, friendship, informal institutions, and formal government institutions [57]. Thus, social networks play a key role in households’ adaptive capacity and resilience to climate change [58,59].
Access to credit increases the likelihood of household adaptation and the better implementation of adaptive strategies to floods. It also helps reduce liquidity constraints, off-sets household expenditures, and facilitates investment in adaptation strategies. The study results showed that households with access to credit have a good resilience to climate change, compared to households without access [60,61,62]. Therefore, it is recommended that the government formulate an agricultural credit policy that addresses the problems of smallholder farmers, especially in areas that are vulnerable to climate change. The government can focus on financial support policies to help smallholder farmers break out of vicious cycles of economic deprivation to increase their adaptation capacity.
According to the results, education plays an important role in the adaptive capacity of households to floods, which was also found in other studies [63]. Increasing the level of education of household members can increase their ability to approach, interpret, and use adaptation information [64]. Higher-educated households are more likely to diversify their livelihoods to adapt to climate change and engage in non-farm activities (such as handicrafts, tourism, transport, agro-processing). Therefore, improving access to formal education (better quality) is a way to increase adaptation capacity, as it improves households’ ability to cope with disasters.
In addition, the results showed that the Jayder (0.31), Afrineh (0.35) and Mamoulan (0.39) areas have the lowest adaptive capacity and are not able to adequately deal with the potential effects of climate change and floods. These areas have relatively limited access to critical social and economic factors, such as an easy access to credit, access to new agricultural technologies and institutions, infrastructural assistance (such as irrigation and road networks) or services (micro-finance, veterinary), and human resources. The results showed that Jayder and Mamolan have weak social networks. Households in these areas have low participation in social organizations that could help to improve their living conditions and offer helpful information related to floods. Farmers’ involvement in these organizations also provides an opportunity to have more intimate social relationships with other individuals and communities to seek help when faced with problems [65,66].
These households have not received any training on flood-control measures, while educating farmers about flood control increases the likelihood of adopting new farming methods to reduce flood effects and improve resilience [67]. Flood-management training enables farmers to take preventive measures during floods. In addition, vocational training equips farmers with skills to engage in other livelihood activities for economic gains, contributing to their adaptive capacity. Most households in these regions had devices to access flood-related information, but, as reported, they did not take the warning seriously. They confirmed that the local authorities issued the early warning, but they did not believe it because they believed the rain would stop in a few days. In other words, households were aware of their vulnerability to floods, but nobody imagined the extent of this particular event.

3.5. The Limitations

In this study, there are several limitations that need to be considered in future studies. The first limitation is the subjectivity in the selection of sub-indicators, including the index variables. To help reduce the subjectivity in selecting the indicators, they have been selected based on clear, relevant, and meaningful criteria. Secondly, assessing flood vulnerability relies on suitable indicators and the availability of needed data at different scales. Since there is no unified framework for quantifying the vulnerability, this study provided the most inclusive number of indicators compared to other assessments. It can still be improved by gathering or rebuilding more socio-economic data from different sources at more than once, which is a problem, especially in Iran. Thirdly, the selection of weighting methods has been crucial in the vulnerability assessment of climate change. The weighting techniques such as AHP, Delphi, and PCA have been broadly used and criticized and have some shortcomings. Hence, the MSF method can minimize some built-in flaws in the present study, compared to other weighting methods. The main advantage of this method is that it directly decides to select the eigenvector as relative weights that accord with the largest eigenvalue [36].
Finally, while most previous studies have tried to develop an appropriate framework for vulnerability assessment at a national scale, in our present study, we tried to focus on local levels, where the actual dynamics of vulnerability to flooding occur. Since vulnerability varies from one place to another across a country, decision makers need to implement the vulnerability assessment locally. Thus, further studies need to be carried out to develop the analytical framework for assessing the relative vulnerability on a local scale.

4. Conclusions

This study investigated farmers’ vulnerability to flooding at the local level. The results indicated that rural households living in the Jayder and Mamolan areas are the most vulnerable to floods. In contrast, Eastern Miankuh and Jelogir had the lowest vulnerability to floods. The high vulnerability of the Jayder, Mamolan, and Afrineh districts to floods is not only because of high flood exposure; it is also due to a high sensitivity and an insufficient adaptive capacity. Social and economic factors, such as higher dependency ratios, high unemployment rates, poor infrastructure, climate-dependent livelihoods, low levels of income diversification, and insufficient access to information about climate change, contributed to high levels of vulnerability in the Jayder and Mamolan regions. It is also evident that poverty and residing in flood-prone areas are the main underlying causes of vulnerability for highly vulnerable communities. The study suggests implications to reduce vulnerability to floods. These implications include livelihood diversification of the non-farm sector, improving access to financial resources, strengthening existing early-warning systems, encouraging the building of durable houses, making farmers aware of the flood risks, preventing the change of use of riverside lands, and constructing human settlements at a suitable distance from floodplains. The implementation of these suggestions can increase the resilience of communities to floods. The results of this study showed the importance of vulnerability assessments at the local level. It also illustrated the necessity for local area-specific policies to mitigate vulnerability and improve the adaptive capacity of rural areas. However, all technical and financial planning in the field of flood management is based on national or regional levels, such local differences are not taken into account in government planning, and the government has never considered the micro-levels, such as vulnerable families or groups as a unit of analysis in flood management plans. This has dramatically reduced the effectiveness of these programs. Therefore, the main implication of this study is the need for the governmental organizations of the Pol-e Dokhtar County to undertake measures according to the local conditions to reduce the farmers’ vulnerability to flooding.

Author Contributions

Conceptualization, R.G.M. and S.A.; methodology, R.G.M. and S.A; software, M.R.; validation, S.G. and M.R. formal analysis, R.G.M.; investigation, S.G.; resources, M.R.; data curation, S.A.; writing—original draft preparation, R.G.M.; writing—review and editing, R.G.M., S.G. and M.R. All authors have read and agreed to the published version of the manuscript.

Funding

This research did not receive any specific grant from funding agencies in the public, commercial, or not-for-profit sectors.

Institutional Review Board Statement

Ethical review and approval were waived for this study. Although the study involved humans, it does not fall within the scope of medicinal research requiring an ethical statement as outlined in the Declaration of Helsinki guidelines.

Informed Consent Statement

Informed consent was obtained from all subjects involved in the study.

Data Availability Statement

This study is based on primary data, which are available upon request in an anonymized form from the corresponding author. The data are not publicly available due to privacy considerations.

Acknowledgments

We gratefully acknowledge the financial support provided by the Department of Agricultural Economics and Rural Development, Faculty of Agriculture, Lorestan University, Khorramabad, Iran. We also wish to thank the anonymous respondents for their contributions to the online questionnaire.

Conflicts of Interest

The authors declare no conflict of interest.

References

  1. Jha, A.K.; Bloch, R.; Lamond, J. Cities and Flooding: A Guide to Integrated Urban Flood Risk Management for the 21st Century; The World Bank: Washington, DC, USA, 2012; ISBN 0821388665. [Google Scholar]
  2. Kovacs, Y.; Doussin, N.; Gaussens, M.; Pacoud, C.L.; Afd, O.G. Flood Risk and Cities in Developing Countries; French Development Agency: Paris, France, 2017. [Google Scholar]
  3. Hosseini, S.M.; Jafar, B.M.; Geravand, F. Modeling of Hydraulic Behavior of Kashkan River and Determination of Floodplain Limits Using HEC-Geo-RAS. Environ. Manag. Hazards 2015, 2, 355–369. [Google Scholar]
  4. Naddafy, A.L.I.; Hosseini, S.M. A New Approach for Unit Flood Response Method for Spatial Prioritization of Flood Control Activities. J. Ferdowsi Civ. Eng. 2016, 27, 51–66. [Google Scholar]
  5. Sharifi, P.M.; Parnoon, F. Article Evaluation and spatial analysis of Floods in a river using Fuzzy Logic in geographic information system environment (Case Study: Qarasou River). J. Nat. Environ. Hazards 2018, 7, 17–30. [Google Scholar]
  6. Kyzyma, I. Rural-urban disparity in poverty persistence. IRP Focus 2018, 34, 13–19. [Google Scholar]
  7. World Health Organization. The State of Food Security and Nutrition in the World 2018: Building Climate Resilience for Food Security and Nutrition; Food and Agriculture Organization: Rome, Italy, 2018; ISBN 9251305714. [Google Scholar]
  8. Fothergill, A.; Peek, L.A. Poverty and disasters in the United States: A review of recent sociological findings. Nat. Hazards 2004, 32, 89–110. [Google Scholar] [CrossRef]
  9. Hallegatte, S.; Vogt-Schilb, A.; Bangalore, M.; Rozenberg, J. Unbreakable: Building the Resilience of the Poor in the Face of Natural Disasters; Climate Change and Development; World Bank: Washington, DC, USA, 2017. [Google Scholar]
  10. Parry, M.; Parry, M.L.; Canziani, O.; Palutikof, J.; Van der Linden, P.; Hanson, C. Climate Change 2007-Impacts, Adaptation and Vulnerability: Working Group II Contribution to the Fourth Assessment Report of the IPCC; Cambridge University Press: Cambridge, UK, 2007; Volume 4, ISBN 0521880106. [Google Scholar]
  11. Change, I.C. Climate change impacts, adaptation and vulnerability. Sci. Total Environ. 2007, 326, 95–112. [Google Scholar]
  12. Füssel, H.-M. Vulnerability: A generally applicable conceptual framework for climate change research. Glob. Environ. Chang. 2007, 17, 155–167. [Google Scholar] [CrossRef]
  13. Sharma, J.; Ravindranath, N.H. Applying IPCC 2014 framework for hazard-specific vulnerability assessment under climate change. Environ. Res. Commun. 2019, 1, 51004. [Google Scholar] [CrossRef]
  14. McCarthy, J.J.; Canziani, O.F.; Leary, N.A.; Dokken, D.J.; White, K.S. Climate Change 2001: Impacts, Adaptation, and Vulnerability: Contribution of Working Group II to the Third Assessment Report of the Intergovernmental Panel on Climate Change; Cambridge University Press: Cambridge, UK, 2001; Volume 2, ISBN 0521015006. [Google Scholar]
  15. Burton, C.G. A validation of metrics for community resilience to natural hazards and disasters using the recovery from Hurricane Katrina as a case study. Ann. Assoc. Am. Geogr. 2015, 105, 67–86. [Google Scholar] [CrossRef]
  16. Gao, J.; Nickum, J.E.; Pan, Y. An assessment of flood hazard vulnerability in the Dongting Lake Region of China. Lakes Reserv. Res. Manag. 2007, 12, 27–34. [Google Scholar] [CrossRef]
  17. Pandey, A.C.; Singh, S.K.; Nathawat, M.S. Waterlogging and flood hazards vulnerability and risk assessment in Indo Gangetic plain. Nat. Hazards 2010, 55, 273–289. [Google Scholar] [CrossRef]
  18. Ali, A. Indus Basin Floods: Mechanisms, Impacts, and Management; Asian Development Bank: Mandaluyong, Philippines, 2013. [Google Scholar]
  19. Hamidi Farahani, R.; Niknam Sarabi, H.; Farsi, Z. Lessons Learned from the Lorestan Flood Crisis: Relief Experience in Pol-e-Dokhtar Flood. Mil. Caring Sci. J. 2019, 6, 169–173. [Google Scholar]
  20. Bazrafshan, J. Spatial Analysis of Regional Indicators of Rural deprivation (Case study: Poledokhtar Township). J. Spat. Plan. 2018, 22, 112–143. [Google Scholar]
  21. Antwi, E.K.; Boakye-Danquah, J.; Owusu, A.B.; Loh, S.K.; Mensah, R.; Boafo, Y.A.; Apronti, P.T. Community vulnerability assessment index for flood prone savannah agro-ecological zone: A case study of Wa West District, Ghana. Weather Clim. Extrem. 2015, 10, 56–69. [Google Scholar] [CrossRef] [Green Version]
  22. Fernandez, P.; Mourato, S.; Moreira, M. Social vulnerability assessment of flood risk using GIS-based multicriteria decision analysis. A case study of Vila Nova de Gaia (Portugal). Geomatics Nat. Hazards Risk 2016, 7, 1367–1389. [Google Scholar] [CrossRef] [Green Version]
  23. Komi, K.; Amisigo, B.A.; Diekkrüger, B. Integrated flood risk assessment of rural communities in the Oti River Basin, West Africa. Hydrology 2016, 3, 42. [Google Scholar] [CrossRef] [Green Version]
  24. Chaliha, S.; Sengupta, A.; Sharma, N.; Ravindranath, N.H. Climate variability and farmer’s vulnerability in a flood—Prone district of Assam. Int. J. Clim. Chang. Strateg. Manag. 2012, 4, 179–200. [Google Scholar] [CrossRef]
  25. Uwakwe, A.C. Assesment of Physical Vulnerability to Flood in Saint Lucia: Case Studies: Castries Old Central Business District and Dennery Village; University of Twente Faculty of Geo-Information and Earth Observation (ITC): Enskeard, The Netherlands, 2015. [Google Scholar]
  26. Nasiri, H.; Yusof, M.J.M.; Ali, T.A.M. An overview to flood vulnerability assessment methods. Sustain. Water Resour. Manag. 2016, 2, 331–336. [Google Scholar] [CrossRef] [Green Version]
  27. Blistanova, M.; Zeleňáková, M.; Blistan, P.; Ferencz, V. Assessment of flood vulnerability in Bodva river basin, Slovakia. Acta Montan. Slovaca 2016, 21, 19–28. [Google Scholar]
  28. Pham, N.T.T.; Nong, D.; Sathyan, A.R.; Garschagen, M. Vulnerability assessment of households to flash floods and landslides in the poor upland regions of Vietnam. Clim. Risk Manag. 2020, 28, 100215. [Google Scholar] [CrossRef]
  29. Mavhura, E.; Mucherera, B. Flood survivors’ perspectives on vulnerability reduction to floods in Mbire district, Zimbabwe. Jàmbá J. Disaster Risk Stud. 2020, 12, 663. [Google Scholar]
  30. Mudavanhu, C.; Manyangadze, T.; Mavhura, E.; Pedzisai, E.; Manatsa, D. Rural households’ vulnerability and risk of flooding in Mbire District, Zimbabwe. Nat. Hazards 2020, 103, 3591–3608. [Google Scholar] [CrossRef]
  31. Sam, A.S.; Kumar, R.; Kächele, H.; Müller, K. Vulnerabilities to flood hazards among rural households in India. Nat. Hazards 2017, 88, 1133–1153. [Google Scholar] [CrossRef]
  32. You, W.J.; Zhang, Y.L. Evaluation of social vulnerability to floods in Huaihe River basin: A methodology based on catastrophe theory. Nat. Hazards Earth Syst. Sci. Discuss. 2015, 3, 4937–4965. [Google Scholar]
  33. Hahn, M.B.; Riederer, A.M.; Foster, S.O. The Livelihood Vulnerability Index: A pragmatic approach to assessing risks from climate variability and change—A case study in Mozambique. Glob. Environ. Chang. 2009, 19, 74–88. [Google Scholar] [CrossRef]
  34. Tonmoy, F.N.; El--Zein, A.; Hinkel, J. Assessment of vulnerability to climate change using indicators: A meta—analysis of the literature. Wiley Interdiscip. Rev. Clim. Chang. 2014, 5, 775–792. [Google Scholar] [CrossRef] [Green Version]
  35. Kim, S.-M.; Kang, M.-S.; Jang, M.-W. Assessment of agricultural drought vulnerability to climate change at a municipal level in South Korea. Paddy Water Environ. 2018, 16, 699–714. [Google Scholar] [CrossRef]
  36. Kabir, R.; Akter, M.; Karim, D.S.; Haque, A.; Rahman, M.; Sakib, M. Development of a Matrix Based Statistical Framework to Compute Weight for Composite Hazards, Vulnerability and Risk Assessments. Climate 2019, 7, 56. [Google Scholar] [CrossRef] [Green Version]
  37. Deressa, T.; Hassan, R.M.; Ringler, C. Measuring Ethiopian Farmers’ Vulnerability to Climate Change across Regional States; International Food Policy Research Institute (IFPRI): Washington, DC, USA, 2008. [Google Scholar]
  38. Fahad, S.; Wang, J. Farmers’ risk perception, vulnerability, and adaptation to climate change in rural Pakistan. Land Use Policy 2018, 79, 301–309. [Google Scholar] [CrossRef]
  39. Mohmmed, A.; Li, J.; Elaru, J.; Elbashier, M.M.A.; Keesstra, S.; Artemi, C.; Martin, K.; Reuben, M.; Teffera, Z. Assessing drought vulnerability and adaptation among farmers in Gadaref region, Eastern Sudan. Land Use Policy 2018, 70, 402–413. [Google Scholar] [CrossRef] [Green Version]
  40. Sharifi, Z.; Nooripour, M.; Sharifzadeh, M. Analysis of rural households’vulnerability in the central district of dena county: The application of the sustainable livelihoods framework. J. Spat. Anal. Environ. Hazarts 2017, 4, 19–36. [Google Scholar]
  41. Zarafshani, K.; Maleki, T.; Keshavarz, M. Assessing the vulnerability of farm families towards drought in Kermanshah province, Iran. GeoJournal 2020, 85, 823–836. [Google Scholar] [CrossRef]
  42. Thathsarani, U.S.; Gunaratne, L.H.P. Constructing and index to measure the adaptive capacity to climate change in Sri Lanka. Procedia Eng. 2018, 212, 278–285. [Google Scholar] [CrossRef]
  43. Williams, P.A.; Crespo, O.; Abu, M. Adapting to changing climate through improving adaptive capacity at the local level–The case of smallholder horticultural producers in Ghana. Clim. Risk Manag. 2019, 23, 124–135. [Google Scholar] [CrossRef]
  44. Alijani, B.; Donyadoost, H. Synoptic Analysis of Flood in Sarbaz Watershed. Geogr. Sp. 2017, 17, 49–70. [Google Scholar]
  45. Paavola, J. Livelihoods, vulnerability and adaptation to climate change in Morogoro, Tanzania. Environ. Sci. Policy 2008, 11, 642–654. [Google Scholar] [CrossRef]
  46. Ellis, F.; Allison, E. Livelihood diversification and natural resource access. Overseas Dev. Group Univ. East Angl. 2004. [Google Scholar]
  47. Ellis, F.; Freeman, H.A. Rural livelihoods and poverty reduction strategies in four African countries. J. Dev. Stud. 2004, 40, 1–30. [Google Scholar] [CrossRef] [Green Version]
  48. Abdul-Razak, M.; Kruse, S. The adaptive capacity of smallholder farmers to climate change in the Northern Region of Ghana. Clim. Risk Manag. 2017, 17, 104–122. [Google Scholar] [CrossRef]
  49. Mubiru, D.N.; Radeny, M.; Kyazze, F.B.; Zziwa, A.; Lwasa, J.; Kinyangi, J.; Mungai, C. Climate trends, risks and coping strategies in smallholder farming systems in Uganda. Clim. Risk Manag. 2018, 22, 4–21. [Google Scholar] [CrossRef]
  50. Corobov, R.; Sîrodoev, I.; Koeppel, S.; Denisov, N.; Sîrodoev, G. Assessment of climate change vulnerability at the local level: A case study on the Dniester River Basin (Moldova). Sci. World J. 2013, 2013, 173794. [Google Scholar] [CrossRef] [PubMed] [Green Version]
  51. Fekete, A. Validation of a social vulnerability index in context to river-floods in Germany. Nat. Hazards Earth Syst. Sci. 2009, 9, 393–403. [Google Scholar] [CrossRef] [Green Version]
  52. Balica, S.F.; Wright, N.G.; Van der Meulen, F. A flood vulnerability index for coastal cities and its use in assessing climate change impacts. Nat. Hazards 2012, 64, 73–105. [Google Scholar] [CrossRef] [Green Version]
  53. Jamshidi, O.; Asadi, A.; Kalantari, K.; Azadi, H.; Scheffran, J. Vulnerability to climate change of smallholder farmers in the Hamadan province, Iran. Clim. Risk Manag. 2019, 23, 146–159. [Google Scholar] [CrossRef]
  54. Hossain, B.; Sohel, M.S.; Ryakitimbo, C.M. Climate change induced extreme flood disaster in Bangladesh: Implications on people’s livelihoods in the Char Village and their coping mechanisms. Prog. Disaster Sci. 2020, 6, 100079. [Google Scholar] [CrossRef]
  55. Ubisi, N.R.; Mafongoya, P.L.; Kolanisi, U.; Jiri, O. Smallholder farmer’s perceived effects of climate change on crop production and household livelihoods in rural Limpopo province, South Africa. Chang. Adapt. Socio-Ecological Syst. 2017, 3, 27–38. [Google Scholar] [CrossRef]
  56. Harvey, C.A.; Saborio-Rodríguez, M.; Martinez-Rodríguez, M.R.; Viguera, B.; Chain-Guadarrama, A.; Vignola, R.; Alpizar, F. Climate change impacts and adaptation among smallholder farmers in Central America. Agric. Food Secur. 2018, 7, 57. [Google Scholar] [CrossRef]
  57. Dapilah, F.; Nielsen, J.Ø.; Friis, C. The role of social networks in building adaptive capacity and resilience to climate change: A case study from northern Ghana. Clim. Dev. 2020, 12, 42–56. [Google Scholar] [CrossRef]
  58. Adger, W.N. Social capital, collective action, and adaptation to climate change. In Der Klimawandel; Voss, M., Ed.; VS Verlag für Sozialwissenschaften: Berlin/Heidelberg, Germany, 2010; pp. 327–345. [Google Scholar]
  59. Ireland, P.; Thomalla, F. The role of collective action in enhancing communities’ adaptive capacity to environmental risk: An exploration of two case studies from Asia. PLoS Curr. 2011, 3, RRN1279. [Google Scholar] [CrossRef]
  60. Batung, E.S. Climate Change Vulnerability and Perceived Resilience Among Smallholder Farmers in the Upper West Region of Ghana. Master’s Thesis, The University of Western Ontario, London, ON, Canada, 2021. [Google Scholar]
  61. Ojo, T.O.; Baiyegunhi, L.J.S. Determinants of credit constraints and its impact on the adoption of climate change adaptation strategies among rice farmers in South-West Nigeria. J. Econ. Struct. 2020, 9, 28. [Google Scholar] [CrossRef]
  62. Oskorouchi, H.R.; Sousa--Poza, A. Floods, food security, and coping strategies: Evidence from Afghanistan. Agric. Econ. 2021, 52, 123–140. [Google Scholar] [CrossRef]
  63. Wamsler, C.; Brink, E.; Rentala, O. Climate change, adaptation, and formal education: The role of schooling for increasing societies’ adaptive capacities in El Salvador and Brazil. Ecol. Soc. 2012, 17, 2. [Google Scholar] [CrossRef] [Green Version]
  64. Jiao, X.; Zheng, Y.; Liu, Z. Three-stage quantitative approach of understanding household adaptation decisions in rural Cambodia. Int. J. Clim. Chang. Strateg. Manag. 2020, 12, 39–58. [Google Scholar] [CrossRef]
  65. McElwee, P. The Social Dimensions of Adaptation of Climate Change in Vietnam; The World Bank: Washington, DC, USA, 2010. [Google Scholar]
  66. Saptutyningsih, E.; Diswandi, D.; Jaung, W. Does social capital matter in climate change adaptation? A lesson from agricultural sector in Yogyakarta, Indonesia. Land Use Policy 2020, 95, 104189. [Google Scholar] [CrossRef]
  67. Piya, L.; Maharjan, K.L.; Joshi, N.P. Perceptions and realities of climate change among the Chepang communities in rural mid-hills of Nepal. J. Contemp. India Stud. Sp. Soc. Hiroshima Univ. 2012, 2, 35–50. [Google Scholar]
Figure 1. Study area.
Sustainability 14 00762 g001
Figure 2. (A) Vulnerability indices over the rural districts of Pol-e Dokhtar; (B) exposure indices; (C) sensitivity indices; (D) adaptive capacity.
Sustainability 14 00762 g002
Table 1. Indicators of vulnerability and relative weight of various indicators computed by MSF.
Contributing Factor of VulnerabilityMajor ComponentsSub-ComponentsSignDescription of IndicatorsData SourceRelationshipFinal Relative Weight
EXPOSURE Frequency of floods in last 10 yearsEX1Number of flood events experienced in the last 10 yearsIWRMC *+34/05
Height of floods in last 10 yearsEX2Highest flood height experienced in the last 10 years (in feet)IWRMC+35/54
Duration of floods in last 10 yearsEX3Longest flood duration experienced in the last 10 years (in days) IWRMC+37/43
SENSITIVITYHuman sensitivityNumber of householdsSE1Number of family memberssurvey+26/76
Unemployment in familySE2Number of unemployed members of family aged 15 to 65 / total number of family memberssurvey+41/32
Number of sick personsSE3Number of sick members of family aged 15 to 65 / total number of family memberssurvey+11/18
Dependency ratioSE4Ratio of family members <15 and >65 years old / total number of family memberssurvey+39/21
Livelihood sensitivityAnnual income generated from agricultureSE5Percent of annual income generated from agriculture to all incomesurvey+42/11
Livelihood diversification indexSE6Number of non-farm activitiessurvey 41/48
Infrastructure sensitivityQuality of housing structureSE7The ratio of family size to the area of weak housessurvey+30/14
Distance of dwelling unit to the riverSE8Distance of dwelling unit to the river (km2 )survey+38/04
Financial sensitivityHousehold debtSE9Percent of debt to total income of householdsurvey+36/55
Farmland sizeSE10Total farmland size owned / number of family memberssurvey+28/19
Livestock unitsSE11Ownership of number of livestock unitssurvey+36/48
ADAPTIVE CAPACITYEconomicNumber of Insured LivestockAC1Number of insured livestocksurvey+33/86
Crop insuranceAC2% of farmland covered by crop insurance / creditsurvey+39/88
Access to creditAC3Access to governmental credit (yes = 1, no = 0)survey+41/54
TechnologyAccess to internet AC4Number of individuals using the internet in familysurvey+22/76
Social network accessAC5Number of individuals using a social media network in familysurvey+36/65
Access to vehiclesAC6Number of vehicles per householdsurvey+27/80
Social capitalAsking for financial supportAC7Number of contacts the household who can ask for financial helpsurvey+30/12
Membership in rural organizationsAC8Number of organizations households are involved insurvey+29/32
Participation in group activitiesAC9Number of household members that participating in group activitiessurvey+25/04
Human capitalFamily member working in the businessAC10The number of family members migrated to look for support for the family in the form of remittances during floodssurvey+29/45
Level of educationAC11Number of household members with formal educationsurvey+37/75
Health insuranceAC12Number of household members with health insurancesurvey+15/45
Training related flood risk AC13Number of trainings received to take flood-risk measuressurvey+32/84
InfrastructureAverage area of dwellingAC14Average area of permanent dwelling per head survey+24/43
* Iran Water Resources Management Company.
Table 2. Scale for vulnerability index.
Range of Vulnerability ScoreVulnerability Class
−0.9 to −3.5High
−1.0 to 1.0Moderate
1.1 to 3.5 Low
Table 3. Classification of households into total vulnerability classes.
Range of Vulnerability ScoreVulnerability ClassNumber of Households% of Households
−0.9 to −3.5High13642.2
−1.0 to 1.0Moderate10332.0
1.1 to 3.5 Low8325.8
Table 4. Household exposure, sensitivity, adaptive capacity, and total vulnerability.
Districts (Study Area)
JayderAfrinehMamolanWestern MiankuhMelaviEastern MiankuhJelogir
Exposure0.870.840.850.800.750.500.54
Sensitivity0.770.750.730.680.610.410.48
Adaptive Capacity0.310.350.390.390.370.630.61
Total Vulnerability−1.33−1.24−1.19−1.09−0.99−0.28−0.41
Publisher’s Note: MDPI stays neutral with regard to jurisdictional claims in published maps and institutional affiliations.

