Article

Farmers’ Contributions to Achieving Water Sustainability: A Meta-Analytic Path Analysis of Predicting Water Conservation Behavior

1
Department of Biosystem Mechanics Engineering, Faculty of Agriculture, University of Maragheh, Maragheh P.O. Box 55181-83111, Iran
2
Center for Development Research (ZEF), ZEF A: Department of Political and Cultural Change, University of Bonn, Genscherallee 3, D-53113 Bonn, Germany
*
Author to whom correspondence should be addressed.
Sustainability 2022, 14(1), 279; https://doi.org/10.3390/su14010279
Submission received: 8 November 2021 / Revised: 24 December 2021 / Accepted: 24 December 2021 / Published: 28 December 2021

Abstract

:
This article intends to summarize the findings of studies on the relationship between farmers’ behavioral intentions (BI) and water-conservation behavior (WCB) using the theory of planned behavior (TPB). A systematic review of transcripts obtained from Internet-based searching on reliable scientific databases (e.g., SID, ProQuest, Springer, Science Direct, John Wiley, Sage, Taylor & Francis, Emerald Insight, and Google Scholar) was followed by outfitting data for the Comprehensive Meta-Analysis (CMA) software. Data from a total of 28 studies on WCB were synthesized and analyzed through the CMA procedure. The resulting evidence demonstrates that the total and summarized estimate point (i.e., correlation) for the associations of attitude (ATT), subjective norms (SNs), and perceived behavioral control (PBC) with BI was 0.46, 0.36, and 0.26, respectively ( r ( t ) P B C < r ( t )   S N s < r ( t ) A T T → BI). Furthermore, the effect size of the relationship between PBC and WCB was 0.27. The largest effect size pertained to the relationship between BI and WCB (BI → WCB) ( r ( t ) B I = 0.52). The take-home message of the article is that hypothetical statements of the TPB are confirmed, as would be hypothesized. These findings should still be regarded in the field of WCB research; thus, policymakers need to provide solutions and adapt their policy initiatives for water resource management based on these findings. For example, one of the solutions to improve water resource management based on the research results is to examine the views and realities constructed by farmers of water resources and related management styles before carrying out water resource management projects. Identifying the potential capabilities of farmers and their economic and social background to expand water-conservation behavior and the tendency and acceptance of water resource management project to be implemented is also an important requirement in making resource management projects effective. The use of various methods of the individual, group, and collective communication to interact with farmers combined with provision of extension training, as well as mobilizing and organizing farmers to facilitate effective management of water resources are recommended.

1. Introduction

Agriculture consumes the largest share of freshwater resources around the world [1,2]. The FAO has called for environmentally friendly decisions and policy initiatives to be taken by water and irrigation authorities around the world to assist farmers in obtaining more reliable yields on the one hand and to optimize the amount of water consumed in their farming systems on the other hand [3]. Similar to many countries around the world, agriculture in Iran consumes almost 89–92% of freshwater to produce food, fiber, and raw materials needed by manufacturers [4,5]. Noticeably, the productivity of water consumption (the amount of output produced per unit of water consumed) is low, which creates a challenging debate about water resource management [6].
Maintaining a balance between socio-economic goals and environmental sustainability needs an understanding of economic resource flows [7], the application of water-saving technologies, and taking into account the signals of internalized cultural and psychological patterns [6,8,9]. In spite of a reduction in water consumption in farming systems by water-saving technologies, the conservation of such resources in the long run depends on how farmers contribute to developing conservation behavioral intention (BI) and overt sustainable actions and how a variety of stakeholders follow collaborative interventions. In fact, sustainability cannot be achieved in agricultural water resource management by considering only biophysical and ecological conditions, allegedly hard systems; the stance of hard systems definitely depends on human features and reciprocal linkages, known as soft systems [4]. From this point of view, providing non-monetary strategies and operational measures to change the BI and accept voluntary behavior of farmers along with price and monetary strategies [6,10,11] are core issues in achieving the strategic management of agricultural water resources.
The significance of the sustainability approach is crucial particularly in relation to the challenge of water scarcity in the future [12], reduced access to freshwater resources, especially in emergencies, and the need for water resources to produce food given the expected increase in the frequency of droughts [13]. Thus, the agricultural sector needs to dramatically increase its water-use efficiency by advancing water-conservation strategies [5,6,14].
The basic perspectives of water-conservation programs fall under the categories of technological, financial, legislative, maintenance, and educational categories [15]. Water conservation deals with a reduced amount of water consumed in farm systems. Water conservation in farming in practice depends on the WCB of farmers, which is an internalized psychological trait that pertains to farmers’ personality features. Encouraging farmers to intake the conservation intentions and form WCB is not an easy task because the behavior should be voluntarily internalized by farmers [10,13], and then appropriate and innovative behavioral patterns are gradually externalized and embraced among the farmers with different personality traits [16].
There is a very rich body of evidence on water saving and conservation behaviors with actors such as households and citizens in the urban sector [17,18,19] and the agricultural sector [5,6,10,11,20]. The synthesis of existing evidence on BI and WCB, derived from analyzing the causal associations of the constructs of social-psychological theories, is a method by which it is possible to integrate contradictious research evidence.
A variety of different effect sizes are interpreted in terms of being small, moderate, and strong, indicating an interpretive pluralism. More clearly, for example, the relationship between attitude (ATT) and BI was reported to be 0.30 (r = 0.30, p < 0.001), which indicates 9% of the explained variance of BI; in other words, the amount of the effect size is equivalent to small (R2 = 0.09) [21]. Moreover, in the study carried by Bakhshi et al. [22], the correlation coefficient value of 0.53 between attitude and BI shows a moderate effect size (R2 = 0.28)—28% of the variance of the BI is explained by attitude. Mohammadi et al. [23] have shown a strong effect size for attitude in predicting BI (r = 0.74; R2 = 0.54). In relation to PBC, the body of literature shows a multiplicity of the effect sizes of this variable: the effect size includes small, medium, and large interpretations. A contradictory evidence to the nature of the causal relationship in TPB is the negative relationship between PBC and WCB (r = −0.51, p < 0.01) [24].
Thus, the question that arose is to what extent the external constructs of TPB could play a role in predicting the variance of BI and WCB and how it is possible to make uniform the heterogeneity and diversity that resulted from a multiplicity of interpretations of the causal relationships. Through meta-analysis, this study attempted to fill in the methodological gap in analyzing such data. The knowledge gap will also be filled concerning the relationships ATT → BI, SNs → BI, PBC → BI, PBC → WCB, and BI → WCB. With this approach, the uncertainty about how the constructs of the TPB will affect each other will be reduced, and researchers can better use this evidence in establishing the hypothetical statements about the relationships between BI and WCB. Meta-analysis is a de facto tool for quantitatively analyzing and synthesizing research findings from a set of empirical studies [25,26]. This analysis makes it possible to estimate the actual associations between TPB constructs.
This article attempted to synthesize a variety of the confirmatory and contradictory findings in the context of BI and WCB and to provide an integrity of existing results to reduce discrepancies. The specific objectives were (1) to find out the effect size of the impact of attitude, SNs, and PBC on BI; (2) to figure out the effect size of the impact of BI and PBC on WCB; and (3) to indicate implications and make suggestions to authorities in the Water and Sewerage Department (WSD).

2. Theoretical Foundation

2.1. Theory of Planned Behavior (TPB)

The theory of planned behavior (TPB) is well established with its predictive power in the studies of BI and WCB. TPB assumes that the intentional behavior of individuals, as rational actors, leads them to perform a behavior. The three main constructs of this theory, based on which the actual behavior of individuals is predicted with high accuracy, are attitude (ATT), subjective norms (SNs), and perceived behavioral control (PBC). TPB is useful to investigate how the psychological constructs interact with the environment, result in change of practices as in the case of, for instance, farmers shifting from the use of traditional irrigation methods to pressure irrigation methods [14]. The findings of studies in the last 15 years in the field of water resource management have delivered various reports on the causal relationships of the three main constructs of TPB and the resource management practices [22,23,24].
The TPB is a universal theory in the field of behaviorism, which has been grounded in various fields. The reason for using this theory in this research is due to the appropriateness of the conceptual and structural structure of this theory with the specific objectives and analytical framework of the research. Importantly, this theory is widely used in agricultural extension research. Additionally, this theory has a greater improvement in predicting real intentions and behaviors than other models.

2.1.1. Hypothesis 1 (H1)—Attitude and Behavioral Intention

There are various forms of sustainable WCB and also varying attitudes. The types of attitudes include attitudes towards water saving behaviors [5,12,27], attitudes towards the use of water saving technologies [28], attitudes towards the use of irrigation canals [29], and attitudes towards actions to conserve water quality [30]. The attitudes towards agro-environmental NGOs and water-users’ cooperatives (WUCs) are also crucial in WCB since the effect is revealed in adopting water-saving technologies and practices [4,31,32]. The study carried out by Razzaghi and Mirtorabi [28] indicates that attitudes directly predict 82% of the variance of the tendency to WCB. Clark and Finley [17] provide evidence that intention has a positive and significant correlation with the BI. Khosravipour and Ghoochani [32] used Pearson’s correlation test to explain the relationship between the two constructs of attitudes towards water supply cooperatives and BI of users regarding membership in this cooperative, resulting in a correlation coefficient of 0.67 at a 1 percent level of significance.
Hypothesis 1 (H1).
Attitude towards WCB has a positive impact on BI.

2.1.2. Hypothesis 2 (H2)—Subjective Norms (SNs) and Behavioral Intention

Subjective norms (SNs) indicate a perception by which one finds intimate and respectful people as encouragers or preventers of doing or not doing a behavior. Therefore, the SNs represent the perceived social pressure from others to perform or not to perform a behavior [33]. Through this, intention and behavior develop and lead to doing or not doing a behavior [34]. Regarding the impact of SNs perceived by farmers on BI, the literature delivers an extensive body of evidence with a range of effect sizes: small effect sizes as reported by Le Dang et al. [35] and Valizadeh et al. [36]; medium effect sizes as demonstrated by Dehghanpur and Zibaei [37] and Valizadeh et al. [38]; and strong effect sizes as seen in the studies by Mohammadi et al. [23] (d = 0.53), Durst [39], and Faisal et al. [40].
Hypothesis 2 (H2).
SNs have a positive impact on behavioral intention.

2.1.3. Hypothesis 3 (H3a, H3b)—PBC, Behavioral Intention, and WCB

PBC is defined as the presence or absence of necessary resources and opportunities a person perceives that he or she needs to be able to do or to not do a behavior, as an individual perceiving the ease or difficulty in performing the behavior of interest [34]. The level of control over a behavior emanates from internal capabilities, like knowledge and skills, and external ones, such as technologies, money, time, and space [41]. Valizadeh et al. [38] provide evidence that PBC is positively and significantly correlated with BI. Abadi [6] has accentuated on the role of agriculture that contributes to rejuvenate the endangered ecosystem of Lake Urmia and concluded that farmers, as the main stakeholders in agricultural systems, have the potential to play a significant role in optimizing water consumption in agriculture, so that their PBC functions as a remarkable driver. In the context of the effect of PBC on BI and WCB, the literature also delivers a series of documents and studies that are different from each other in terms of effect size like Yazdanpanah et al. [12] (r = 0.61, p < 0.01, d = 0.37), Taqiopur et al. [42] (r = 0.55, p < 0.01, d = 0.30), Faisal et al. [40] (t-value = 4.14, p < 0.0001, d = 0.41), Rahimi Faizabadi et al. [24] (r = −0.47, p < 0.01, d = 0.22), Dehghanpur and Zibaei [37] (r = 0.50, p < 0.001, d = 0.25), and Delfiyan et al. [43] (r = 0.45, p < 0.01, d = 0.20), which illustrate the differences. An example of robust effects has been reported by Durst [39] (d = 0.58, t-value (df = 375) = 5.65, p < 0.01, 0.58). Connected to the effect of PBC on BI, we faced a series of data emanated from studies in different contexts.
Hypothesis 3a (H3a).
PBC has a positive impact on behavioral intention.
Hypothesis 3b (H3b).
PBC has a positive impact on WCB.

2.1.4. Hypothesis 4 (H4)—Behavioral Intention and WCB

The BI is defined as a tendency to perform a behavior. The relationship between BI and WCB of farmers has been studied extensively [4,6,12,13,21,24,36,38,42,44]. Intention may be related to some water-saving behaviors that include the use of methods or tools that reduce water consumption, cultivation of water saving crops or modified seeds, performing activities with low water consumption [27,45], the use of drought-and-salinity-resistant or less water-demanding varieties, less tillage, or a combination of such technologies and practices [46]. Haghi et al. [47] have showed that BI influences membership behavior in the WUCs. Besides, Durst [39] has figured out that respondents have a tailored tendency to form intentions, by which the adoption of water conservation practices are facilitated.
Hypothesis 4 (H4).
Behavioral intention has a positive impact on WCB.
Figure 1 illustrates the hypotheses developed for meta-analysis. Thus, four hypotheses were tested, including H1 (ATT → BI), H2 (SNs → BI), H3a (PBC → BI), H3b (PBC → WCB), and H4 (BI → WCB). The co-variances of the inter-linkage of exogenous variables of the model were not analyzed and are shown in crimped point paths.

3. Materials and Methods

The study benefited from a meta-analysis technique to analyze the entry data of a variety of studies investigating the causes of the formation of farmers’ behavioral intentions and the optimal use of water resources, over the period of 15 years of water studies.

3.1. Inclusion/Exclusion Criteria

The nature of the research problem, the type of sample under study, and constructs in the theoretical framework of a variety of studies guided the selection of studies for meta-analysis in this study. Furthermore, the following criteria were developed and used to opt for the required studies.
  • Usage of the linear regression analysis, path analysis, and structural equation modeling (SEM) to analyze the relationships of the constructs of TPB or separate models that have analyzed the effect of each construct on BI and WCB;
  • The studies that include statistics, such as the Pearson correlation coefficient, the significance level, the central tendency, and the dispersion indices, such as the mean, the standard deviation, and the variance;
  • While using the questionnaire (i.e., survey), high and acceptable reliability indicators (Cronbach’s alpha, composite reliability (CR), and average variance extracted (AVE));
  • Articles indexed in reputable databases, such as SID, Springer, Elsevier, John Wiley, Taylor & Francis, Google scholar, and ProQuest dissertation;
  • Limiting the reviewed studies by focusing on the BI and WCB of just farmers, rural people, and landowners as the main stakeholders in the agricultural sector. The reason for excluding a sample was that agricultural activities in farming systems are different from the initiatives done by stakeholders in other sectors, for instance, workers and city dwellers.

3.2. Searching on Internet

One of the main steps in conducting meta-analysis research is to select the type of databases that deliver tailored and valid scientific works to collect and provide meta-analysis input data. Thus, the databases of SID, ProQuest, Springer, Science Direct, John Wiley, Sage, Taylor & Francis, Emerald Insight, and Google Scholar were searched. The keywords in the primary, secondary, and tertiary searches are given in Table 1.
From the studies accessed from the database, 28 studies were included in the meta-data analysis based on the inclusion/exclusion criteria listed above.

3.3. Software and Analysis

We went through the option of two groups or correlation and then continued and used the format of computed effect size in the interface of a comprehensive meta-analysis (CMA). The groups consisted of correlation and sample size, correlation and standard error, correlation and variance, Fisher’s Z and sample size, Fisher’s Z and standard error, Fisher’s Z and variance, correlation and t-value, t-value and sample size for correlation, and p-value and sample size for correlation.
CMA software (version) was used to perform the meta-analysis [48] because there are good materials and manuals that help a novice researcher to be well-trained. In addition, working with the software is easy due to its well-organized design and good graphical space. The effect-size index for each study was calculated using a statistic, such as the correlation, the t-value, the sample size, the standard error, and the p-value depending on the data provided by the selected studies. Meta-analysis is usually used to pool correlation matrices together in the first stage of analysis. The pooled correlation matrix is used to fit path-analysis models (PAMs) in the second stage of analysis. As researchers usually apply ad hoc procedures to fit the PAMs, some of these procedures are not statistically defensible from a structural equation modeling or a path-analysis perspective [25].
The final sample consisted of 28 cross-sectional surveys. The released date ranged from 2005 to 2020. Figure 2 displays achieved studies in three rounds of Internet searching.

3.4. Formulae and Data Entry

The following formula was used to transform r to ZFisher, as mathematical operations was done on data entry for CMA.
Z F i s h e r = 0.50 × L n ( 1 + C o r r 1 C o r r )  

4. Results

4.1. Initial Extracted Information

Table 2, Table 3, Table 4 and Table 5 display the initial extracted information of variables under study.

4.2. Output of CMA

4.2.1. Heterogeneity Tests

Part of the output of meta-analysis in CMA consists of heterogeneity tests. If a heterogeneity test is statistically significant, it indicates that the variation among the selected/targeted studies is reliably greater than zero [54]. Significant heterogeneity tests indicate that there is considerable and acceptable diversity among the studies, suggesting that random-effect models should be used [55]. Thus, the test is able to find covariates through which it is possible to explain unexplained variations. Significant differences among studies can have a significant effect on standard errors of integrated estimates [54]. Three different heterogeneity tests are commonly used in meta-analysis studies to appraise whether there is a real heterogeneity. The tests are listed in the subsequent sections.

4.2.2. Tau-Square Test

The parameter τ 2 (tau-squared) pertains to the between-study variance. Amongst the methods to estimate τ 2 , the method of moments is common, and it is measured by following the formulae τ 2 = Q d f C [56]. The components of Q and C are estimated through formulas
Q = i = 1 k W i Y i 2   ( i = 1 k W i Y i ) 2 i = 1 k W i , d f = k 1
and
C =   W i   W i 2   W i .

4.2.3. Q-Test

The most commonly used method to test heterogeneity is the Q test with the Q (df) statistic based on the χ 2 test, which determines if the heterogeneity is statistically significant. When the effect sizes are heterogeneous, a statistically significant value for χ 2 shows that studies have different distributions and thus do not have a shared effect [57].

4.2.4. I-Square Test

The result of the heterogeneity test using the Cochrane Q index indicates that the index is statistically significant (p = 0.0001), and there is a real difference between the measurements of the effect of initial research. Given the limitation of the Q index in terms of significance (i.e., the greater the number of effect sizes, the greater the test power to reject the null assumption of being homogeneity of the studies), this index has a value from zero to 100%, which indicates the amount of heterogeneity as a percentage. As illustrated in Table 6, the results of I-squared show that, for the path of ATT → BI, more than 96.62% of the distribution in the results of the initial research is real due to the presence of moderating variables (Hagen et al., 2003), which indicates a high heterogeneity in early research. Based on both heterogeneity indicators, it was found that moderating variables have a significant role in the relationship between the two variables of attitude and WCB. Therefore, for the random model selected for the meta-analysis, the size of the combined effect was 0.823 before sensitivity analysis and 0.695 after sensitivity analysis.

4.3. Publication-Bias Analysis

The publication-bias-analysis method, which was developed by Jack Vevea and his colleagues, helps researchers estimate the effect of publication bias and correct the biases [58]. The aim of a publication-bias analysis is to separate results into one of the categories of (a) trivial impact of publication bias; (b) non-trivial impact, but where the major finding is still valid; and (c) remarkable impact of publication bias [59].

4.3.1. Funnel Plot

Funnel plot is a visual representation in which the X axis is the effect size with the variance or standard error on the Y axis [59]. In this analysis, studies with small sample sizes are more susceptible to publication bias due to large variance, whereas studies with large sample sizes are more likely to be published irrespective of whether or not their results are significant. Studies with higher accuracy are embedded at the top of the funnel, whereas studies with lower accuracy are placed at the bottom of the funnel. Asymmetry is usually seen at the bottom of the graph and in the wide opening of the funnel, where studies are less accurate. The presence of asymmetry in the wide opening of the funnel indicates that the studies have been published by mentioning significant cases, and the studies have not been published by mentioning non-significant cases.

4.3.2. Trim-and-Fill Method

The trim-and-fill algorithm is based on the formalization of the qualitative approach using the funnel plot (see Figure 3, Figure 4, Figure 5, Figure 6 and Figure 7). First, it trims off the asymmetric outlying part of the funnel plot after calculating the number of studies placed in the asymmetric part. Second, the symmetric remainder is used to estimate the true center of the funnel, and then the trimmed studies and their missing cohorts are replaced around the center. Again, the final estimate of the true mean and its variance are calculated based on the filled funnel plot [60].

4.4. Hypothesis Testing

4.4.1. Hypothesis 1 (H1)—Attitude and Behavioral Intention

The result of the analysis using the random-effect model shows that the effect size of the correlation between attitude and the BI is 0.46 (LL = 0.355, UL = 0.564). Despite the insignificance of the effect size of the two studies of Gholamrezai and Sepahvand [31] (Z-value = 0.22; p-value = 0.82) and Durst [39] (Z-value = 0.40; p-value = 0.68), the value of the summarized Z shows that the effect size of the meta-analysis is significant (Z-value = 7.393). Therefore, the relationship between attitude and BI is confirmed by the calculated effect size, predicting that the inter-correlation is 0.46. The result of the classic fail-safe N test also shows that 7987 number of missing studies are needed to distort the estimated association (i.e., effect size), H N u l l : θ 1 = θ 2 : which claims that there is a non-significant relationship between attitude and BI (i.e., there is no significant relationship between the two variables of attitude and BI). In general, this result indicates that the relationship estimated in Hypothesis 1 is reliable. Therefore, Hypothesis 1 (H1) is confirmed.

4.4.2. Hypothesis 2 (H2)—Subjective Norms (SNs) and Behavioral Intention

To test Hypothesis 2, the result of calculating the effect size using the random-effect model manifested that the calculated relationship between SNs and BI is 0.36 with lower and upper limits of 0.283 and 0.440, respectively. The value of the summarized Z indicates that the magnitude of the meta-analysis effect is significant (Z-value = 8.268), demonstrating the confirmation of the correlation between the two variables of SNs and BI with the value of the estimate point or a correlation of 0.36. To examine the publication bias using the classic fail-safe N test, the result showed that 3890 was the number of missing studies needed to distort the relationship or the estimated effect size for the correlation between the two variables SN and BI. This view rejects the H0 hypothesis; the statistical hypothesis ( H S t a t i s t i c s : θ 1 θ 2 ) is confirmed; and the result shows the reliability of Hypothesis 2 and the confirmation of this hypothesis (H2).

4.4.3. Hypothesis H3a—PBC and Behavioral Intention

The meta-analysis result of the H3a hypothesis test, which considers the relationship between PBC and BI, showed that the effect size of the correlation effect between PBC and BI is 0.26, with the lower and upper limits being 0.144 and 0.383, respectively. The z- summarized or Z estimated in this meta-analysis claims that the magnitude of the meta-analysis effect is significant (z-value = 4.167). Thus, the meta-analysis result confirms a significant correlation between PBC and BI and predicts this correlation. Additionally, the result of the classic fail-safe N test showed that 1886 studies are needed to convert the estimated relationship into a non-significant relationship; so, the estimated magnitude of the effect of the relationship between PBC and BI is reliable (confirmation of Hypothesis 3, H3a).

4.4.4. Hypothesis H3b—PBC and WCB

To test H3b hypothesis using the random-effect model, meta-analysis was conducted on 12 studies to measure the relationship between PBC and WCB. The results showed that the effect size of correlation between PBC and WCB is 0.27, with lower and upper limits of 0.099 and 0.440, respectively. Therefore, the value of summarized Z emphasizes that the effect size calculated in the meta-analysis is significant (z = 3.007). This meta-analysis confirms that the relationship between PBC and WCB is real (H3b) and confirmed the estimated correlation. The result of the classic fail-safe N test also showed that 800 studies are needed to turn the estimated relationship into a non-significant relationship. Therefore, the estimated magnitude of the effect of the relationship between PBC and WCB is reliable (confirmation of Hypothesis H3b).

4.4.5. Hypothesis 4 (H4)—Behavioral Intention, and WCB

The result of estimating the effect size for the correlation between BI and WCB (Hypothesis 4) showed that the estimated point is 0.52 with lower and upper limits of 0.420 and 0.607, respectively. The value of the summarized Z claims that the effect-size meta-analysis is significant (value of z = 8.830). Therefore, the estimated effect size for the relationship between BI and WCB is confirmed and predicts that this correlation is 0.52. The result of the classic fail-safe N test also showed that 6629 studies are needed to distort the estimated relationship to a non-significant relationship. Therefore, the estimated value of the effect size of the relationship between BI and WCB is reliable, and confirmation of Hypothesis 4 is achieved (see Table 7 and Table 8).
Table 9 displays the results of the rank coefficient of the Begg and Mazumdar rank correlation test [61]. The classic case of publication bias is the case depicted by the funnel plot. Large studies tend to be included in the analysis regardless of their treatment effect, whereas small studies are more likely to be included when they show a relatively large treatment effect. Under these circumstances, there will be an inverse correlation between study size and effect size. This correlation can serve as a test for publication bias. Concretely, they suggest that we compute the rank order correlation (Kendall’s tau b) between the treatment effect and the standard error, which is driven primarily by sample size.
This approach is limited in some important ways. A significant correlation suggests that bias exists but does not directly address the implications of the bias. Conversely, a non-significant correlation may be due to low statistical power and cannot be taken as evidence that bias is absent. In this case, Kendall’s tau b (corrected for ties, if any) is 0.24737, with a one-tailed p-value (recommended) of 0.06364 or a two-tailed p-value of 0.12729 (based on a continuity-corrected normal approximation).

5. Discussion

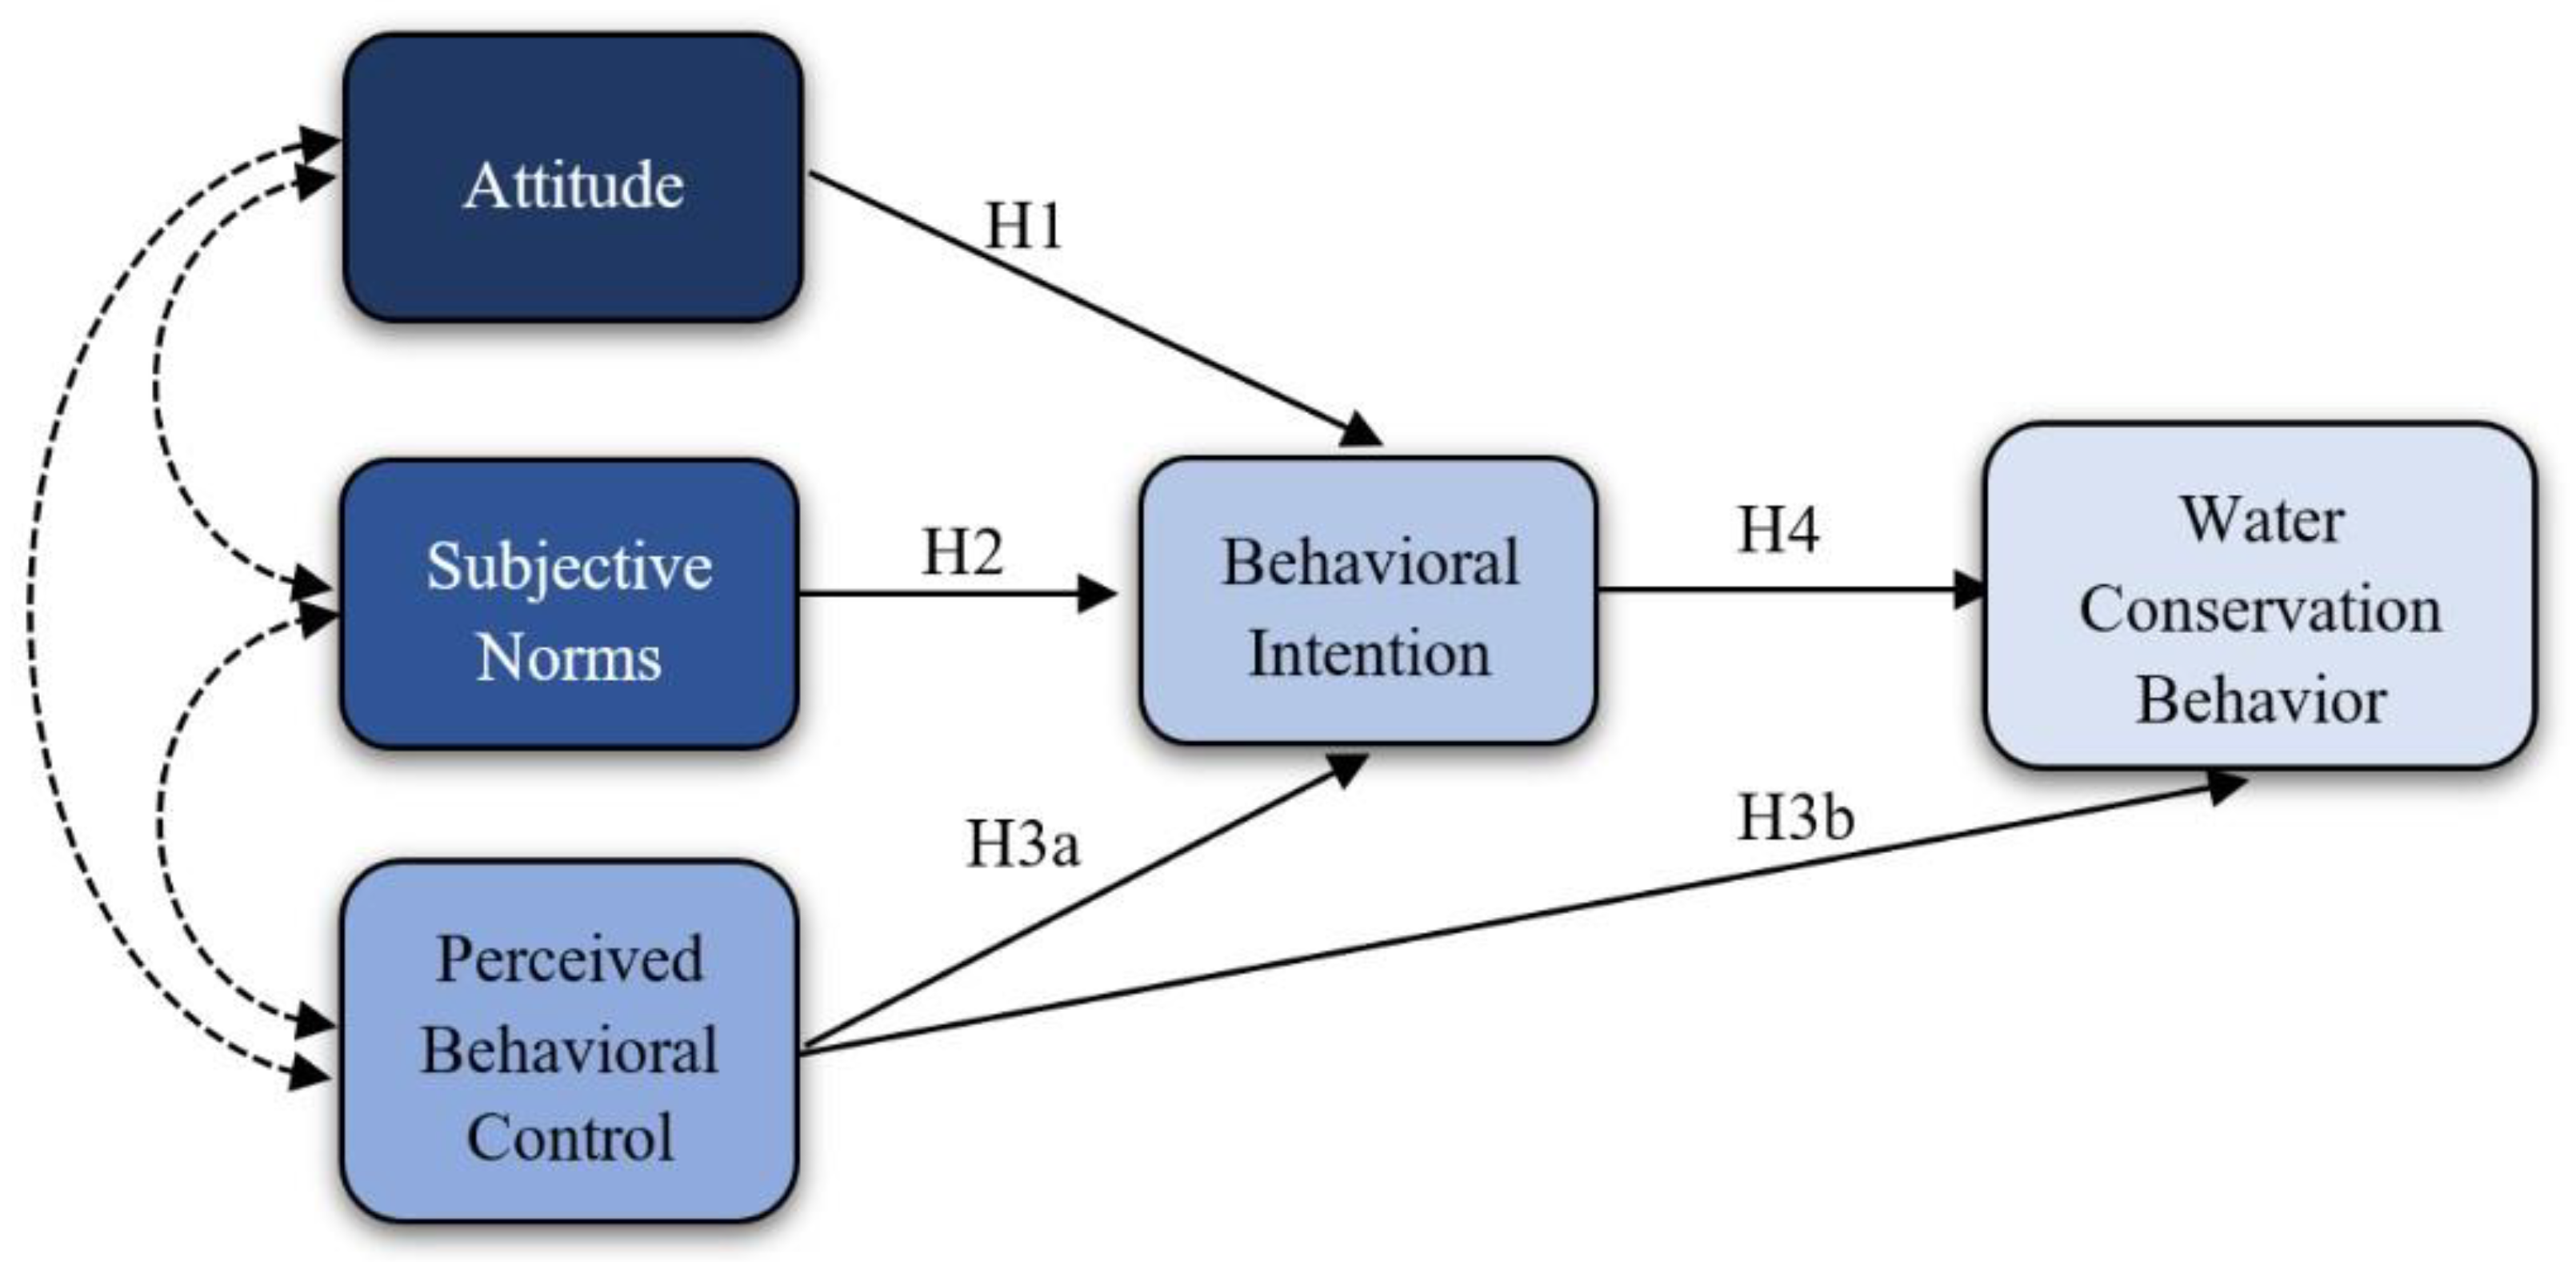
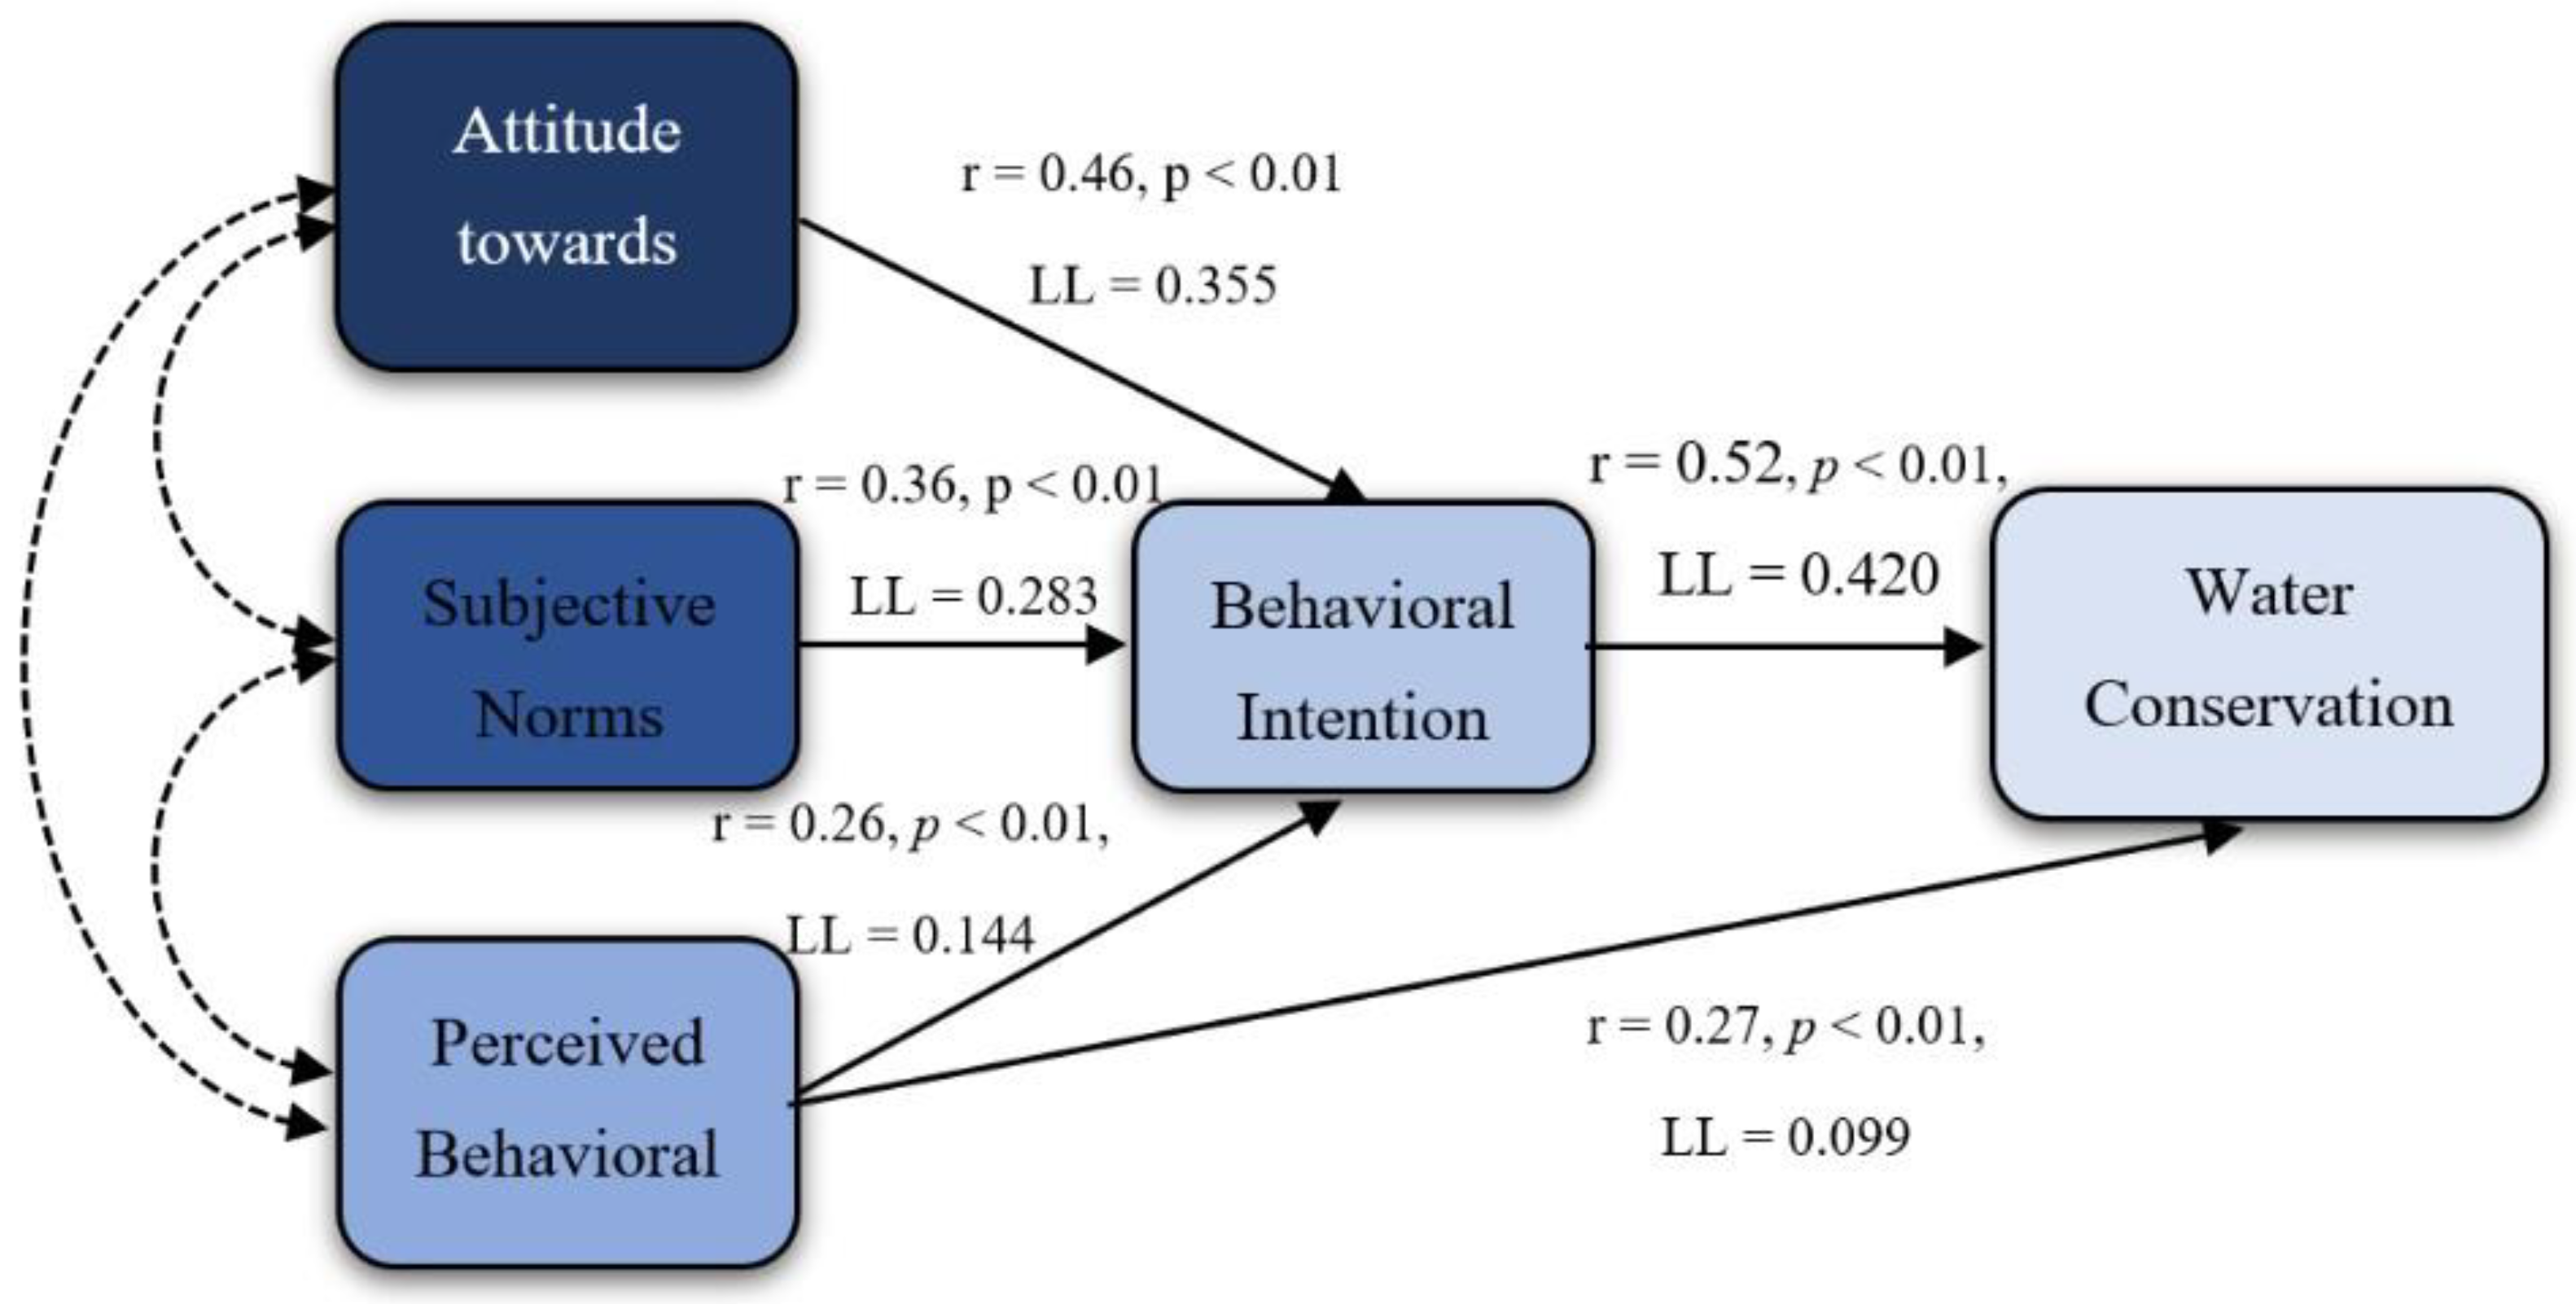
In this section, we would report the value of estimated points referring to the paths of ATT → BI, SNs → BI, PBC → BI, PBC → WCB, and BI → WCB (see Figure 8). The results were assessed by means of Cohen’s judgment scale. The correlation of 0.10 (r = 0.10) explains 1% of the total variance (i.e., small effect); 0.30 (r = 0.30) accounts for 9% of the total variance (i.e., medium effect); and a correlation as much as 0.50 (r = 0.50) predicts 25% of the variance (i.e., large effect) [21]. This research provided a combined finding, which is derived from the integration of the contradictory evidence reported in WCB studies.
The results showed that the three constructs of attitude, SNs, and PBC affect BI, and they are able to predict the variance of BI. Furthermore, PBC and BI are the indirect determinants of WCB. Given the confirmation of the effect of the main constructs (i.e., exogenous variables of the model) of the TPB on the intention and actual behavior, this evidence can provide basic information for authorities in the WSD on water-use-optimization planning in the agricultural sector. The meta-analysis results show that the maximum effect size is calculated related to the attitude. Previous research has emphasized the effect of attitude on the BI and showed the role of the psychological dimension and thought-based attitudes and the lens by which farmers see their environment, things, processes of farm management, and entities that they face, as they work in their farms. The lens of attitude affects farmers’ intentions more. This is because when farmers have favorable attitudes and tendencies of involving in pro-environmental behaviors, they generate favorable cognitive frameworks by which they perceive, embrace, and internalize the necessity and usefulness of implementing efficient pro-environmental behaviors [41]. This is a substantial role that is played by attitudes. Attitude is the closest center and reference to farmers to create data to shape their behaviors.
Next to attitude, PBC has the greatest impact on the BI, which shows that attention to the abilities and skills of farmers is also very important in planning attitude change and implementing practical solutions in the field of planned behavior. It indicates that the more farmers have a technical, economic, and temporal authority, such as knowledge, information, money, time, disposal to financial state-led sources, etc., the more they have control over the actions taken in their farm settings and therefore are able to become involved in saving water resources [6]. A point kept in mind is that PBC emanates from either a well-prepared mentality or environmental-prepared situations, for example, when farmers are self-reliant or self-trusted as well as when they are acquainted with the suitable knowledge to enhance their pro-environmental behaviors, related to the latter style, and when farmers own infrastructure or even when they are financially supported by which they are able to engage in pro-environmental behaviors [41].
The result of the positive impact of attitude on BI indicates that attitude is able to predict 21% of the variance of BI; SNs could predict 12% of the variance of BI; and PBC is able to account for 6% of the variance of BI as well as 7% of the variance of WCB. Additionally, BI is able to predict 27% of the variance of WCB and falls into the powerful range of effect size for BI. Consequently, BI is the main construct in the theoretical framework with the strongest effect size. This finding is consistent with an effect size closer to previous studies, such as Yazdanpanah et al. (2015) [12] and Valizadeh et al. [38]. The take-home message of the article is that the findings of the study affirm the hypothetical statements of the constructs of the TPB, as would be hypothesized.

6. Conclusions and Remarks

The article concludes that the main constructs of the TPB (i.e., attitude, SNs, and PBC) have a positive effect on BI. Furthermore, the two variables of BI and PBC can predict the WCB of farmers. In general, TPB is a tailored psychological model for water resource saving behavior. Due to the high impact of attitude and PBC on the BI, managers and planners in the field of water resource management are advised to pay sufficient attention to these two factors in agricultural water resource management planning.
More research is needed based on testing the constructs of TPB and on the actual behavior of WCB by farmers. Ongoing research will lead to the final confirmation of the prevailing attitudes in the region about water resources and their optimal consumption. This issue is especially important in terms of the inclusion of attitudes in the two areas of online memory and retrieving of farmers’ previous memory. An emphasis to ongoing research works in this area is recommended in order to maintain the knowledge and experience flow between water resource management research, policy, and practice.
In general, based on research results, one of the solutions to make better water resource management is to examine the views and realities constructed by farmers about water resources and related management styles before carrying out water resource management projects. Identifying the potential capabilities of farmers and their economic and social backgrounds to expand water-conservation behavior and the tendency and acceptance of water resource management project management are also important requirements in making resource management projects effective. The use of various methods of individual, group, and collective communication to interact with farmers and in the form of extension training and organizing and mobilizing farmers to facilitate effective management of water resources is recommended. At the level of water resource management research, it is imperative to examine the economic and social factors that determine the attitude, subjective norms, and behavioral control of farmers towards sustainable management of agricultural water resources and to promote extension programs under the findings of this research. Revitalizing policies of farmers’ organizations, establishing continuous interactions between government experts and farmers, and creating the necessary platform for building trust among farmers would improve farmers’ attitudes toward water resources and management styles. In this vein, the implementation of financial incentives and the implementation of support programs and training of farmers through holding courses and promotional classes to increase the level of ability, skills, knowledge, and awareness of farmers about sustainable water resource management and related measures, and thus farmers’ more favorable attitudes, are valuable.
This research has three limitations that can be explored in future research. The first limitation relates to ignoring the inter-correlation of the three main constructs of TPB. The second limitation is related to the fact that some of the reviewed studies have assumed that self-efficacy is equivalent to PBC because they have focused on the internal features of the PBC study, while other studies considered the environmental characteristics of PBC. The third limitation is that some of the studies included in the analysis had removed some principal constructs of the TPB; in turn, others had added more components to extend the theory and to adapt to their contexts as well. To include these types of articles in the meta-analysis, we had to extract the statistical data of the construct selected and studied by the authors. Another obvious limitation in the present study is a lack of reviewing articles in languages other than Persian and English, which is known as language bias in the meta-analysis literature. Therefore, for future studies, it is suggested that foreign-language specialists be present in the research team, that the results of research with other languages be used, and that ground for improvement in the results of the meta-analysis be provided.

Author Contributions

Conceptualization, B.A.; methodology, B.A.; software, B.A.; validation, B.A. and G.K.; formal analysis, B.A.; investigation, B.A.; resources, B.A.; data curation, B.A. and G.K.; writing—original draft preparation, B.A.; writing—review and editing, G.K.; visualization, B.A.; supervision, G.K.; project administration, B.A. and G.K.; funding acquisition, B.A. All authors have read and agreed to the published version of the manuscript.

Funding

This research was funded by the Center for International Scientific Studies & Collaboration (CISSC), Ministry of Science, Research, and Technology grant number [1242,99.12.24].

Data Availability Statement

Not applicable.

Acknowledgments

This work was supported financially by the Center for International Scientific Studies & Collaboration (CISSC), Ministry of Science, Research, and Technology. The authors would like to thank Masoud Sadri Nasab, the director of CISSC, for his support and assistance with this project. Special thanks also go to Solmaz Salavati and Fatemeh Ghaffari, senior staff at the CISSC, for their follow-up of the submission process of the project plan at the center.

Conflicts of Interest

The authors declare no conflict of interest.

References

  1. Capra, A.; Scicolone, B. Emitter and filter tests for wastewater reuse by drip irrigation. Agric. Water Manag. 2004, 68, 135–149. [Google Scholar] [CrossRef]
  2. Chang, G.; Wang, L.; Meng, L.; Zhang, W. Farmers’ attitudes toward mandatory water-saving policies: A case study in two basins in northwest China. J. Environ. Manag. 2016, 181, 455–464. [Google Scholar] [CrossRef]
  3. FAO. Water for Sustainable Food and Agriculture—A Report Produced for the G20 Presidency of Germany; Food and Agriculture Organization of the United Nations: Rome, Italy, 2017. [Google Scholar]
  4. Abadi, B.; Jalali, M.; Musavi, S.B. The path analysis of water conservation behavior in agricultural sector and revivification of Lake Urmia: The case of farmers in Southern basin of Lake Urmia. IAEEJ 2018, 13, 251–268. [Google Scholar]
  5. Yazdanpanah, M.; Hayati, D.; Hochrainer-Stigler, S.; Zamani, G.H. Understanding farmers’ intention and behavior regarding water conservation in the Middle-East and North Africa: A case study in Iran. J. Environ. Manag. 2014, 135, 63–72. [Google Scholar] [CrossRef] [PubMed]
  6. Abadi, B. How agriculture contributes to reviving the endangered ecosystem of Lake Urmia? The case of agricultural systems in northwestern Iran. J. Environ. Manag. 2019, 236, 54–67. [Google Scholar] [CrossRef]
  7. Hubacek, K.; Guan, D.; Barrett, J.; Wiedmann, T. Environmental implications of urbanization and lifestyle change in China: Ecological and water footprints. J. Clean. Prod. 2009, 17, 1241–1248. [Google Scholar] [CrossRef]
  8. Abadi, B.A. Review of the impact of the targeting subsidy plan on the input use behavior of farmers in Iran. Agric. For. 2017, 63, 117–126. [Google Scholar]
  9. Oikonomou, V.; Becchis, F.; Steg, L.; Russolillo, D. Energy saving and energy efficiency concepts for policy making. Energy Policy 2009, 37, 4787–4796. [Google Scholar] [CrossRef]
  10. Boazar, M.; Yazdanpanah, M.; Abdeshahi, A. Response to water crisis: How do Iranian farmers think about and intent in relation to switching from rice to less water-dependent crops? J. Hydrol. 2019, 570, 523–530. [Google Scholar] [CrossRef]
  11. Aliabadi, V.; Gholamrezai, S.; Ataei, P. Rural people’s intention to adopt sustainable water management by rainwater harvesting practices: Application of TPB and HBM models. Water Supply 2020, 20, 1847–1861. [Google Scholar] [CrossRef]
  12. Yazdanpanah, M.; Feyzabad, F.R.; Forouzani, M.; Mohammadzadeh, S.; Burton, R.J. Predicting farmers’ water conservation goals and behavior in Iran: A test of social cognitive theory. Land Use Policy 2015, 47, 401–407. [Google Scholar] [CrossRef]
  13. Yazdanpanah, M.; Hayati, D.; Thompson, M.; Zamani, G.H.; Monfared, N. Policy and plural responsiveness: Taking constructive account of the ways in which Iranian farmers think about and behave in relation to water. J. Hydrol. 2014, 514, 347–357. [Google Scholar] [CrossRef]
  14. Castillo, G.M.L.; Engler, A.; Wollni, M. Planned behavior and social capital: Understanding farmers’ behavior toward pressurized irrigation technologies. Agric. Water Manag. 2021, 243, 106524. [Google Scholar] [CrossRef]
  15. Gunda, T.; Hess, D.; Hornberger, G.M.; Worland, S. Water security in practice: The quantity-quality-society nexus. Water Secur. 2019, 6, 100022. [Google Scholar] [CrossRef]
  16. Rogers, E.M. Diffusion of Innovations; Simon and Schuster: New York, NY, USA, 2010. [Google Scholar]
  17. Clark, W.A.; Finley, J.C. Determinants of water conservation intention in Blagoevgrad, Bulgaria. Soc. Nat. Resour. 2007, 20, 613–627. [Google Scholar] [CrossRef]
  18. Handa, R.; Mishra, P. Sem approach to understanding household’s ability to overcome water insecurity in urban households in Punjab. J. Commer. Manag. Thought 2020, 11, 318–331. [Google Scholar] [CrossRef]
  19. Martínez-Espiñeira, R.; García-Valiñas, M.A.; Nauges, C. Households’ pro-environmental habits and investments in water and energy consumption: Determinants and relationships. J. Environ. Manag. 2014, 133, 174–183. [Google Scholar] [CrossRef] [PubMed]
  20. Zhang, B.; Fu, Z.; Wang, J.; Zhang, L. Farmers’ adoption of water-saving irrigation technology alleviates water scarcity in metropolis suburbs: A case study of Beijing, China. Agric. Water Manag. 2019, 212, 349–357. [Google Scholar] [CrossRef]
  21. Field, A. Discovering Statistics Using IBM SPSS Statistics; Sage Publisher: Thousand Oaks, CA, USA, 2013. [Google Scholar]
  22. Bakhshi, A.; Khosravipour, B.; Ghanian, M. Assessing the sustainable behavior of agricultural water operators and correlations in South Khorasan Province. Environ. Sci. 2019, 17, 173–188. [Google Scholar]
  23. Mohammadi, S.Z.; Mohammadzadeh, S.; Yazdanpanah, M. Assessing the factors affecting orchardmen intentions and behaviors for water conservation of Dashtestan county. A theory test of planned behavior. J. Agric. Ext. Educ. Res. 2016, 8, 75–89. [Google Scholar]
  24. Rahimi Faizabadi, F.; Yazdanpanah, M.; Forouzani, M.; Mohammad Zadeh, S.; Burton, R. Explanation of farmers’ water conservation behaviors using extended planned behavior theory: The case of farmers in Aleshtar County. IEEAJ 2017, 12, 1–17. [Google Scholar]
  25. Cheung, M.W.L. Meta-Analysis: A Structural Equation Modeling Approach; John Wiley & Sons: Hoboken, NJ, USA, 2015. [Google Scholar]
  26. Cumming, G. Understanding the New Statistics: Effect Sizes, Confidence Intervals, and Meta-Analysis; Routledge: New York, NY, USA, 2013. [Google Scholar]
  27. Neisi, M.; Bijani, M.; Abbasi, E.; Mahmoudi, H.; Azadi, H. Analyzing farmers’ drought risk management behavior: Evidence from Iran. J. Hydrol. 2020, 590, 125243. [Google Scholar] [CrossRef]
  28. Razzaghi, F.; Mirtorabi, M.S. Modeling the Optimal Use of New Technologies for Water Conservation among Farmers. J. Agric. Econ. Dev. Res. 2020, 51, 699–714. [Google Scholar]
  29. Ataei, P.; Izadi, N. Analyzing social studies of Feyzabad dam irrigation and drainage network in Fars province. AEER 2014, 7, 63–82. [Google Scholar]
  30. Floress, K.; de Jalón, S.G.; Church, S.P.; Babin, N.; Ulrich-Schad, J.D.; Prokopy, L.S. Toward a theory of farmer conservation attitudes: Dual interests and willingness to take action to protect water quality. J. Environ. Psychol. 2017, 53, 73–80. [Google Scholar] [CrossRef]
  31. Gholamrezai, S.; Sepahvand, F. Farmers’ participation in water user association in western Iran. J. Water Land Dev. 2017, 35, 49–56. [Google Scholar] [CrossRef]
  32. Khosravipour, B.; Ghoochani, O.M. Explaining the Attitudes and behavioral Intention of Farmers toward Water Users’ Cooperatives in South of Karkhe Nur River. Co-Oper. Agric. 2017, 5, 88–111. [Google Scholar]
  33. Conner, M.; Sparks, P. The theory of planned behavior and health behavior. In Predicting Health Behaviour: Research and Practice with Social Cognition Models, 2nd ed.; Conner, M., Norman, P., Eds.; Open University Press: Berkschire, UK, 2005. [Google Scholar]
  34. Ajzen, I.; Fishbein, M. Attitude-behavior relations: A theoretical analysis and review of empirical research. Psychol. Bull. 1977, 84, 888–918. [Google Scholar] [CrossRef]
  35. Le Dang, H.; Li, E.; Nuberg, I.; Bruwer, J. Understanding farmers’ adaptation intention to climate change: A structural equation modelling study in the Mekong Delta, Vietnam. Environ. Sci. Policy 2014, 41, 11–22. [Google Scholar] [CrossRef]
  36. Valizadeh, N.; Bijani, M.; Hayati, D.; Haghighi, N.F. Social-cognitive conceptualization of Iranian farmers’ water conservation behavior. Hydrogeol. J. 2019, 27, 1131–1142. [Google Scholar] [CrossRef]
  37. Dehghanpur, H.; Zibaei, M. Investigation of factors affecting farmers’ motivation in using water and soil. Conservation technologies. Agric. Econ. Dev. 2020, 28, 121–146. [Google Scholar]
  38. Valizadeh, N.; Hayati, D.; Rezaei-Moghaddam, K.; Karimi-Gougheri, H. Application of the planned behavior theory in ethical analysis of water conservation behavior. Bioeth. J. 2018, 8, 33–48. [Google Scholar]
  39. Durst, L. Working with Water: An Exploration of Texas High Plains Producers’ Adoption of Water Conservation Practices in Irrigation Management. Master’s Dissertation, Degree-Granting University, Sussex, NB, Canada, 2016. [Google Scholar]
  40. Faisal, M.; Chunping, X.; Akhtar, S.; Raza, M.H.; Khan, M.T.I.; Ajmal, M.A. Modeling smallholder livestock herders’ intentions to adopt climate smart practices: An extended theory of planned behavior. Environ. Sci. Pollut. Res. 2020, 27, 39105–39122. [Google Scholar] [CrossRef] [PubMed]
  41. Abadi, B. The determinants of cucumber farmers’ pesticide use behavior in central Iran: Implications for the pesticide use management. J. Clean. Prod. 2018, 205, 1069–1081. [Google Scholar] [CrossRef]
  42. Taqiopur, M.; Abbasi, E.; Chizari, M. Farmers’ behavior toward membership in Water User Associations (WUAs) in Iran: Applying the Theory of Planned Behavior. Eur. Online J. Nat. Soc. Sci. 2015, 4, 336–350. [Google Scholar]
  43. Delfiyan, F.; Yazdanpanah, M.; Forouzani, M.; Yaghoubi, J. Investigating farmers’ behaviour management in drought period as prevention responses: The case of Dehloran district. J. Spat. Anal. Environ. Hazards 2018, 4, 79–92. [Google Scholar]
  44. Tajeri Moghadam, M.; Raheli, H.; Zarifian, S.; Yazdanpanah, M. Predicting wheat farmers’ behavior in Neyshabur plain and determination of factors affecting on them in relation to water resources conservation. J. Agric. Sci. Sustain. Prod. 2018, 28, 199–215. [Google Scholar]
  45. Rahmani, S.; Yazdanpanah, M.; Forouzani, M.; Abdeshahi, A. Investigating farmers’ beliefs and strategies to adapt to water scarcity and factors affecting them in Mamassani County. J. Water Res. Agric. 2018, 32, 321–341. [Google Scholar]
  46. Ghanian, M.; Ghoochani, O.M.; Dehghanpour, M.; Taqipour, M.; Taheri, F.; Cotton, M. Understanding farmers’ climate adaptation intention in Iran: A protection-motivation extended model. Land Use Policy 2020, 94, 104553. [Google Scholar] [CrossRef]
  47. Haghi, Z.; Yazdanpanah, M.; Abdshahi, A. Explaining the Factors Affecting Motivation of Farmers’ Participation in Water Users Association (Case Study: Great Karun-Shushtar Water User Association in Khuzestan Province). Geogr. Dev. Iran. J. 2020, 18, 109–128. [Google Scholar]
  48. CMA Software Video Examples. 2021. Available online: https://www.meta-analysis.com/ (accessed on 13 September 2021).
  49. Haji, L.; Valizadeh, N.; Rezaei-Moghaddam, K.; Hayati, D. Analyzing Iranian farmers’ behavioral intention towards acceptance of drip irrigation using extended technology acceptance model. J. Agric. Sci. Technol. 2020, 22, 1177–1190. [Google Scholar]
  50. Trumbo, C.W.; O’Keefe, G.J. Intention to conserve water: Environmental values, reasoned action, and information effects across time. Soc. Nat. Resour. 2005, 18, 573–585. [Google Scholar] [CrossRef]
  51. Nejadrezaei, N.; Allahyari, M.S.; Sadeghzadeh, M.; Michailidis, A.; El Bilali, H. Factors affecting adoption of pressurized irrigation technology among olive farmers in Northern Iran. Appl. Water Sci. 2018, 8, 190. [Google Scholar] [CrossRef] [Green Version]
  52. Rahimi Feyzabad, F.; Yazdanpanah, M.; Forouzani, M.; Mohammad Zadeh, S.; Burton, R.J.F. An investigation regarding the relationship between social capital and farmer’s tendency toward establishment and membership in water user associations of Aleshtar Township. Co-Oper. Agric. 2014, 3, 77–95. [Google Scholar]
  53. Mennatizadeh, M.; Zamani, G. Causal analysis of farmers’ water protective behaviors, case study: Khoram-Abad county. Iran Water Resour. Res. 2018, 14, 103–117. [Google Scholar]
  54. Cook, T.D.; Cooper, H.; Cordray, D.S.; Hartmann, H.; Hedges, L.V.; Light, R.J. Meta-Analysis for Explanation: A Casebook; Russell Sage Foundation: New York, NY, USA, 1992. [Google Scholar]
  55. Pigott, T.D. Advances in Meta-Analysis; Springer: New York, NY, USA, 2012. [Google Scholar]
  56. Borenstein, M.; Hedges, L.V.; Higgins, J.P.T.; Rothstein, H.R. Introduction to Meta-Analysis; John Wiley & Sons: Hoboken, NJ, USA, 2009. [Google Scholar]
  57. Karadağ, E.; Çiftçi, K.; Bektaş, F. Leadership and Organizational Outcomes. Meta-Analysis of Empirical Studies; Springer: Berlin/Heidelberg, Germany, 2015. [Google Scholar]
  58. Millsap, R.E.; Maydeu-Olivares, A. The SAGE Handbook of Quantitative Methods in Psychology; Sage Publications: Thousand Oaks, CA, USA, 2009. [Google Scholar]
  59. Gifford, R. Research Methods for Environmental Psychology; John Wiley & Sons: Hoboken, NJ, USA, 2016. [Google Scholar]
  60. Duval, S.; Tweedie, R. A nonparametric “trim and fill” method of accounting for publication bias in meta-analysis. J. Am. Stat. Assoc. 2000, 95, 89–98. [Google Scholar]
  61. Begg, C.B.; Mazumdar, M. Operating characteristics of a rank correlation test for publication bias. Biometrics 1994, 50, 1088–1101. [Google Scholar] [CrossRef] [PubMed]
Figure 1. Schematic illustration of theoretical framework using TPB.
Sustainability 14 00279 g001
Figure 2. Obtained studies in three rounds of Internet searching.
Sustainability 14 00279 g002
Figure 3. The funnel plot for the association between attitude and BI.
Sustainability 14 00279 g003
Figure 4. Funnel plot for the association between SNs and BI.
Sustainability 14 00279 g004
Figure 5. Funnel plot for the association between PBC and BI.
Sustainability 14 00279 g005
Figure 6. Funnel plot for the association between PBC and behavior.
Sustainability 14 00279 g006
Figure 7. Funnel plot for the association between intention and behavior.
Sustainability 14 00279 g007
Figure 8. Tested TPB.
Sustainability 14 00279 g008
Table 1. Phases of searching on the Internet with a variety of keywords.
PhaseKeywords for Search
The first round of searching“farmers” + “theory of planned behavior” + “intention” + “water conservation behavior”“farmers’ intention” + “intention to conserve water” + “water” + “attitude toward”
The second round of searching“farmers’ intention” + “intention” + “water” + “attitude” + “Social norm” + “PBC”
The third round of searching“producers” + “intention” + “water” + “theory of planned behavior”“correlation analysis” + “farmers” + “theory of planned behavior” + “water”
Table 2. Initial extracted information of attitude and behavioral intention ( n ATT BI = 20).
Independent VariablePathNo.Author(s)Sample Size (n)InstrumentReliability (Cronbach’ Alpha/CR/AVE)Statistics/(Direction)Measure (Format in CMA Software)
Attitude towards WCBATT → BI1Floress et al. [30]647Questionnaire α = 0.80 r, p (+)r = 0.22, p < 0.001
2Mohammadi et al. [23]300Questionnaire α = 0.79 r, p (+)r = 0.74, p < 0.01
3Aliabadi et al. [11]480Questionnaire α = 0.81, AVE = 0.62, CR = 0.71 r, p (+)r = 0.51, p < 0.001
4Khosravipour and Ghoochani [32]160Questionnaire α = 0.86 Mean, SD, r, p (+)r = 0.67, p < 0.01, mean = 42.91, SD = 7.46
5Abadi et al. [4]368Questionnaire α = 0.97 Mean, SD, r, p (+)r = 0.14, p < 0.01, mean = 3.08, SD = 0.98
6Tajeri Moghadam et al. [44]235Questionnaire α = 0.83 r, p (+)r = 0.50, p < 0.01
7Rahmani et al. [45]351Questionnaire α = 0.70 r, p (+)r = 0.34, p < 0.01
8Haji et al. [49]346Questionnaire α = 0.74, AVE = 0.58, CR = 0.73 r, p (+)r = 0.67, p < 0.01
9Gholamrezai and Sepahvand [31]133Questionnaire α = 0.83 Mean, SD, r, p (+)r = 0.02, p < 0.05, mean = 4.4, SD = 1.33
10Abadi [6]367Questionnaire α = 0.97 r, p (+)r = 0.32, p < 0.01
11Taqiopur et al. [42]230Questionnaire α = 0.73 r, p (+)r = 0.50, p < 0.01, mean = 4, SD = 0.97
12Razzaghi and Mirtorabi [28]220Questionnaire α > 0.70 t-value, mean, SDt-value = 10.60, R2 = 0.82, r = 0.90, mean = 11.83, SD = 1.75
13Trumbo and O’Keefe [50]405Telephone interview0.68 < α < 0.71 Mean, SD, r, p (+)r = 0.40, p < 0.05, mean = 6.2, SD = 1.5
14Bakhshi et al. [22]273Questionnaire α = 0.88 r (+)r = 0.53, p < 0.05
15Faisal et al. [40]405Questionnaire α = 0.85, AVE = 0.68, CR = 0.86 t-value, p, mean, SDt-value = 4.55, p < 0.0001, mean = 3.50, SD = 1.20
16Rahimi Faizabadi et al. [24]360Questionnaire α = 0.94 Mean, SD, r, p (+)r = 0.55, p < 0.01, mean = 16.79, SD = 3.45
17Durst [39]377Questionnaire α = 0.91 t-value, p, mean, SDt-value = 0.41, p < 0.68, mean = 1.96, SD = 1.02
18Yazdanpanah et al. [13]330Questionnaire0.60 < α < 0.90 Mean, SD (+)r = 0.84, mean = 12.94, SD = 7.5
19Dehghanpur and Zibaei [37]330Questionnaire0.70 < α < 0.90 r, p (+)r = 0.56, p < 0.001
20Haghi et al. [47]183Questionnaire α = 0.78 r, p (+)r = 0.37, p < 0.01
Table 3. Initial extracted information of SNs and behavioral intention ( n SNs BI = 18).
Independent VariablePathNo.Author(s)Sample Size (n)InstrumentReliability (Cronbach’ Alpha/CR/AVE)Statistics/(Direction)Measure (Format in CMA Software)
Subjective normsSNs → BI1Nejadrezaei et al. [51]210Questionnaire α = 0.65, AVE = 0.63, CR = 0.81 r, p (+)r = 0.19, p < 0.01
2Mohammadi et al. [23]300Questionnaire α = 0.82 r, p (+)r = 0.73, p < 0.01
3Tajeri Moghadam et al. [44]235Questionnaire α = 0.82 r, p (+)r = 0.59, p < 0.01
4Boazar et al. [10]250Questionnaire α = 0.68 r, p (+)r = 0.16, p < 0.05
5Rahimi Feyzabad et al. [52]360Questionnaire α = 0.75 r, p (+)r = 0.39, p < 0.01
6Gholamrezai and Sepahvand [31]133Questionnaire α = 0.86 Mean, SD, r (+)r = 0.01, p < 0.01, mean = 3.5, SD = 0.59
7Abadi [6]367Questionnaire α = 0.90 r, p (+)r = 0.16, p < 0.01
8Taqiopur et al. [42]230Questionnaire α = 0.70 r, p (+)r = 0.41, p < 0.01, mean = 3.79, SD = 1.01
9Trumbo and O’Keefe [50]405Telephone survey0.68 < α < 0.71 Mean, SD, r (+)r = 0.44, p < 0.05, mean = 5.6, SD = 1.6
10Bakhshi et al. [22]273Questionnaire α = 0.74 r, p (+)r = 0.26, p < 0.05
11Valizadeh et al. [36]380Questionnaire α = 0.83 r, p (+)r = 0.35, p < 0.01
12Valizadeh et al. [38]380Questionnaire α = 0.79 r, p (+)r = 0.51, p < 0.01
13Le Dang et al. [35]598Structured interviewAVE = 0.51, CR = 0.75r, p (+)r = 0.34, p < 0.001
14Faisal et al. [40]405Questionnaire α = 0.84, AVE = 0.50, CR = 0.79 t-value, mean, SDt-value = 5.51, p < 0.0001, mean = 2.67, SD = 1.43
15Rahimi Faizabadi et al. [24]360Questionnaire α = 0.71 Mean, SD, r (+)r = 0.40, p < 0.01, mean = 14.65, SD = 2.76
16Durst [39]377Questionnaire α = 0.94 t-value, mean, SDt-value = 5.70, p < 0.01, mean = 5.08, SD = 1.41
17Dehghanpur and Zibaei [37]330Questionnaire0.70 < α < 0.90 r (+)r = 0.50, p < 0.001
18Haghi et al. [47]183Questionnaire α = 0.88 r (+)r = 0.28, p < 0.01
Table 4. Initial extracted information of PBC and behavioral intention ( n PBC BI = 18) and PBC and WCB ( n PBC WCB = 11).
Independent VariablePathsNo.Author(s)Sample Size (n)InstrumentReliability (Cronbach’ Alpha/CR/AVE)Statistics/(Direction)Measure (Format in CMA Software)
PBCPBC → BI1Valizadeh et al. [38]380Questionnaire α = 0.82 r (+)r = 0.32, p < 0.01
2Yazdanpanah et al. [12]360Questionnaire α = 0.63 r (+)r = 0.61, p < 0.01
3Mennatizadeh and Zamani [53]310Questionnaire0.76 < α < 0.94 Mean, SD, r (+)r = 0.30, p < 0.01, mean = 1.10, SD = 0.80
4Mohammadi et al. [23]300Questionnaire α = 0.70 r, p (+)r = 0.45, p < 0.01
5Tajeri Moghadam et al. [44]235Questionnaire α = 0.84 r (+)r = 0.36, p < 0.01
6Rahmani et al. [45]351Questionnaire α = 0.90 r (+)r = 0.11, p < 0.05
7Boazar et al. [10]250Questionnaire α = 0.67 r (+)r = 0.15, p < 0.05
8Gholamrezai and Sepahvand [31]133Questionnaire α = 0.91 Mean, SD, r (+)r = 0.04, p < 0.05, mean = 3.5, SD = 0.59
9Abadi [6]367Questionnaire α = 0.90 r (+)r = 0.11, p < 0.05
10Taqiopur et al. [42]230Questionnaire α = 0.65 r (+)r = 0.55, p < 0.01, mean = 3.62, SD = 1.09
11Neisi et al. [27]350Questionnaire α = 0.95 r (+)r = 0.16, p < 0.01
12Valizadeh et al. [36]380Questionnaire α = 0.84 r (+)r = 0.23, p < 0.01
13Faisal et al. [40]405Questionnaire α = 0.84, AVE = 0.54, CR = 0.84 Mean, SD, t-valuet-value = 4.14, p < 0.0001, mean = 3.18, SD = 1.54
14Rahimi Faizabadi et al. [24]360Questionnaire α = 0.94 Mean, SD, r (–)r = −0.47, p < 0.01, mean = 6.35, SD = 3.05
15Durst [39]377Questionnaire α = 0.91 Mean, SD, t-valuet-value = 5.65, p < 0.01, mean = 1.96, SD = 1.02
16Dehghanpur and Zibaei [37]330Questionnaire0.70 < α < 0.90 r (+)r = 0.50, p < 0.001
17Delfiyan et al. [43]320Questionnaire α = 0.71 r (+)r = 0.45, p < 0.01
18Haghi et al. [47]183Questionnaire α = 0.81 r (+)r = 0.27, p < 0.01
PBC → WCB1Abadi et al. [4]368Questionnaire α = 0.86 r (+)r = 0.35, p < 0.01
2Abadi [6]367Questionnaire α = 0.97 r (+)r = 0.35, p < 0.01
3Taqiopur et al. [42]230Questionnaire α = 0.65 r (+)r = 0.39, p < 0.01
4Rahimi Faizabadi et al. [24]360Questionnaire α = 0.93 r (–)r = −0.51, p < 0.01
5Nejadrezaei et al. [51]210Questionnaire α = 0.88, AVE = 0.74, CR = 0.92 r (+)r = 0.42, p < 0.05
6Valizadeh et al. [36]380Questionnaire α = 0.73 r (+)r = 0.41, p < 0.01
7Yazdanpanah et al. [12]360Questionnaire α = 0.63 r (+)r = 0.49, p < 0.01
8Neisi et al. [27]350Questionnaire α = 0.72 r (+)r = 0.22, p < 0.01
9Mennatizadeh and Zamani [53]310Questionnaire0.76 < α < 0.94 r (+)r = 0.33, p < 0.01
10Delfiyan et al. [43]320Questionnaire α = 0.65 r (+)r = 0.12, p < 0.01
11Valizadeh et al. [38]380Questionnaire α = 0.85 r (+)r = 0.43, p < 0.01
Table 5. Initial extracted information of BI and WCB ( n BI WCB = 16).
Independent VariablePathNo.Author(s)Sample Size (n)InstrumentReliability (Cronbach’ Alpha/CR/AVE)Statistics/(Direction)Measure (Format in CMA Software)
Behavioral intentionBI → WCB1Abadi et al. [4]368Questionnaire α > 0.70 r (+)r = 0.19, p < 0.01
2Abadi [6]367Questionnaire α = 0.97 r (+)r = 0.22, p < 0.01
3Tajeri Moghadam et al. [44]235QuestionnaireCR = 0.82, AVE = 0.62r (+)r = 0.82, p < 0.01
4Rahmani et al. [45]351Questionnaire α = 0.70 r (+)r = 0.22, p < 0.01
5Taqiopur et al. [42]230Questionnaire α = 0.86 r (+)r = 0.61, p < 0.01
6Razzaghi and Mirtorabi [28]220Questionnaire α > 0.70 t-value, mean, SDt-value = 7.96, p < 0.01, r = 0.76
7Bakhshi et al. [22]273Questionnaire α = 0.86 r (+)r = 0.63, p < 0.05
8Rahimi Faizabadi et al. [24]360Questionnaire α = 0.93 Mean, SD, r (+)r = 0.41, p < 0.01, mean = 23.26, SD = 5.05
9Yazdanpanah et al. [13]330Questionnaire0.60 < α < 0.90 Mean, SD, r (+)r = 0.71, p < 0.0001
10Nejadrezaei et al. [51]210Questionnaire α = 0.88, AVE = 0.74, CR = 0.92 r (+)r = 0.44, p < 0.05, t-value = 4.008, p < 0.001
11Valizadeh et al. [36]380Questionnaire α = 0.73 r (+)r = 0.59, p < 0.01
12Yazdanpanah et al. [12]360Questionnaire α = 0.76 r (+)r = 0.55, p < 0.01
13Neisi et al. [27]350Questionnaire α = 0.72 r (+)r = 0.54, p < 0.01
14Mennatizadeh and Zamani [53]310Questionnaire0.76 < α < 0.94 r (+)r = 0.68, p < 0.01
15Delfiyan et al. [43]320Questionnaire α = 0.65 r (+)r = 0.31, p < 0.01
16Valizadeh et al. [38]380Questionnaire α = 0.85 r (+)r = 0.55, p < 0.01
Note. CR: composite reliability, AVE: extracted variance explained, ATT: attitude, SNs: social norms, PBC: perceived behavioral control, CR > AVE.
Table 6. Results of heterogeneity tests.
HypothesisQ-Valuep-ValueI2Tau2St. ErrorConfirmed HeterogeneityFEM/REM
ATT → BI563.370.000196.620.0900.032YesREM
SNs → BI203.900.000191.660.0350.014YesREM
PBC → BI406.840.000195.820.0740.027YesREM
PBC → WCB323.720.000196.910.0960.045YesREM
BI → WCB317.850.000195.280.0650.025YesREM
Note FEM: fixed-effect model, REM: random-effect model. St. Error: standard error.
Table 7. Results of hypothesis testing.
PathsPredictionCorrelationLLULp-Value
ATT → BI+0.460.3550.5640.0001
SNs → BI+0.360.2830.4400.0001
PBC → BI+0.260.1440.3830.0001
PBC → WCB+0.270.0990.4400.0001
BI → WCB+0.520.4200.6070.0001
Note LL: lower limit (CI = 95%), UL: upper limit (CI = 95%).
Table 8. Results of publication bias, fail-safe N test.
PathskdfZ-ValueStatistic in Fail-Safe N Test *
ATT → BI20197.3937987
SNs → BI18178.2683890
PBC → BI18174.1671887
PBC → WCB11103.007800
BI → WCB16158.8306629
Note: k is the number of observed studies. * Number of required missing studies that would nullify the estimated effect size, making the p-value greater than the alpha error ( α = 0.05) df = k − 1.
Table 9. Results of rank correlation test.
PathsKendall’s S Statistic (P-Q)KT without CCKT with CCNo Publication Bias (Y/N)
TauZ-ValueTauZ-Value
ATT → BI480.2521.5570.2471.524N
SNs → BI14−0.0910.530−0.0840.492N
PBC → BI170.1110.6430.1040.606N
PBC → WCB80.1480.6220.1290.544N
BI → WCB230.1911.0350.1830.990N
Note: KT without CC: Kendall’s tau without continuity correction; KT with CC: Kendall’s tau with continuity correction; Y: yes; N: no.
Publisher’s Note: MDPI stays neutral with regard to jurisdictional claims in published maps and institutional affiliations.

