Article

Biochar Phosphate Fertilizer Loaded with Urea Preserves Available Nitrogen Longer than Conventional Urea

by
Cristiane Francisca Barbosa
,
Dehon Aparecido Correa
,
Jefferson Santana da Silva Carneiro
and
Leônidas Carrijo Azevedo Melo
*
Soil Science Department, School of Agricultural Science, Federal University of Lavras, Lavras 37200-900, MG, Brazil
*
Author to whom correspondence should be addressed.
Sustainability 2022, 14(2), 686; https://doi.org/10.3390/su14020686
Submission received: 25 November 2021 / Revised: 29 December 2021 / Accepted: 6 January 2022 / Published: 9 January 2022

Abstract

:
Biochar, a carbon-rich material obtained by pyrolysis of organic wastes, is an attractive matrix for loading nutrients and producing enhanced efficiency fertilizers. In this study, poultry litter (PL) was enriched with phosphoric acid (H3PO4) and MgO to produce a biochar-based fertilizer (PLB), which was loaded with urea in a 4:5 ratio (PLB:urea, w/w) to generate a 15–15% N–P slow-release fertilizer (PLB–N) to be used in a single application to soil. A greenhouse experiment was carried out in which a common bean was cultivated followed by maize to evaluate the agronomic efficiency and the residual effect of fertilization with PLB–N in Ultisol. Six treatments were tested, including four doses of N (100, 150, 200, and 250 mg kg−1) via PLB–N in a single application, a control with triple superphosphate (TSP—applied once) and urea (split three times), and a control without N-P fertilization. The greatest effect of PLB–N was the residual effect of fertilization, in which maize showed a linear response to the N doses applied via PLB–N but showed no response to conventional TSP + urea fertilization. Biochar has the potential as a loading matrix to preserve N availability and increase residual effects and N-use efficiency by plants.

1. Introduction

Soil fertilization is a key factor for agricultural production, both in quality and quantity. Among the nutrients, nitrogen (N) is the most widely applied to maintain soil fertility and crop growth [1]. Synthetic N fertilizer has been a critical component of agriculture, currently accounting for more than 50% of world food production [2,3], while its deficiency results in reduced productivity and losses in production systems [4]. Conversely, N overload leads to environmental pollution and threatens agricultural productivity, food security, and human health [3].
More than 50% of synthetic N fertilizers added to soil are lost through leaching, denitrification, or volatilization [3,5], which negatively impacts the environment. The main factors responsible for these losses include the low N retention capacity of soil, mineralization, and the spatial and temporal incompatibility between the application of fertilizers and crop N demand [6]. These losses collectively cause low N-use efficiency [7] and contribute to low economic efficiency by increasing agricultural production costs [8]. Nitrogen losses can be minimized through some strategies that include the use of enhanced efficiency fertilizers (EEFs) [9].
Various types of EEFs have emerged, including those that use biochar as a support material for nutrient loading [1,10,11]. Biochar is a carbonaceous material obtained from pyrolysis of wood biomass, vegetables, or animal waste at moderate temperatures (350–700 °C) [12]. The stable carbon (C) fraction, surface area, porosity, and functional groups are favorable characteristics of biochar to retain nutrients [12,13,14], which makes it attractive as a fertilizer enhancer.
Biochar-based N fertilizers are promising for sustainable agricultural development, mitigating N losses and increasing soil C stocks [15]. In a recent study, Saha et al. [8] showed that mixing and granulating biochar with urea substantially increased N retention from the fertilizer in the soil, reducing NH3 emissions and N leaching compared with urea alone. Scanning electron microscopy (SEM) and energy-dispersive X-ray spectroscopy (EDX) have shown that the coarse and porous microstructure of biochar can effectively absorb NO3, PO43−, and K+ and form biochar impregnated with these nutrients [11]. Puga et al. [15] used acidified biochar (pH ~3) as an additive for coating urea granules and observed a significant reduction in NH3 volatilization. Shi et al. [16] developed a biochar-mineral urea composite and observed that the release rate of N decreased and the shoots and roots of maize were higher than those of conventional urea, which was attributed to the N retention on the biochar/mineral surfaces and by C bonds from urea to the biochar.
Biochar enriched with P sources was shown to greatly improve C stability [17,18] and showed increased plant P use efficiency in highly weathered soils [19,20]. The addition of MgO with acid P sources reduced the acidity and P water solubility but resulted in similar solubility in citric acid and neutral ammonium citrate + water (NAC + H2O) to triple superphosphate (TSP) [20], which has favorable use in P-fixing tropical soils [19].
The combination of poultry litter with H3PO4 and MgO prior to pyrolysis increases the specific surface area [17] and increases the cation exchange capacity in the resulting biochar [21]. These characteristics favor biochar as a potential carrier of urea N to enhance the efficiency of N–P fertilizers for crops, which might allow a reduction in the frequency of urea application while increasing the N-use efficiency. In this study, we hypothesized that biochar enriched with phosphate and loaded with urea will provide greater N-use efficiency by plants from a single application with a higher residual effect of N and P fertilization for the subsequent crop. The aim of this study was to load urea into a biochar phosphate fertilizer aiming to develop an enhanced efficiency nitrogen and phosphorus fertilizer, which was tested in a greenhouse with a single application for the cultivation of common bean followed by cultivation of maize to evaluate the agronomic efficiency and residual effect of fertilization in Ultisol.

2. Materials and Methods

2.1. Production and Characterization of Biochar-Based Fertilizers

The biochar used in this study was produced from poultry litter collected from a farm near Lavras, Minas Gerais, Brazil (44°58′31″ W). Air-dried and milled (<1 mm) poultry litter was impregnated with phosphoric acid (H3PO4) + MgO. Phosphorus and Mg were mixed in a molar ratio of 1:1 and the feedstock:phosphate ratio was 1:0.5 (w/w). Thereafter, the P-enriched biomass was placed in a hermetically sealed metal reactor (model SPPT-V60) for pyrolysis at 500 °C at a heating rate of 10 °C min−1 and 2 h of holding time for complete carbonization. After pyrolysis, poultry litter biochar (PLB) remained in the reactor until it reached room temperature (~16 h). The produced biochar was identified as PLB and represents poultry litter biochar treated with phosphoric acid and MgO.
Electrical conductivity (EC) and pH were measured in triplicate using 1.0 g of biochar in 20 mL of deionized water and after 1.5 h of shaking [22]. The elemental composition of C was measured in duplicate using an elemental analyzer (model Vario TOC cube, Elementar, Hanau, Germany). The total nutrient content was determined after burning for 8 h at 500 °C in a muffle furnace followed by digestion with nitric acid (HNO3) at 120 °C. Hydrogen peroxide (H2O2) was added at the end of digestion to oxidize organic C [23]. Subsequently, the digested material was dissolved in 20 mL of 5% (v/v) HNO3 solution. Water-soluble P contents, citric acid-soluble P, and neutral ammonium citrate (NAC) + H2O-soluble P were determined according to official P fertilizer methods as described in [24]. The contents of P and Mg and the P fractions in the fertilizer were quantified by ICP–OES (Model Blue, Kleve, Germany).

2.2. Production of Biochar-Based Phosphate Fertilizer Enriched with Urea

PLB was impregnated with N as described in [11]. Briefly, a solution containing N from the dissolution of urea (CO(NH2)2, 45% N) in deionized water was prepared and added to PLB at a 4:5 (w/w) ratio (PLB:urea). The mixture was stirred for 2 h on a bench-top shaker at 100 rpm and then dried at room temperature. The biochar-based phosphate fertilizer enriched with N was thereafter named PLB–N. Urea was selected as a source of N because it is the most commonly used N fertilizer due to its high N content and lower cost when compared with other N sources [25].

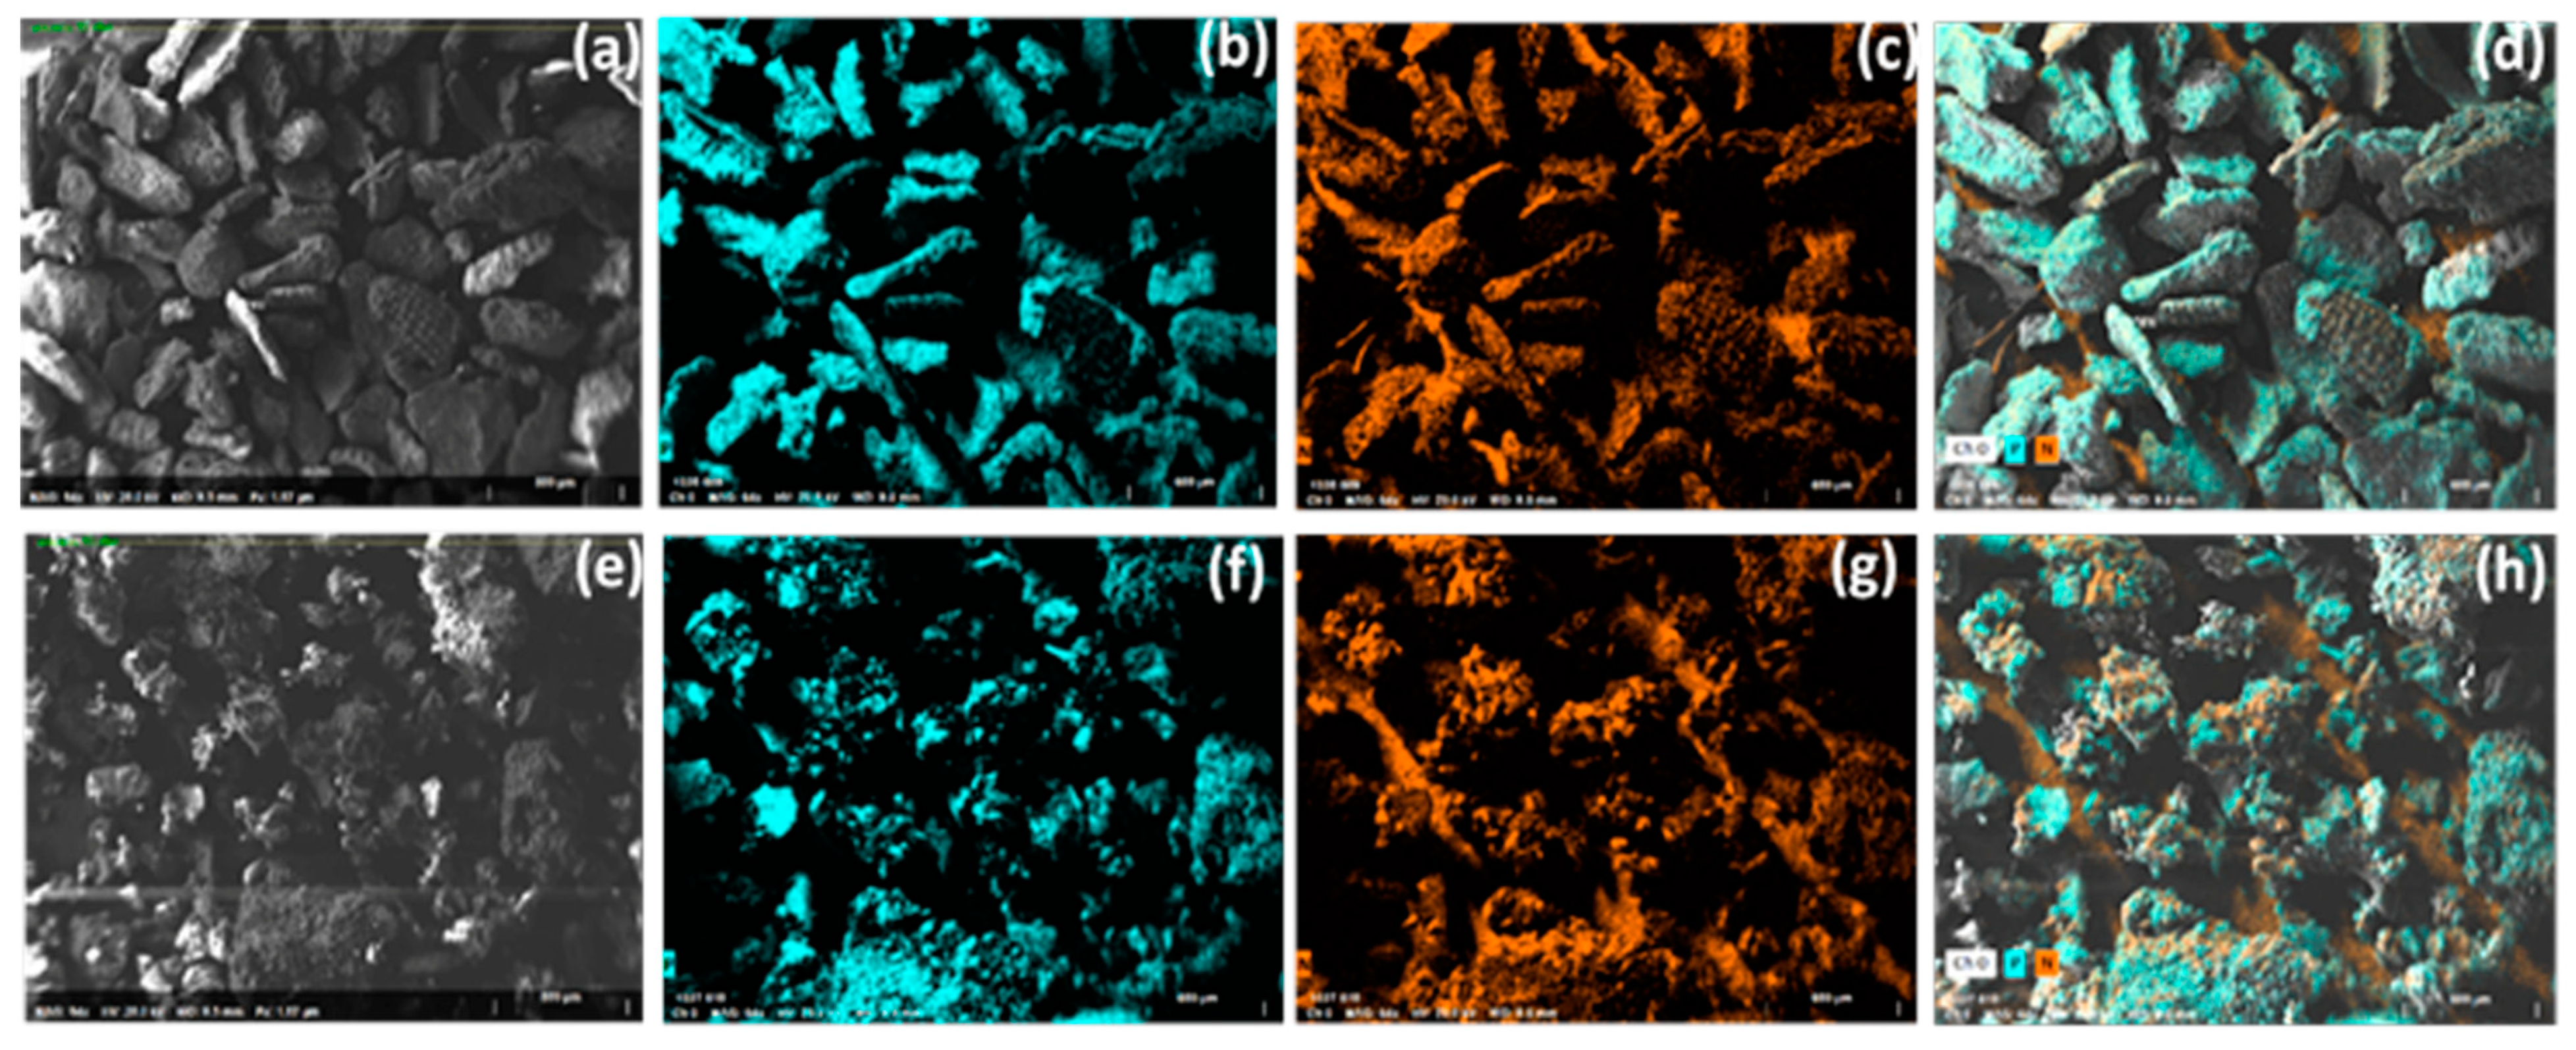
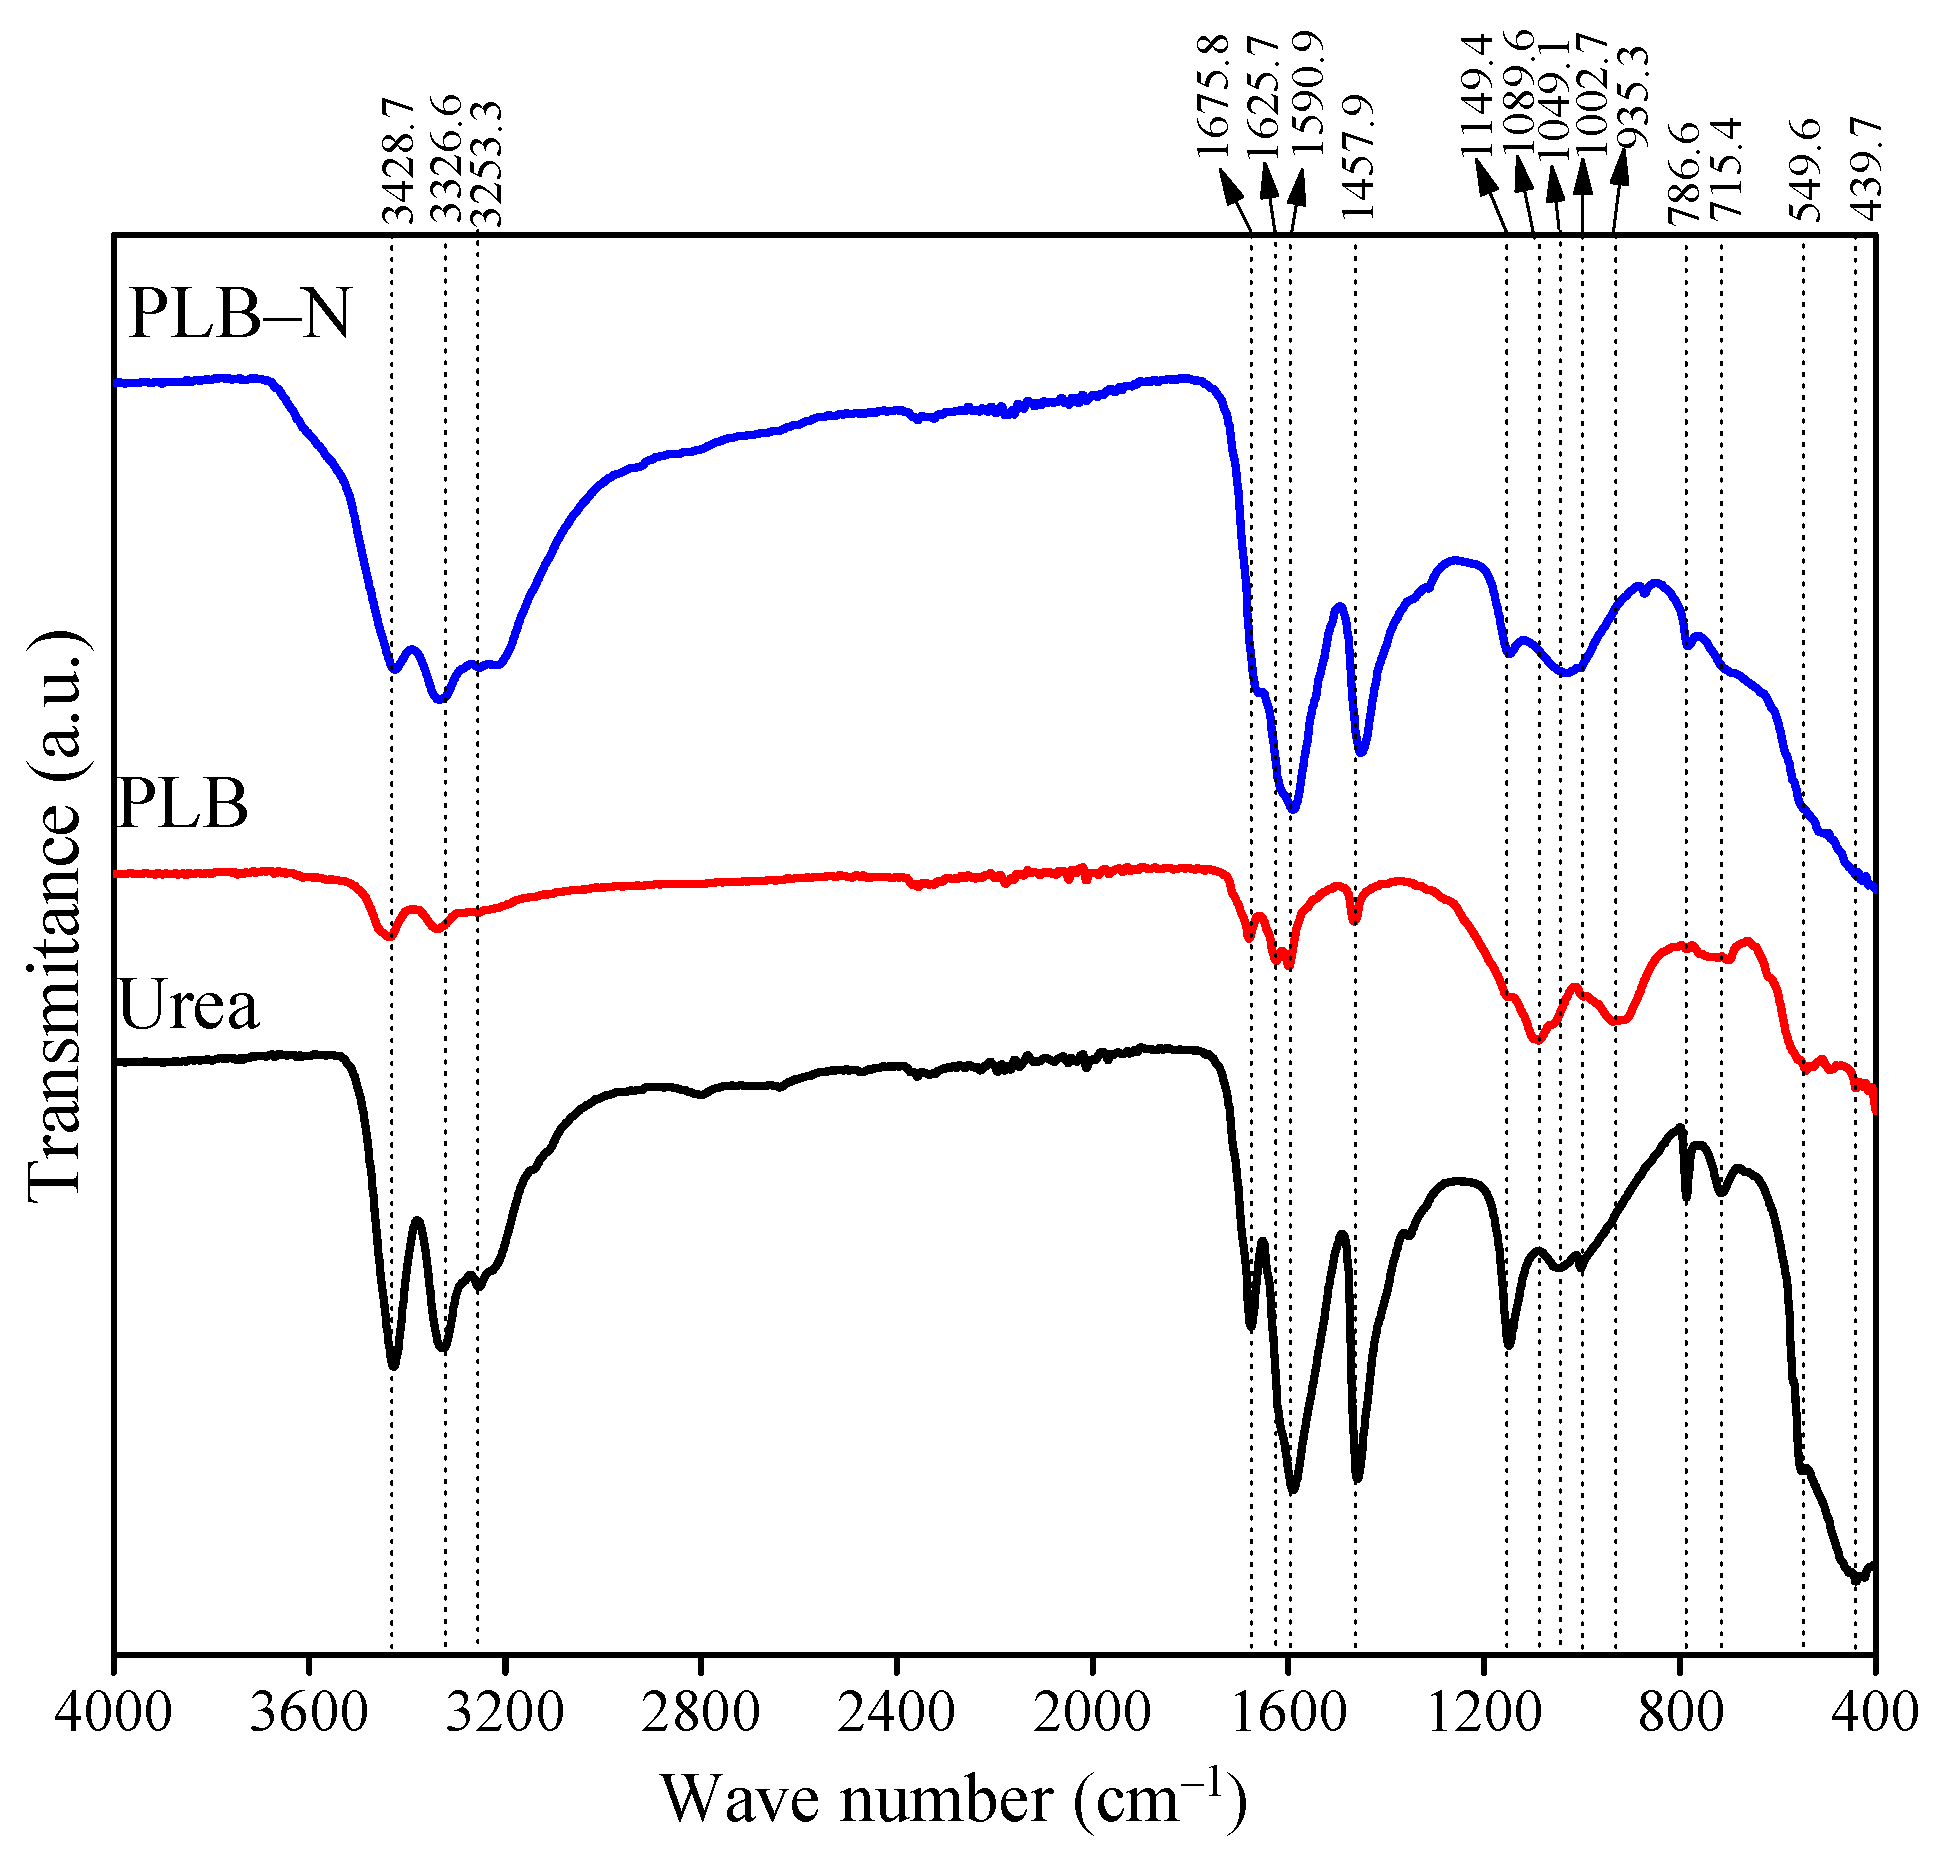
2.3. Scanning Electron Microscopy (SEM), Energy-Dispersive X-ray Spectroscopy (EDX) and Fourier Transform Infrared (FTIR) Spectroscopic Characterization Analysis

The microscopic and morphological characteristics were characterized by scanning electron microscopy (SEM) (LEO EVO 40 XVP-Carl Zeiss) equipped with energy-dispersive X-ray spectroscopy (Brunker-Quantax EDX). The samples were dried and coated with carbon prior to measurements using the SEM detector at 100×, 500×, and 1000× magnifications. Fourier transform infrared (FTIR) spectroscopic characterization of urea and PLB was performed before and after urea impregnation with a Varian 600-IR spectrometer with a spectral range of 4000–400 cm−1. Oven-dried samples were ground to a powder, and FTIR spectra with a resolution of 4 cm−1 were collected over an average of 32 scans.

2.4. Greenhouse Pot Experiment

2.4.1. Soil Samples and Preparation

Samples of Argissolo Amarelo (Ultisol) were collected from the top layer (0–30 cm) in a cultivated area after liming on a farm at Country Pimenta in Lavras, Minas Gerais, MG, Brazil (21°16′14″ S and 45°04′07″ W). The soil sample was collected 90 days after the correction of soil acidity with dolomitic limestone, aiming to raise the base saturation to 70%. After collection, the soil sample was air-dried and passed through a 2 mm mesh sieve for chemical and textural analysis [26]; its properties after liming are presented in Table 1.
Finally, 3 kg of air-dried homogenized soil samples were placed in pots (3 L) and fertilized with a nutrient solution with soluble sources to provide the following nutrients and respective contents (in mg kg−1): K, S, Zn, Mn, Fe, Cu, B, and Mo, applied at 100, 40, 4.0, 3.66, 1.55, 1.33, 0.81, and 0.15, following recommendations for pot experiments with plants [27].

2.4.2. Experimental Design and Plant Growth

The experiment was carried out in a completely randomized design with four replications and the pots were randomly reallocated every week. Six treatments were studied, including four doses of N (100, 150, 200, and 250 mg kg−1) via PLB–N that supplied 60, 90, 120, and 150 mg kg−1 of P soluble in NAC+H2O, respectively, a control with triple superphosphate (200 mg kg−1 of P soluble in NAC+H2O) + urea (200 mg kg−1 of N), and a control without P and N fertilization. The doses of N and P via PLB–N fertilizer were fully applied in powder form and incorporated into the entire volume of the soil before sowing. In the conventional fertilizer control, the dose of urea was applied as a solution and split into three fertilizations: 50 mg kg−1 at sowing and 75 mg kg−1 at 15 and 30 days after sowing.
Two successive cultivations were carried out as follows: in the first planting, five bean seeds (Phaseolus vulgaris L., cv BRSMG UAI) were sown in each pot and thinned seven days after emergence, keeping two plants per pot; these plants were grown for forty-five days between December 2018 and January 2019. In the second cultivation, five maize seeds (Zea mays) were sown in each pot and thinned seven days after emergence, leaving one plant per pot, which was grown for fifty days between February and March 2019. All nutrients were supplied as described only before the first cultivation. The greenhouse was supplied only with natural light and the temperature was kept below 35 °C.

2.4.3. Plant and Soil Analysis

After each growth cycle of the beans and maize, the plants were cut at 1 cm above the soil surface and rinsed with deionized water. The plant materials were oven-dried at 65 °C until weight stabilization (~72 h), and the shoot dry mass (SDM) was recorded before grinding in a mill. The N content was determined by the Kjeldahl method [28]. A sample (0.5 g) of plant material was digested in a block digestion system using a concentrated nitric-perchloric acid mixture [29], and the P in the extract was measured by ICP–OES (Model Blue, Germany). The N and P uptake were estimated by multiplying the N or P concentration by the respective shoot dry mass productivity. The relative agronomic effectiveness (RAE) was calculated by comparing the plants used in each treatment to the plants treated with the reference fertilizer (urea), which was added at the same fertilization dose, using the following equation:
RAE   ( % ) = ( N PLB - N N urea )   ×   100
where NPLB-N is the dry matter production by plants in a given PLB–N fertilization treatment (g plant−1) and Nurea is the dry matter production by plants in the reference treatment (urea).
After each cultivation, 30 g of soil was collected from each pot to determine the pH in water, electrical conductivity (EC), available resin P [30], which was determined using molecular absorption spectrophotometry [31], and the inorganic forms of N, ammonium (NH4+) and nitrate (NO3), which were determined by distillation [32].

2.5. Statistical Analysis

All greenhouse data were checked for normal distribution with the Shapiro–Wilk test before further analysis. Subsequently, the data were subjected to analysis of variance (ANOVA), and when significant (p < 0.05) (Table S1, Supplementary Materials), the means were compared using the Scott–Knott test (p < 0.05), and the N doses were adjusted to linear regression models. All statistical analyses were performed using SISVAR software [33].

3. Results and Discussion

3.1. Properties of the Biochar-Based Fertilizers

The selected properties of PL and PLB are shown in Table 2. The pyrolysis of PL enriched with H3PO4 + MgO caused a decrease in the pH of the PLB (from 8.3 in PL to 6.1 in PLB). Normally, pristine pure PL biochar tends to be highly alkaline (pH~11), and when it was impregnated with H3PO4 in combination with MgO, the acidity of the P source was neutralized [17,21]. The total P content increased considerably with the impregnation of H3PO4 and MgO (Table 2), reaching values as high as those in conventional P fertilizers.
The P solubility in citric acid and NAC + H2O in PLB corresponded to 44.4% and 86.6%, respectively, of the total P, while the water-soluble P of PLB was very low (3.7%) (Table 1). During pyrolysis, several reactions between P, Ca, and Mg take place, forming insoluble P compounds such as calcium pyrophosphates (Ca2P2O7) and magnesium pyrophosphates (Mg2P2O7) [21]. In addition, reactions between C and P might also occur during pyrolysis and form stable P structures such as C–O–P or C–P bonds [18].
Reducing the solubility of P in water without decreasing the solubility in NAC + H2O could be a particularly beneficial strategy for P-fixing soils [20] since the availability of inorganic P is limited by rapid immobilization by the mineral fraction rich in iron (Fe) and aluminum (Al) oxides [35,36].

3.2. Scanning Electron Microscopy (SEM) and Energy-Dispersive X-ray Spectroscopy (EDX) Analysis

The structure of the PLB surface before and after urea impregnation was characterized by scanning electron microscopy (SEM), and the results are shown in Figure 1. The PLB surface was rough and porous (Figure 1a–c), while after impregnation with urea, the surface of the particles was coated with urea, and the pores were filled (Figure 1d–f). The urea solubilized in water managed to infiltrate the pores of the biochar surface and even formed a coating layer on the surface.
Pores are formed by the decomposition of organic macromolecules and give PLB the ability to accommodate urea molecules [37]. The physical characteristics of biochar such as the number of pores, pore layout, and specific surface area are influenced by the raw material and affect the availability of nutrients in soil [38]. Furthermore, the co-pyrolysis of PL with H3PO4 + MgO increases the surface area and small pores [17] that can potentially promote the link between urea and surface functional groups through chemical reactions.
Energy-dispersive X-ray spectroscopy (EDS) of PLB and PLB–N confirmed that there was, potentially, an impregnation of P in the pre-pyrolysis of the poultry litter (Figure 2b,f). In fact, the comparison of the EDX spectra for PLB (Figure 2e) and PLB–N (Figure 2d,h) shows the successful impregnation of PLB with N. The FTIR results showed that urea interacted with the biochar by reactions with the PLB carboxyl and phenolic groups (Figure 3). The reduced peak intensities and displaced carboxyl and phenolic groups indicate urea loading and the absence of other forms of N (for example, NH4+–N or NH3–N) in the PLB–N structure.
After loading with urea, PLB–N showed absorption bands characteristic of urea at 3428.7 to 3253.3 cm−1, and the doublet was characteristic of primary amides in the NH2 group. The band at 1675.8 cm−1 was characteristic of amide carbonyl; the band at 1675.8 cm−1 was characteristic of amyl carbonyl. The peak at 1625.7 cm−1 was evidence of another common fold in primary amides, which is associated with the C=O bond of the urea molecule, and the bands at 1457.9 and 1149 cm−1 were related to C–N axial deformation [39].

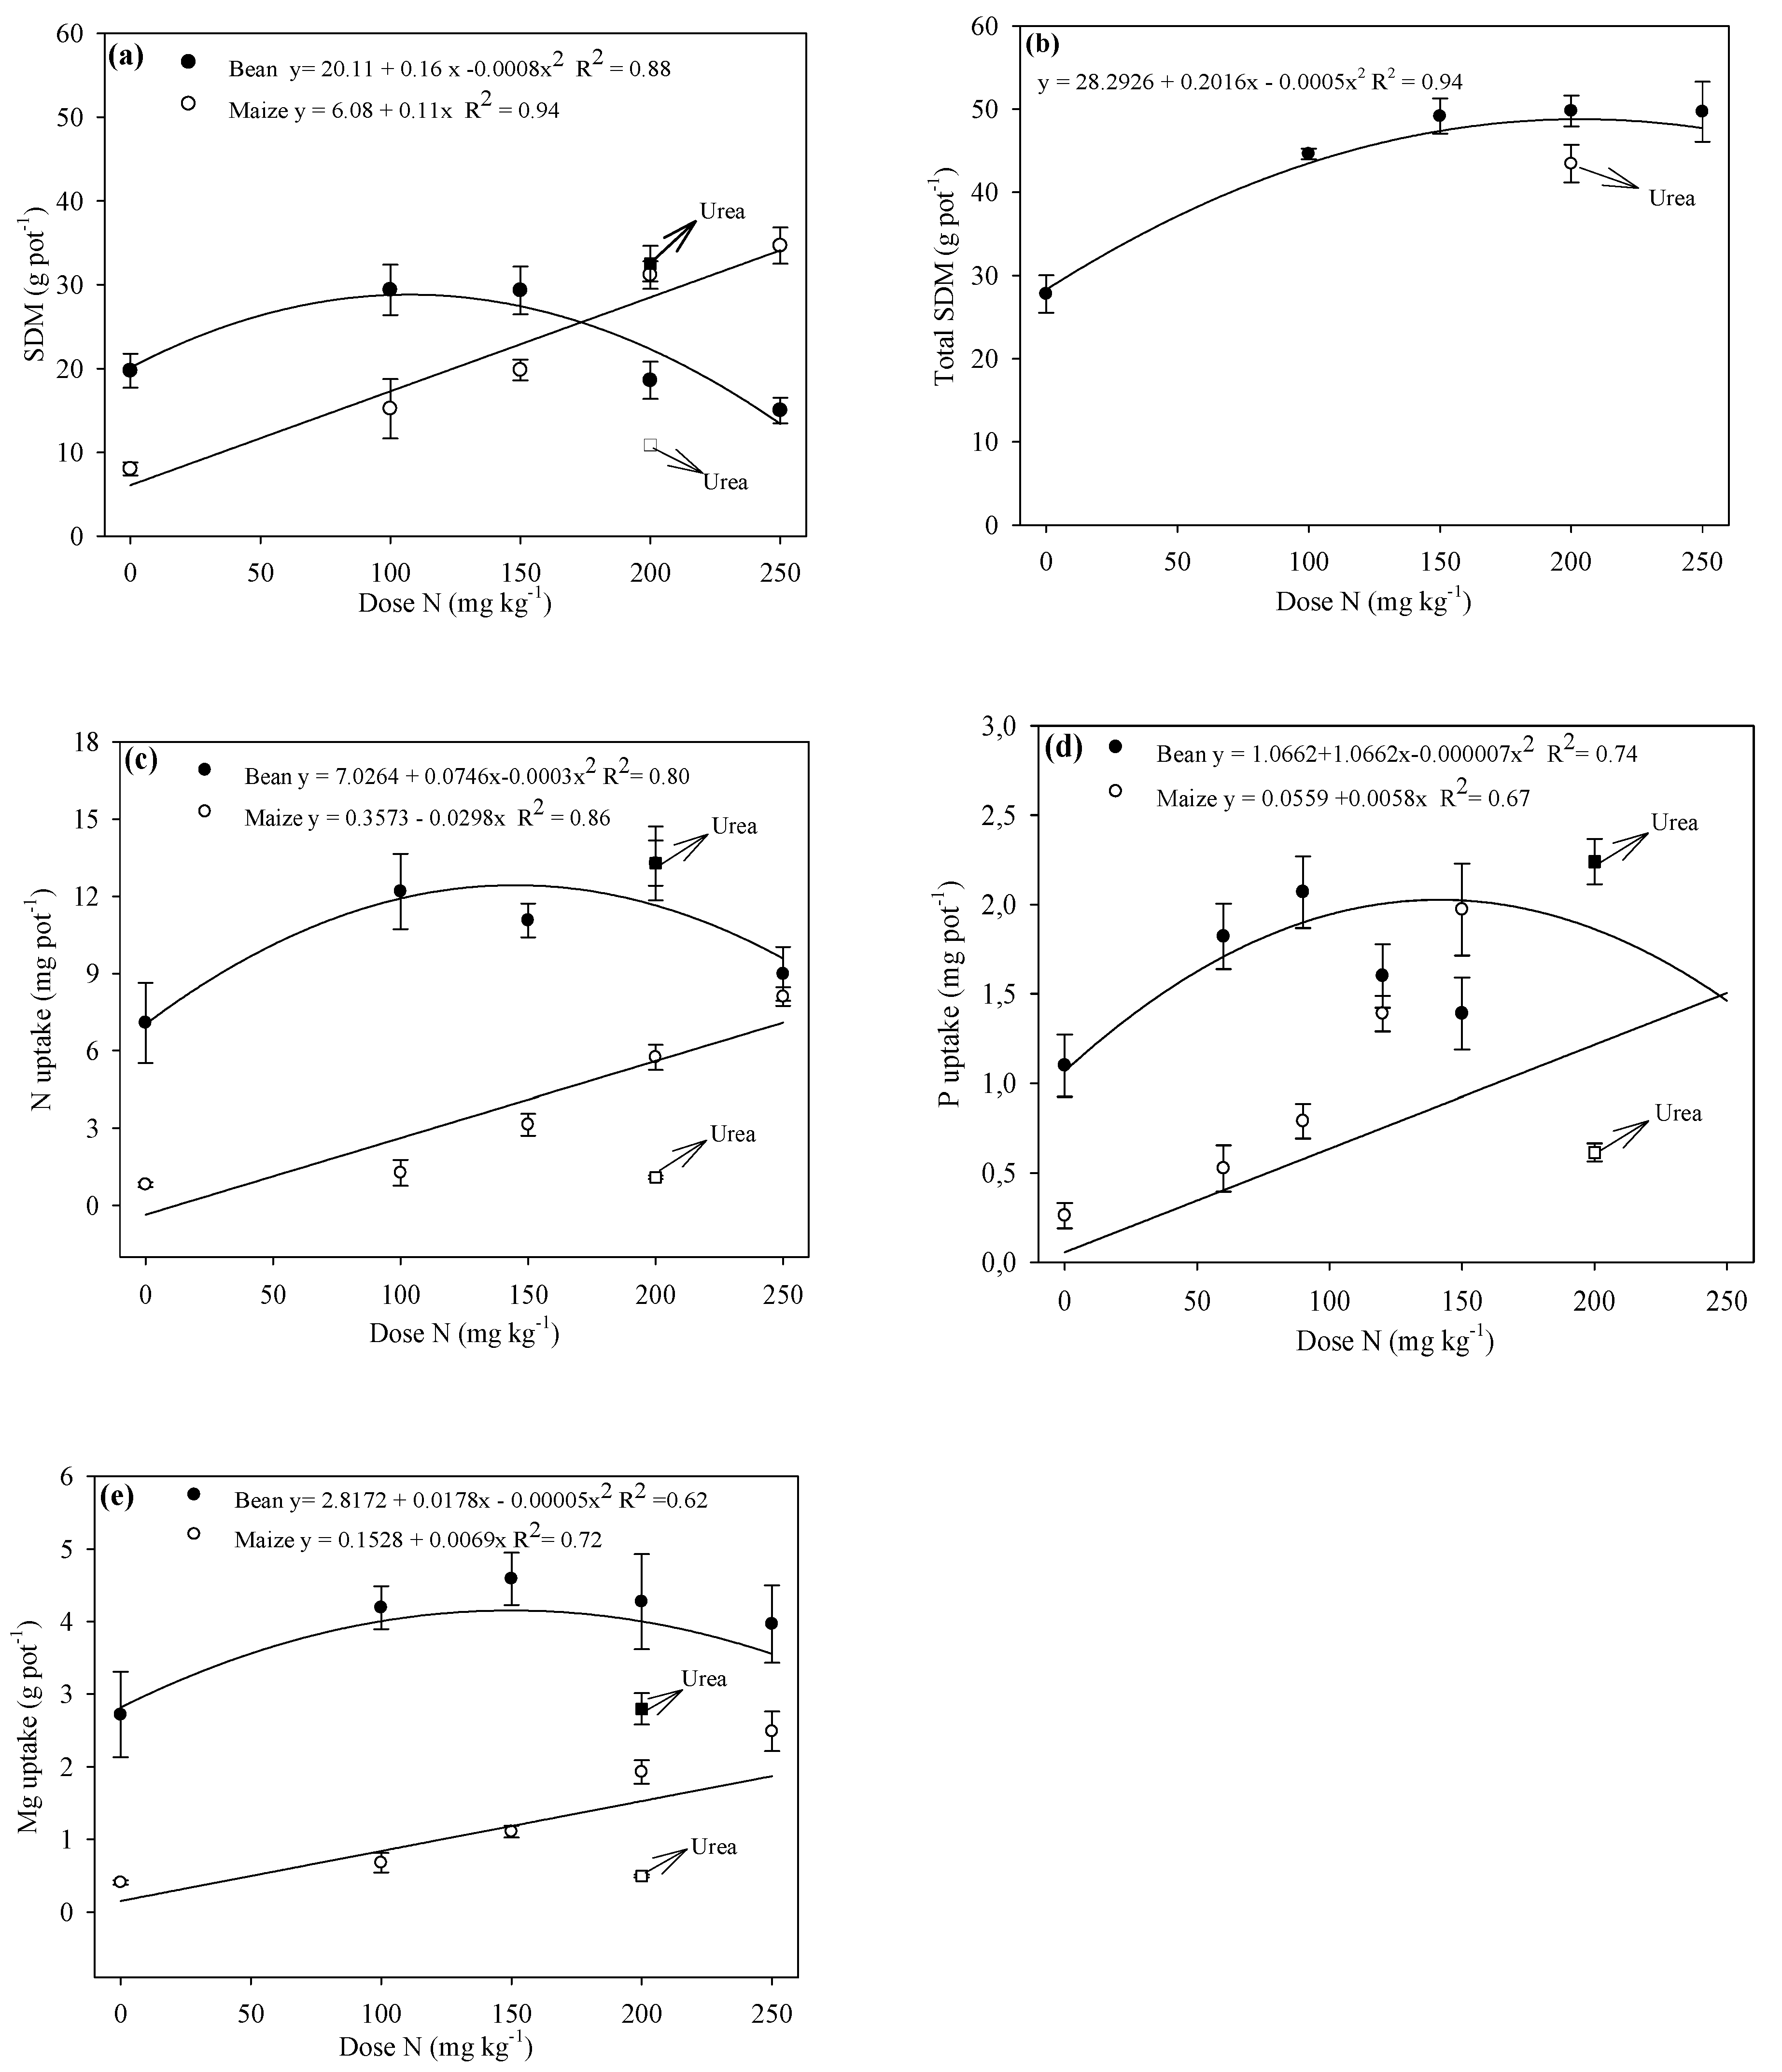
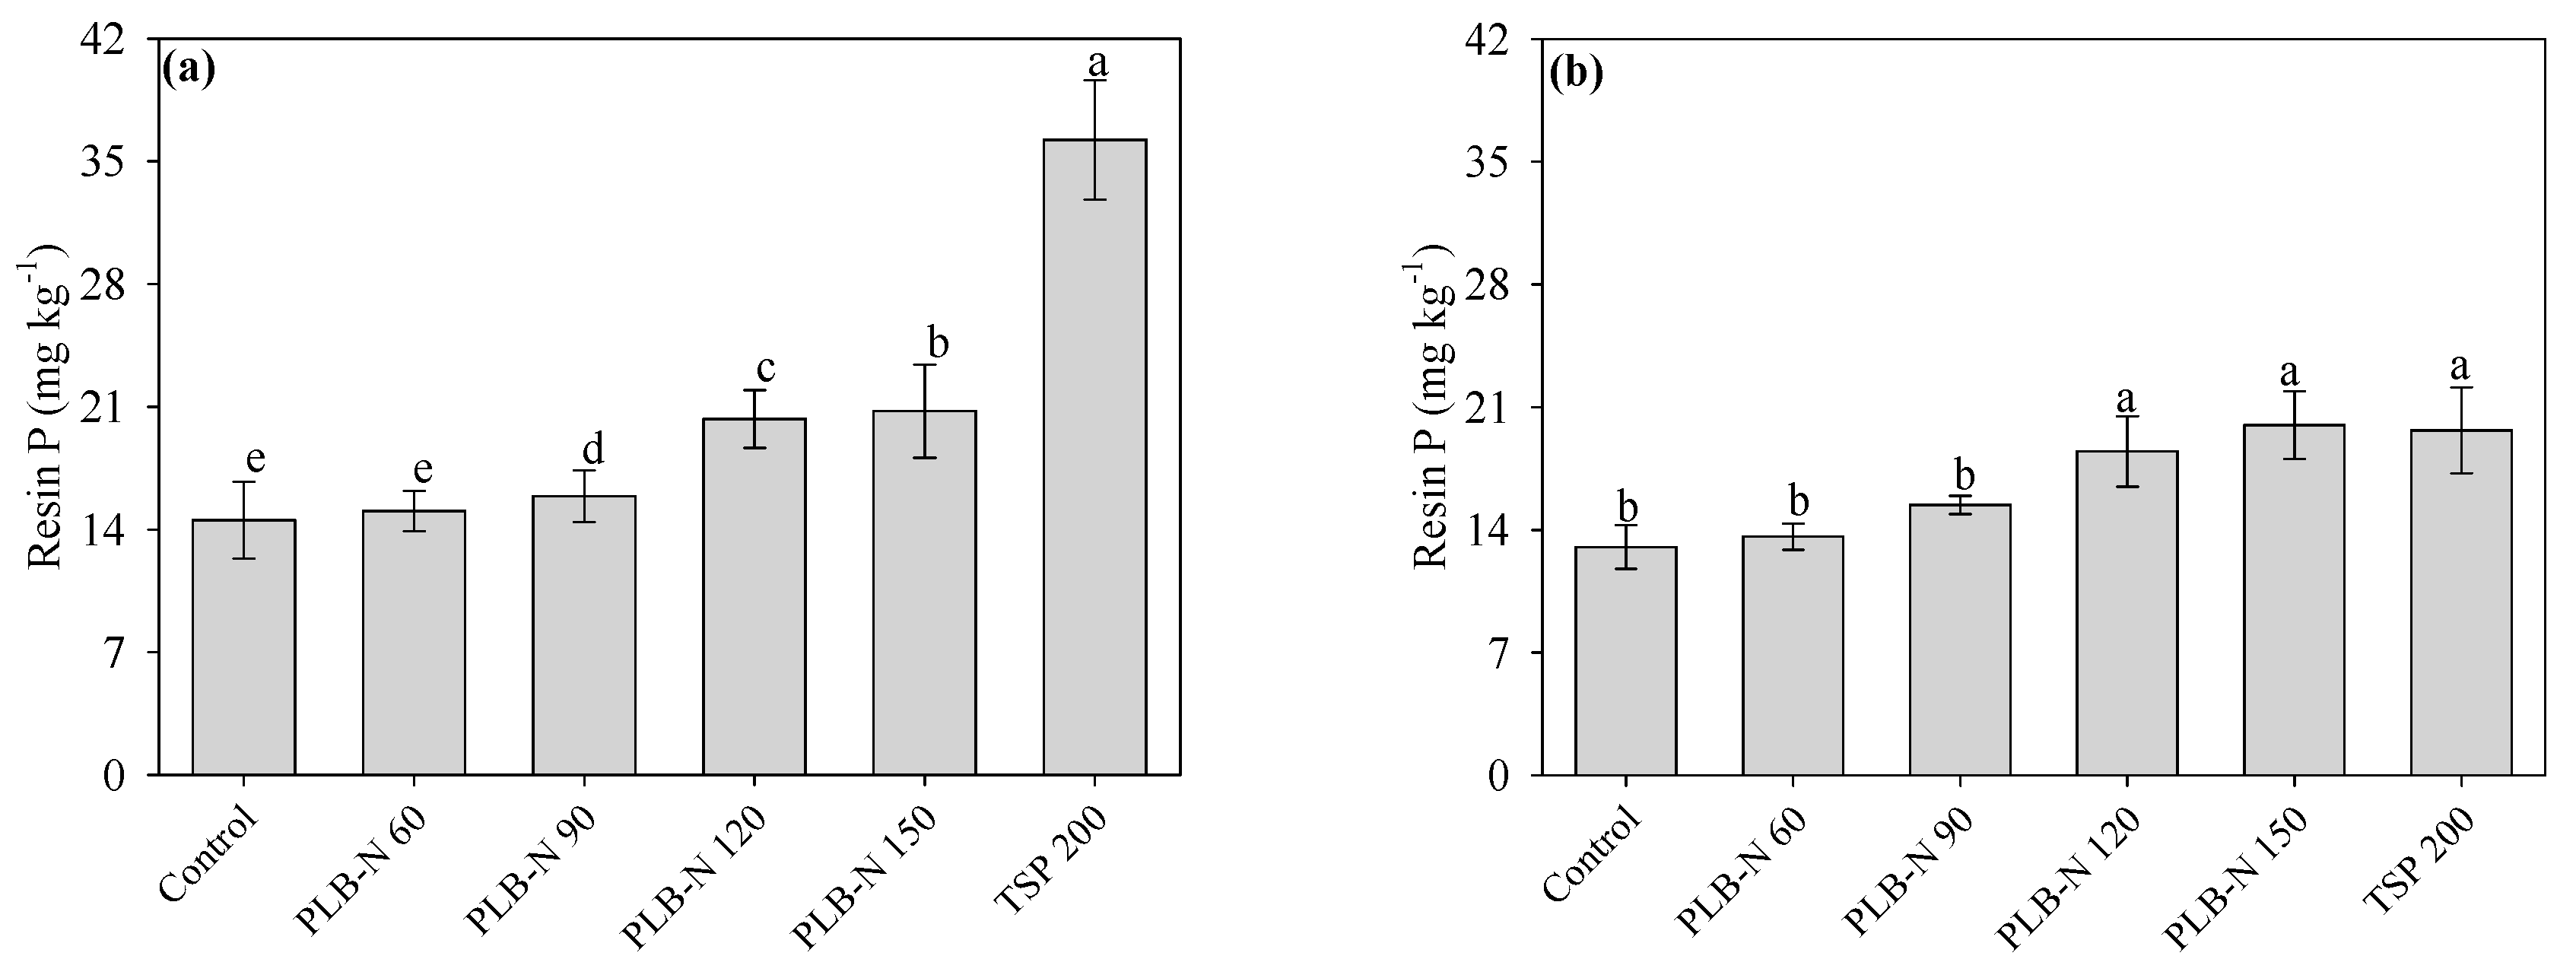
3.3. Crop Productivity and Nitrogen and Phosphorus Uptake

The SDM of common bean and maize is shown in Figure 4a,b. In the first growing cycle, significantly (p < 0.05) higher productivity of SDM was observed for common bean fertilizer with TSP + urea when compared with the treatment of PLB–N and the control without application of N and P (Figure 4a). The response of SDM to N doses via PLB–N was best described by a quadratic model with the maximum productivity obtained by the application of 100 mg kg−1 of N, after which there was a decrease in productivity.
In the second cultivation cycle, the SDM productivity of maize responded linearly to increasing doses of N (p < 0.05, Figure 4a). Residual N fertilization with PLB–N was able to sustain the highest productivities of SDM ranging from 15 to 35 g pot−1 with increasing N doses, while urea at 200 mg kg−1 produced 11 g pot−1 (Figure 4a). These samples had a much higher relative agronomic efficiency (RAE) for PLB–N 285% than those fertilized with urea (RAE of 100%) at the same dose of N (200 mg kg−1). The SDM of the control without N and P fertilization decreased significantly, with the lowest yield (8 g pot−1) in maize.
The decrease in productivity of the common bean over 100 mg kg−1 of N via PLB–N indicates a rapid release profile that saturates the absorption of N by the plant without any additional response in the production of SDM. The physical mixture of PLB with urea was not effective in reducing the N hydrolysis rate in PLB–N fertilizers, which resulted in a marked increase in the soil EC (discussed in the next section), delayed the seedling emergence of the common bean; it also caused injuries that were reflected in reduced SDM productivity (Figure 4a). High concentrations of urea can compromise the seedling and plant growth due to toxicity caused by the high level of NH3/NH4+ [40] and can also induce salt stress due to the high concentration of NH4+ and NO2 ions [41].
Conversely, the residual effect of fertilization for maize was much greater for PLB–N than for urea, and it was linear, likely due to the higher N availability in the soil. Ref. [42] showed that the increase in the cation exchange capacity promoted by biochar particles prolonged the N availability from urea, which might have been the case in this study. The linear growth of maize in response to N caused the total production of SDM (Ʃ production of the dry mass of beans and maize) in the soil treated with PLB–N at all N doses to be equal to or higher than in the samples fertilized with urea only (Figure 4b).
Nitrogen, P, and Mg uptake by bean plants were severely affected by salt stress caused by the increase in N doses via PLB–N (Figure 4c–e). Nitrogen uptake was higher in the common bean plants that received 200 mg kg−1 of N via PLB–N and the equivalent dose via urea. In the subsequent cultivation, N uptake by maize followed a linear trend with N doses via PLB–N (p < 0.05), with values ranging from 1.3 to 8.1 mg pot−1, while in the treatment with conventional urea, the N uptake was 1.09 mg pot−1.
The higher or lower P uptake for both common bean and maize is also directly related to the availability of P (Figure 4d), which in turn is greatly influenced by the soil pH [43]. This might explain the greater P uptake promoted by the control treatment with the application of TSP in the cultivation of common beans and the linear response to the increase in the doses of PLB–N for maize. The decrease in P uptake with the increase in the doses of PLB–N (Figure 4d) might also be related to the increase in ionic strength caused by the increase in N doses applied fully at sowing. The acquisition of nutrients by plants can be interrupted by the excess ions in the solution, either by direct ionic competition or by decreasing the osmotic potential of the solution, which reduces the mass flow of mineral nutrients to the root [44]. Furthermore, the decrease in Mg uptake by bean plants (Figure 4e) can also be attributed to toxicity due to excess NH4+, considering that one of the chemical changes in the plant induced by excess NH4+ includes depression in the uptake of essential cations (such as K+, Ca2+, and Mg2+) [45].

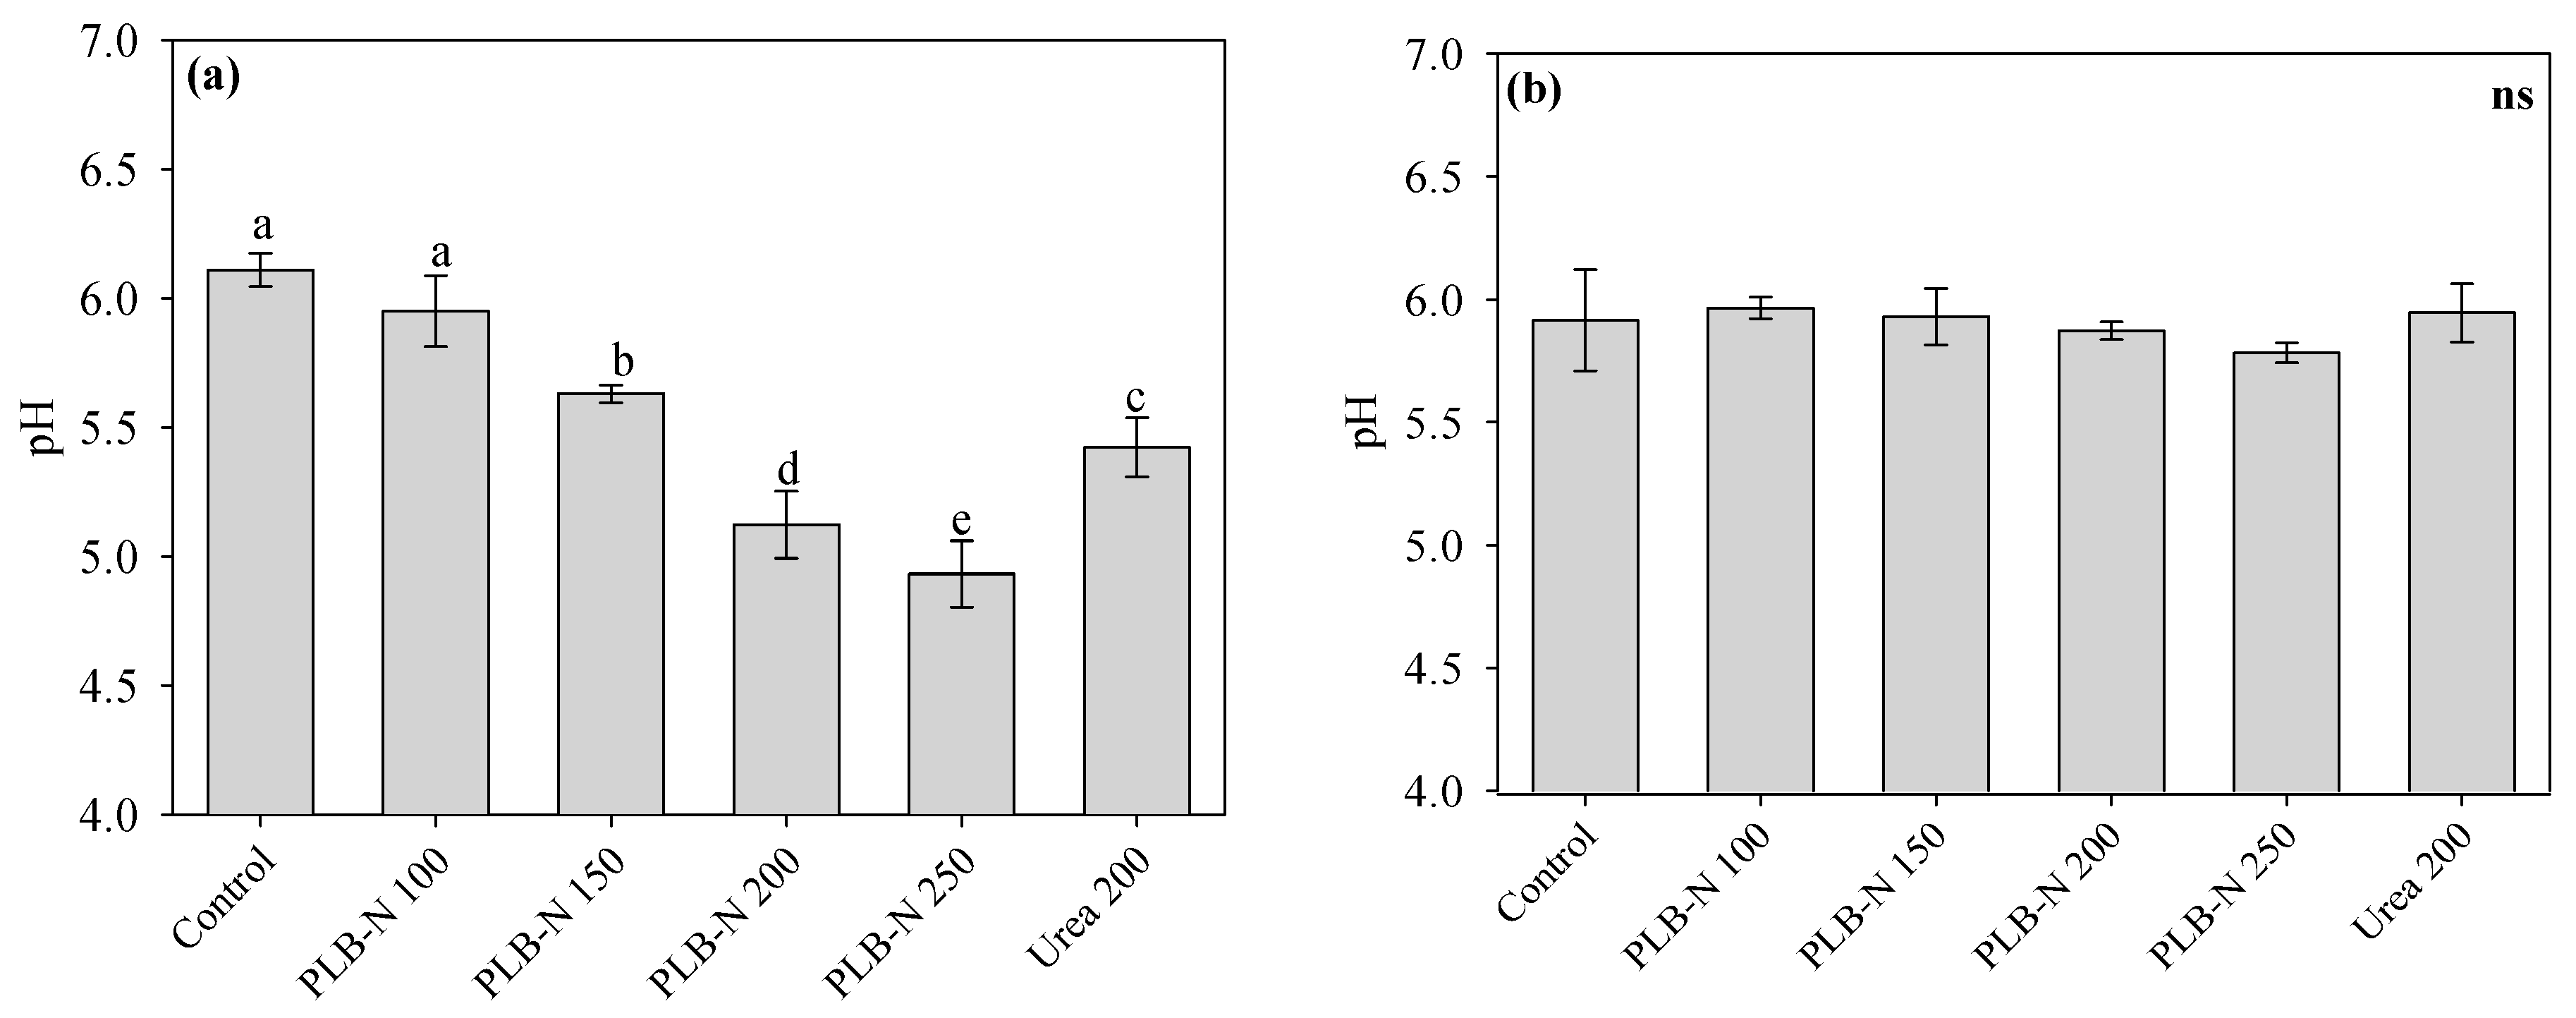
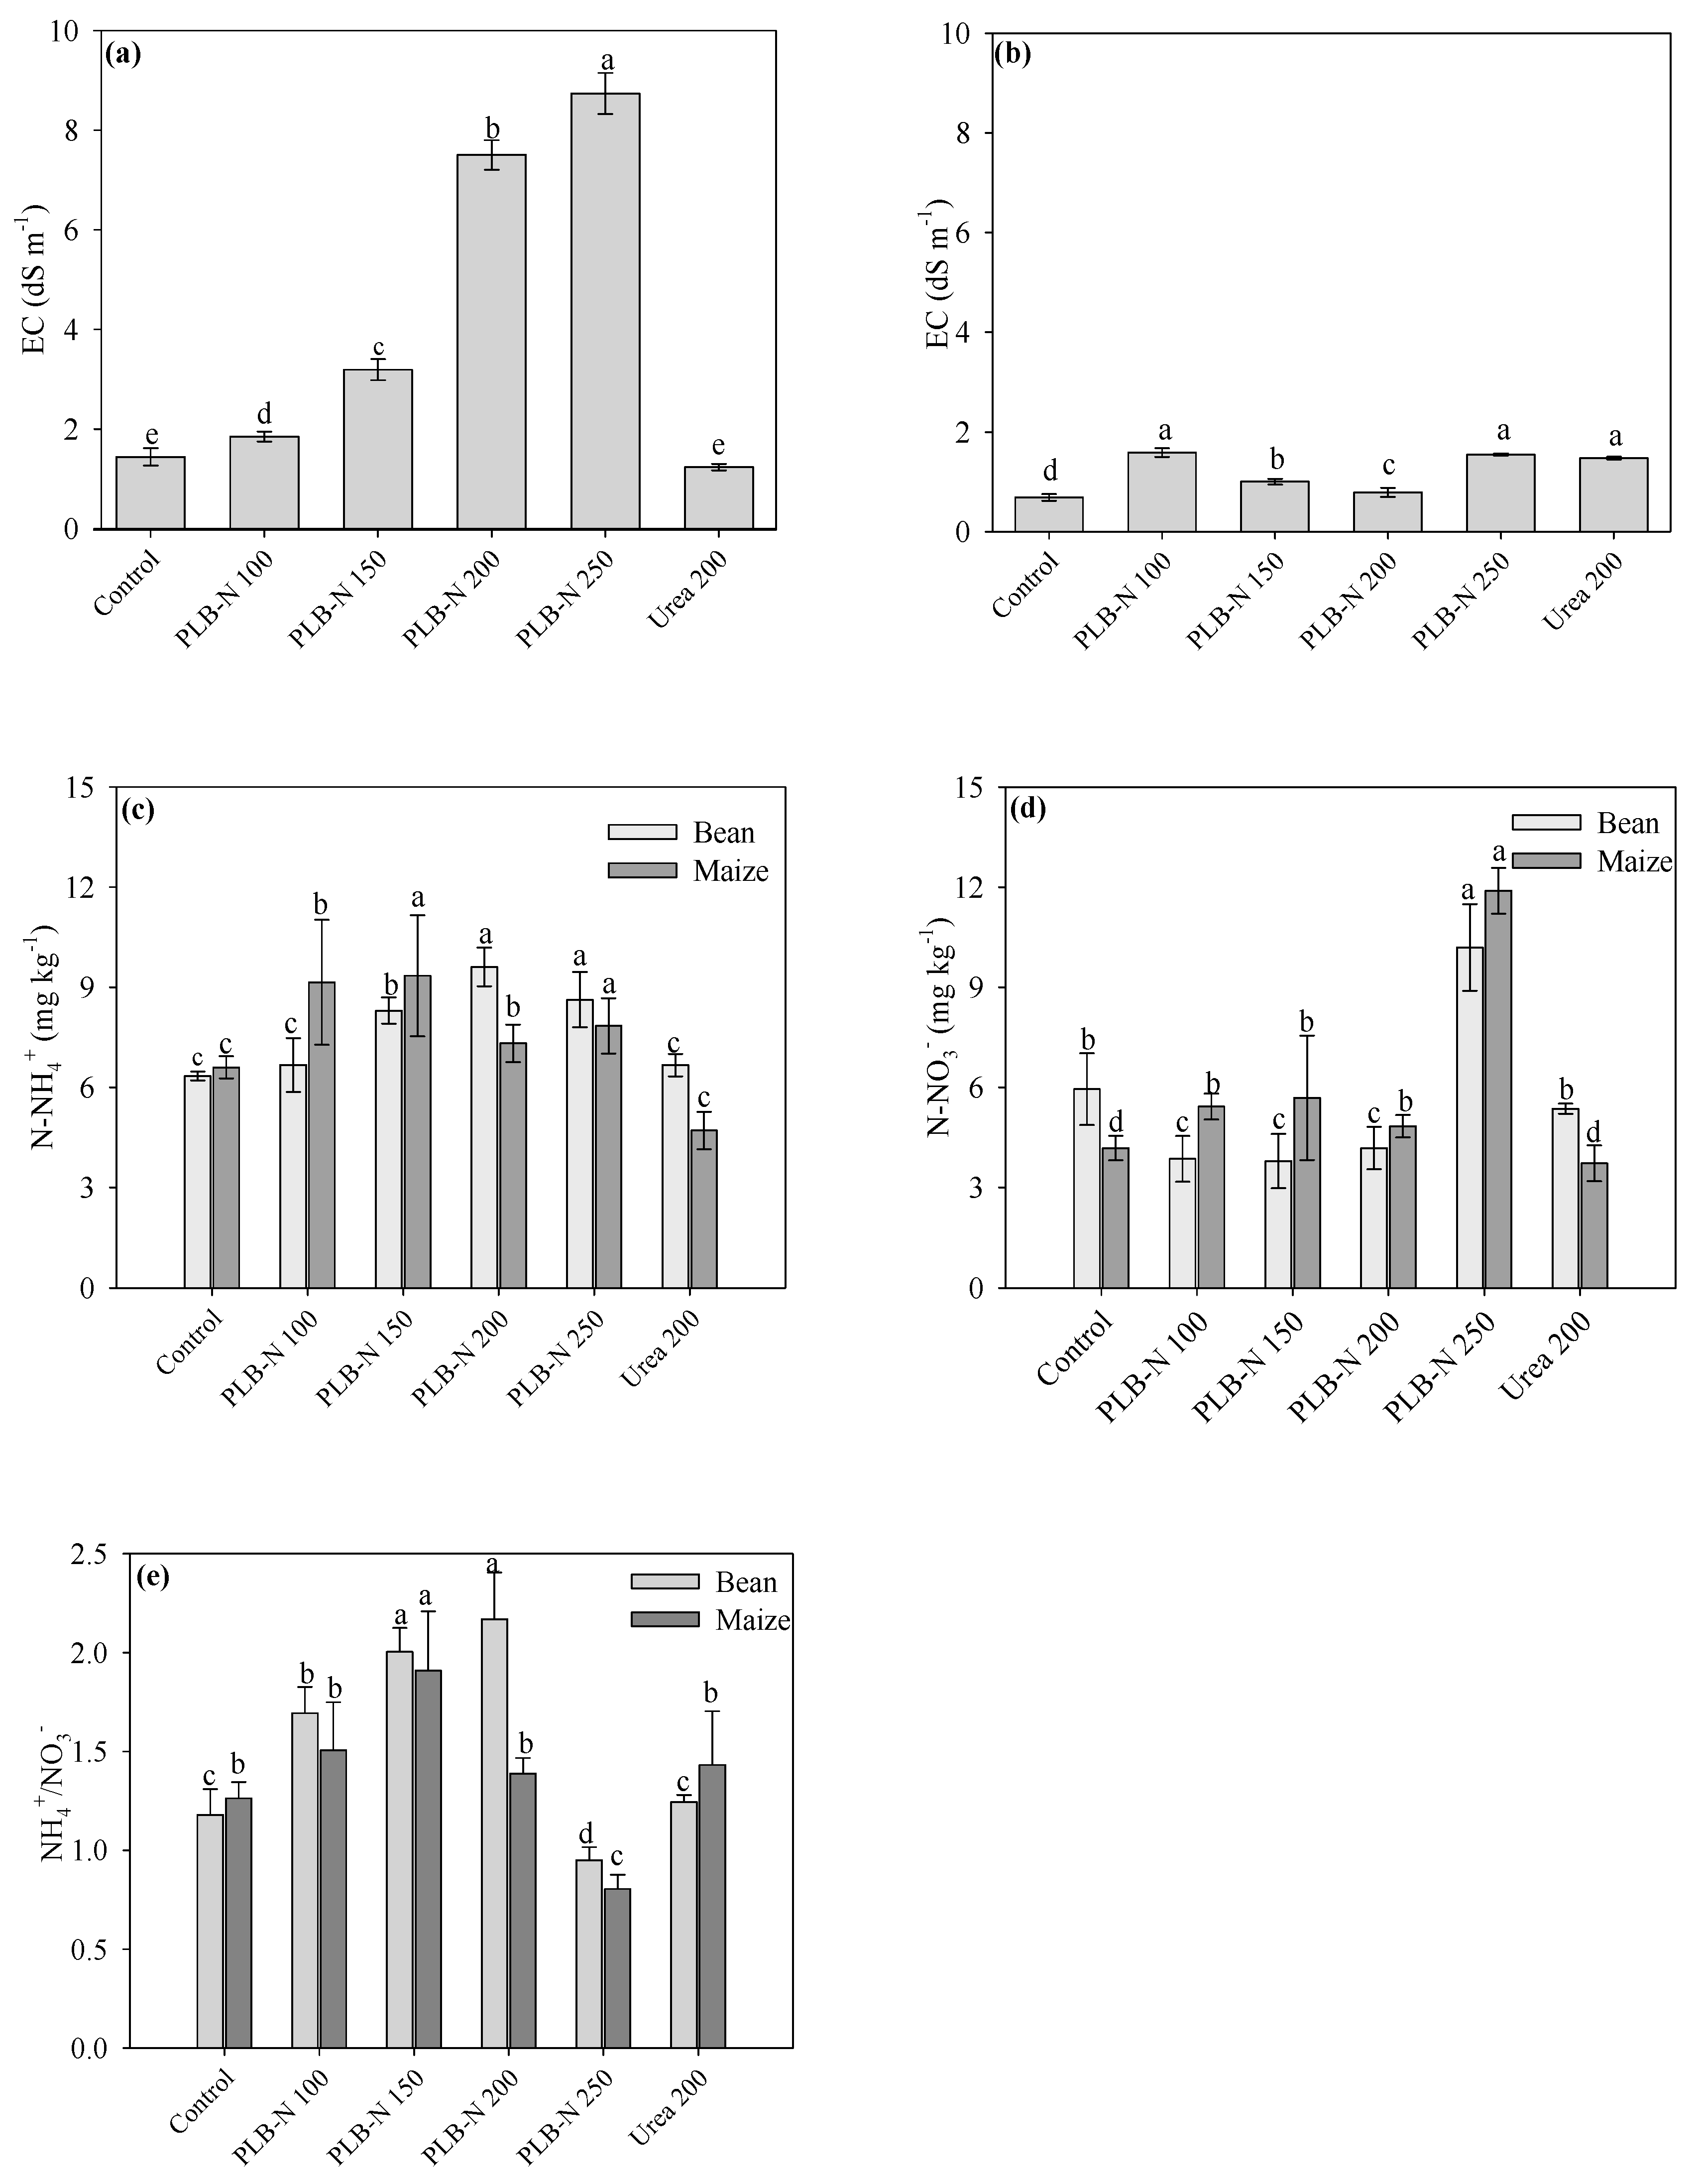
3.4. Soil Conditions after Cultivation

After the cultivation of common beans, the soil pH decreased by 0.35 to 1.36 units due to N doses above 150 mg kg−1 via PLB–N when compared with the control without N (Figure 5a). When the soil pH of urea and PLB–N at the same N dose (200 mg kg−1) were compared, a significant (p < 0.05) but small difference of 0.3 units was verified. It must be highlighted, however, that the N dose (200 mg kg−1) from urea was split three times, while the same N dose via PLB–N was applied only at sowing. Soil acidification due to N addition has also been observed in other studies due to the nitrification process [46,47].
Although the soil pH gradually decreased with increasing N doses after common bean cultivation, there were no significant (p < 0.05) differences among the treatments after the subsequent maize cultivation (p < 0.05; Figure 5b), which means that the soil acidification caused by the N addition was only a transient effect in the studied soil. Soil acidification was mainly due to an increase in the rate of transformation of N, which increased the nitrification of NH4+ [48]. The absorption of N–NH4+ by crops also contributed to soil acidification due to the protons generated and released by the roots of plants to balance the excess absorption of cations and anions [49]. Unlike PLB–N, the impact of N transformations on soil acidification for urea was possibly low due to splitting, and N absorption by the crop was the main driver of soil acidification [47].
Generally, in a short-term experiment, the application of BBFs impregnated with MgO promoted an increase in soil pH around the application point due to the alkaline nature of the fertilizers [20,21]. However, the method of application, combined with the high rates of PLB–N, seems to have prevented the alkaline reaction of the fertilizer and limited its ability to buffer the soil pH. The biochar’s ability to buffer the soil pH is directly related to the CEC contained in this material [50] and may have alleviated the acidification of the soil. The application of hardwood biomass biochar at 500 °C in acid soil contaminated with arsenic (As) and lead (Pb) resulted in an increase of 0.9 units in soil pH. This increase was observed immediately after the addition of the biochar and remained stable over time (after 6 months) potentially reducing metal mobility [51].
The EC values increased significantly with the increase in N, except for the urea treatment, in which the EC was equal to or lower than that of the treatment without N application (p < 0.05; Figure 6a). At the same dose of N (200 mg kg−1), the difference between the EC values of the treatment with PLB–N and that of the control treatment was approximately 6.26 units. Moreover, soil EC values with PLB–N at 200 and 250 mg kg−1 exceeded the tolerance limit (4 dS m−1) for most crops [44]. However, after maize cultivation, there was a marked decrease in soil salinity, which varied from 0.8 to 1.6 dS m−1 with the increase in PLB–N dose (Figure 6b).
The increase in soil salinity with the increase in PLB–N dose in a single application was possibly induced by an increase in the concentration of mineral N and partly by the soluble nutrients in the BBFs. According to the NH4+/NO3− ratio after bean cultivation (Figure 6e), nitrification was significantly reduced with an increase in the N rate, leading to higher concentrations of NH4+–N and lower NO3–N, except for the highest N dose, which presented the lowest NH4+/NO3 ratio, suggesting an increase in nitrification, which was maintained after the cultivation of corn. A decrease in the NH4+/NO3 ratio was observed, and it was more pronounced at a dose of 200 mg kg−1.
The nitrification of excess N fertilizer led to a large release of protons, and soil acidification may have further induced the direct release of basic cations (Mg2+ and Ca2+), accelerating soil salinization [49]. This result justifies the strategy of splitting urea fertilization to help reduce salt stress due to the high concentration of NH4+ from urea hydrolysis [52] and reduce N losses [53]. The high salinity of the soil inhibits the absorption of N by the root, which explains the decline in N uptake with the increase in the doses of PLB–N (Figure 4c).
Increased soil salinity limits the yield and productivity of crops and is one of the main factors that limit the growth and productivity of common beans [54]. The stress caused by the increase in soil salinity reduces plant growth, including leaf area, which reduces the photosynthetic process and efficiency in the use of nutrients [44]. Saline stress delayed bean seedling growth and contributed to lower SDM productivity (Figure 4a).
The concentrations of mineral N in the soil are shown in Figure 6c and d. The highest levels of NH4+ were obtained with the application of PLB–N at the highest doses of N (200 and 250 mg kg−1), while in the treatment with urea, the levels were equivalent to those in the treatment without N application (Figure 6c). After the cultivation of maize, the levels of NH4+ were higher at doses of 100, 150, and 250 mg kg−1 of N via PLB–N (p < 0.05). The application of N via PLB–N at the same dose as the treatment with urea (200 mg kg−1) resulted in higher levels of NH4+ either after the cultivation of beans or maize.
There were no significant differences between the levels of nitrate (NO3) in the soil treated with the addition of N after bean cultivation (Figure 6d), except for the highest dose of N via PLB–N, which presented the highest levels of NO3, both after the first and after the second cultivation cycle. When comparing the levels of NO3 in the soil after the cultivation of beans with the levels after the cultivation of maize, we noticed an increase in the levels of NO3- in the soil only in the samples treated with PLB–N (Figure 6d).
The application of PLB–N kept the amount of mineral N in the form of NH4+ considerably higher, which suggests the role of biochar in increasing the retention of N for a longer period and consequently the absorption by plants, likely due to the high CEC of this material [21]. There was a lack of relationship between the contents of NH4+ and NO3 in the soil, mainly evidenced at the highest dose of PLB–N, in which the contents of NO3 were greater than or equal to the contents of NH4+ (Figure 6c,d). Thus, the availability of NH4+ did not directly influence the concentration of NO3- in the soil fertilized with PLB–N [8].
The addition of PLB–N promoted a significant increase in the levels of P extractable by resin measured in the soil after bean cultivation (p < 0.05, Figure 7a). The magnitude of this increase was proportional to the increase in the application rate, with P levels ranging from 15 to 25.5 mg kg−1, although lower than the treatment with TSP (33.7 mg kg−1). This same trend was observed after the subsequent cultivation with maize (Figure 7b); however, the level of P extractable by resin in the fertilized soil with the highest rates of PLB–N, which provided 120 and 150 mg kg−1 of P, was lower than or similar to that of the control treatment treated with TSP (p < 0.05) and fertilized with 200 mg kg−1 of P. In the treatments with doses of 100 and 150 mg kg−1, the levels of P extractable by resin were greater than or equal to the treatment without fertilization with P.
The amount of P supplied via PLB–N was lower than the amount of P added in the control treatment with TSP, even at the highest application rate. As our goal was to test this fertilizer as a nitrogen and phosphorus source, we chose not to supplement the dose of P supplied via PLB–N with a soluble source such as TSP. In the PLB, low water-soluble P (Table 2) with a slow and steady P release model [19,21], may not benefit short-term crops that require high P absorption as much as a highly soluble P source. Most likely, restricted access to P in the short term was also a limiting factor for the growth of the common beans and contributed to the lowest SDM; these findings are consistent with those of other studies [20,55]. Despite these results, the levels of P extractable by resin in the soil fertilized with PLB–N at doses of 200 and 250 mg kg−1 of N, which provided between 60% and 75% of the dose of P (200 mg kg−1), reached values greater than or similar to those of the soil fertilized with TSP. At the time of cultivation, the acidification of the rhizosphere [56] and the acidity resulting from urea nitrification and NH4+ absorption may have stimulated the solubilization of P from PLB–N, since BBFs impregnated with alkaline sources such as MgO require the sources of soil acidity to be solubilized.
At first, the application of TSP ensured the greatest supply of P and SDM productivity of beans due to the high solubility of this source in water [57]. However, the amount of P that was not absorbed by plants was limited by rapid immobilization by the mineral fraction rich in iron (Fe) and aluminum (Al) oxides and hydroxides in tropical soils [35].

4. Conclusions

In the present study, we investigated the effect of increasing the doses of biochar-based phosphate fertilizer enriched with urea, applied at once at sowing, on the absorption of N and P in the cultivation of beans and maize in comparison with conventional fertilization with urea (split) and a soluble phosphate compound (TSP). The results showed that the nitrogen and phosphorus fertilizer based on biochar did not delay the release of N but affected the predominance of mineral N in the form of NH4+ in the soil. The main effect of PLB–N was residual fertilization, demonstrating that biochar-based phosphate fertilizers have potential as a support material to increase the availability and efficiency of N use by plants. However, in the application of the full dose, it is necessary to control the rate of N release through granulation or pelletization. This control of N release allows the application of the total dose in the furrow without the need for installments, which will facilitate the cultural management of the crop. Future studies should focus on developing a more detailed understanding of the role of engineered biochar-based phosphate fertilizers as urea transporters and the effects of their interactions with various soil types on the dynamics and mineralization of N. Therefore, incubation studies to assess the retention of N from fertilizer in the soil, gaseous emissions, and leaching of N must be conducted.

Supplementary Materials

The following supporting information can be downloaded at: https://www.mdpi.com/article/10.3390/su14020686/s1, Table S1: Analysis of variance (ANOVA) with the mean square (Mean Sq) values and the significance level of the parameters analyzed in the soil after the cultivation of beans and maize and in plants under PLB–N and urea fertilization.

Author Contributions

Conceptualization, C.F.B., D.A.C. and L.C.A.M.; methodology, C.F.B., D.A.C. and J.S.d.S.C.; software, C.F.B. and J.S.d.S.C.; validation, C.F.B. and L.C.A.M.; investigation, C.F.B., D.A.C. and J.S.d.S.C.; resources, C.F.B. and L.C.A.M.; data curation, C.F.B. and J.S.d.S.C.; writing—original draft preparation, C.F.B.; writing—review and editing: C.F.B. and L.C.A.M.; supervision, L.C.A.M.; project administration, L.C.A.M.; funding acquisition, L.C.A.M. All authors have read and agreed to the published version of the manuscript.

Funding

This research was funded by the National Council for Scientific and Technological Development (CNPq), grant number 404076/2016-5. The research was co-financed by the Coordination for the Improvement of Higher Education Personnel (CAPES/PROEX). C.F.B. received a scholarship from CNPq. L.C.A.M. is a research fellow of the National Council for Scientific and Technological Development (CNPq–Grants 308943/2018-0).

Institutional Review Board Statement

Not applicable.

Informed Consent Statement

Not applicable.

Data Availability Statement

All data generated or analyzed during this study are included in this published article.

Conflicts of Interest

The authors declare no conflict of interest. The funders had no role in the design of the study, the collection, analyses, or interpretation of data, the writing of the manuscript, or the decision to publish the results.

References

  1. Wen, P.; Wu, Z.; Han, Y.; Cravotto, G.; Wang, J.; Ye, B.C. Microwave-Assisted Synthesis of a Novel Biochar-Based Slow-Release Nitrogen Fertilizer with Enhanced Water-Retention Capacity. ACS Sustain. Chem. Eng. 2017, 5, 7374–7382. [Google Scholar] [CrossRef]
  2. Erisman, J.W.; Sutton, M.A.; Galloway, J.; Klimont, Z.; Winiwarter, W. How a Century of Ammonia Synthesis Changed the World. Nat. Geosci. 2008, 1, 636–639. [Google Scholar] [CrossRef]
  3. Zhang, X.; Davidson, E.A.; Mauzerall, D.L.; Searchinger, T.D.; Dumas, P.; Shen, Y. Managing Nitrogen for Sustainable Development. Nature 2015, 528, 51–59. [Google Scholar] [CrossRef] [Green Version]
  4. Lu, C.; Tian, H. Global Nitrogen and Phosphorus Fertilizer Use for Agriculture Production in the Past Half Century: Shifted Hot Spots and Nutrient Imbalance. Earth Syst. Sci. Data 2017, 9, 181–192. [Google Scholar] [CrossRef] [Green Version]
  5. Fageria, N.K.; Baligar, V.C. Enhancing Nitrogen Use Efficiency in Crop Plants. Adv. Agron. 2005, 88, 97–185. [Google Scholar] [CrossRef]
  6. Bowles, T.M.; Atallah, S.S.; Campbell, E.E.; Gaudin, A.C.M.; Wieder, W.R.; Grandy, A.S. Addressing Agricultural Nitrogen Losses in a Changing Climate. Nat. Sustain. 2018, 1, 399–408. [Google Scholar] [CrossRef]
  7. Bindraban, P.S.; Dimkpa, C.O.; White, J.C.; Franklin, F.A.; Melse-Boonstra, A.; Koele, N.; Pandey, R.; Rodenburg, J.; Senthilkumar, K.; Demokritou, P.; et al. Safeguarding Human and Planetary Health Demands a Fertilizer Sector Transformation. Plants People Planet 2020, 2, 302–309. [Google Scholar] [CrossRef]
  8. Saha, B.K.; Rose, M.T.; Wong, V.N.L.; Cavagnaro, T.R.; Patti, A.F. Nitrogen Dynamics in Soil Fertilized with Slow Release Brown Coal-Urea Fertilizers. Sci. Rep. 2018, 8, 1–10. [Google Scholar] [CrossRef]
  9. Chen, L.; Chen, X.L.; Zhou, C.H.; Yang, H.M.; Ji, S.F.; Tong, D.S.; Zhong, Z.K.; Yu, W.H.; Chu, M.Q. Environmental-Friendly Montmorillonite-Biochar Composites: Facile Production and Tunable Adsorption-Release of Ammonium and Phosphate. J. Clean. Prod. 2017, 156, 648–659. [Google Scholar] [CrossRef]
  10. González, M.E.; Cea, M.; Medina, J.; González, A.; Diez, M.C.; Cartes, P.; Monreal, C.; Navia, R. Evaluation of Biodegradable Polymers as Encapsulating Agents for the Development of a Urea Controlled-Release Fertilizer Using Biochar as Support Material. Sci. Total Environ. 2015, 505, 446–453. [Google Scholar] [CrossRef] [PubMed]
  11. Gwenzi, W.; Nyambishi, T.J.; Chaukura, N.; Mapope, N. Synthesis and Nutrient Release Patterns of a Biochar-Based N–P–K Slow-Release Fertilizer. Int. J. Environ. Sci. Technol. 2018, 15, 405–414. [Google Scholar] [CrossRef]
  12. Lehmann, J.; Joseph, S. Biochar for Environmental Management: An Introduction. In Biochar for Environmental Management, Science, Technology and Implementation; Lehmann, J., Joseph, S., Eds.; Routledge: New York, NY, USA, 2015; pp. 1–13. [Google Scholar]
  13. Li, S.; Barreto, V.; Li, R.; Chen, G.; Hsieh, Y.P. Nitrogen Retention of Biochar Derived from Different Feedstocks at Variable Pyrolysis Temperatures. J. Anal. Appl. Pyrolysis 2018, 133, 136–146. [Google Scholar] [CrossRef]
  14. Nardis, B.O.; Carneiro, J.S.S.; De Souza, I.M.G.; De Barros, R.G.; Melo, L.C.A. Phosphorus Recovery Using Magnesium-Enriched Biochar and Its Potential Use as Fertilizer. Arch. Agron. Soil Sci. 2020, 67, 1017–1033. [Google Scholar] [CrossRef]
  15. Puga, A.P.; de Queiroz, M.C.A.; Ligo, M.A.V.; Carvalho, C.S.; Pires, A.M.M.; Marcatto, J.d.O.S.; Andrade, C.A. Nitrogen Availability and Ammonia Volatilization in Biochar-Based Fertilizers. Arch. Agron. Soil Sci. 2019, 66, 992–1004. [Google Scholar] [CrossRef]
  16. Shi, W.; Ju, Y.; Bian, R.; Li, L.; Joseph, S.; Mitchell, D.R.G.; Munroe, P.; Taherymoosavi, S.; Pan, G. Science of the Total Environment Biochar Bound Urea Boosts Plant Growth and Reduces Nitrogen Leaching. Sci. Total Environ. 2020, 701, 134424. [Google Scholar] [CrossRef] [PubMed]
  17. Carneiro, J.S.S.; Lustosa Filho, J.F.; Nardis, B.O.; Ribeiro-Soares, J.; Zinn, Y.L.; Melo, L.C.A. Carbon Stability of Engineered Biochar-Based Phosphate Fertilizers. ACS Sustain. Chem. Eng. 2018, 6, 14203–14212. [Google Scholar] [CrossRef]
  18. Zhao, L.; Cao, X.; Zheng, W.; Scott, J.W.; Sharma, B.K.; Chen, X. Co-Pyrolysis of Biomass with Phosphate Fertilizers to Improve Biochar Carbon Retention, Slow Nutrient Release, and Stabilize Heavy Metals in Soil. ACS Sustain. Chem. Eng. 2016, 4, 1630–1636. [Google Scholar] [CrossRef]
  19. Carneiro, J.S.S.; Ribeiro, I.C.A.; Nardis, B.O.; Barbosa, C.F.; Lustosa Filho, J.F.; Melo, L.C.A. Long-Term Effect of Biochar-Based Fertilizers Application in Tropical Soil: Agronomic Efficiency and Phosphorus Availability. Sci. Total Environ. 2021, 760, 143955. [Google Scholar] [CrossRef] [PubMed]
  20. Filho, J.F.L.; Barbosa, C.F.; Carneiro, J.S.S.; Melo, L.C.A. Diffusion and Phosphorus Solubility of Biochar-Based Fertilizer: Visualization, Chemical Assessment and Availability to Plants. Soil Tillage Res. 2019, 194, 104298. [Google Scholar] [CrossRef]
  21. Lustosa Filho, J.F.; Penido, E.S.; Castro, P.; Silva, C.A.; Melo, L.C.A. Co-Pyrolysis of Poultry Litter and Phosphate and Magnesium Generates Alternative Slow-Release Fertilizer Suitable for Tropical Soils. ACS Sustain. Chem. Eng. 2017, 5, 9043–9052. [Google Scholar] [CrossRef]
  22. Rajkovich, S.; Enders, A.; Hanley, K.; Hyland, C.; Zimmerman, A.R.; Lehmann, J. Corn Growth and Nitrogen Nutrition after Additions of Biochars with Varying Properties to a Temperate Soil. Biol. Fertil. Soils 2012, 48, 271–284. [Google Scholar] [CrossRef]
  23. Enders, A.; Hanley, K.; Whitman, T.; Joseph, S.; Lehmann, J. Characterization of Biochars to Evaluate Recalcitrance and Agronomic Performance. Bioresour. Technol. 2012, 114, 644–653. [Google Scholar] [CrossRef] [PubMed]
  24. Manual de Métodos Analíticos Oficiais Para Fertilizantes e Corretivos; MAPA, Ministério da Agricultura Pecuária e Abastecimento/SDA, Secretaria de Defesa Agropecuária: Brasília, Brasil, 2017.
  25. Trenkel, M.E. Slow and Controlled-Release and Stabilized Fertilizers; International Fertilizer Industry Association: France, Paris, 2013; Volume 53. [Google Scholar]
  26. Da Silva, F.C. Manual de Análises Químicas de Solos, Plantas e Fertilizantes Manual de Análises Químicas de Solos, Plantas e Fertilizantes, 2nd ed.; Embrapa Informação Tecnológica: Brasília, Brasil, 2009. [Google Scholar]
  27. Novais, R.F.; Neves, J.C.L.; Barros, N.F. Ensaio Em Ambiente Controlado. In Métodos de Pesquisa Em Fertilidade Do Solo; Embrapa-SE: Brasília, Brasil, 1991. [Google Scholar]
  28. Bremner, J.M.; Mulvaney, C.S. Nitrogen -Total. In Methods of Soil Analysis. Part 2. Chemical and Microbiological Properties; Page, A.L., Miller, R.H., Keeney, D.R., Eds.; John Wiley & Sons; Madison, WI, USA, 1982; pp. 595–624. [Google Scholar]
  29. Malavolta, E.; Vitti, G.C.; Oliveira, S.A. Avaliação Do Estado Nutricional Das Plantas—Princípios e Aplicações, 2nd ed.; Associação Brasileira para Pesquisa da Potassa e do Fósforo: Piracicaba, Brasil, 1997. [Google Scholar]
  30. Van Raij, B.; Quaggio, J.A.; da Silva, N.M. Extraction of Phosphorus, Potassium, Calcium, and Magnesium from Soils by an Ion-exchange Resin Procedure. Commun. Soil Sci. Plant Anal. 1986, 17, 547–566. [Google Scholar] [CrossRef]
  31. Murphy, J.; Riley, J.P. A Modified Single Solution Method for the Determination of Phosphate in Natural Waters. Anal. Chim. Acta 1962, 27, 31–36. [Google Scholar] [CrossRef]
  32. Cantarella, H.; Trivelin, P.O. Determinacão de Nitrogênio Inorgânico Em Solo Pelo Método Da Destilacão a Vapor. In Análise Química Para Avaliacão Da Fertilidade de Solos Tropicais; Instituto Agronômico: Campinas, Brazil, 2001. [Google Scholar]
  33. Ferreira, D.F. Sisvar: A Guide for Its Bootstrap Procedures in Multiple Comparisons Sisvar: Um Guia Dos Seus Procedimentos de Comparações Múltiplas Bootstrap. Ciência Agrotecnologia 2014, 38, 109–112. [Google Scholar] [CrossRef]
  34. Leite, A.d.A.; Cardoso, A.A.d.S.; Leite, R.d.A.; Oliveira-Longatti, S.M.d.; Lustosa Filho, J.F.; de Moreira, F.M.S.; Melo, L.C.A. Selected Bacterial Strains Enhance Phosphorus Availability from Biochar-Based Rock Phosphate Fertilizer. Ann. Microbiol. 2020, 70, 1–13. [Google Scholar] [CrossRef]
  35. Abdala, D.B.; Moore, P.A.; Rodrigues, M.; Herrera, W.F.; Pavinato, P.S. Long-Term Effects of Alum-Treated Litter, Untreated Litter and NH4NO3application on Phosphorus Speciation, Distribution and Reactivity in Soils Using K-Edge XANES and Chemical Fractionation. J. Environ. Manag. 2018, 213, 206–216. [Google Scholar] [CrossRef] [PubMed]
  36. Novais, R.F.d.; Smyth, T.J. Fósforo Em Solo e Planta Em Condições Tropicais. Inf. Agronômicas 1999, 87, 10–11. [Google Scholar]
  37. Ejraei, A.; Aroon, M.A.; Ziarati Saravani, A. Wastewater Treatment Using a Hybrid System Combining Adsorption, Photocatalytic Degradation and Membrane Filtration Processes. J. Water Process Eng. 2019, 28, 45–53. [Google Scholar] [CrossRef]
  38. Xu, X.; Yuan, X.; Zhang, Q.; Wei, Q.; Liu, X.; Deng, W.; Wang, J.; Yang, W.; Deng, B.; Zhang, L. Biochar Derived from Spent Mushroom Substrate Reduced N2O Emissions with Lower Water Content but Increased CH4 Emissions under Flooded Condition from Fertilized Soils in Camellia Oleifera Plantations. Chemosphere 2022, 287, 132110. [Google Scholar] [CrossRef] [PubMed]
  39. Pavia, D.L.; Lampman, G.M.; Kriz, G.S.; Vyvyan, J.R. Introdução à Espectroscopia, 4th ed.; Cengage Learning: Sao Paulo, Brazil, 2010. [Google Scholar]
  40. Pan, W.L.; Madsen, I.J.; Bolton, R.P.; Graves, L.; Sistrunk, T. Ammonia/Ammonium Toxicity Root Symptoms Induced by Inorganic and Organic Fertilizers and Placement. Agron. J. 2016, 108, 2485–2492. [Google Scholar] [CrossRef] [Green Version]
  41. Esteban, R.; Ariz, I.; Cruz, C.; Moran, J.F. Review: Mechanisms of Ammonium Toxicity and the Quest for Tolerance. Plant Sci. 2016, 248, 92–101. [Google Scholar] [CrossRef] [PubMed] [Green Version]
  42. Saha, B.K.; Rose, M.T.; Wong, V.N.L.; Cavagnaro, T.R.; Patti, A.F. A Slow Release Brown Coal-Urea Fertiliser Reduced Gaseous N Loss from Soil and Increased Silver Beet Yield and N Uptake. Sci. Total Environ. 2019, 649, 793–800. [Google Scholar] [CrossRef] [PubMed]
  43. Bornø, M.L.; Müller-Stöver, D.S.; Liu, F. Contrasting Effects of Biochar on Phosphorus Dynamics and Bioavailability in Different Soil Types. Sci. Total Environ. 2018, 627, 963–974. [Google Scholar] [CrossRef] [PubMed]
  44. Fageria, N.K.; Gheyi, H.R.; Moreira, A. Nutrient Bioavailability in Salt Affected Soils. J. Plant Nutr. 2011, 34, 945–962. [Google Scholar] [CrossRef]
  45. Britto, D.T.; Kronzucker, H.J. Review NH4+ Toxicity in Higher Plants: A Critical Review I. J. Plant Physiol. 2002, 159, 567–584. [Google Scholar] [CrossRef] [Green Version]
  46. Tian, D.; Niu, S. A Global Analysis of Soil Acidification Caused by Nitrogen Addition. Environ. Res. Lett. 2015, 10, 024019. [Google Scholar] [CrossRef]
  47. Hao, T.; Zhu, Q.; Zeng, M.; Shen, J.; Shi, X.; Liu, X.; Zhang, F.; de Vries, W. Impacts of Nitrogen Fertilizer Type and Application Rate on Soil Acidification Rate under a Wheat-Maize Double Cropping System. J. Environ. Manag. 2020, 270, 110888. [Google Scholar] [CrossRef] [PubMed]
  48. De Vries, W.; Breeuwsma, A. The Relation between Soil Acidification and Element Cycling. Water. Air Soil Pollut. 1987, 35, 293–310. [Google Scholar] [CrossRef]
  49. Han, J.; Shi, J.; Zeng, L.; Xu, J.; Wu, L. Effects of Nitrogen Fertilization on the Acidity and Salinity of Greenhouse Soils. Environ. Sci. Pollut. Res. 2015, 22, 2976–2986. [Google Scholar] [CrossRef] [PubMed]
  50. Xu, P.; Ming, G.; Lian, D.; Ling, C.; Hu, S.; Hua, M. Use of Iron Oxide Nanomaterials in Wastewater Treatment: A Review. Sci. Total Environ. 2012, 424, 1–10. [Google Scholar] [CrossRef] [PubMed]
  51. Lebrun, M.; Nandillon, R.; Miard, F.; Bourgerie, S.; Visser, R.; Morabito, D. Biochar Application Modifies Soil Properties of a Former Mine Technosol: SEM/EDS Study to Investigate Pb and As Speciation. Biomass Convers. Biorefinery 2021. [Google Scholar] [CrossRef]
  52. Court, M.N.; Stephen, C.; Waidj, J.S. Toxicity as a Cause of the Inefficiency of Urea as a Fertilizer. J. Soil Sci. 1964, 15, 49–65. [Google Scholar] [CrossRef]
  53. Cantarella, H. Nitrogênio. In Fertilidade do Solo; Novais, R., Alvarez, V.H., Barros, N.F., Fontes, R.L., Cantarutti, R.B., Neves, J.C.L., Eds.; Sociedade Brasileira de Ciência do Solo: Viçosa, Brazil, 2007; pp. 375–470. [Google Scholar]
  54. Bayuelo-Jiménez, J.S.; Craig, R.; Lynch, J.P. Salinity Tolerance of Phaseolus Species during Germination and Early Seedling Growth. Crop Sci. 2002, 42, 1584–1594. [Google Scholar] [CrossRef]
  55. Santos, S.R.; Filho, J.F.L.; Vergütz, L.; Melo, L.C.A. Biochar Association with Phosphate Fertilizer and Its Influence on Phosphorus Use Efficiency by Maize. Cienc. Agrotecnologia 2019, 43. [Google Scholar] [CrossRef] [Green Version]
  56. De Freitas, I.F.; Novais, R.F.; de Villani, E.M.A.; Novais, S.V. Phosphorus Extracted by Ion Exchange Resins and Mehlich-1 from Oxisols (Latosols) Treated with Different Phosphorus Rates and Sources for Varied Soil-Source Contact Periods. Rev. Bras. Ciência Solo 2013, 37, 667–677. [Google Scholar] [CrossRef] [Green Version]
  57. Lustosa Filho, J.F.; Carneiro, J.S.S.; Barbosa, C.F.; Lima, K.P.; Leite, A.A.; Melo, L.C.A. Aging of Biochar-Based Fertilizers in Soil: Effects on Phosphorus Pools and Availability to Urochloa Brizantha Grass. Sci. Total Environ. 2020, 709, 136028. [Google Scholar] [CrossRef] [PubMed]
Figure 1. Scanning electron microscopy images (SEM) of BBF before (PLB) and after (PLB–N) urea impregnation. (ac) for PLB and (df) for PLB–N, at 100, 500, and 1000 times magnification, respectively.
Sustainability 14 00686 g001
Figure 2. Energy-dispersive X-ray spectroscopy images (EDX) of BBF before and after urea impregnation of PLB (a) and PLB–N (e); SEM-EDS mapping for P (b,f), N (c,g), and NP (d,h).
Sustainability 14 00686 g002
Figure 3. Fourier transform infrared spectroscopy (FTIR) of urea and BBFs before (PLB) and after (PLB–N) urea impregnation.
Sustainability 14 00686 g003
Figure 4. Shoot dry mass (SDM) of bean plants in the first crop and maize plants in the subsequent crop (a); total SDM of the two crop cycles of plants under PLB–N fertilization and urea (b); uptake of N (c), P (d), and Mg (e) by the plant. Total SDM = Ʃ production of the dry mass of beans and maize. Error bars represent standard error (n = 4).
Sustainability 14 00686 g004
Figure 5. Soil pH after the cultivation of common beans (a) and maize (b) under PLB–N and urea fertilization. ns means not significant. Bars followed by the same letters do not differ by Scott–Knott test (p < 0.05); the error bars represent the standard error (n = 4).
Sustainability 14 00686 g005
Figure 6. Electrical conductivity (EC) of the soil after the cultivation of beans (a) and after the subsequent cultivation of maize (b); available NH4+ (c) and NO3- (d); NH4 +/NO3 ratio (e) in the soil under PLB–N and urea fertilization. Means followed by the same letters in the bars do not differ by Scott–Knott test (p < 0.05). The error bars represent the standard error (n = 4).
Sustainability 14 00686 g006
Figure 7. P resin soil levels after the cultivation of beans (a) and after the subsequent cultivation of maize (b) under PLB–N and TSP fertilization. Means followed by the same letters in the bars differ by Scott–Knott test (p < 0.05). The error bars represent the standard error (n = 4).
Sustainability 14 00686 g007
Table 1. Selected properties of the soil after liming and prior to cultivation.
PropertiesAfter Liming
pH water6.3
Ca2+ (cmolc kg−1)2.96
Al3+ (cmolc kg−1)0.06
H+Al (cmolc kg−1)2.35
Mg2+ (cmolc kg−1)1.10
Resin P (mg kg−1)10.8
P-rem (mg L−1)28.2
K (mg kg−1)161
SB (cmolc kg−1)4.45
t (cmolc kg−1)4.51
T (cmolc kg−1)6.80
m (%)1.33
V (%)65
Organic matter (%)2.21
Clay (%)47
Silt (%)11
Sand (%)42
P-rem: remaining phosphorus after shaking at an initial P of 60 mg L−1; H + Al: potential acidity; t: effective cation-exchange capacity (SB + Al); T: cation-exchange capacity at pH 7.0 [SB+ (H + Al); m: aluminum saturation [(Al3+/t)*100]; V: base saturation [(SB/T)*100]; SB: sum of bases (Ca + Mg + K).
Table 2. Selected properties of poultry litter (PL) and biochar-based phosphate fertilizer (PLB).
PropertyPLPLB
pH8.2 ± 0.02 a6.1 ± 0.1
EC (dS m−1)4.03 ± 0.04 b0.46 ± 0.07
Carbon (%)36.1 ± 0.2 a24. 9 ± 1.0
Total content (g kg−1)
P15.6 ± 0.4 a164 ± 2
Mg5.40 ± 0.20 a96.1 ± 3.1
P solubility (g kg−1)
Water soluble-6.13 ± 0.12
Citric acid soluble-72.8 ± 3.4
NAC c + water-soluble-142 ± 6
a [17]; b [34]; c neutral ammonium citrate. Values are mean ± standard deviation (n = 3).
Publisher’s Note: MDPI stays neutral with regard to jurisdictional claims in published maps and institutional affiliations.

