
Optimal Allocation of a Hybrid Photovoltaic Biogas Energy System Using Multi-Objective Feasibility Enhanced Particle Swarm Algorithm

 ,
,  ,
,  ,
,  ,
,  and
and 
Abstract
:1. Introduction
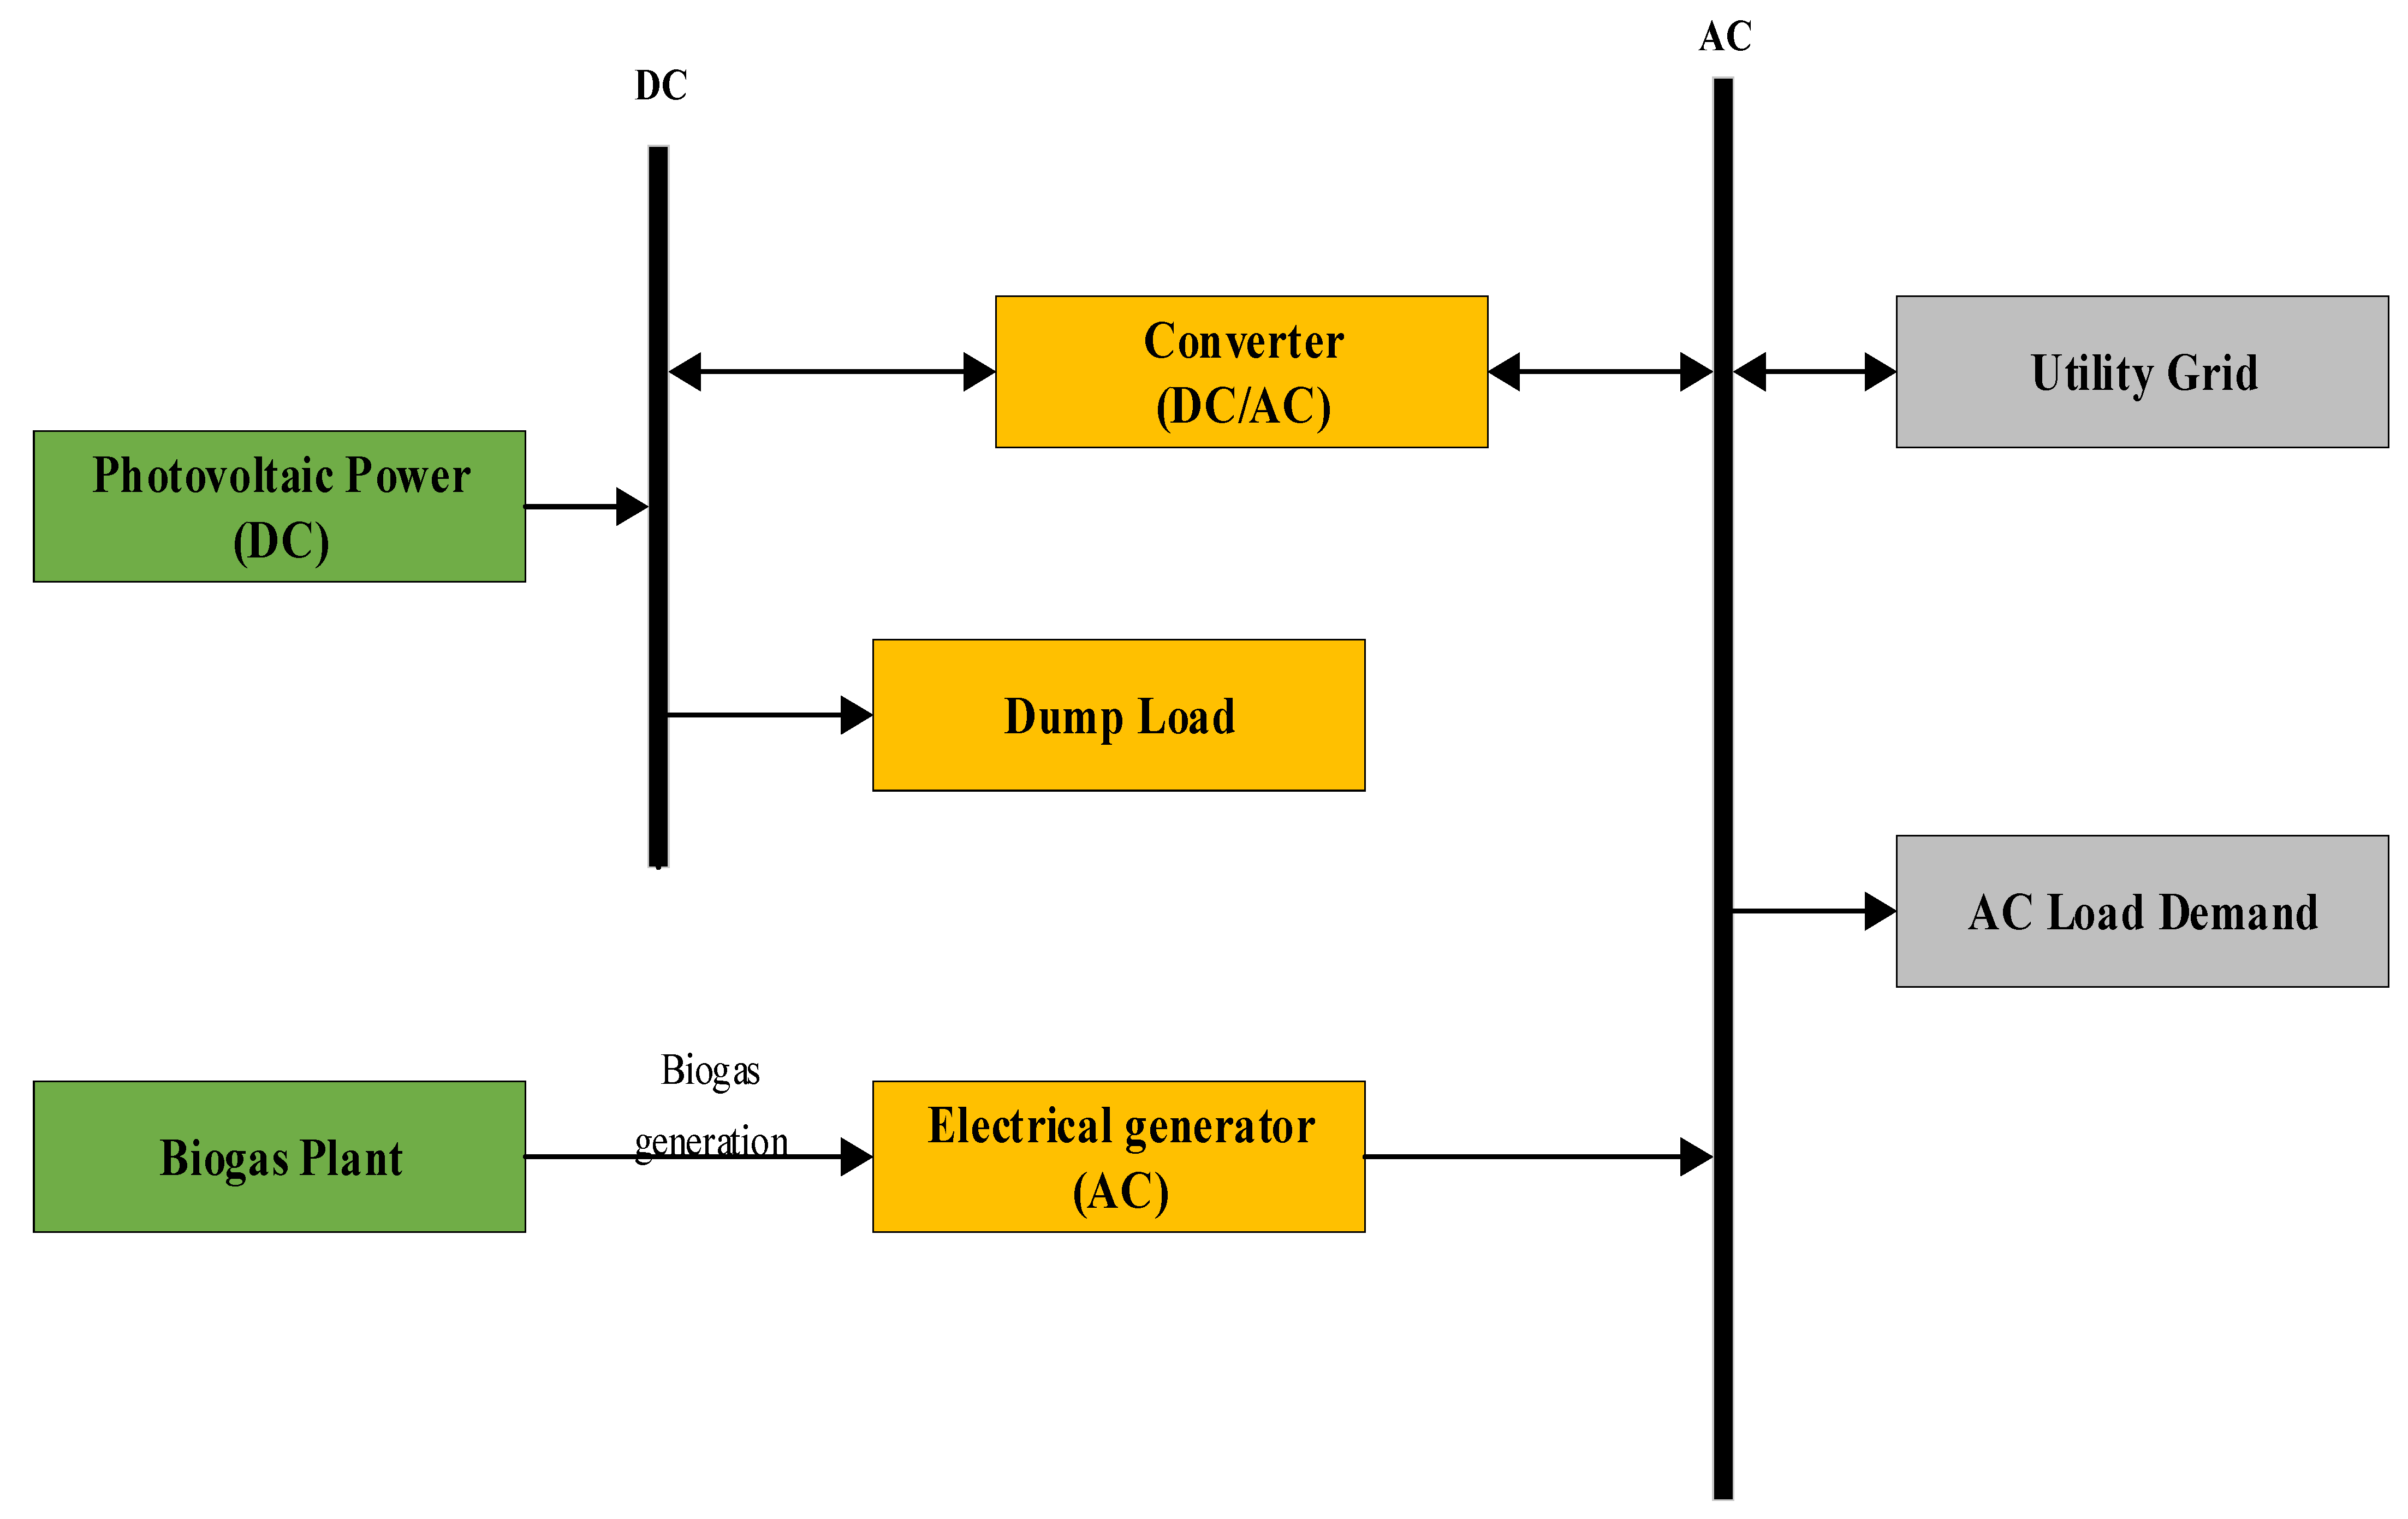
2. Methodology
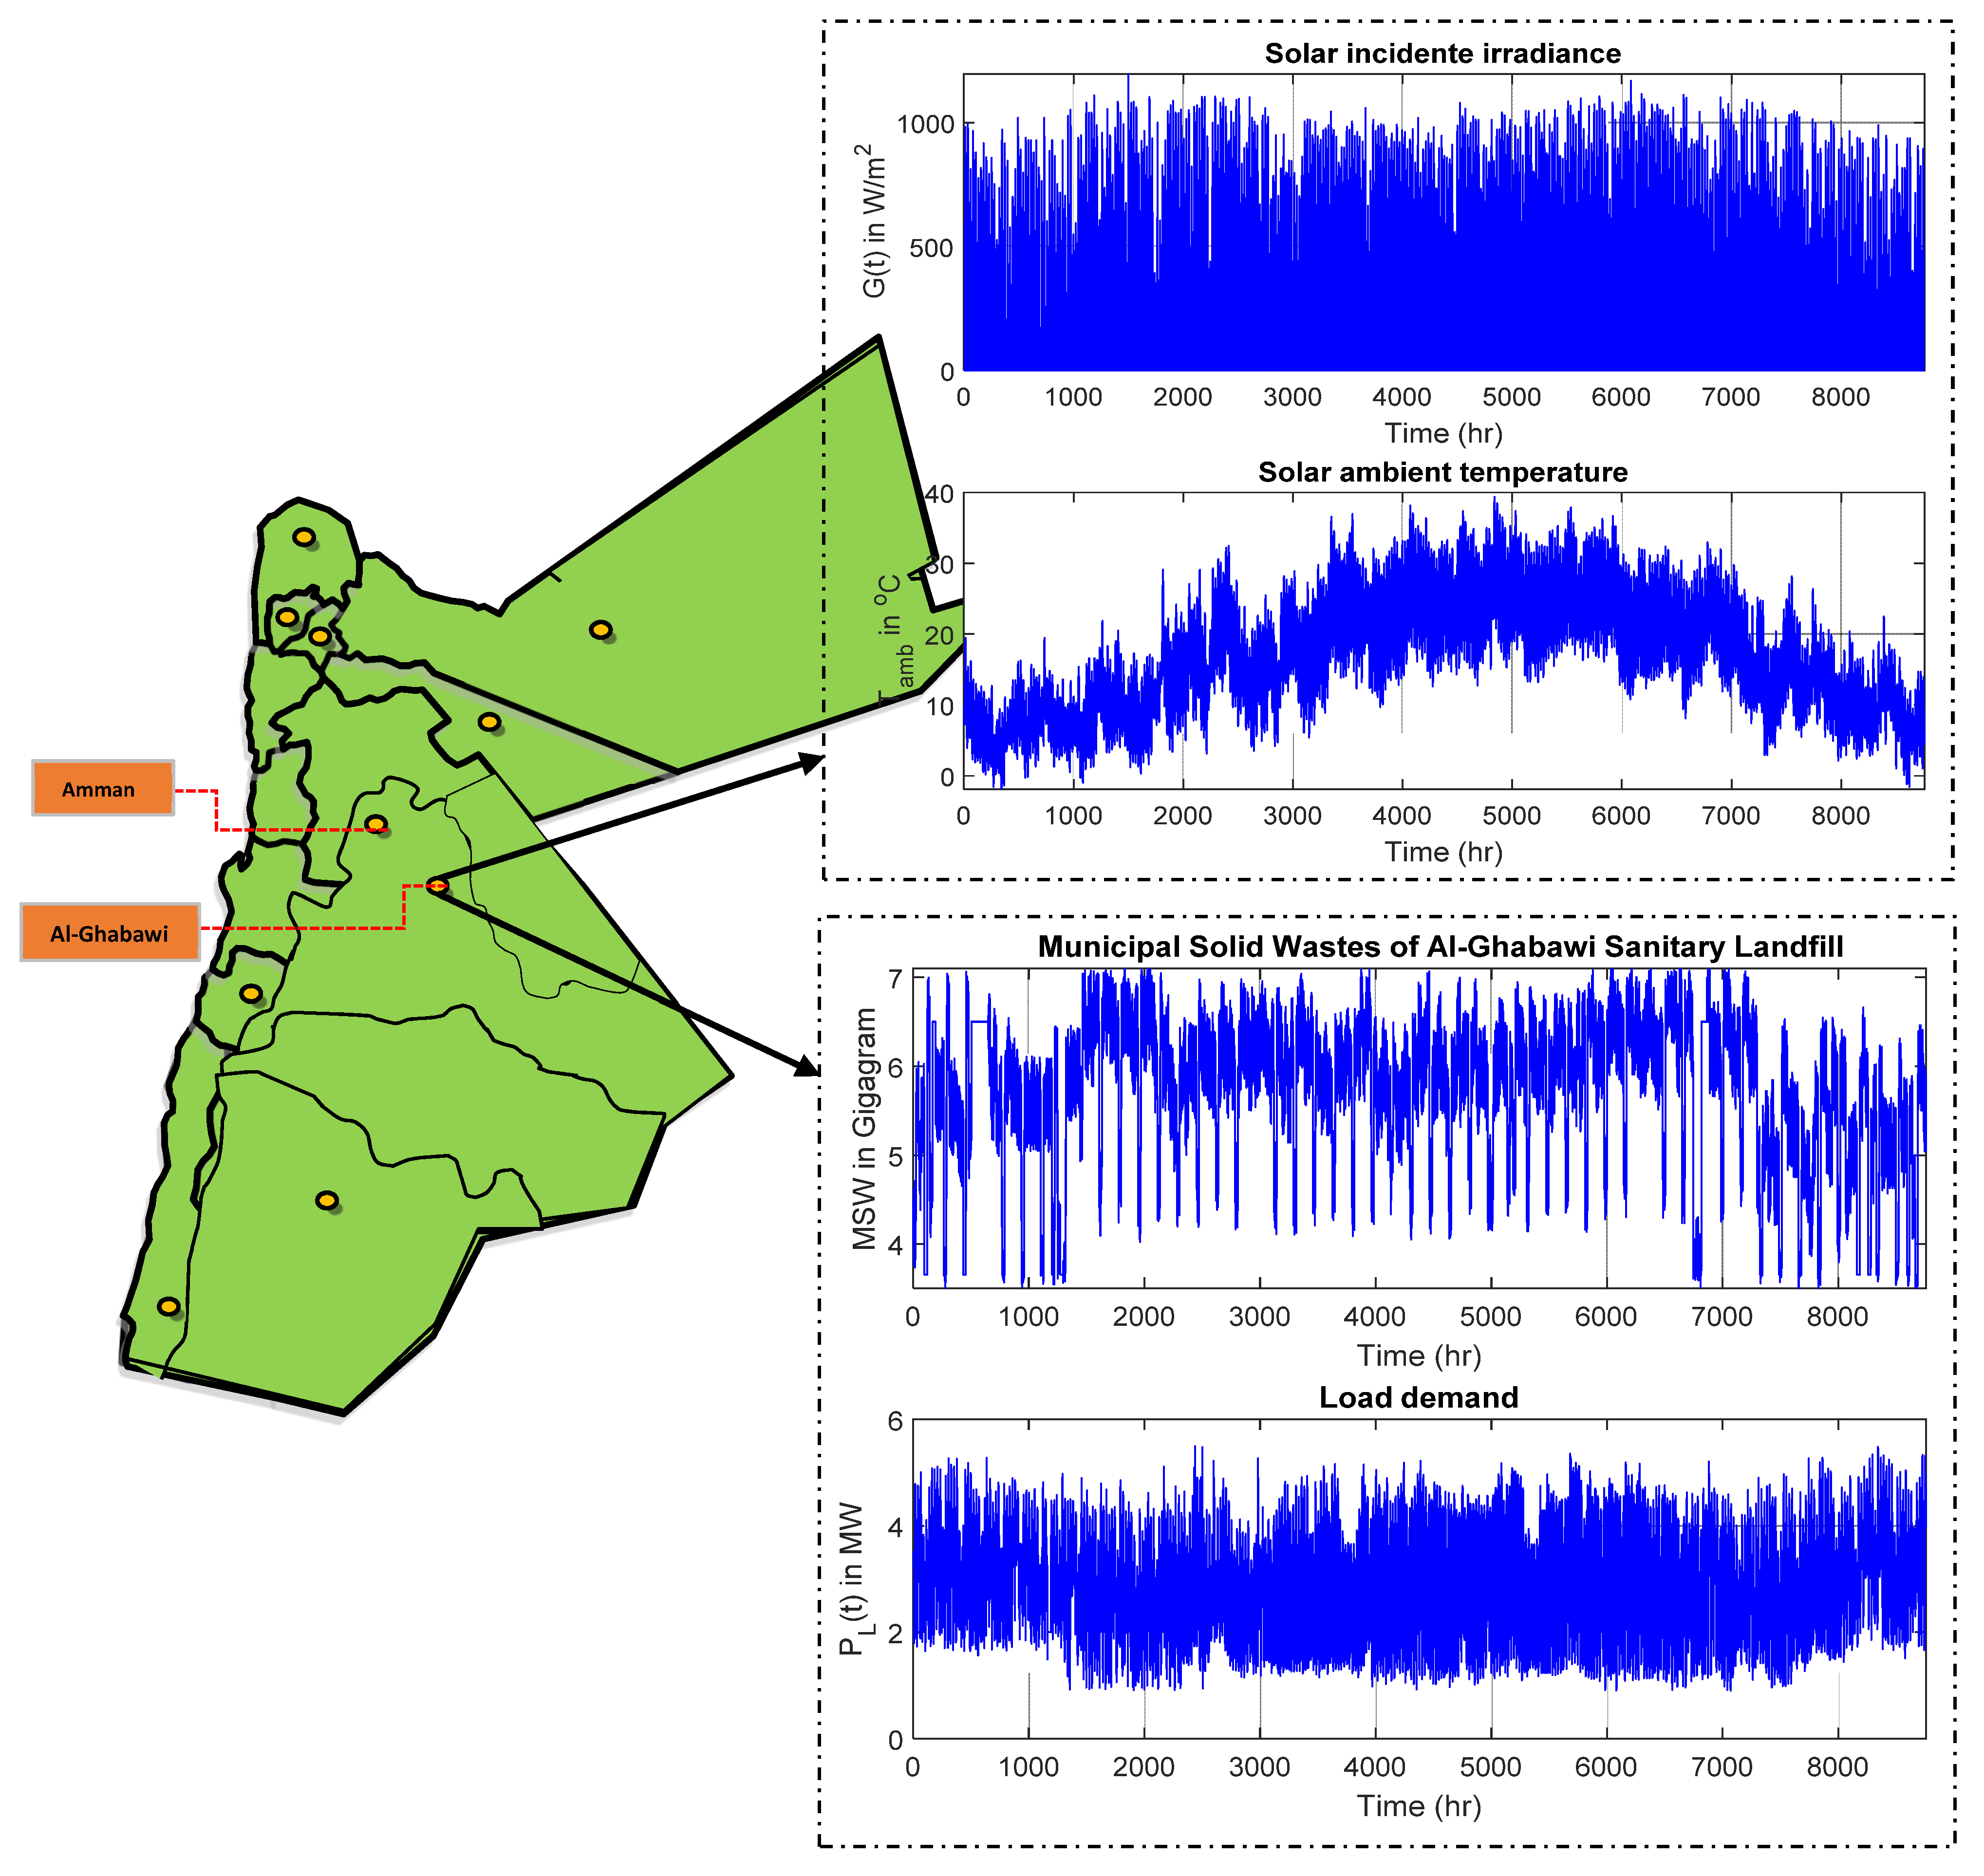
2.1. Solar Data
2.2. Power Load Demand
2.3. Municipal Solid Wastes
3. Mathematical Modeling
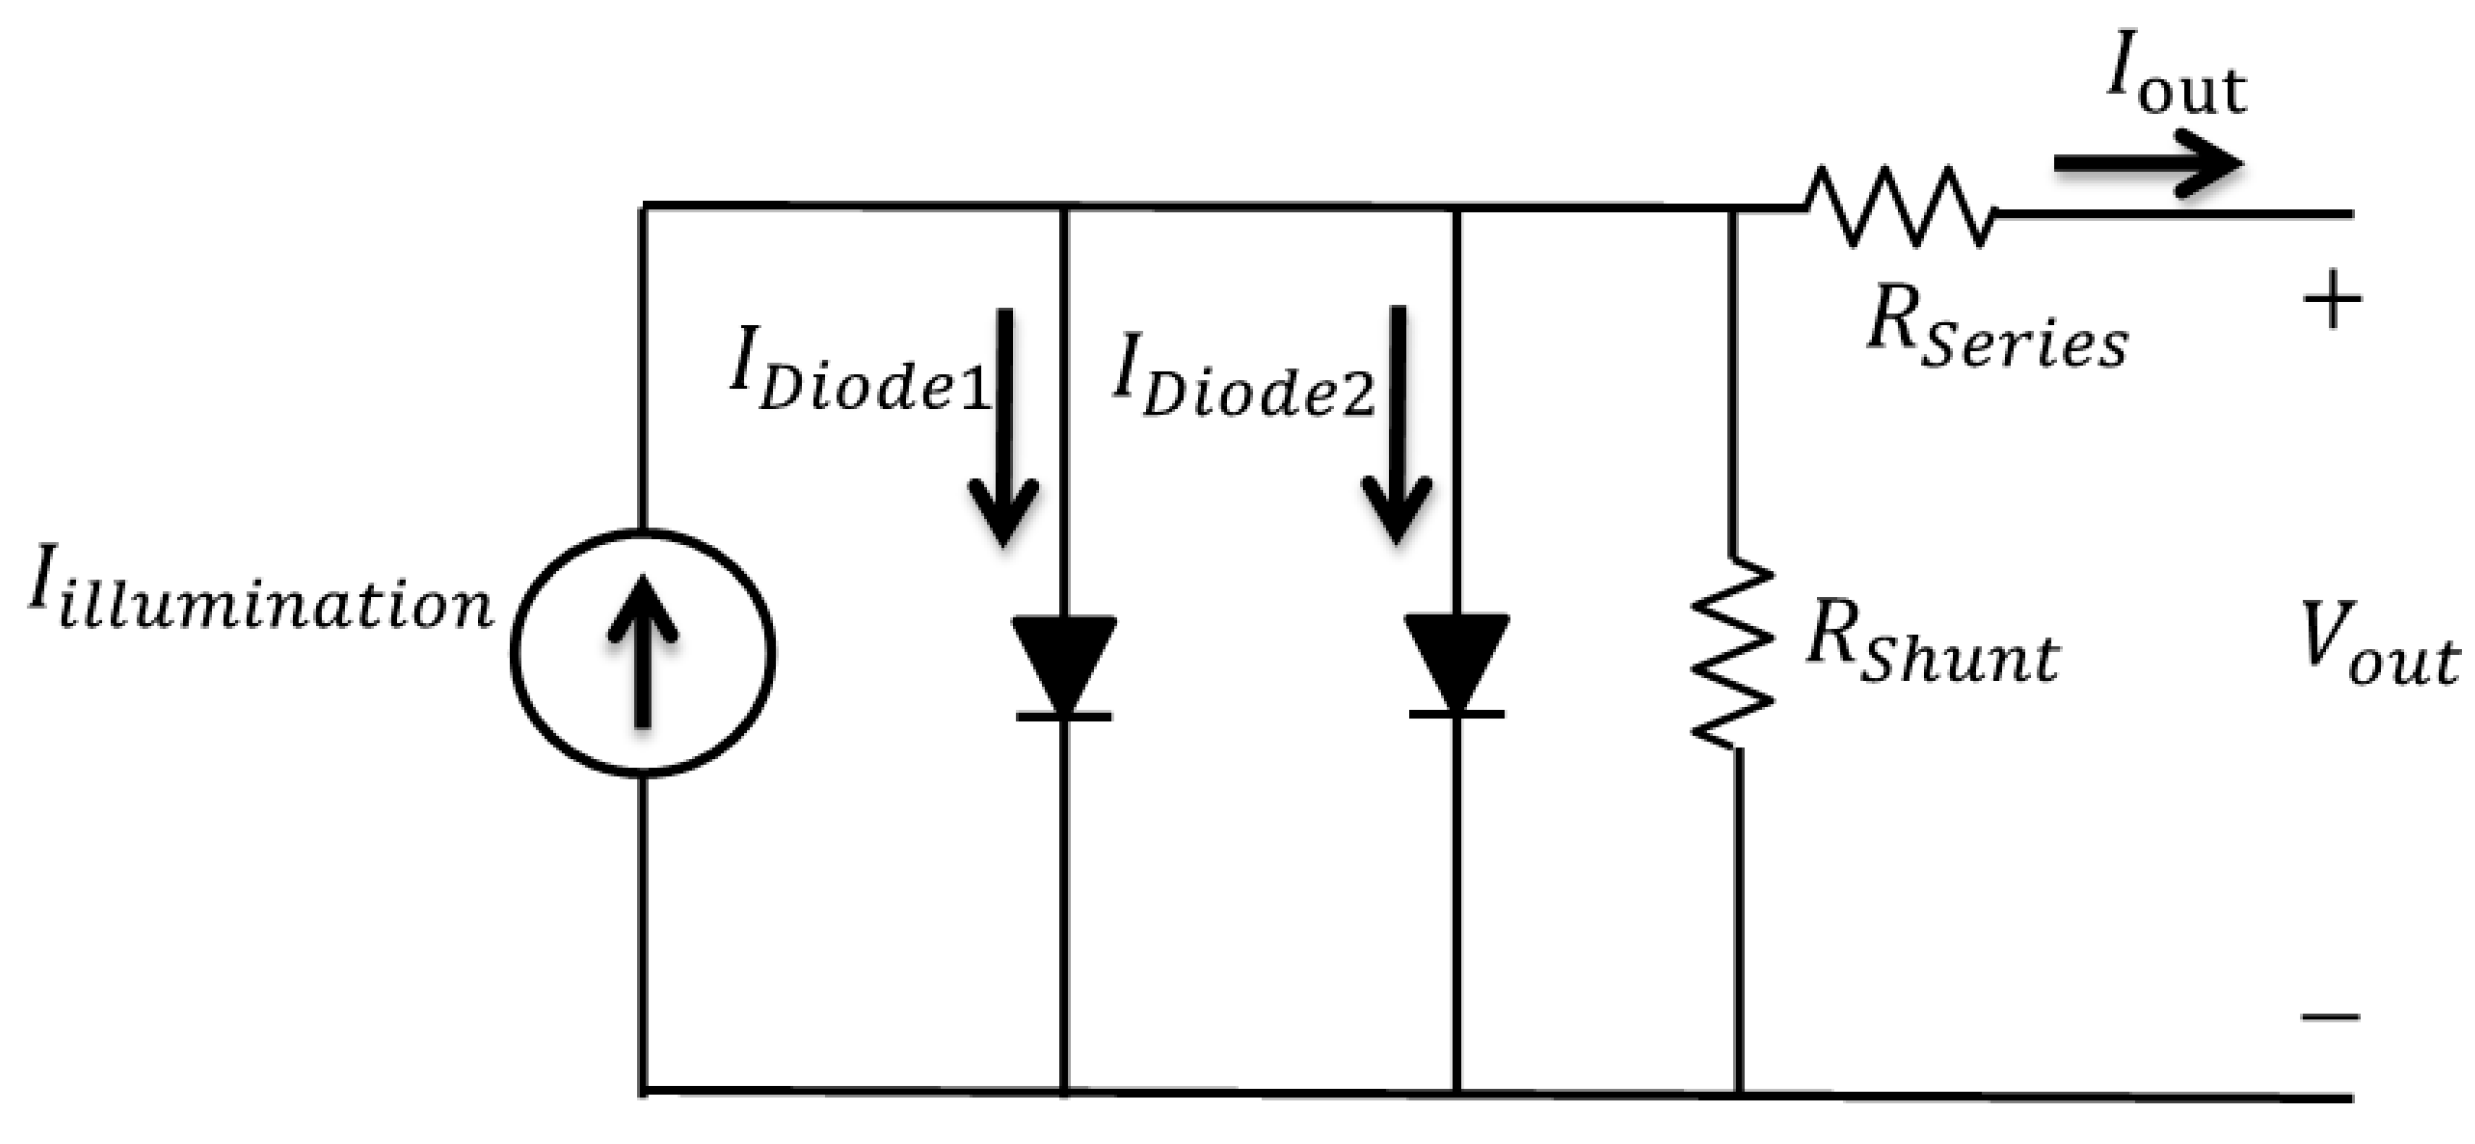
3.1. PV Output Power

3.2. Biogas Generator Output Power
3.3. Inverter Output Power
3.4. Cost
3.4.1. Annualized Cost of the System
3.4.2. Total Net Present Cost
3.4.3. Levelized Cost of Energy
3.5. Reliability Indicators
3.6. Environmental Indicators
3.7. System’s Operational Power Strategies
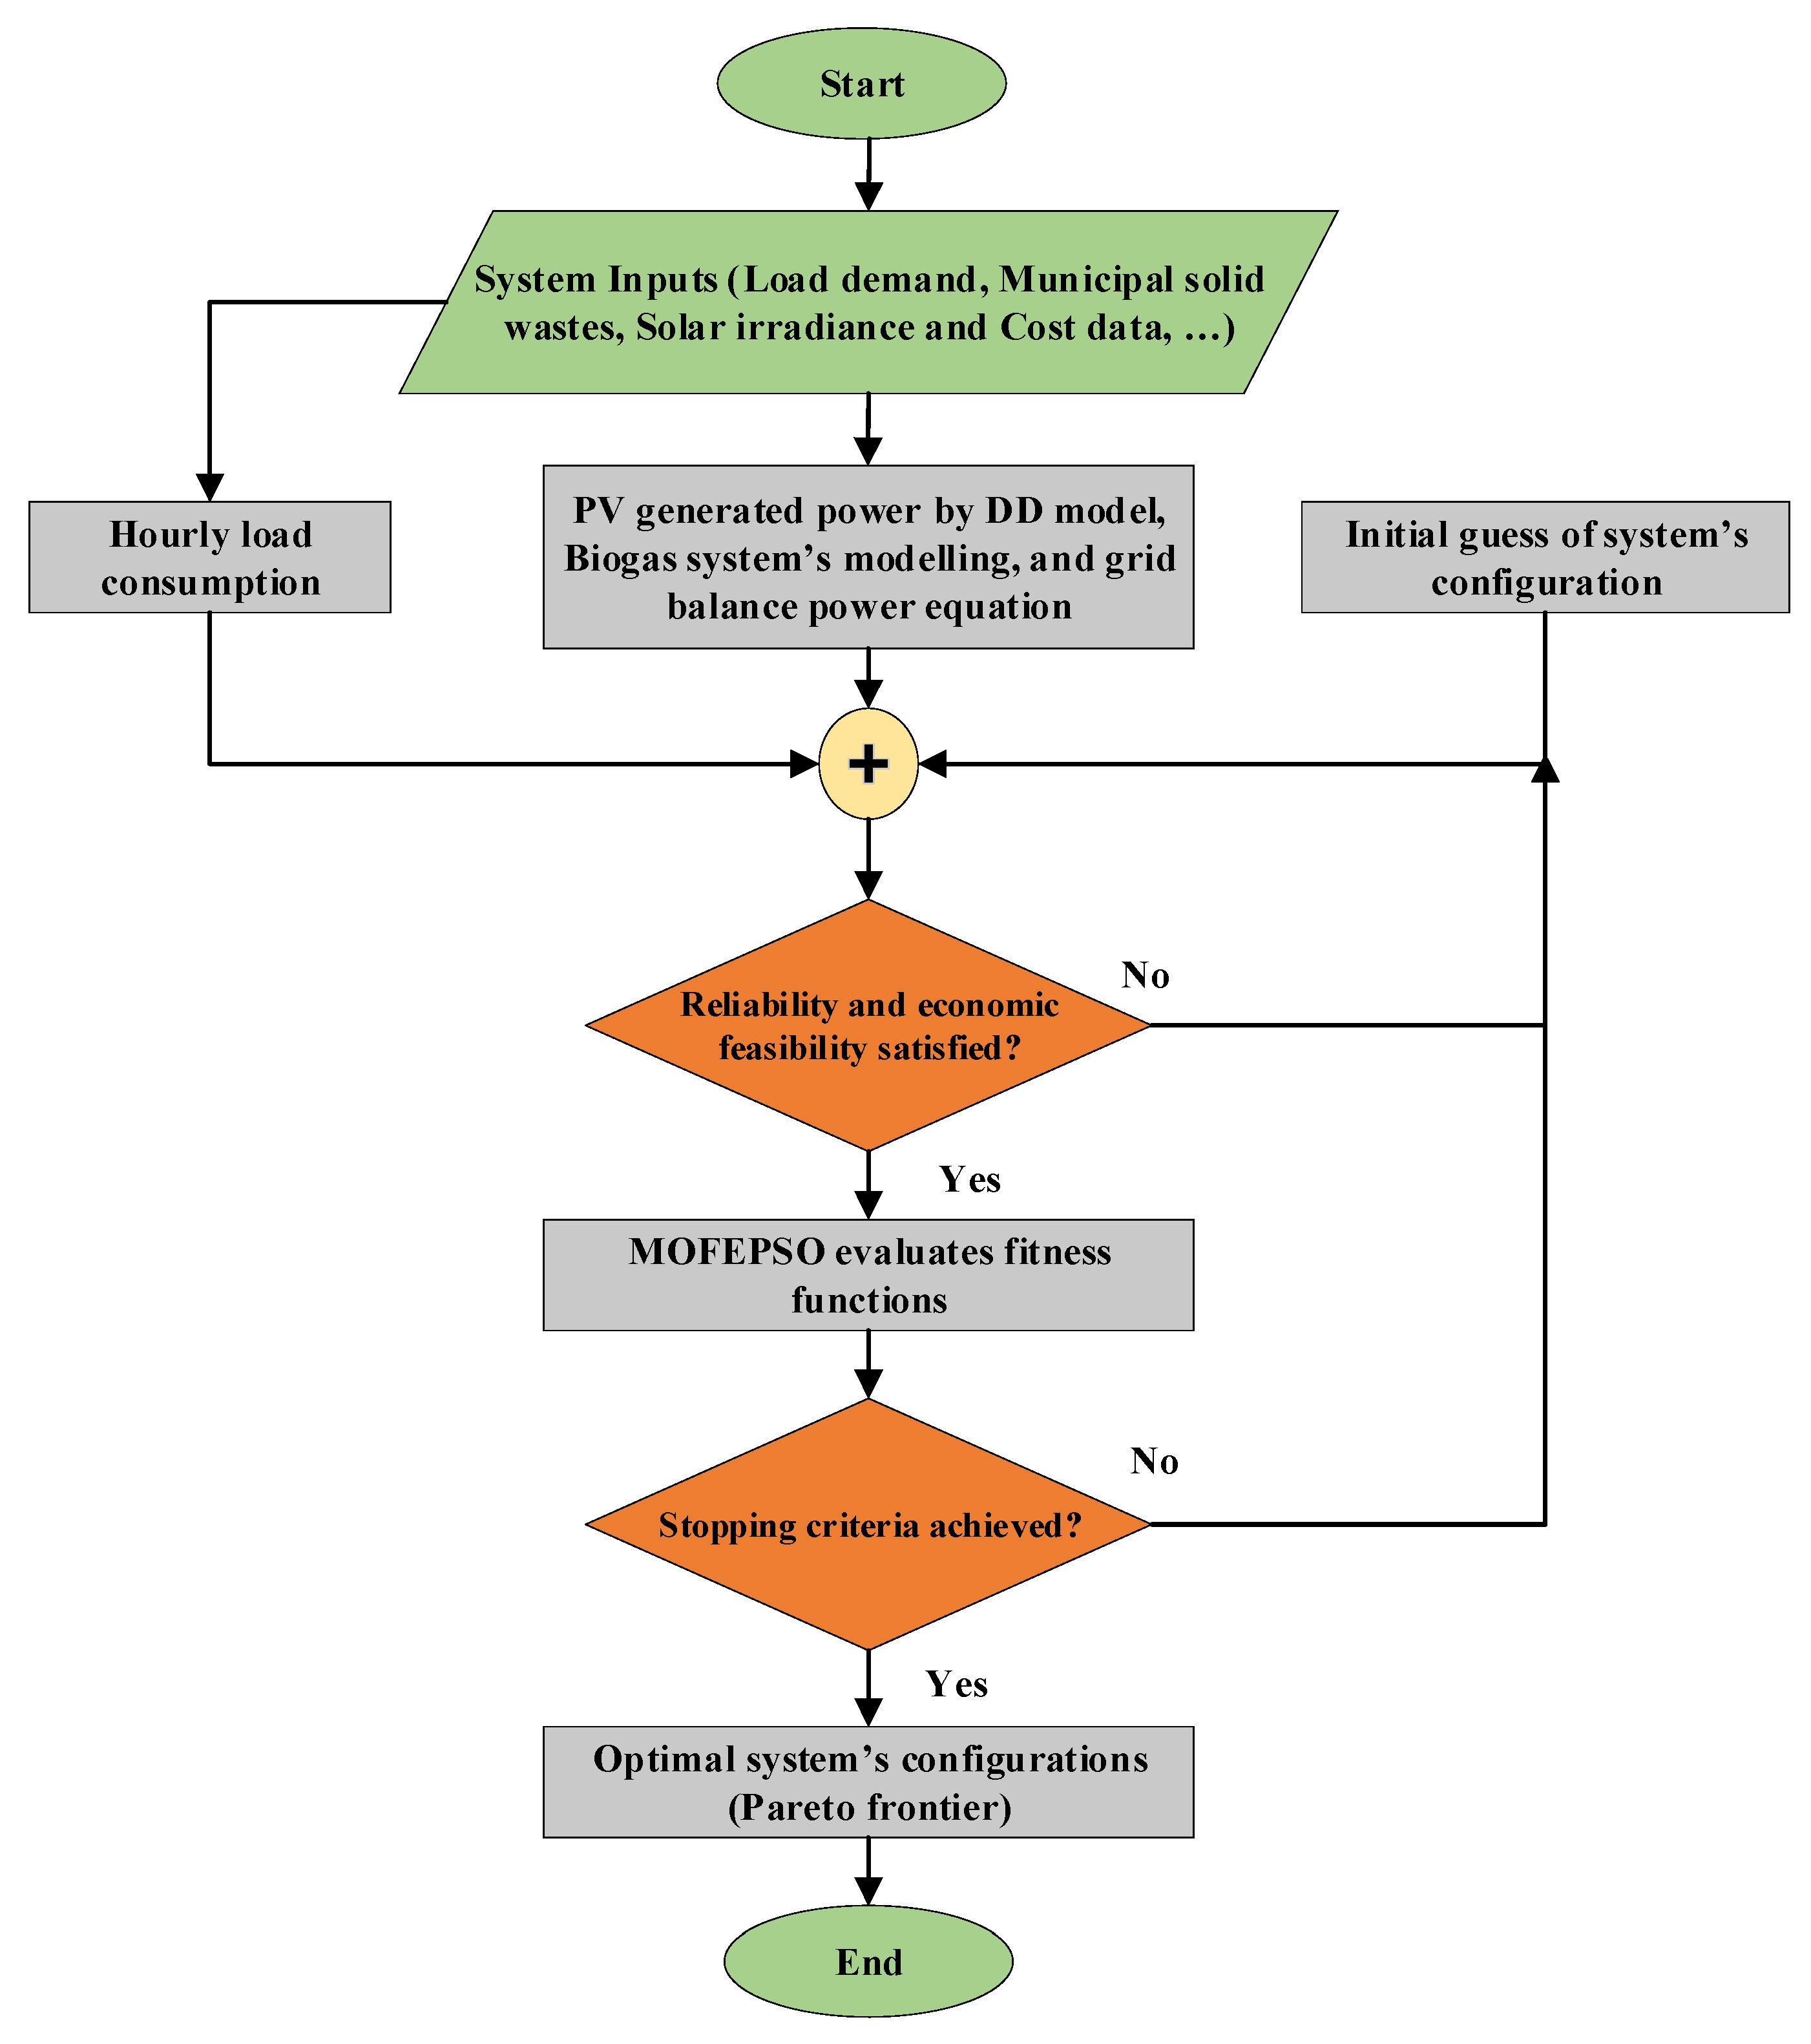
4. System’s Optimization
4.1. MOFEPSO Algorithm
4.2. Validation Procedure
5. Results and Discussion
6. Conclusions
Author Contributions
Funding
Acknowledgments
Conflicts of Interest
References
- Jaccard, M. Sustainable Fossil Fuels: The Unusual Suspect in the Quest for Clean and Enduring Energy; Cambridge University Press: Cambridge, UK, 2006. [Google Scholar]
- Wuebbles, D.J.; Jain, A.K. Concerns about climate change and the role of fossil fuel use. Fuel Processing Technol. 2001, 71, 99–119. [Google Scholar] [CrossRef]
- Demirtas, O. Evaluating the best renewable energy technology for sustainable energy planning. Int. J. Energy Econ. Policy 2013, 3, 23. [Google Scholar]
- Girardet, H.; Mendonça, M. A Renewable World: Energy, Ecology and Equality. A Report for the World Future Council; Green Books & Resurgence Books: Cambridge, UK, 2009. [Google Scholar]
- Boyle, G. Renewable Energy; Oxford University Press: New York, NY, USA, 2004; p. 456. [Google Scholar]
- Al-Soud, M.S.; Hrayshat, E.S. A 50 MW concentrating solar power plant for Jordan. J. Clean. Prod. 2009, 17, 625–635. [Google Scholar] [CrossRef]
- Awe, O.W.; Zhao, Y.; Nzihou, A.; Minh, D.P.; Lyczko, N. A review of biogas utilisation, purification and upgrading technologies. Waste Biomass Valorization 2017, 8, 267–283. [Google Scholar] [CrossRef] [Green Version]
- Panwar, N.J.M.; Change, A.S.F.G. Design and performance evaluation of energy efficient biomass gasifier based cookstove on multi fuels. Mitig. Adapt. Strateg. Glob. Chang. 2009, 14, 627–633. [Google Scholar] [CrossRef]
- Navani, J.; Sonal, S. Non-Conventional Energy Resources (for UPTU & UTU), 1st ed.; S. Chand Publishing Pvt. Ltd.: New Delhi, India, 2015. [Google Scholar]
- Inoplex. Electricity Generation from Biogas. Available online: https://www.inoplex.com.au/biogas/biogas-electric-generator (accessed on 2 November 2021).
- Peres, A.P.G.; Lunelli, B.H. Application of biomass to hydrogen and syngas production. Chem. Eng. Trans. 2013, 32, 589–594. [Google Scholar] [CrossRef]
- ENERGY.gov. Thermochemical Conversion Processes. Available online: www.energy.gov/eere/bioenergy/thermochemical-conversion-processes (accessed on 12 July 2021).
- Miao, C.; Teng, K.; Wang, Y.; Jiang, L. Technoeconomic Analysis on a Hybrid Power System for the UK Household Using Renewable Energy: A Case Study. Energies 2020, 13, 3231. [Google Scholar] [CrossRef]
- Singh, S.; Kaushik, S.C. Optimal sizing of grid integrated hybrid PV-biomass energy system using artificial bee colony algorithm. IET Renew. Power Gener. 2016, 10, 642–650. [Google Scholar] [CrossRef]
- Malik, P.; Awasthi, M.; Sinha, S. Study of grid integrated biomass-based hybrid renewable energy systems for Himalayan terrain. Int. J. Sustain. Energy Plan. Manag. 2020, 28, 71–88. [Google Scholar]
- Alturki, F.A.; Awwad, E.M. Sizing and cost minimization of standalone hybrid wt/pv/biomass/pump-hydro storage-based energy systems. Energies 2021, 14, 489. [Google Scholar] [CrossRef]
- González, A.; Riba, J.-R.; Rius, A. Optimal sizing of a hybrid grid-connected photovoltaic–wind–biomass power system. Sustainability 2015, 7, 12787–12806. [Google Scholar] [CrossRef] [Green Version]
- Al-Masri, H.M.; Magableh, S.K.; Abuelrub, A.; Alzaareer, K. Realistic coordination and sizing of a solar array combined with pumped hydro storage system. J. Energy Storage 2021, 41, 102915. [Google Scholar] [CrossRef]
- Al-Masri, H.M.; Al-Sharqi, A.A. Technical design and optimal energy management of a hybrid photovoltaic biogas energy system using multi-objective grey wolf optimisation. IET Renew. Power Gener. 2020, 14, 2765–2778. [Google Scholar] [CrossRef]
- Sinan Hasanoglu, M.; Dolen, M. Multi-objective feasibility enhanced particle swarm optimization. Eng. Optim. 2018, 50, 2013–2037. [Google Scholar] [CrossRef]
- Royal Scientific Society (RSS). Available online: http://www.rss.jo/ (accessed on 27 August 2021).
- NEPCO. Available online: https://www.nepco.com.jo/en/Default_en.aspx (accessed on 13 June 2021).
- Available online: https://portal.jordan.gov.jo/wps/portal/Home#/ (accessed on 27 August 2021).
- Municipality, G.A. Greater Amman Municipality (GAM) Ghabawi Municipal Solid Waste Landfill Stakeholder Engagement PlAN. Report version 2, Amman, Jordan, July 2019. Available online: https://www.amman.jo/site_doc/gen2.pdf (accessed on 3 January 2022).
- Daily Amounts of Solid Municipal Wastes. Available online: http://www.mma.gov.jo/Default.aspx (accessed on 4 November 2020).
- Cerofolini, G.; Polignano, M. Generation-recombination phenomena in almost ideal silicon p-n junctions. J. Appl. Phys. 1988, 64, 6349–6356. [Google Scholar] [CrossRef]
- Hegedus, S.S.; Luque, A. Status, trends, challenges and the bright future of solar electricity from photovoltaics. In Handbook of Photovoltaic Science and Engineering, 1st ed.; John Wiley & Sons: Chichester, UK; Hoboken, NJ, USA, 2003; pp. 1–43. [Google Scholar]
- Diaf, S.; Diaf, D.; Belhamel, M.; Haddadi, M.; Louche, A. A methodology for optimal sizing of autonomous hybrid PV/wind system. Energy Policy 2007, 35, 5708–5718. [Google Scholar] [CrossRef] [Green Version]
- Ekren, O.; Ekren, B.Y. Size optimization of a PV/wind hybrid energy conversion system with battery storage using simulated annealing. Appl. Energy 2010, 87, 592–598. [Google Scholar] [CrossRef]
- Roy, P.; Majumder, A.; Chakraborty, N. Optimization of a stand-alone Solar PV-Wind-DG Hybrid System for Distributed Power Generation at Sagar Island. AIP Conf. Proc. 2010, 1298, 260–265. [Google Scholar]
- Ekren, O.; Ekren, B.Y. Size optimization of a PV/wind hybrid energy conversion system with battery storage using response surface methodology. Appl. Energy 2008, 85, 1086–1101. [Google Scholar] [CrossRef]
- Eteiba, M.; Barakat, S.; Samy, M.; Wahba, W.I. Optimization of an off-grid PV/Biomass hybrid system with different battery technologies. Sustain. Cities Soc. 2018, 40, 713–727. [Google Scholar] [CrossRef]
- Tsai, H.-L.; Tu, C.-S.; Su, Y.-J. Development of generalized photovoltaic model using MATLAB/SIMULINK. In Proceedings of the World Congress on Engineering and Computer Science, San Francisco, CA, USA, 22–24 October 2008; pp. 1–6. [Google Scholar]
- Attivissimo, F.; Adamo, F.; Carullo, A.; Lanzolla, A.M.L.; Spertino, F.; Vallan, A. On the performance of the double-diode model in estimating the maximum power point for different photovoltaic technologies. Measurement 2013, 46, 3549–3559. [Google Scholar] [CrossRef]
- Ishaque, K.; Salam, Z.; Taheri, H. Simple, fast and accurate two-diode model for photovoltaic modules. Sol. Energy Mater. Sol. Cells 2011, 95, 586–594. [Google Scholar] [CrossRef]
- Al-Masri, H.M.; Magableh, S.K.; Abuelrub, A. Output power computation and sizing of a photovoltaic array by advanced modeling. Sustain. Energy Technol. Assess. 2021, 47, 101519. [Google Scholar] [CrossRef]
- Ishaque, K.; Salam, Z.; Taheri, H. Accurate MATLAB simulink PV system simulator based on a two-diode model. J. Power Electron. 2011, 11, 179–187. [Google Scholar] [CrossRef] [Green Version]
- Ramos Hernanz, J.; Campayo Martin, J.; Zamora Belver, I.; Larranaga Lesaka, J.; Zulueta Guerrero, E.; Puelles Perez, E. Modelling of photovoltaic module. In Proceedings of the International Conference on Renewable Energies and Power Quality (ICREPQ’10), Granada, Spain, 23–25 March 2010. [Google Scholar]
- Al-Masri, H.M.; Magableh, S.K.; Abuelrub, A.; Saadeh, O.; Ehsani, M. Impact of Different Photovoltaic Models on the Design of a Combined Solar Array and Pumped Hydro Storage System. Appl. Sci. 2020, 10, 3650. [Google Scholar] [CrossRef]
- Chin, V.J.; Salam, Z.; Ishaque, K. An accurate modelling of the two-diode model of PV module using a hybrid solution based on differential evolution. Energy Convers. Manag. 2016, 124, 42–50. [Google Scholar] [CrossRef]
- Ma, T.; Yang, H.; Lu, L.; Peng, J. Pumped storage-based standalone photovoltaic power generation system: Modeling and techno-economic optimization. Appl. Energy 2015, 137, 649–659. [Google Scholar] [CrossRef]
- Orioli, A.; Di Gangi, A. A procedure to evaluate the seven parameters of the two-diode model for photovoltaic modules. Renew. Energy 2019, 139, 582–599. [Google Scholar] [CrossRef]
- Gupta, A.; Saini, R.; Sharma, M. Steady-state modelling of hybrid energy system for off grid electrification of cluster of villages. Renew. Energy 2010, 35, 520–535. [Google Scholar] [CrossRef]
- Xu, L.; Ruan, X.; Mao, C.; Zhang, B.; Luo, Y. An improved optimal sizing method for wind-solar-battery hybrid power system. IEEE Trans. Sustain. Energy 2013, 4, 774–785. [Google Scholar]
- Diaf, S.; Notton, G.; Belhamel, M.; Haddadi, M.; Louche, A. Design and techno-economical optimization for hybrid PV/wind system under various meteorological conditions. Appl. Energy 2008, 85, 968–987. [Google Scholar] [CrossRef]
- Al-Shaalan, A.M. Reliability Evaluation of Power Systems. In Reliability and Maintenance-an Overview of Cases; Kounis, L.D., Ed.; IntechOpen: London, UK, 2018; pp. 1–25. [Google Scholar]
- Tian, Z.; Seifi, A.A. Reliability analysis of hybrid energy system. Int. J. Reliab. Qual. Saf. Eng. 2014, 21, 1450011. [Google Scholar] [CrossRef]
- Ai, B.; Yang, H.; Shen, H.; Liao, X. Computer-aided design of PV/wind hybrid system. Renew. Energy 2003, 28, 1491–1512. [Google Scholar] [CrossRef]
- Upadhyay, S.; Sharma, M. Development of hybrid energy system with cycle charging strategy using particle swarm optimization for a remote area in India. Renew. Energy 2015, 77, 586–598. [Google Scholar] [CrossRef]
- Arabali, A.; Ghofrani, M.; Etezadi-Amoli, M.; Fadali, M.S. Stochastic performance assessment and sizing for a hybrid power system of solar/wind/energy storage. IEEE Trans. Sustain. Energy 2013, 5, 363–371. [Google Scholar] [CrossRef]
- Environment, M.O. Jordan’s Third National Communication on Climate Change; Ministry of Environment: Amman, Jordan, 2014; pp. 1–281. Available online: https://unfccc.int/resource/docs/natc/jornc3.pdf (accessed on 3 January 2022).
- Bank, A.D. Guidelines for Estimating Greenhouse Gas Emissions of Asian Development Bank Projects: Additional Guidance for Clean Energy Projects; Asian Development Bank: Manila, Philippines, 2017. [Google Scholar]
- Stages, L.C. Life Cycle Greenhouse Gas Emissions from Solar Photovoltaics. 2012. Available online: https://www.nrel.gov/docs/fy13osti/56487.pdf (accessed on 3 January 2022).
- Amponsah, N.Y.; Troldborg, M.; Kington, B.; Aalders, I.; Hough, R.L. Greenhouse gas emissions from renewable energy sources: A review of lifecycle considerations. Renew. Sustain. Energy Rev. 2014, 39, 461–475. [Google Scholar] [CrossRef]
- Zhou, Y.; Swidler, D.; Searle, S.; Baldino, C. Life-Cycle Greenhouse Gas Emissions of Biomethane and Hydrogen Pathways in The European Union. In The International Council of Clean Transportation. 2021, pp. 27–36. Available online: https://www.h2knowledgecentre.com/content/policypaper2554 (accessed on 3 January 2022).
- Pohekar, S.D.; Ramachandran, M. Application of multi-criteria decision making to sustainable energy planning—A review. Renew. Sustain. Energy Rev. 2004, 8, 365–381. [Google Scholar] [CrossRef]
- Ho, W.; Xu, X.; Dey, P.K. Multi-criteria decision making approaches for supplier evaluation and selection: A literature review. Eur. J. Oper. Res. 2010, 202, 16–24. [Google Scholar] [CrossRef]
- Hasanoglu, M.S.; Dolen, M. Feasibility enhanced particle swarm optimization for constrained mechanical design problems. Proc. Inst. Mech. Eng. Part C J. Mech. Eng. Sci. 2018, 232, 381–400. [Google Scholar] [CrossRef]
- Hasanoğlu, M.S. An Advanced evolutionary programming method for mechanical system design: Feasibility enhanced particle swarm optimization. Ph.D. Thesis, Middle East Technical University, Ankara, Turkey, 2019; pp. 9–61. Available online: http://etd.lib.metu.edu.tr/upload/12623027/index.pdf (accessed on 3 January 2022).
- Kalesar, B.M.; Rouhollahi, B.; Noshahr, J.B.; Tadayon, M.; Kermani, M. Multi-Objective Fuzzy Model for Optimal Siting and Sizing of DG Units to Reduce Losses Using Genetic Algorithm. In Proceedings of the 2018 IEEE International Conference on Environment and Electrical Engineering and 2018 IEEE Industrial and Commercial Power Systems Europe (EEEIC/I&CPS Europe), Palermo, Italy, 12–15 June 2018; pp. 1–6. [Google Scholar]
- Alomoush, M.I. Microgrid combined power-heat economic-emission dispatch considering stochastic renewable energy resources, power purchase and emission tax. Energy Convers. Manag. 2019, 200, 112090. [Google Scholar] [CrossRef]


| Data | Unit | Values |
|---|---|---|
| Solar irradiance | kW/m2 | Set of 8760 points (365 days × 24 h) |
| Ambient temperatures | °C | Set of 8760 points (365 days × 24 h) |
| Municipal solid wastes | Gg | Set of 8760 points (365 days × 24 h) |
| Load demand | MW | Set of 8760 points (365 days × 24 h) |
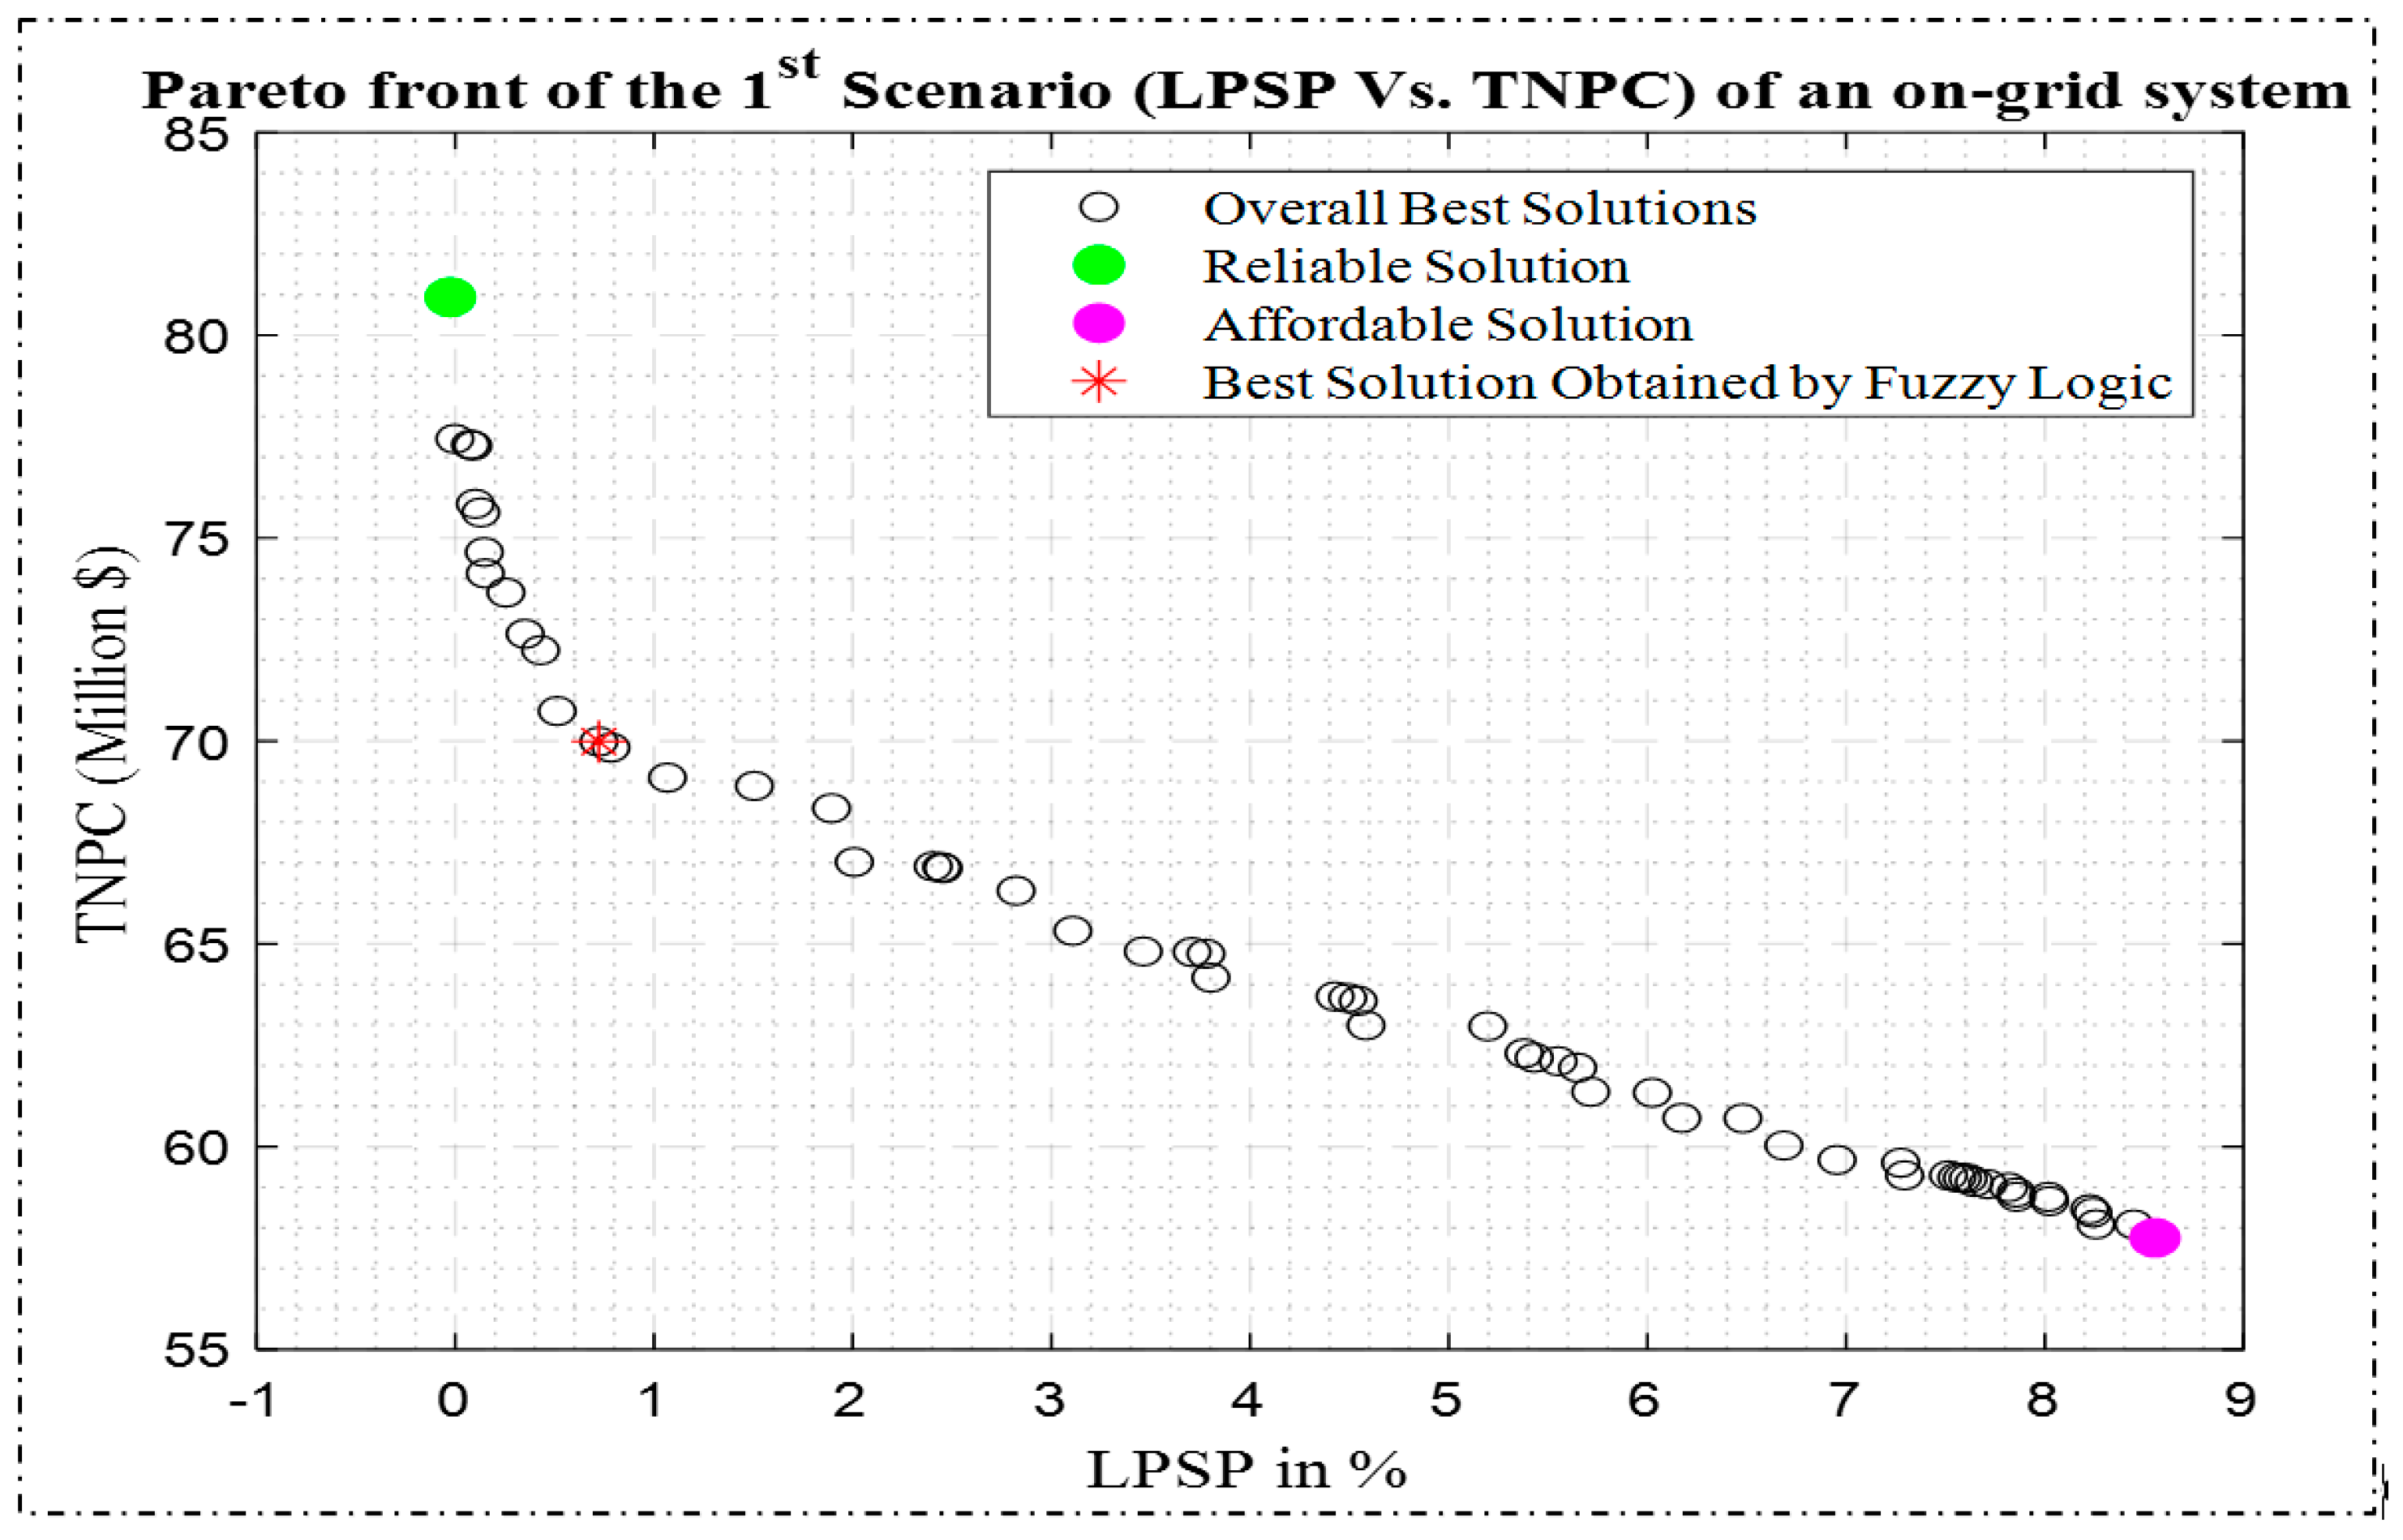
| Parameter | MOFEPSO | ||
|---|---|---|---|
| Reliable | Affordable | Best | |
| LPSP (%) | 0.0238 | 8.5758 | 0.72258 |
| TNPC (Million USD) | 81.219 | 57.769 | 69.988 |
| 35,731 | 28,625 | 29,137 | |
| (h/day) | 3.3884 | 24 | 6.1879 |
| (GWh) | 19.1381 | 15.332 | 15.606 |
| (GWh) | 14.356 | 2.11524 | 8.1706 |
| (GWh) | 33.4936 | 17.4472 | 23.7768 |
| (GWh) | 5.4027 | 14.4818 | 10.791 |
| (GWh) | 11.40675 | 7.63882 | 8.2346 |
| (GWh) | 26.5115 | 26.5115 | 26.5115 |
| ACS (Million USD/yr) | 7.081 | 5.0366 | 6.1019 |
| LCOE (USD/kWh) | 0.2671 | 0.189976 | 0.23016 |
| EENS (GWh) | 0.0063197 | 2.26722 | 0.19206 |
| LOLP (%) | 0.3995 | 0.382192 | 0.11861 |
| LOLE (days) | 1.4582 | 1.395 | 0.54834 |
| IR (%) | 99.976 | 91.422 | 99.277 |
| Annual biogas working hours | 5779 | 6030 | 6006 |
| (Gg/year) | 4.0722 | 10.91556 | 8.1339 |
| (Gg/year) | 19.189 | 9.996 | 13.6223 |
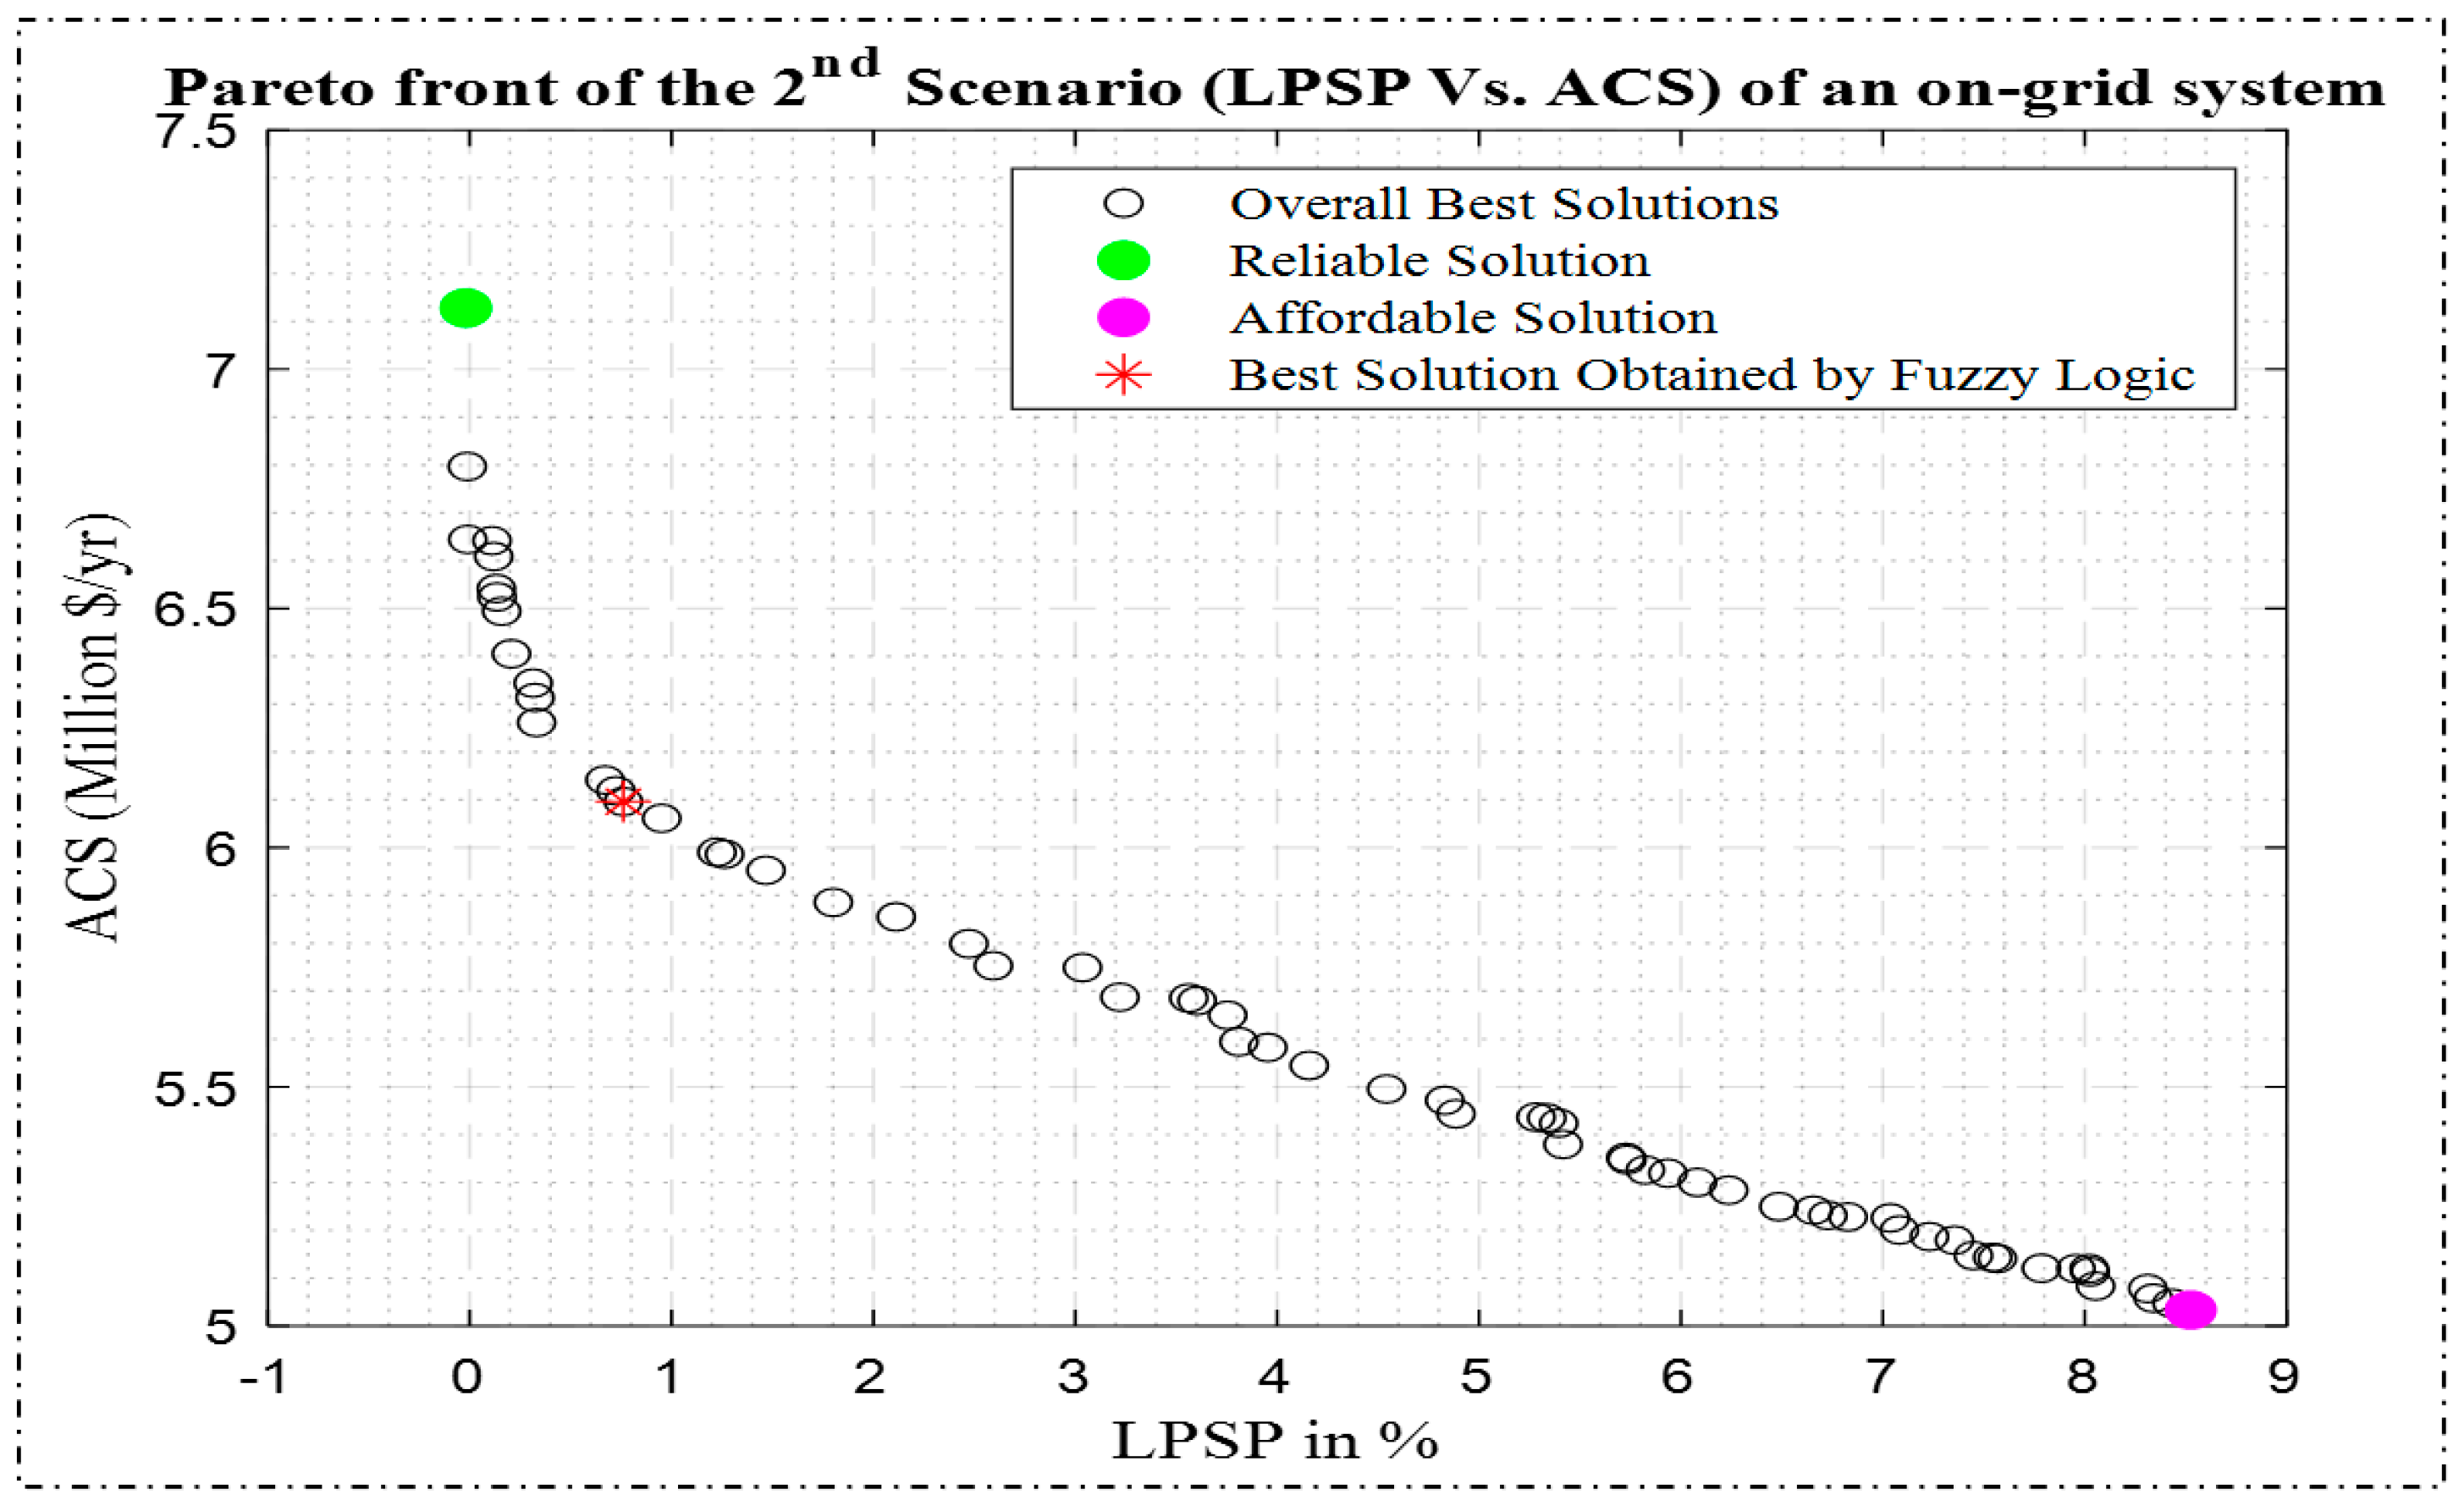
| Parameter | MOFEPSO | ||
|---|---|---|---|
| Reliable | Affordable | Best | |
| LPSP (%) | 0.0016 | 8.5184 | 0.76102 |
| ACS (Million USD/yr) | 7.1282 | 5.0341 | 6.0964 |
| 58,923 | 29,042 | 28,873 | |
| (h/day) | 3.7966 | 24 | 6.2463 |
| (GWh) | 31.5601 | 15.55535 | 15.465 |
| (GWh) | 11.9402 | 2.108095 | 8.1119 |
| (GWh) | 43.5003 | 17.66345 | 23.5767 |
| (GWh) | 6.427336 | 1.4458433 | 10.858 |
| (GWh) | 14.75387 | 7.806553 | 8.127 |
| (GWh) | 26.51155 | 26.51155 | 26.51155 |
| Annual biogas working hours | 5385 | 6010 | 6019 |
| TNPC (Million USD) | 80.436 | 57.7407 | 69.925 |
| LCOE (USD/kWh) | 0.26405 | 0.189885 | 0.22995 |
| EENS (GWh) | 0.0044434 | 2.258366 | 0.1998 |
| LOLP (%) | 0.010959 | 0.383105 | 0.12169 |
| LOLE (days) | 0.04 | 1.39833 | 0.54834 |
| IR (%) | 99.84 | 91.4816 | 99.239 |
| (Gg/year) | 4.84457 | 10.89797 | 8.18434 |
| (Gg/year) | 24.9224 | 10.1198 | 13.5084 |
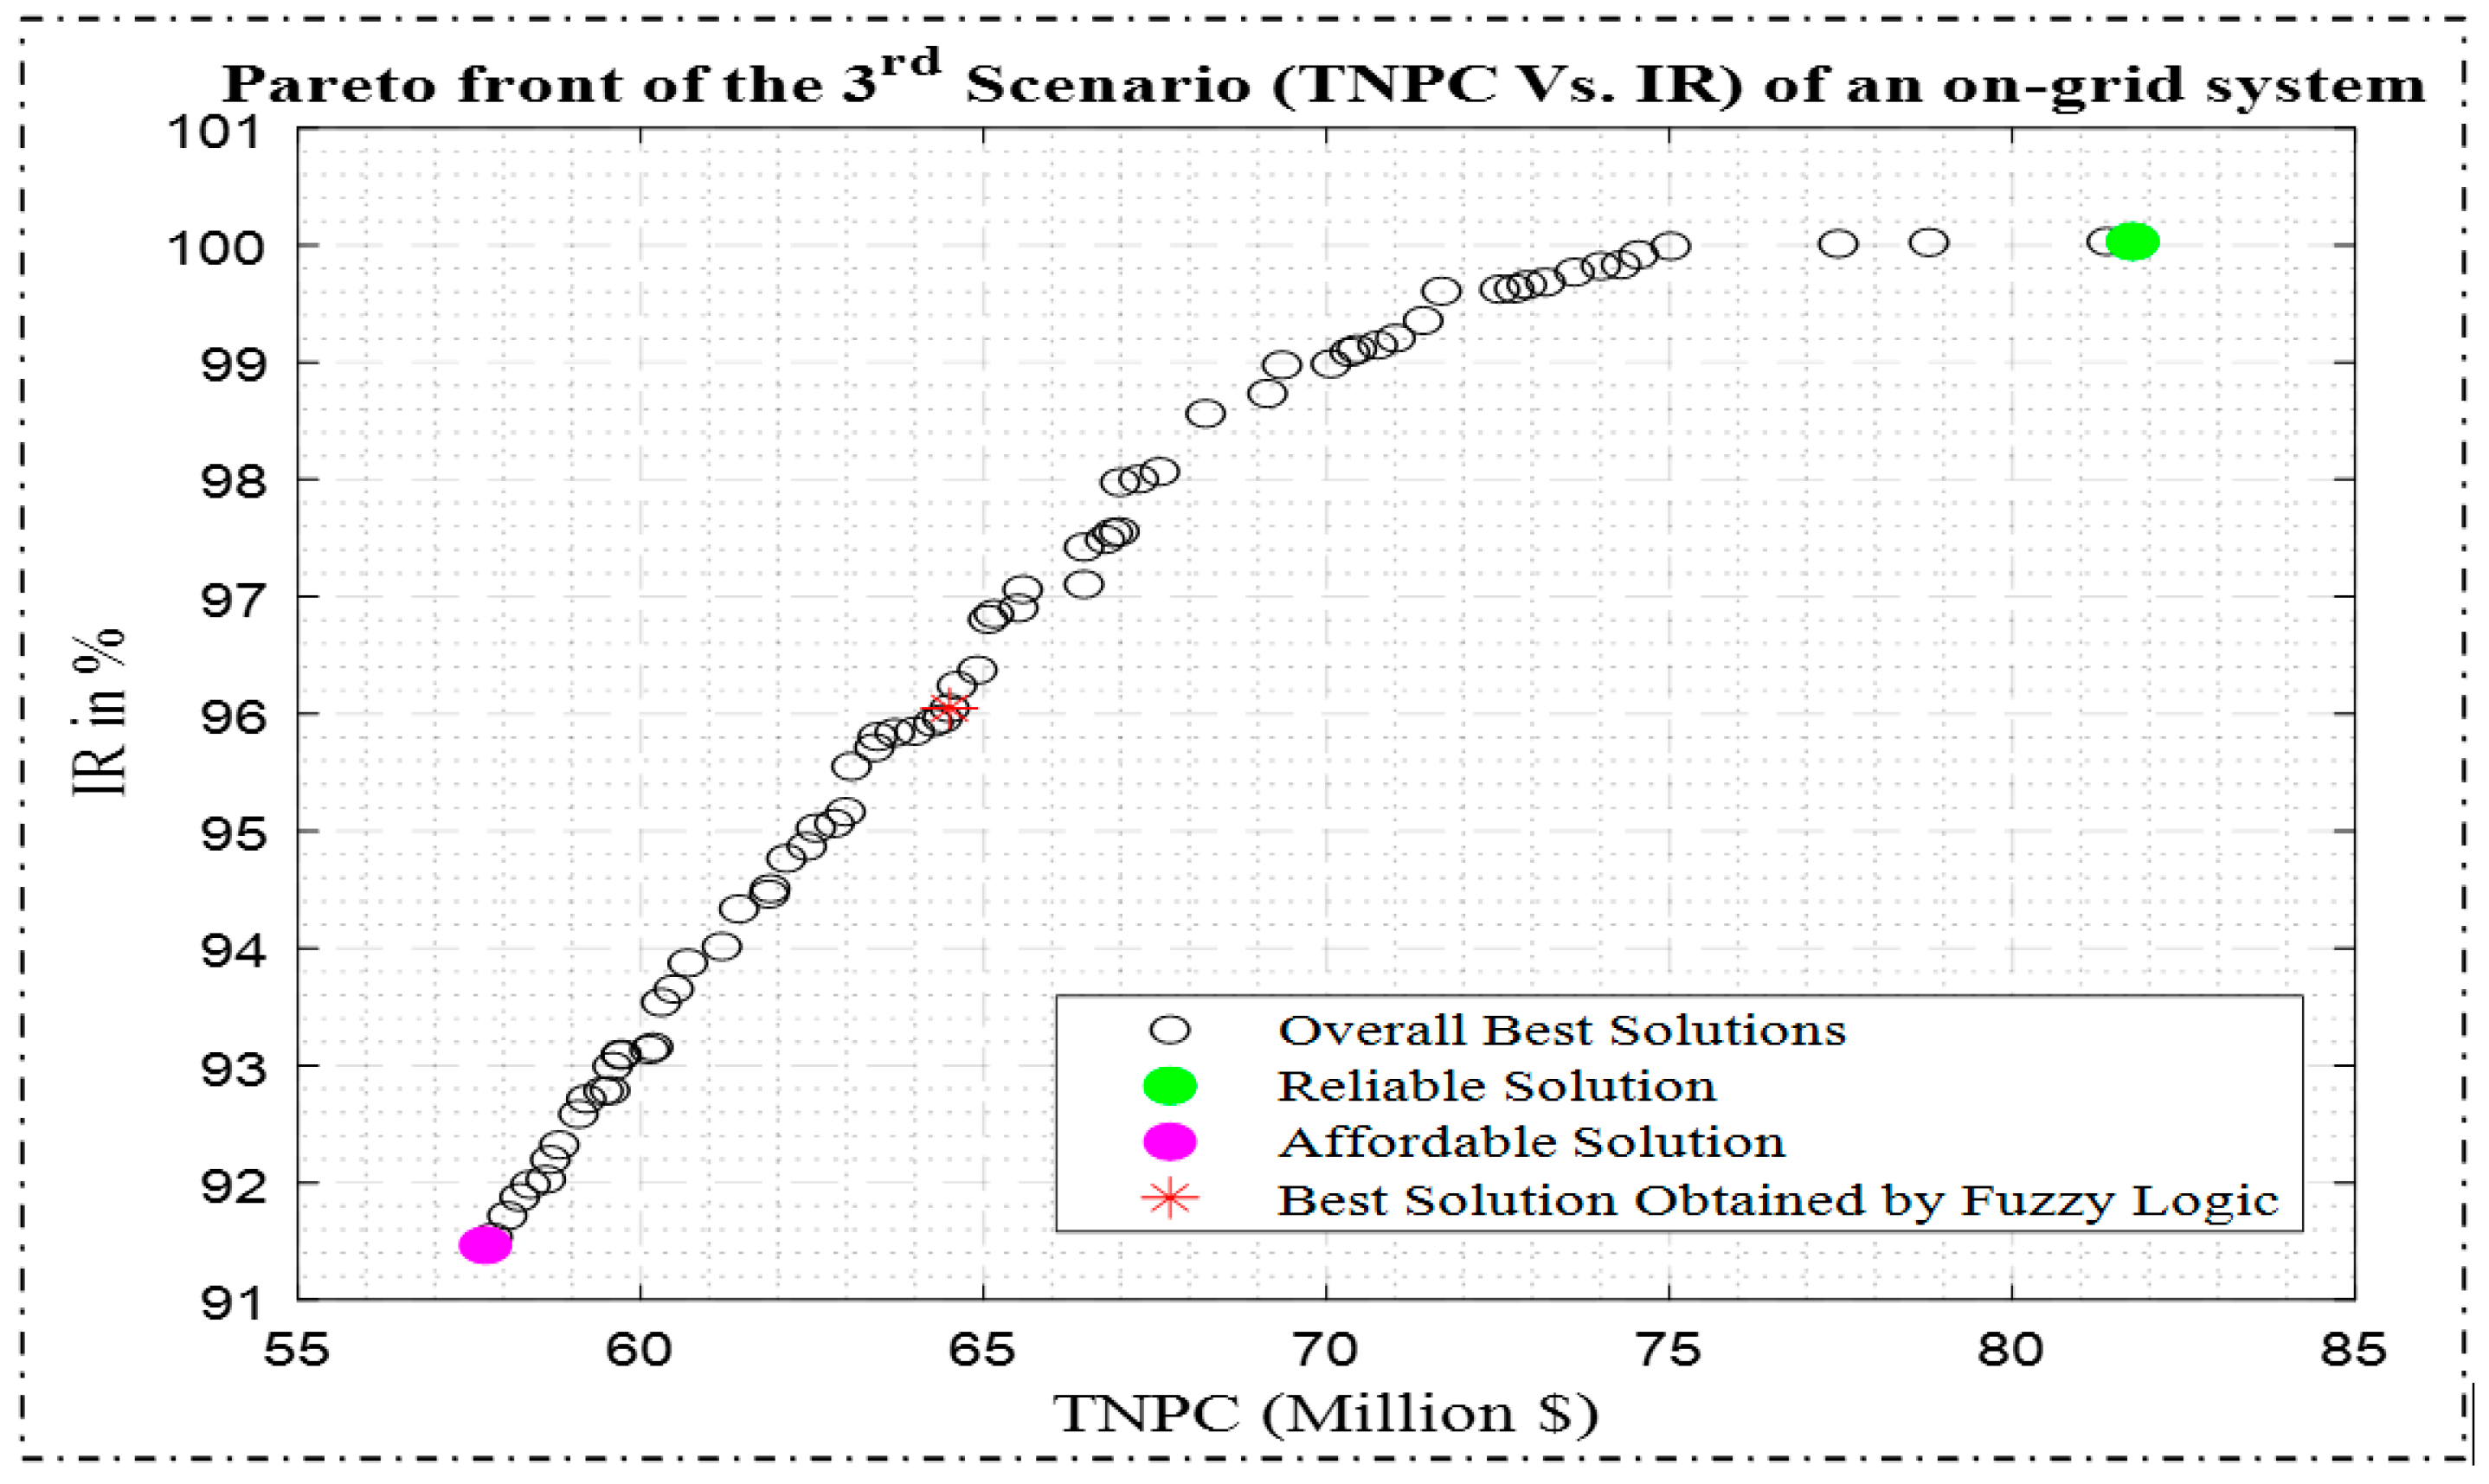
| Parameter | MOFEPSO | ||
|---|---|---|---|
| Reliable | Affordable | Best | |
| IR (%) | 99.997 | 91.467 | 96.048 |
| TNPC (Million USD) | 81.756 | 57.736 | 64.504 |
| 35,495 | 29,132 | 33,459 | |
| (h/day) | 3.6268 | 24 | 12.498 |
| (GWh) | 19.012 | 15.5666 | 17.92117 |
| (GWh) | 13.4395 | 2.107013 | 3.940154 |
| (GWh) | 32.451 | 17.67362 | 21.86132 |
| (GWh) | 6.1346 | 14.45728 | 13.32946 |
| (GWh) | 11.149 | 7.814196 | 9.45776 |
| (GWh) | 26.5115 | 26.5115 | 26.5115 |
| ACS (Million USD/yr) | 7.1279 | 5.0338 | 5.489314 |
| LCOE (USD/kWh) | 0.2622 | 0.1899 | 0.2071 |
| EENS (GWh) | 0.00524 | 2.2633967 | 1.30428 |
| LOLP (%) | 0.0079 | 0.382306 | 0.2901 |
| LOLE (days) | 0.5483 | 0.5483 | 0.54834 |
| LPSP (%) | 0.003 | 8.5610 | 4.8530 |
| Annual biogas working hours | 5790 | 6007 | 5850 |
| (Gg/year) | 4.62393 | 10.8971 | 10.047 |
| (Gg/year) | 18.5922 | 10.1256 | 12.5249 |
Publisher’s Note: MDPI stays neutral with regard to jurisdictional claims in published maps and institutional affiliations. |
© 2022 by the authors. Licensee MDPI, Basel, Switzerland. This article is an open access article distributed under the terms and conditions of the Creative Commons Attribution (CC BY) license (https://creativecommons.org/licenses/by/4.0/).
Share and Cite
Al-Masri, H.M.K.; Al-Sharqi, A.A.; Magableh, S.K.; Al-Shetwi, A.Q.; Abdolrasol, M.G.M.; Ustun, T.S. Optimal Allocation of a Hybrid Photovoltaic Biogas Energy System Using Multi-Objective Feasibility Enhanced Particle Swarm Algorithm. Sustainability 2022, 14, 685. https://doi.org/10.3390/su14020685
Al-Masri HMK, Al-Sharqi AA, Magableh SK, Al-Shetwi AQ, Abdolrasol MGM, Ustun TS. Optimal Allocation of a Hybrid Photovoltaic Biogas Energy System Using Multi-Objective Feasibility Enhanced Particle Swarm Algorithm. Sustainability. 2022; 14(2):685. https://doi.org/10.3390/su14020685
Chicago/Turabian StyleAl-Masri, Hussein M. K., Abed A. Al-Sharqi, Sharaf K. Magableh, Ali Q. Al-Shetwi, Maher G. M. Abdolrasol, and Taha Selim Ustun. 2022. "Optimal Allocation of a Hybrid Photovoltaic Biogas Energy System Using Multi-Objective Feasibility Enhanced Particle Swarm Algorithm" Sustainability 14, no. 2: 685. https://doi.org/10.3390/su14020685
APA StyleAl-Masri, H. M. K., Al-Sharqi, A. A., Magableh, S. K., Al-Shetwi, A. Q., Abdolrasol, M. G. M., & Ustun, T. S. (2022). Optimal Allocation of a Hybrid Photovoltaic Biogas Energy System Using Multi-Objective Feasibility Enhanced Particle Swarm Algorithm. Sustainability, 14(2), 685. https://doi.org/10.3390/su14020685