Article

Application of Artificial Intelligence for Predicting Erosion of Biochar Amended Soils

1
Guangdong Engineering Center for Structure Safety and Health Monitoring, Shantou University, Shantou 515063, China
2
Indian Institute of Technology Jammu, Jammu 181221, India
*
Author to whom correspondence should be addressed.
Sustainability 2022, 14(2), 684; https://doi.org/10.3390/su14020684
Submission received: 6 December 2021 / Revised: 4 January 2022 / Accepted: 4 January 2022 / Published: 9 January 2022
(This article belongs to the Section Sustainable Engineering and Science)

Abstract

:
Recently, incentives have been provided in developed countries by the government for commercial production of biochar for soil treatment, and other construction uses with an aim to reduce a significant amount of carbon emissions by 2030. Biochar is an important material for the development of circular economy. This study aims to develop a simple Artificial Neural Network (ANN) based model to predict erosion of biochar amended soils (BAS) under varying conditions (slope length, slope gradient, rainfall rate, degree of compaction (DoC), and percentage of biochar amendments). Accordingly, a model has been developed to estimate the total erosion rate and total water flow rate as a function of the above conditions. The model was developed based on available data from flume experiments. Based on ANN modelling results, it was observed that slope length was the most important factor in determining total erosion rate, followed by slope gradient, DoC, and percentage of biochar amendment. The percentage of biochar amendment was a leading factor in the total water flow rate determination as compared to other factors. It was also found that the reduction in erosion is relatively minimal during an increase in slope length up to 1.55 m, reducing sharply beyond that. At a slope length of 2 m, erosion is found to be reduced by 33% (i.e., 2.6 to 1.75), whereas the total flow rate decreases linearly from 1250 mL/m2/min to 790 mL/m2/min. The ANN model developed shows that soil biochar composite (SBC) with 5% biochar amendment gave the best results in reducing soil erosion. This study can be a helpful tool in providing preliminary guidelines for using biochar in erosion control.

Graphical Abstract

1. Introduction

Soil erosion is the natural process of detachment, transportation, and soil deposition by water, wind, or gravitational forces [1]. Crop cultivation over a long period of time also decreases soil’s organic content and causes acidification, making the soil prone to more erosion [2]. This leads to soil degradation and a decrease in the productivity of the land. Soil erosion also causes siltation of natural and artificial water bodies and flooding of lower plains. It may also lead to pollution of water/land downstream. Researchers believe that the loss of organic matter in the soil due to erosion might be a probable reason for global warming [3]. Effective measures such as maintaining the soil’s organic and moisture content, improving aggregate stability, and optimizing soil’s hydraulic conductivity need to be administered [2,4,5,6] to limit soil erosion. Holz et al. (2015) [1] listed moisture content, porosity, surface roughness, texture, and soil aggregation as key soil properties that determine the possible extent of soil erosion [1]. Soil erosion is influenced by various factors, amongst which slope condition, soil properties, and rainfall intensity are considered the most influential [7]. Rainfall (amount, duration, sequence, and intensity) is the most important factor determining the soil erosion quantity [1,8,9]. Long and steeper slopes are favorable factors for erosion [1,9,10]. It has been observed that compaction collapses micropores, decreases subsurface seepage flux, and increases runoff, thereby providing favorable conditions for increased erosion [1,11,12]. The effect of erosion has been experienced by 90% of the world’s agricultural land. Given the above factors which influence erosion, it is observed that the topographical and climatic factors are beyond human control; however, the inherent soil properties and vegetation can be modified.
Soil conservation is very important because the soil formation rate is generally far slower than its erosion rate [13,14]. The topmost fertile soil layer is lost due to erosion [15,16], making it less productive and creating siltation problems in water bodies and catchment areas. Vegetation cover and litter (grass, trees, herbs, shrubs, and residue) help reduce soil erosion [1,8,17,18,19,20,21,22]. Therefore, farmers are being encouraged by government bodies to adopt soil conservation methods such as the growth of hedges, reduced tillage, and straw mulch [3,23]. It is observed that the use of residues obtained from agriculture and forests as a soil amendment reduces soil erosion and its nutrient loss [3,24,25]. Researchers use different measures and soil amendments to reduce soil erosion [13]. From the literature, it has also been observed that the use of biochar as a soil amendment is a novel and promising approach. It enhances soil quality for better water holding capacity (WHC), higher agricultural productivity, improves geoengineering works, and reduces environmental pollution and erosion [3,26,27,28,29,30,31,32,33,34,35].
United States Environmental Protection Agency (USEPA) guidelines advocate vegetation growth on the soil’s surface to reduce erosion [36]. The vegetation growth depends on soil properties and, as such, can be increased by simply modifying them. The nutrient value of biochar and its function as a carbon sink increases vegetation growth, macroaggregate stability [2,7,37,38], modifies soil properties, like subsurface seepage flux, WHC, surface functionality and compaction, [2,30,36,39,40,41,42], and directly or indirectly helps control erosion [2,36,43]. Pinhole tests demonstrated that increased water content in biochar amended soils (BAS) decreases erosion rate [36]. Abrol et al. (2016) [44] made a hypothesis that the biochar amendment of sealing prone soils causes electrolytes present in biochar to dissolve in soil solution and reduce erosion by increasing subsurface seepage flux. While using 2% biochar amendment in non-calcareous loamy sand, the subsurface seepage flux was high, and soil loss was less [44]. Various studies have reported the use of vermicompost in Northern Vietnam for increasing vegetation in soils degraded by erosion. The influence of biochar on WHC, porosity and hydraulic conductivity of soil reduces erosion due to increased subsurface seepage flux and less runoff [43].
Computational techniques such as dimensional analysis [45], k-nearest neighbor (KNN) [46], multiple regression analysis [32], and Artificial Neural Network (ANN) are seen as multidimensional, less tedious, flexible, and advanced numerical approaches used by researchers for solving various types of engineering problems [46,47,48,49,50,51]. Researchers have used ANN for explaining and predicting complex material behaviours in various studies. For example, Bordoloi et al. (2019) [52] adopted ANN modelling to study the distribution of the Crack Intensity Factor (CIF). Arif et al. (2017) [53] adopted ANN to develop an erosion model based on erosivity, erodibility, length, and slope. More recently, Wani et al. (2020) [33] used machine learning for model development to predict biochar properties like O/C and H/C from the pyrolysis conditions, volatile matter content, and pH value for different types of biochar.
This study aims to develop an ANN model for predicting erosion as a function of biochar content, degree of Compaction (DoC), slope gradient, slope length, and rainfall intensity. Further, the study also attempts to analyze the optimum percentage of biochar amendment for erosion control. Data for the development of the model was obtained from Cai et al. (2020) [7]. The study conducted by [7] investigated erosion control by using biochar at 5% and 10% amendment ratio on a small scale and in controlled laboratory conditions. However, some shortcomings have been noticed, including the use of specific biochar and soil, slope, and rainfall conditions that limit the use of results for further research. The methodology for the experimental setup includes the use of simple bare soil. The vegetation in the soil has not been considered. The above shortcomings have been addressed by the use of ANN. The model developed is flexible and can predict erosion control with biochar amendment of any ratio, slope conditions, and rainfall intensity. The developed model can be useful in the preliminary design and analysis of green cover amended with biochar. Such a model can also provide the efficiency of biochar amendment and the required optimal content under various slope and soil conditions.

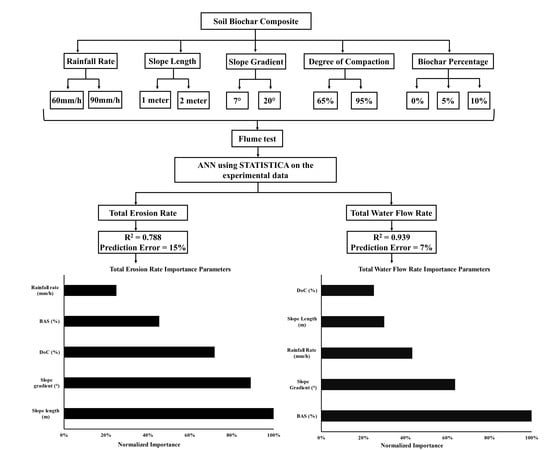
2. Materials and Methodology

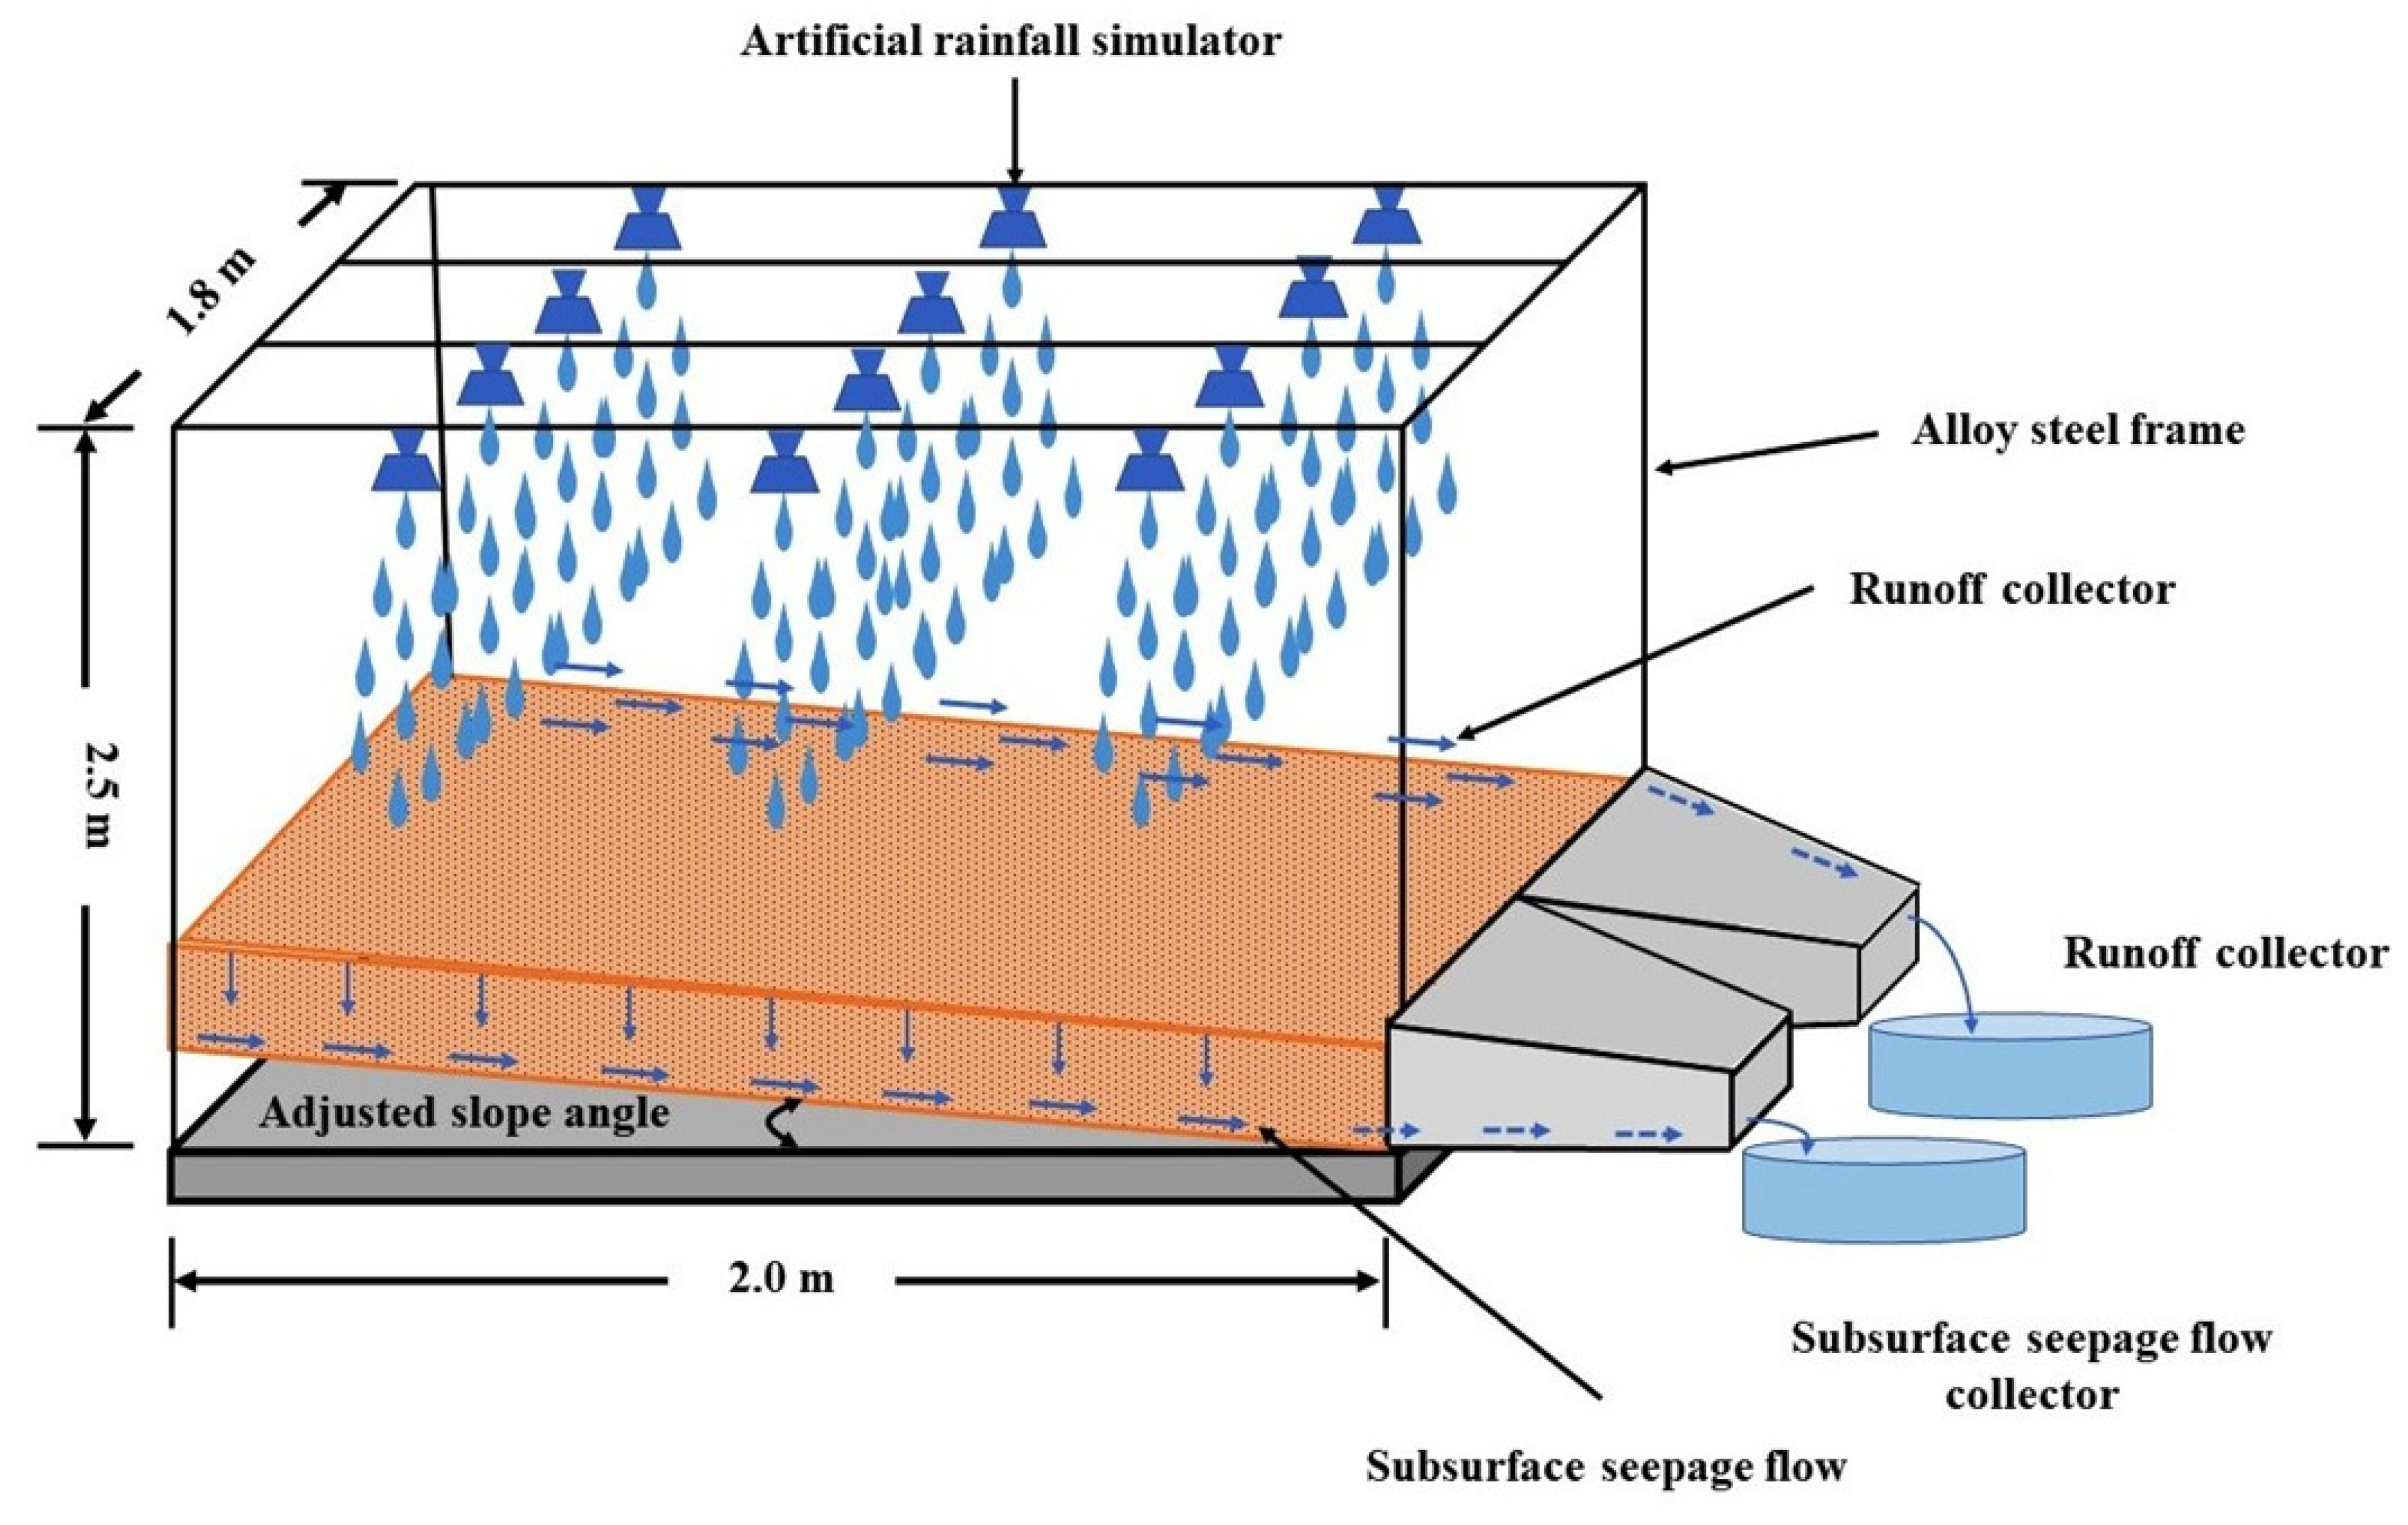
2.1. Experimental Program for Measurement of Erosion in the Soil-Biochar Mix Using Flume Setup

Experimental data were obtained from a study where erosion tests using flume were conducted. In the study by Cai et al. (2020) [7], an in-house flume setup was developed containing a 1.50-m-high rainfall simulator designed to simulate 60 mm/hour and 90 mm/hour rainfall [7]. The actual rainfall intensity was measured using a pluviograph. In addition, a tank filled with distilled water was installed. The calibration was conducted using hydraulic pressure and pluviograph recordings at a rate of 0.1 MPa for 60 mm/hour and 0.15 MPa for 90 mm/hour. An alloy steel frame was added to the flume setup to measure rainfall-induced runoff and subsurface seepage flux. The flume’s width was 0.6 m, and length was 1 m and 2 m, respectively, as shown in Figure 1. A drainage layer containing geotextile fiber (for minimizing soil particle flow) and a 6 cm thick gravel layer were placed below the soil layer.
Colluvial soil consisting of medium sand (82%), fine sand (16%), and silt and clay (2%) was adopted for flume tests. The sample was taken from the top (0–0.5-m depth) ground layer at the Shantou University campus (located not far from the South China sea) and classified by SP (ASTM-CS) as poorly graded sand. Biochar was produced from the invasive weed “Water hyacinth” collected from the coastal region of Shantou, China. Biochar is well known to have higher stability in terms of life (>100 years) [33] as compared to water hyacinth biomass, which is prone to degradation upon microbial activity. Therefore, biochar is a relatively stable carbon that can be utilized for geotechnical engineering structures (landfill cover, slope cover), which have more extended design periods (30–50 years) [33]. Shredded and air-dried water hyacinth stems were pyrolyzed [7] to prepare biochar. The slow pyrolysis process was done at a temperature starting from room temperature to 600°C at a 10°C/min heating rate. The maximum temperature maintained was 600°C. Biochar produced in-house possesses a porous structure, large surface area, and high surface functional groups. Biochar was powdered by crushing to below 2 mm size. The chemical properties were analyzed by Zeta (ξ) potential and Fourier Transform Infrared (FTIR) [54]. Zeta (ξ) potential and surface charge values were observed to be 16.9 mV and 1.54 × 10⁻⁶ C/cm2, respectively. Physical characteristics of biochar particle surface were analyzed using particle shape analysis (Occhio, Angleur, Belgium). Properties of biochar indicate a high degree of irregularity, convexity, and roughness. A higher surface area of biochar (15 µm−1) is also likely to enhance interaction between biochar, soil and water [55].
After preparation, biochar was added to the soil with an amendment ratio of 5% and 10%. Measured optimum water content and dry density for bare soil were 12% and 19 kN/m3, respectively. Compaction rates of 65% and 95% corresponding to agricultural and engineering applications, respectively, were considered. An increase in water content and a decrease in dry density were observed upon mixing of biochars. The optimum water content values for 5% and 10% BAS were 12% and 13%, whereas dry density was 18.8 kN/m3 and 18.6 kN/m3, respectively. The specific gravity of bare soil and soil amended with 5% and 10% biochar was 2.59, 2.59, and 2.55, respectively. The void ratios of bare soil, 5% and 10% biochar amended soil at 65% compaction degree were found as 1.31, 1.34, and 1.33, respectively. In contrast, the void ratios at 95% compaction for these samples were found as 0.58, 0.60, and 0.59, respectively. Thus, the results showed an increase in void ratio and a decrease in specific gravity with the addition of percentages of biochar to soil.

2.2. Test Plan and Procedure

A full factorial experimental plan was designed considering possible coupled effects of combinations of low and high levels of all parameters [56]. To meet the practical engineering slope design, as suggested by [57], [58], and [59], the authors considered mild (7°) and moderate slopes (20°) in combination with four other factors (slope gradient, compaction, rainfall, and slope length) [57,58,59]. The soil-biochar mix was subjected to 60 mm/hour and 90 mm/hour rainfall intensity. The slope lengths of 1 m and 2 m were selected [57,58]. A total of 16 experimental runs on three different soils viz. bare soil, 5% biochar amended soil, and 10% biochar amended soil were made as per the formula 2n = 16, where n is the number of factors. A total of 96 experiments, including duplicates, were conducted considering combinations of high and low levels of each factor.
The biochar and soil composite samples were prepared by mixing designed quantities and then placed over the flume. The samples were compacted to the desired degree of compaction of 65% and 95% in three layers. Samples were then subjected to three hours of rainfall with minimum soil loss and left overnight for moisture equilibrium and maintained under similar initial conditions. Rainwater could penetrate the soil medium and retain in the soil pores, leading to excess water subsurface seepage flux. Infiltrated and runoff water was collected separately and measured. Afterwards, the samples were subjected to two hours of rainfall, and the measurements of subsurface seepage flux and runoff were taken every 5 min for 30 s [60]. The runoff and subsurface seepage flux quantities were deduced from these measurements. The sum of two quantities (runoff and subsurface seepage) constituted the total water flow rate. Total soil erosion rate was calculated by oven drying the collected water from runoff and subsurface seepage flux (infiltration) quantities at 105 °C.

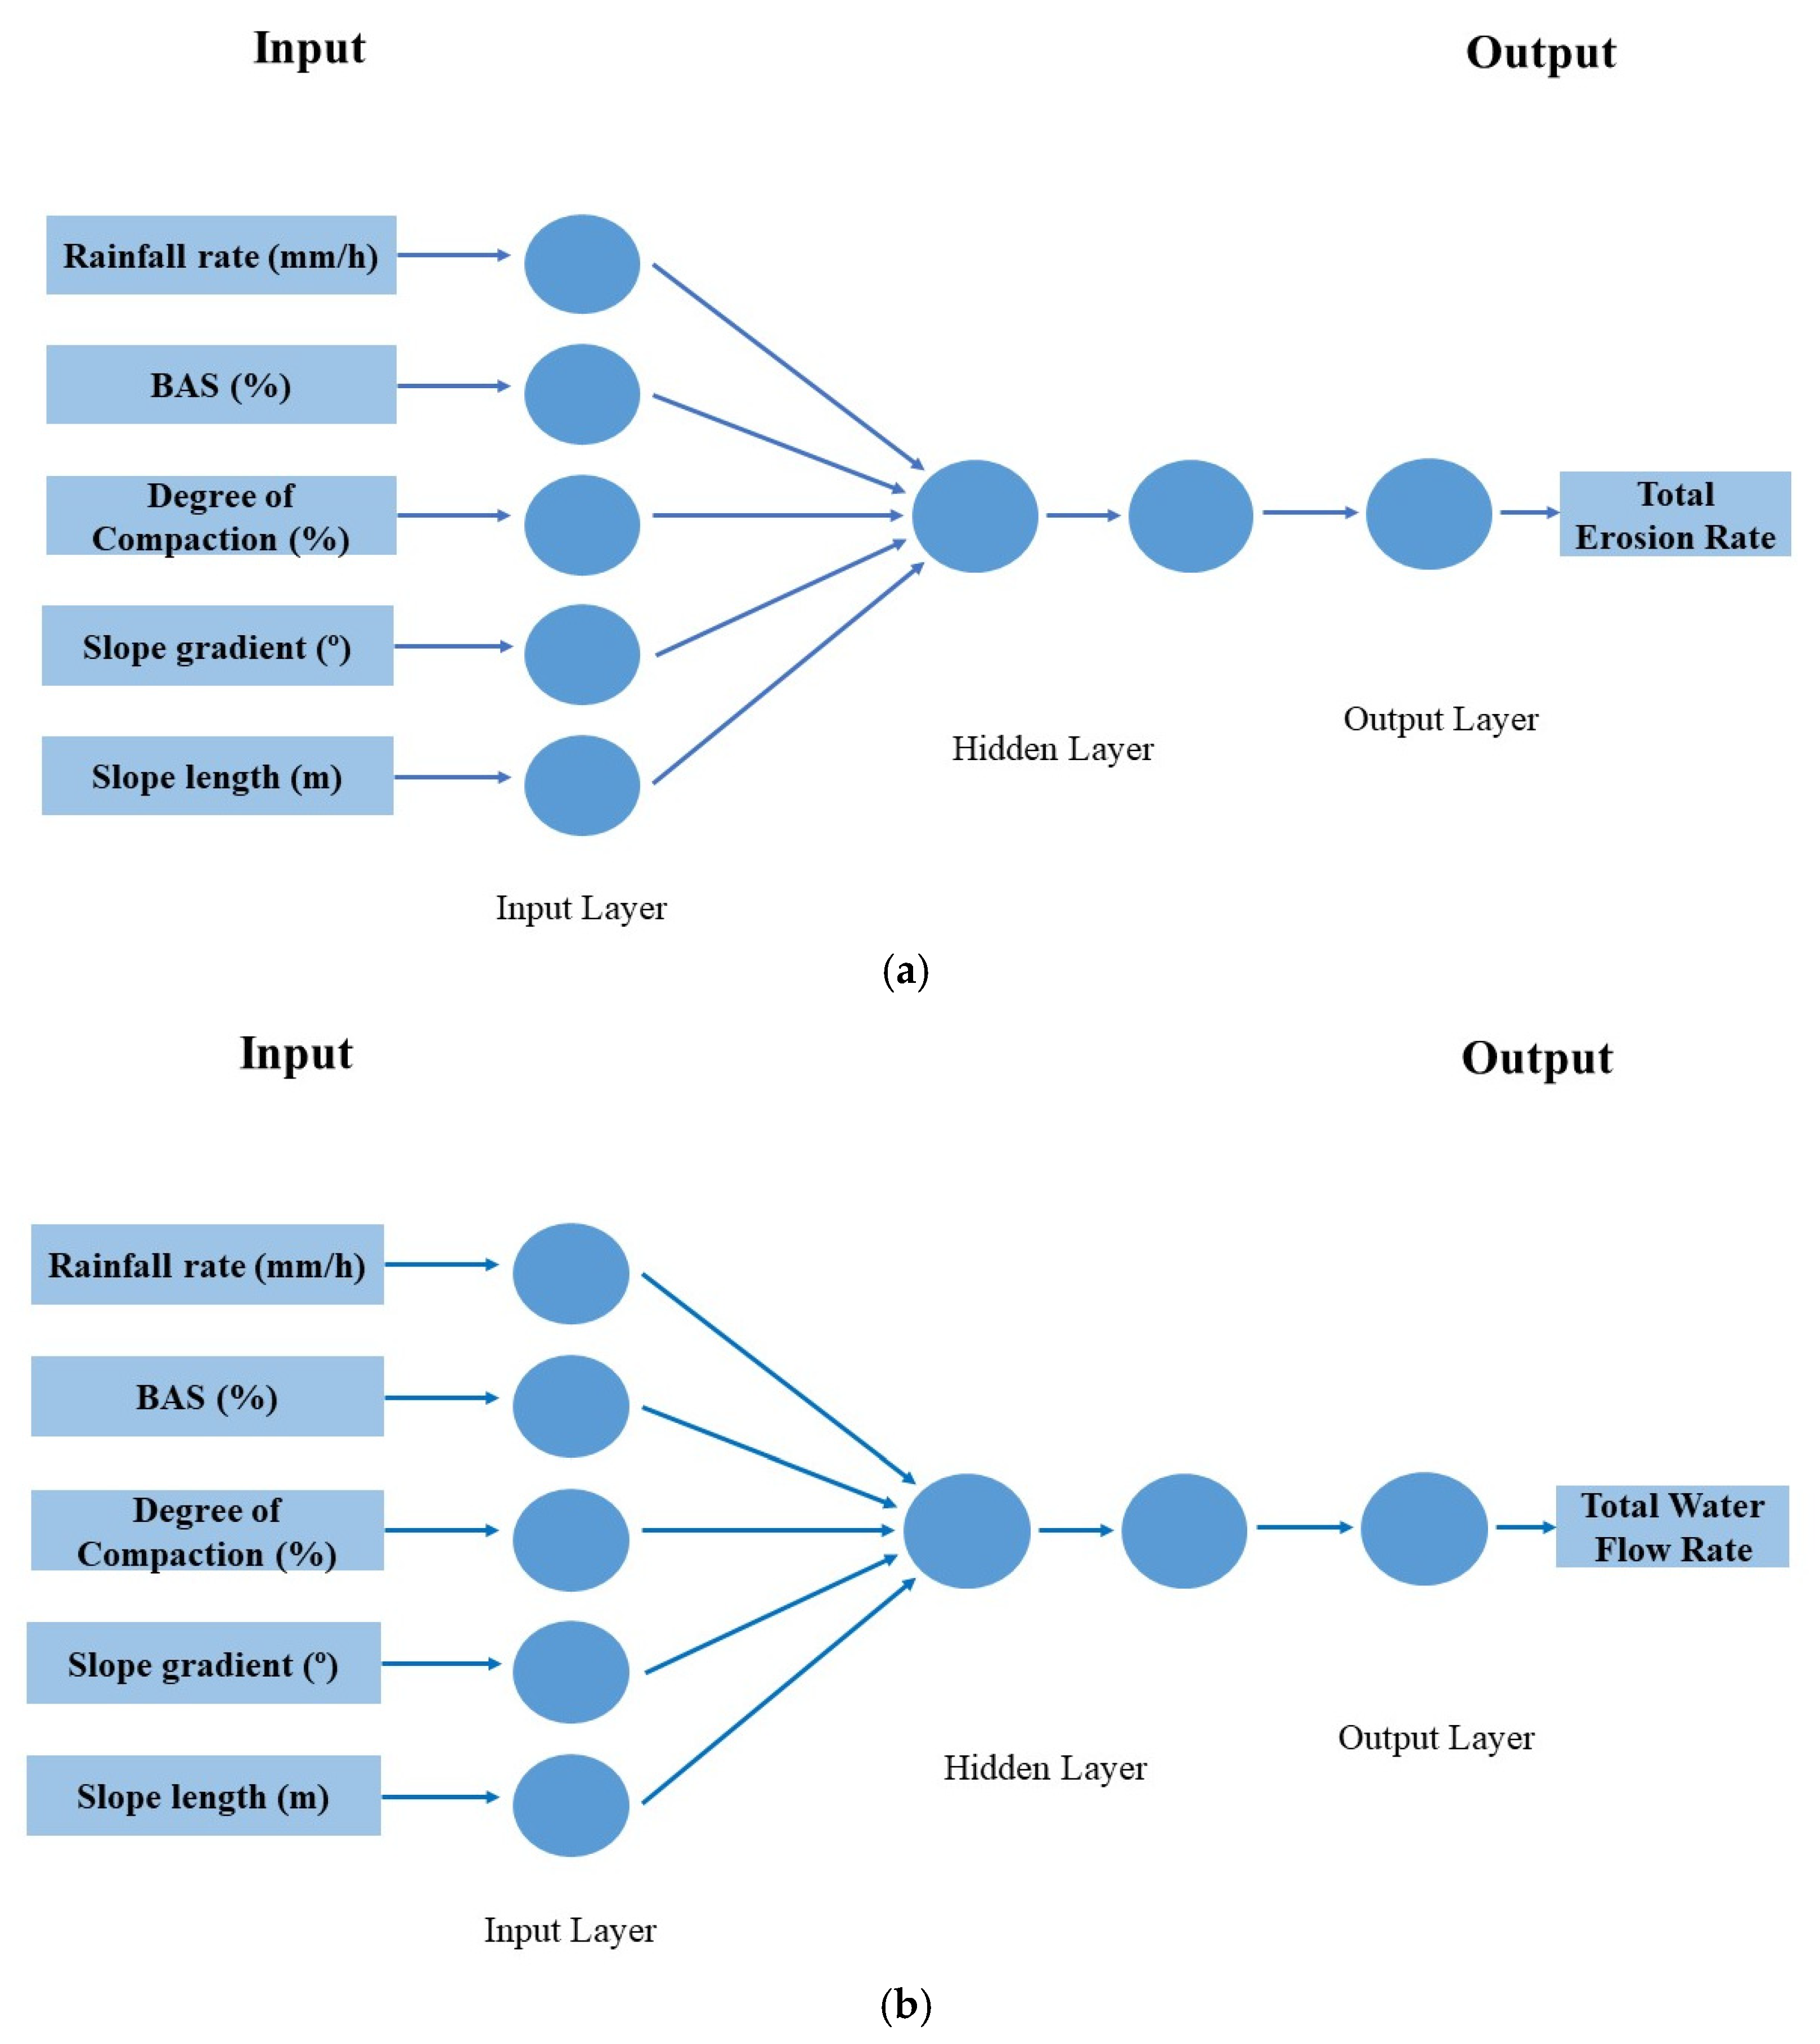
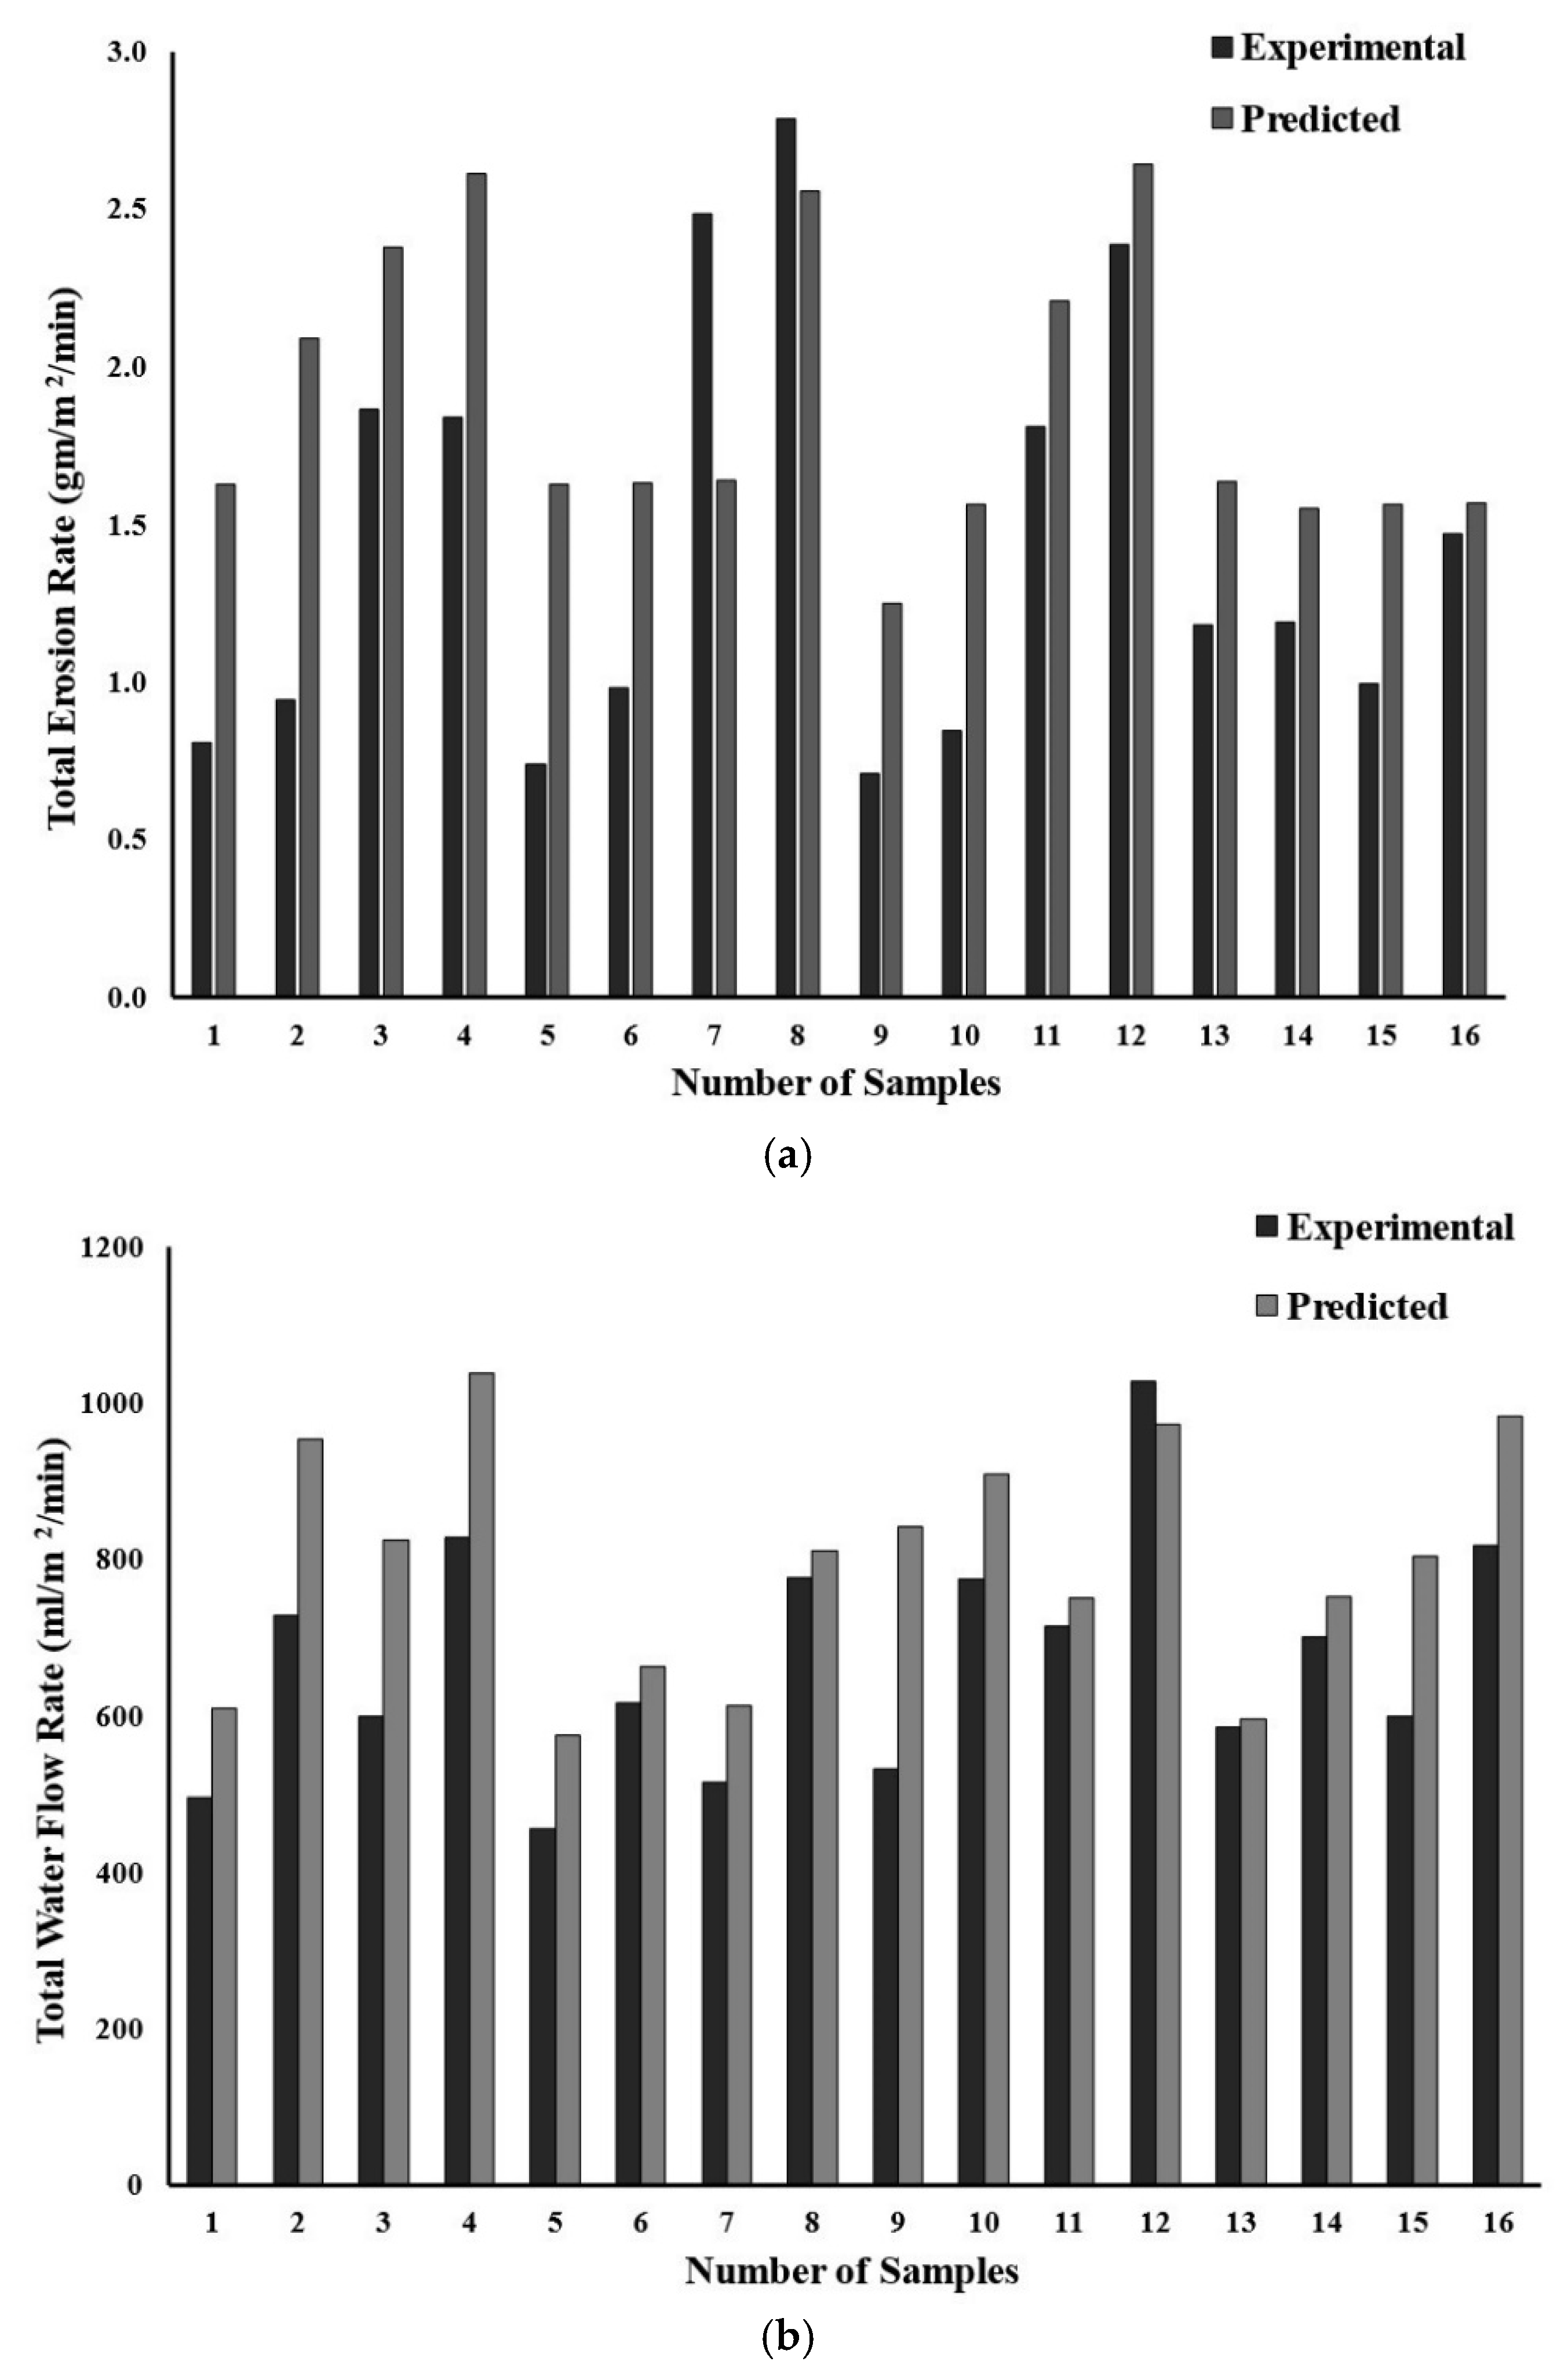
2.3. Artificial Neural Network (ANN)

In the present study, the commercially available STATISTICA version 12 [61] was used. During the development stage of the model, gradient descent was adopted. To develop the model rainfall rate, BAS, DoC, slope gradient, and slope length were taken as input parameters to predict total erosion rate and total water flow rate using two hidden layers. The ANN model architecture used to predict the total erosion rate, and total water flow rate is shown in Figure 2a,b. The ANN algorithm ranks the influence of each input parameter on the output. Figure 3 shows a flowchart, which indicates the methodology implemented to model the network [47,48].
ANN model development needs a clear definition and performance criterion [62,63]. The performance determination is checked by the Coefficient of Determination (R2) and the mean absolute percentage error. The error is calculated from the predicted and experimental values by determining MAPD by the equation:
M A P D = 100 n   i = 1 n ( M i P i ) M i
where Mi is Measured Value, Pi is Predicted Values, and n is the number of data points.
Graphs were plotted using ANN prediction in STATISTICA; a relationship was developed between the output and input parameters. The degree by which each parameter varies, corresponding to the input parameter’s value difference, is the direct measure of each variable’s importance. Each time one input parameter effect was taken on the output parameter by keeping the rest of the parameters constant while plotting the graph.
Figure 4a,b shows the comparison between the predicted and measured values for total erosion rate and total water flow rates, respectively. The R2 value is found to be 0.788 and 0.939 for total erosion rate and total water flow rate, respectively. The error was calculated between the experimental and predicted values. The average error (MAPD) is around 15% and 7% for total erosion rate and water flow rate, respectively. Based on these errors, the ANN model’s accuracy for erosion and flow rate is found as 85% and 93%, respectively. For quantitative comparison, a bar chart has been plotted between the experimental and predicted values of the erosion rate and total water flow rate, respectively, as shown in Figure 5a,b.

3. Results and Discussions

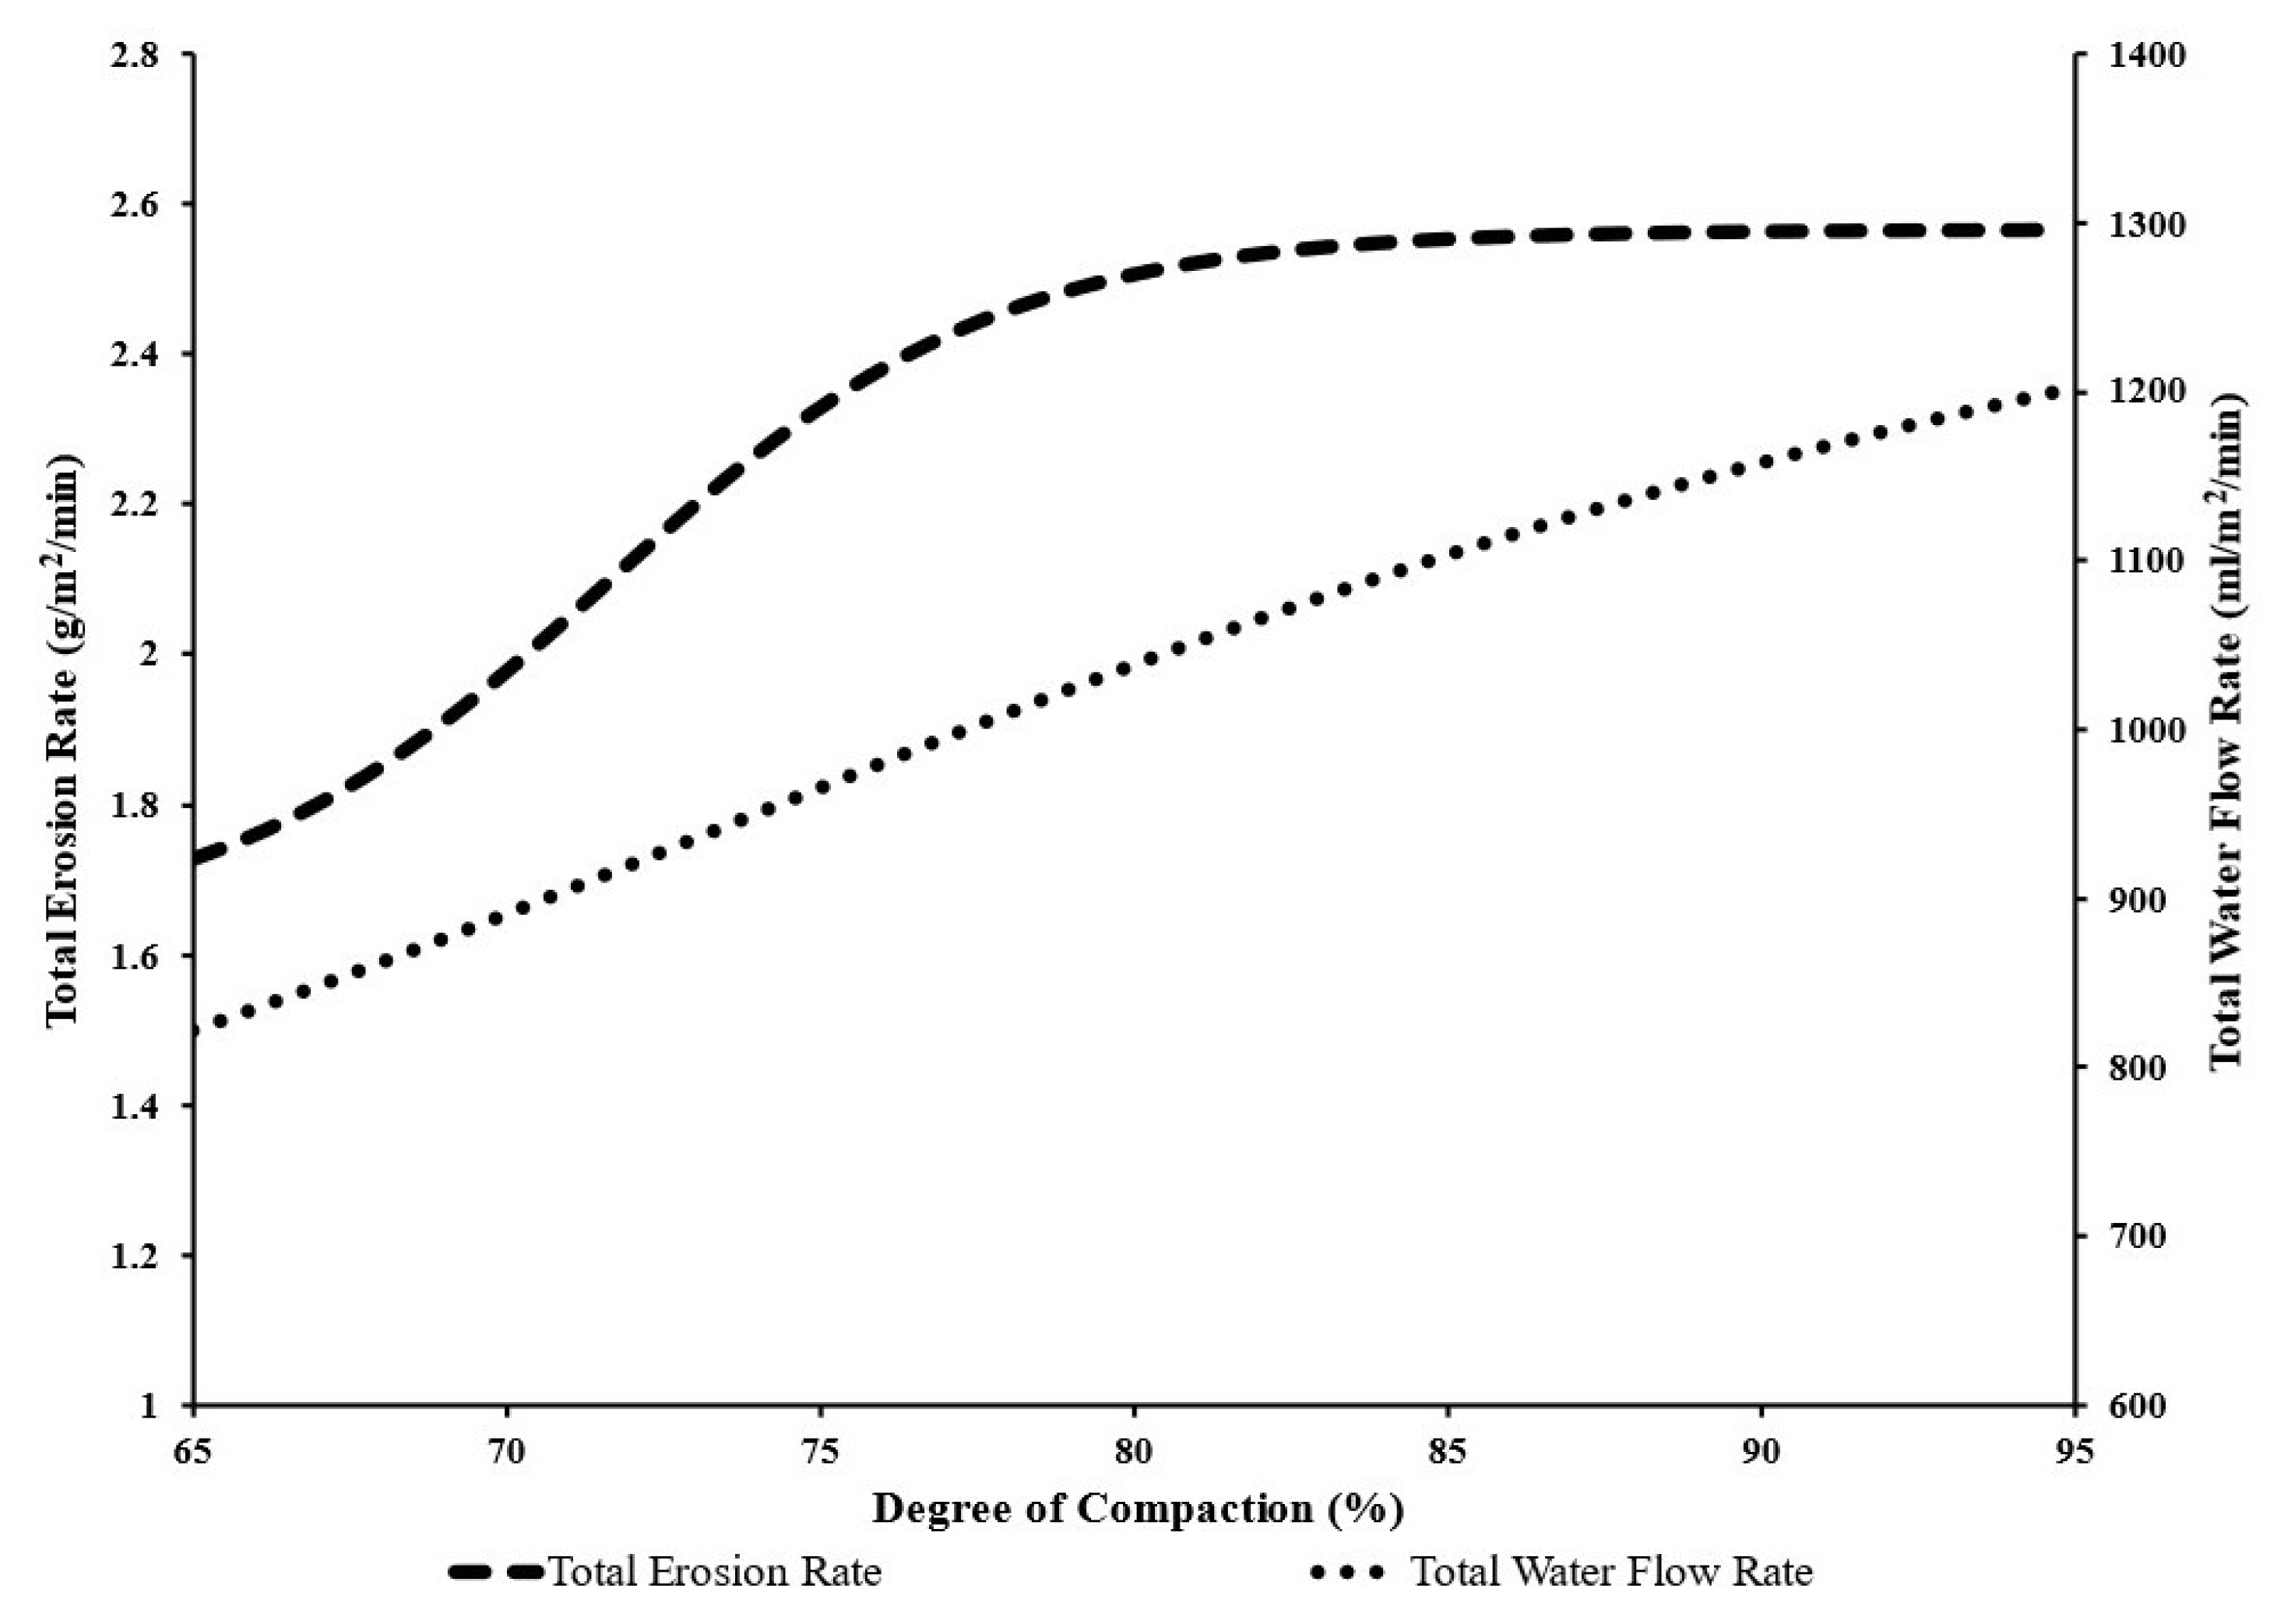
3.1. Influence of Degree of Compaction on Total Erosion Rate and Total Water Flow Rate

Figure 6 shows that the total erosion rate and total water flow rate increase with the compaction of soil (i.e., DoC). The graph for DoC with total erosion rate and the total water flow rate was plotted using ANN prediction in STATISTICA. DoC is an input parameter whose effect was observed on the output parameter by keeping the rest of the parameters (biochar content, slope length, slope gradient, and rainfall rate) constant while plotting the graph.
It is observed that with an increase in compaction, the total erosion rate increases from 1.75 g/m2/min to 2.55 g/m2/min. Similarly, the total water flow rate increases by almost 48.75% (i.e., 810 mL/m2/min to 1200 mL/m2/min). However, the increase in flow rate is almost linear. In contrast, for erosion rate, the enhancement is more substantial during an increase in compaction from 65% to 80%. It is expected that an increase in compaction should reduce soil erosion; however, under prolonged rainfall, there is likely an enhancement in water-logging due to lower permeability. This may cause erosion of fine soil and biochar particles present in the upper layers of compacted soil. Similar results have been observed in the previous studies for bare soil [1,11,12]. Correlation can also be made because the soil structure and its hydrology are changed when the bulk density of soil is enhanced, leading to a decrease in the porosity of soil and subsurface seepage flux capacity. This eventually leads to an increase in runoff [64]. As compared to the bare soil, BAS has a higher porosity, void ratio, and WHC. The same applies when soil is compacted, even though in both cases (bare soil and BAS), the void ratio is reduced.
Irrespective of the DoC, the runoff in BAS is lower, while the subsurface seepage flux is higher than bare soil. This is opposite to the observation of Gopal et al. (2019) [42], where a decrease in infiltration was observed in biochar amended soil as compared to bare soil. The difference might be due to the applied boundary condition [42]. In the study of Gopal et al. (2019) [42], a suction head was applied using a mini-disk infiltrometer, while in the current study, rainfall was simulated on the upper surface of the soil. Studies are needed in future to characterize the influence of boundary conditions on the effectiveness of biochar in controlling soil erosion. Higher runoff tends to cause more erosion in bare soil. For an implication in landfill liner and slopes, there is a need to identify optimal compaction rate considering the effect of erosion under natural rainfall. Further, variation in soil water retention and strength characteristics also need to be considered while considering the DoC of a landfill liner [65].
The runoff in bare soil was found to be lowest in soil amended with 5% biochar as compared to bare soil and 10% BAS. The model predictability seems reasonable as the results are similar to the experimental data and the available literature [1,7,11,12].

3.2. Influence of Rainfall Rate on Total Erosion Rate and Total Water Flow Rate

Figure 7 shows that the total erosion rate and total water flow rate are enhanced with an increase in rainfall intensity. ANN prediction was used for plotting the graph for rainfall rate with the total erosion rate and total water flow rate. Rainfall rate was an input parameter. Its effect was observed on the output parameter (total erosion rate and total flow rate) by keeping the rest of the parameters (biochar content, slope length, slope gradient, DoC and biochar percentage) constant while plotting the graph. The erosion rate increases from 1.78 g/m2/min to 2.4 g/m2/min with an increase in rainfall intensity by 50%. The corresponding increase in total water flow is around 59% (i.e., 820 mL/m2/min to 1290 mL/m2/min). Studies [1,8,9] have demonstrated that rainfall is important for determining soil erosion. Lower intensity rainfall will produce more subsurface seepage flux and, therefore, less runoff and erosion. It should be noted that the above graph is based on two measured rainfall data points (60 mm/hour and 90 mm/hour), and any interpretation of variation in total erosion rate and total flow rate between them is subjected to it. Nevertheless, the result related to the increase in total erosion rate is consistent with that of laboratory studies on bare soil by Fu et al. (2019) [66].

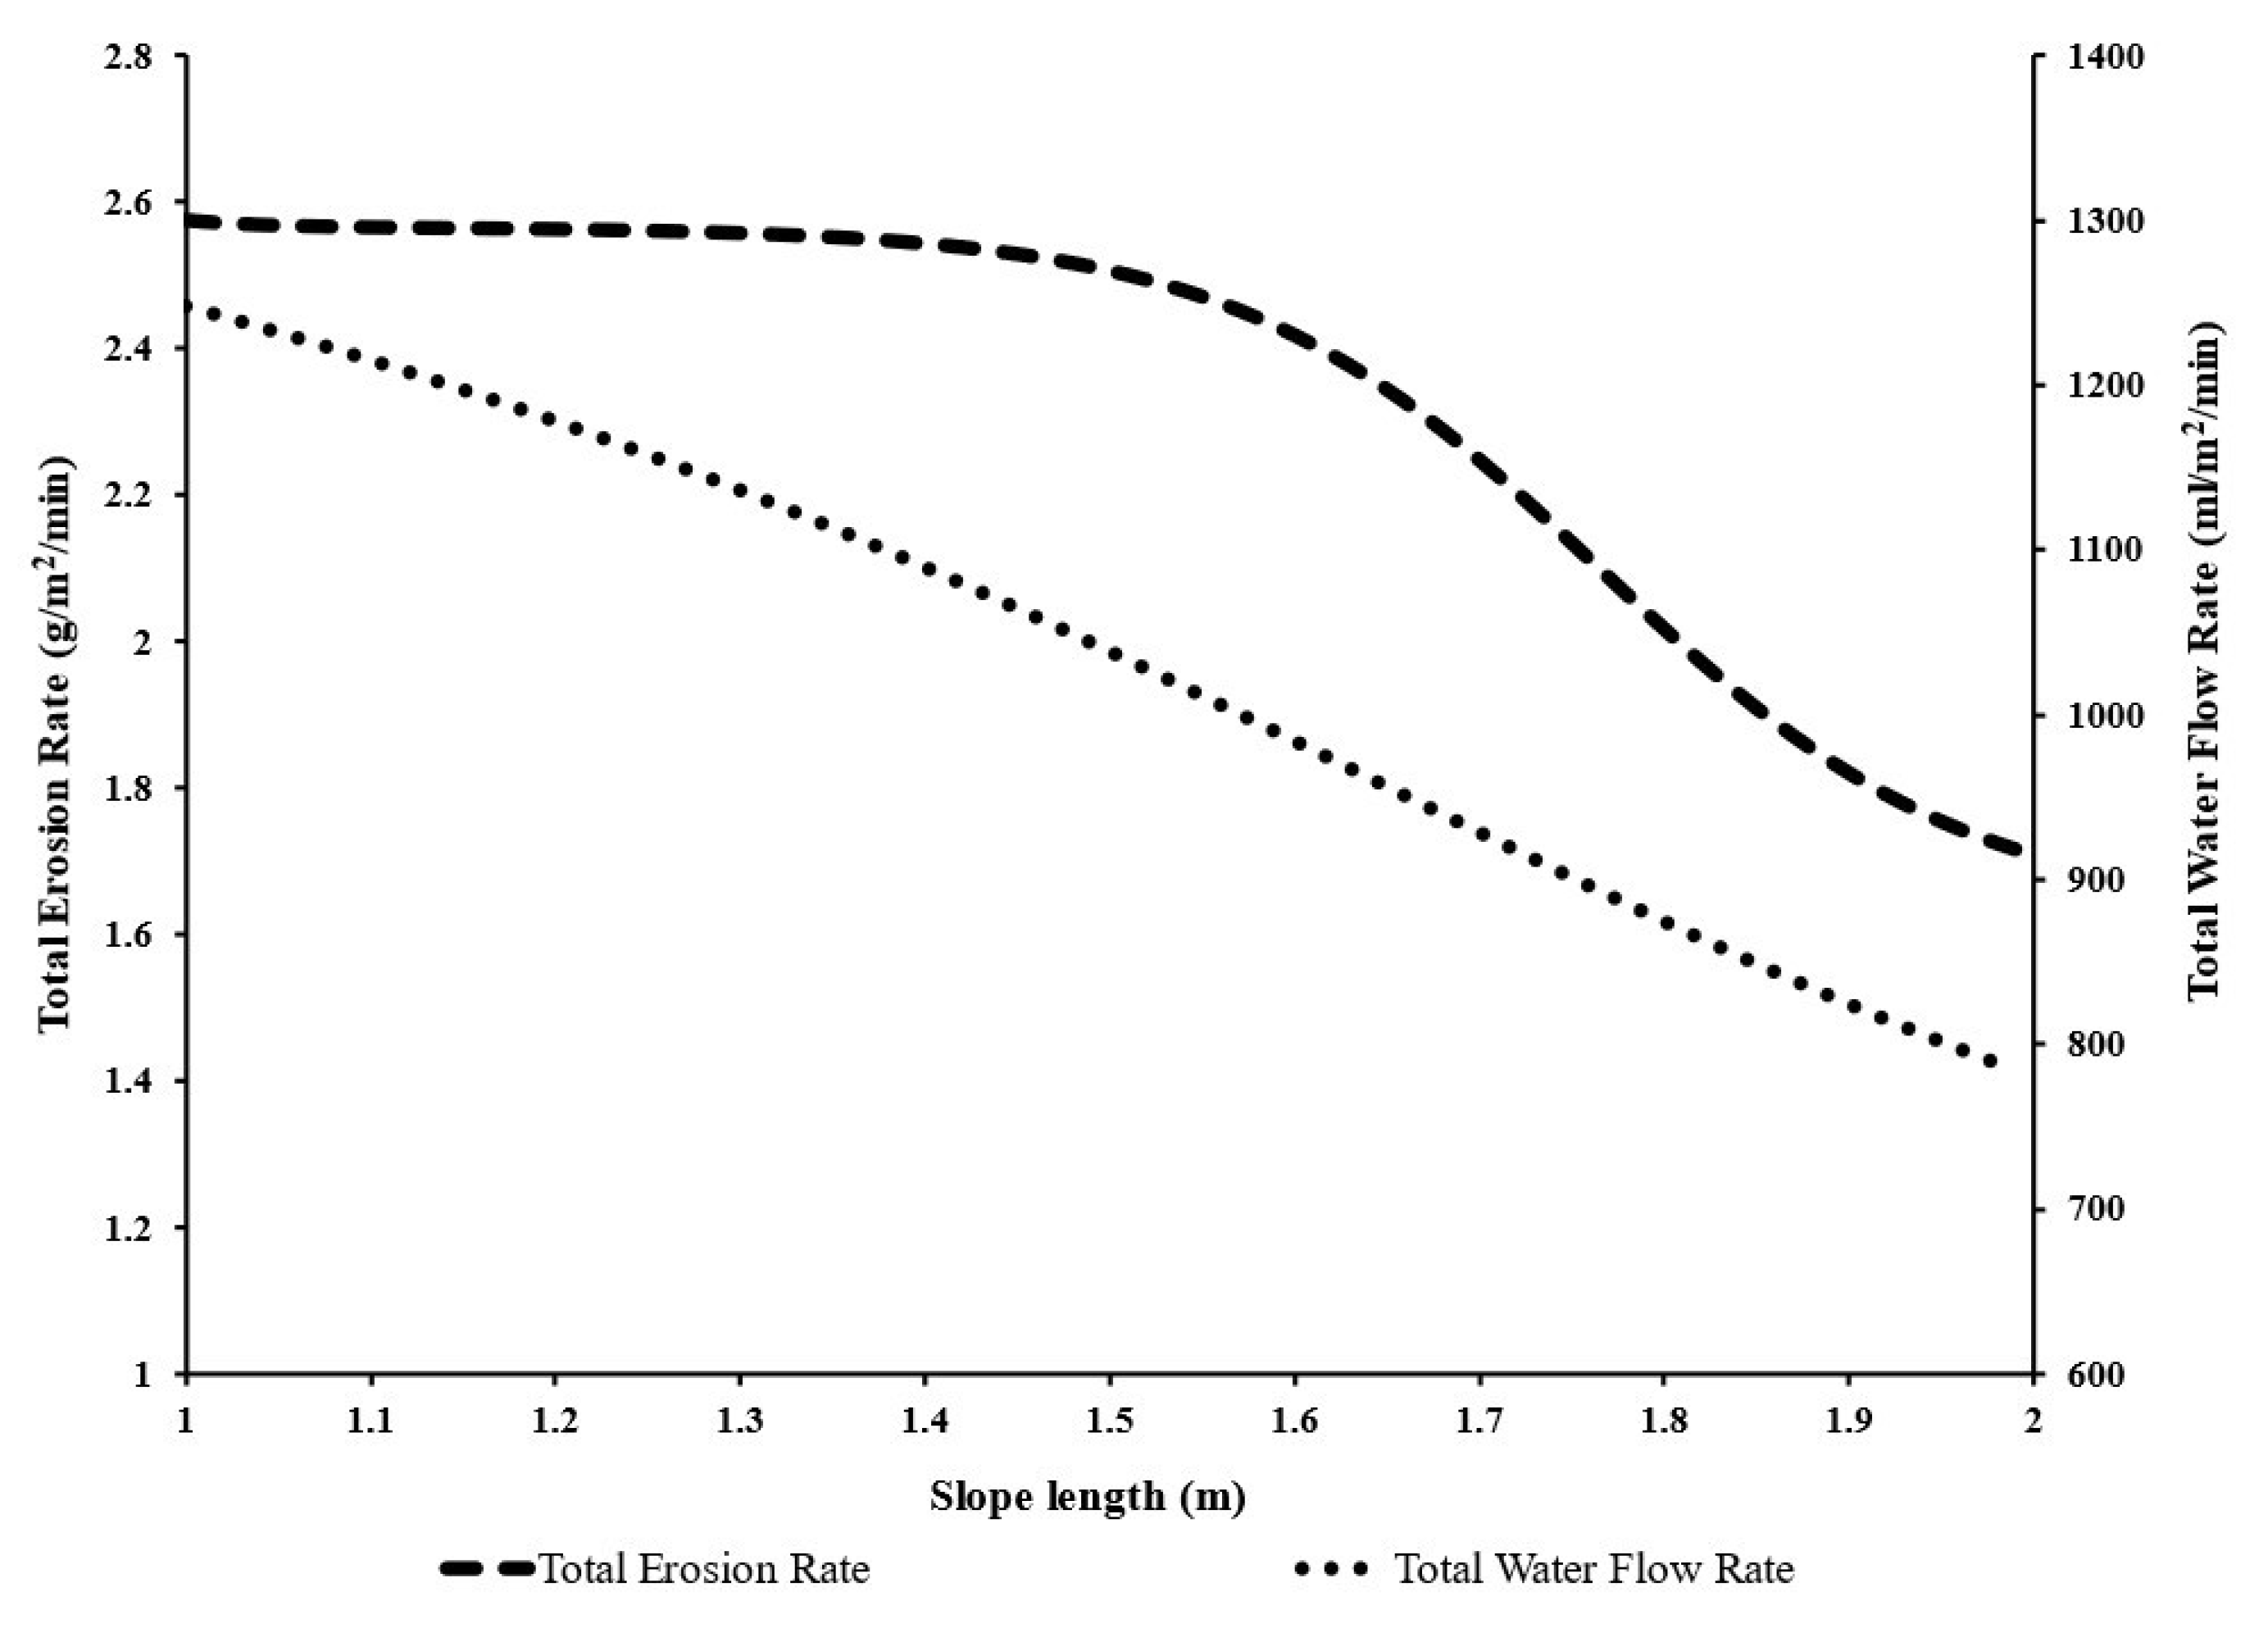
3.3. Influence of Slope Length on Total Erosion Rate and Total Water Flow Rate

Figure 8 shows the variation of total erosion rate and water flow with the slope length. The graph was plotted using ANN prediction for slope length with total erosion rate and total water flow. The input parameter was the slope length. The observations were taken for the output parameter (total erosion rate and total flow rate) by keeping the other parameters (biochar content, rainfall rate, slope gradient, DoC, and biochar percentage) constant while plotting the graph. It was observed that there is a decrease in both the parameters with the slope length. This is expected since eroded particles are likely to travel shorter distances or are transported to local depressions [67]. In addition, the presence of biochar may add to discontinuity and surface roughness, which can resist further movement of particles. Fu et al. (2019) [66] also observed a lower correlation of runoff with the slope surface area as compared to the rainfall intensity. The mechanism is relatively more complex, as the slope length (or surface area) is enhanced as compared to the rainfall intensity, which is directly associated with the runoff.
It can also be observed that the reduction in erosion is relatively minimal during an increase in slope length till 1.55 m, whereas it reduces sharply beyond that. It implies that at this threshold slope length (1.55 m), under a given rainfall intensity, eroded particles are no longer able to settle down or be translocated to other parts of the slope. At a slope length of 2 m, erosion is found to be reduced by 33% (i.e., 2.6 to 1.75), whereas the total flow rate decreases linearly from 1250 mL/m2/min to 790 mL/m2/min. The above findings suggest that for given rainfall intensity, the influence of slope length on erosion is critical. However, it should be noted that the study does not consider extreme rainfall (up to 115 mm/hour [68]. To better understand the mechanism of influence of slope length, a longer flume in a range of 10 m [66] needs to be built and investigated under natural rainfall in the field.

3.4. Influence of Slope Gradient on Total Erosion Rate and Total Water Flow Rate

Figure 9 shows the variation of the total erosion rate and water flow rate with the slope gradient. The graph was plotted using ANN prediction for slope gradient with total erosion rate and total water flow rate. Slope gradient was taken as an input parameter. The effect slope length had on the output parameter (total erosion rate and total flow rate) was observed by keeping the rest of the parameters (biochar content, rainfall rate, slope length, DoC, and biochar percentage) constant when the graph was plotted. It can be observed from the figure that the erosion rate increases gradually from 2.1 g/m2/min to 2.55 g/m2/min with an increase in the slope gradient from 7° to 20°. The increase is more significant from 7° to 12° and thereafter is more gradual.
On the other hand, the total water flow rate tends to increase more substantially (i.e., by 110%) from 660 mL/m2/min to 1370 mL/m2/min. This is interesting as with an increase in gradient, the effect is more visible on flow than on erosion rate. From a mechanism point of view, it can be visualized that the erodibility of soil-biochar particles mix is not significantly affected. Instead, the water flow rate (i.e., in particular, runoff) is enhanced mainly due to the gravity effect. This implies that more attention needs to be paid to water flow management for steeper slopes than the erosion itself. The result is consistent with that of observed literature [7,58,69,70,71], thus implying the model’s reliability.

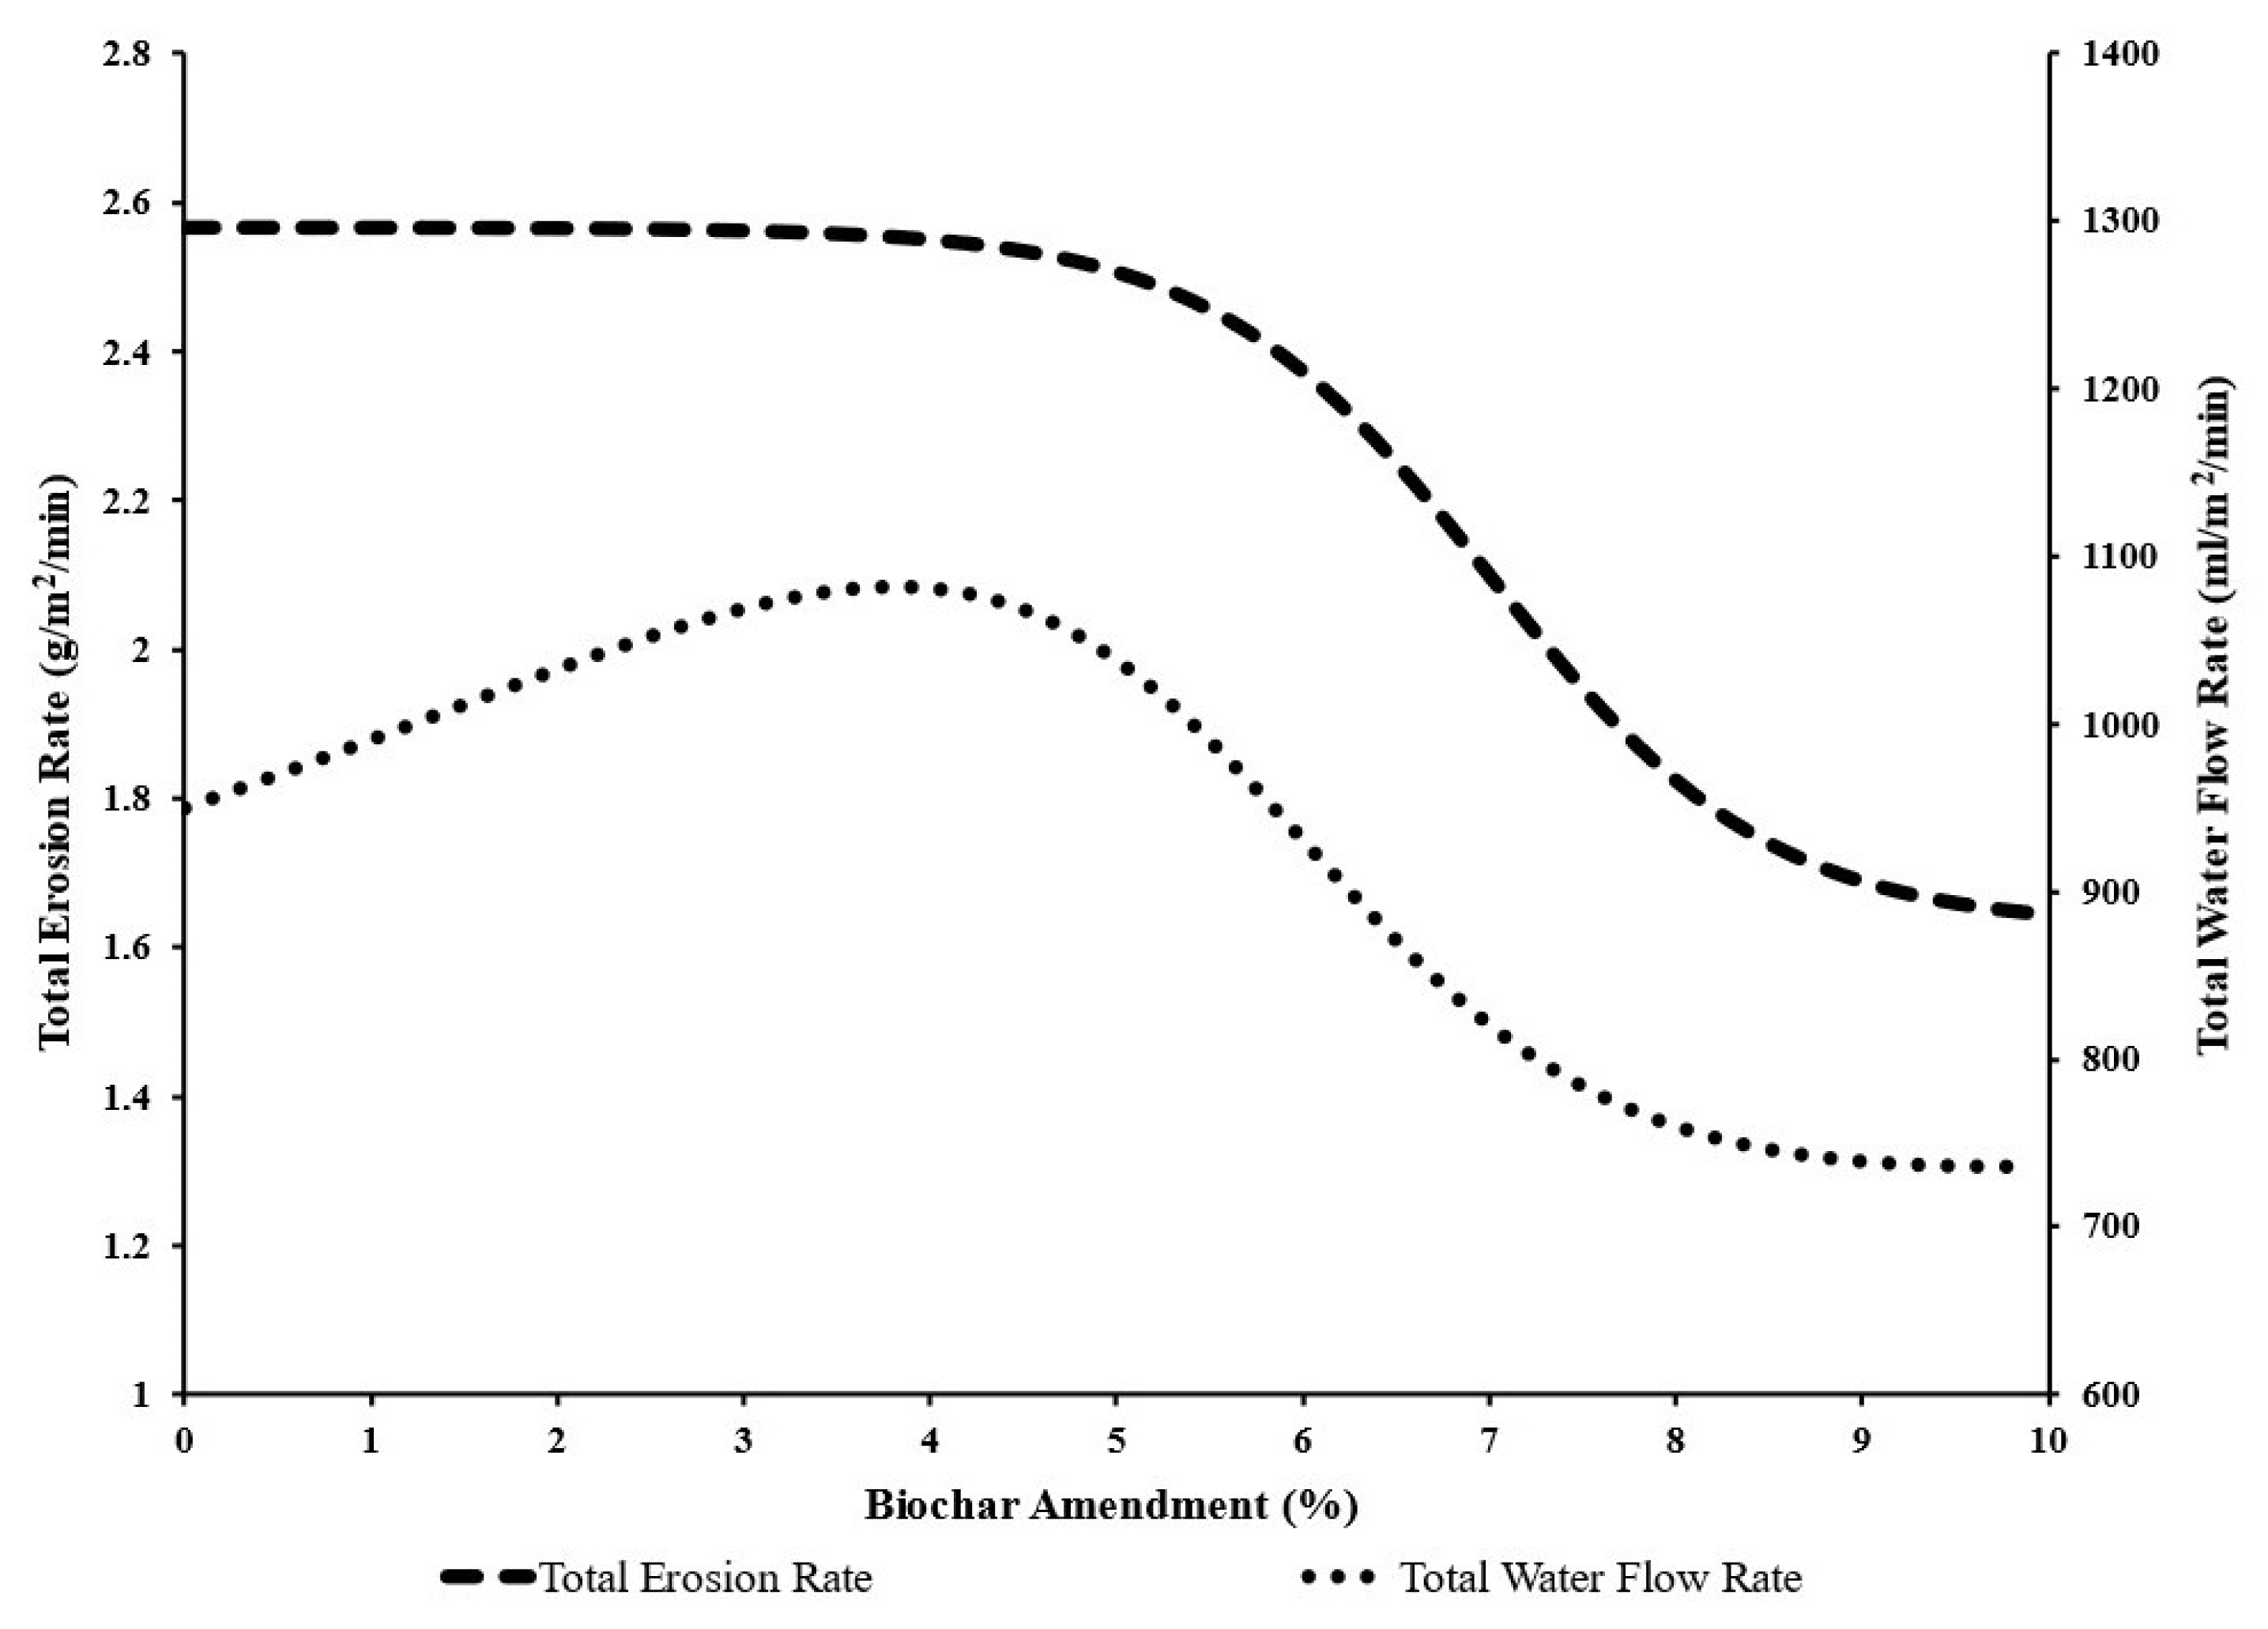
3.5. Influence of BAS on Total Erosion Rate and Total Water Flow Rate

Figure 10 shows the variation of total erosion rate and water flow rate with the biochar amendment ratio. The graph was plotted using ANN prediction for biochar amendment with total erosion rate and total water flow rate by taking biochar amendment percentage as an input parameter. Its effect was observed on the output parameter (total erosion rate and total flow rate) by keeping the rest of the parameters (slope length, rainfall rate, slope gradient, and DoC) constant when the graph was plotted. It can be observed that the erosion rate reduces from 2.57 g/m2/min to 1.63 g/m2/min (i.e., by 36.5%) with an increase in amendment ratio from 0 to 10%. The reduction in erosion rate is minimal between biochar amendment ratio of 0 to 5%. This implies that the effect of biochar on erosion is not significant during the initial addition of 5% of biochar. This is inconsistent with the findings of Bordoloi et al. (2019) [52] and Huang et al. (2021) [72], who found a substantial influence of biochar on water retention capacity at an amendment ratio of 5%. The findings also suggest that biochar content of 5% may not be the optimal content for reduction of erosion rate.
On the contrary, the total water flow rate does not clearly trend with the biochar amendment ratio. The total water flow rate is found first to be enhanced (950 mL/m2/min to 1085 mL/m2/min) with an increase in biochar content from 0% to 5%, and then decreases (to 720 mL/m2/min at 10% biochar content) beyond it. This suggests that the erosion rate is not directly proportional to the total water flow rate. Interestingly, despite the highest water flow at 5% biochar content, the erosion rate appears to remain unchanged (with reference to bare soil). This phenomenon might be due to the optimum pore filling effect of biochar, which maximizes the water holding capacity [52] and tends to keep soil and biochar particles intact. With an increase in biochar to 10%, the subsurface flow is enhanced, reducing runoff rate and, hence, the total water flow rate and erosion. The effect of biochar on erosion rate seems to be more dominant at 10% content. However, such a percentage may induce higher alkalinity. It is observed from the literature that a biochar content of 5% is most suitable [2]. Higher alkalinity may reduce the vegetation growth [73], causing an increase in runoff, reducing subsurface seepage flux, and leading to more erosion. Additionally, the tensile strength of the soil is reduced by the addition of biochar [74], which in other words means that the soil cannot be compacted to its maximum density, making the soil less suitable for engineering purposes. Further studies are needed to identify the optimal content of biochar for maximizing its overall benefits, including reducing erosion.

3.6. Relative Importance of Factors Influencing Erosion

Figure 11a shows the relative importance of various input parameters, slope length, slope gradient, DoC, BAS, and rainfall rate. Slope length was found to be the most important parameter in determining erosion rate, followed by slope gradient, DoC, the percentage of biochar amendments, and rainfall rate. The previous study shows that the effect of slope length on runoff and erosion is not adequately understood [75]. The slope gradient is the second most closely related factor to erosion rate. During water movement on the surface, the slope gradient will affect the subsurface water flow velocity, enhancing the impact force on the surface of the soil-biochar mix. Soils that are heavily compacted have a small number of large pores, leading to reduced subsurface seepage flux and drainage rates. The percentage of biochar amendment and rainfall rate seems to have a lower significant effect on erosion rate.
Figure 11b shows the relative importance of the input parameters on the total water flow rate. The biochar amendment percentage seemed to play an important role in determining total water flow rate, followed by slope gradient, rainfall rate, slope length, and DoC. Biochar has high porosity and a large specific surface area. Biochar addition to soil can alter the soil’s physical properties (soil structure, pore size distribution, and bulk density) and hydraulic properties (soil water retention capacity and hydraulic conductivity). Studies show that biochar addition increases water subsurface seepage flux, reduces surface runoff, and decreases soil erosion [76]. The following influential parameter is slope length, which directly influences seepage velocity. As expected, rainfall rate (3rd significant parameter) also influences total runoff and water flow rate, as observed in other studies [66]. Unlike in the case of erosion rate, slope length and DoC are observed to be the least influential in affecting water flow rate. The relative importance of parameters suggests that the criteria for choosing appropriate biochar amendment ratio and other slope geometry (i.e., for man-made slope) depends on rainfall characteristics, which need to be considered carefully.
The results on relative significance of parameters are different from that of Cai et al. [7]. In the study conducted by [7] the relative significance for the runoff was slope gradient > slope length > biochar content > rainfall rate > compaction. For total flow, the relative significance of parameters was biochar content > rainfall rate > slope gradient > slope length > compaction. This is because Cai et al. [7] determined the relative influence of different parameters by using 5% and 10% biochar separately. However, in the current study, the whole data was taken into account to determine the relative influence of parameters. The model developed using ANN is more flexible in application and has better accuracy. Further studies are needed to study the relative significance of parameters by enhancing the scale of slope and also by including other conditions.

4. Conclusions

The ANN model developed for erosion is consistent with the experimental and literature data. The R2 value from the newly developed ANN models was 0.788 and 0.939 for erosion rate and total water flow rate, respectively. The error percentage for erosion and total water flow rates was 15% and 7%, respectively. Such models can assist in the preliminary design of green cover by choosing the required optimal biochar content under various slope and rainfall conditions. Biochar content of 5% seems to have a negligible effect on erosion rate, while the 10% amendment ratio has the lowest erosion rate and total water flow rate. This is different from water retention studies of the soil-biochar mix, where a 5% amendment ratio has a considerable impact on water-holding ability.
The most significant parameter for total erosion rate is the slope condition (length and gradient), followed by compaction, percentage of biochar amendment and rainfall rate. The slope gradient and length are the other two factors that play a decisive role in erosion control. Longer slopes provide enough surface area for subsurface seepage flux and localized transportation of sediments, due to which runoff reduces, ultimately reducing erosion in both cases. ANN modelling indicates a threshold slope length of 1.55 m, beyond which a sharp reduction in erosion rate is observed.
Under a higher slope gradient, runoff due to gravity increases, and subsurface seepage flux decreases, resulting in more erosion in both cases, even though comparatively less in BAS. Similarly, if the intensity or duration of rainfall is more, runoff and erosion increase, and it is observed that biochar amendment is more influential in affecting water flow rate. Slope length is the least influential in affecting water flow rate. It is observed that biochar content, slope gradient, and rainfall intensities govern the water flow rate.
The study provides the relative importance of various factors that are concerned with determining erosion in the soil-biochar mix. In the current study, taking all the data into account, slope length was the most significant parameter, followed by slope gradient, DoC, biochar content, and rainfall rate for total erosion rate. For total water flow rate, biochar content was the most significant parameter, followed by slope gradient, rainfall rate, slope length, and compaction. In future, studies need to be carried out to understand the combined effect of vegetation and biochar with different slope and soil conditions. The application of biochar in geotechnical engineering is still being investigated. Many agencies such as International Biochar Initiative (IBI) and European Biochar Certificate (EBC) are currently investigating the determination of biochar characteristics, which should be used in various aspects of soil conservation. Recently, financial supports have been provided to develop commercial biochar production capacity to maximize its usage for soil remediation and other construction purposes. This is done to achieve the overall aim of reducing the carbon emission goal of 2030 and also to develop a circular economy. Our current study is one of the first steps in promoting biochar use for soil remediation and construction of geotechnical infrastructure.

Author Contributions

Writing—original draft, A.G. and I.W.; writing—review & editing, A.G. and V.K.; analysis, I.W. and V.K.; figures, I.W. All authors have read and agreed to the published version of the manuscript.

Funding

First author would like to acknowledge the support from National Natural Science Foundation (NSFC) of China for project grant (grant no. 41907252). Authors are also grateful to Ministry of Education, India for support to second author.

Institutional Review Board Statement

Not Applicable.

Informed Consent Statement

Not Applicable.

Data Availability Statement

The study did not report any data.

Conflicts of Interest

The authors declare no conflict of interest.

Abbreviations

ANNArtificial Neural Network
BASBiochar Amended Soils
CIFCrack Intensity Factor
DoCDegree of Compaction
EBCEuropean Biochar Certificate
FTIRFourier Transform Infrared
IBIInternational Biochar Initiative
KNNk-nearest neighbor
MAPDMean Absolute Percentage Deviation
SBCSoil Biochar Composite
USEPAUnited States Environmental Protection Agency
WHCWater Holding Capacity
pHPotential of Hydrogen
R2Coefficient of Determination
CCarbon
HHydrogen
OOxygen

References

  1. Holz, D.J.; Williard, K.W.J.; Edwards, P.J.; Schoonover, J.E. Soil Erosion in Humid Regions: A Review. J. Contemp. Water Res. Educ. 2015, 154, 48–59. [Google Scholar] [CrossRef]
  2. Jien, S.-H.; Wang, C.-S. Effects of Biochar on Soil Properties and Erosion Potential in a Highly Weathered Soil. CATENA 2013, 110, 225–233. [Google Scholar] [CrossRef] [Green Version]
  3. Li, Z.; Gu, C.; Zhang, R.; Ibrahim, M.; Zhang, G.; Wang, L.; Zhang, R.; Chen, F.; Liu, Y. The Benefic Effect Induced by Biochar on Soil Erosion and Nutrient Loss of Slopping Land under Natural Rainfall Conditions in Central China. Agric. Water Manag. 2017, 185, 145–150. [Google Scholar] [CrossRef]
  4. Materechera, S.A. Aggregation in a Surface Layer of a Hardsetting and Crusting Soil as Influenced by the Application of Amendments and Grass Mulch in a South African Semi-Arid Environment. Soil Tillage Res. 2009, 105, 251–259. [Google Scholar] [CrossRef]
  5. Wuddivira, M.N.; Stone, R.J.; Ekwue, E.I. Structural Stability of Humid Tropical Soils as Influenced by Manure Incorporation and Incubation Duration. Soil Sci. Soc. Am. J. 2009, 73, 1353–1360. [Google Scholar] [CrossRef]
  6. Garg, A.; Reddy, N.G.; Huang, H.; Buragohain, P.; Kushvaha, V. Modelling Contaminant Transport in Fly Ash–Bentonite Composite Landfill Liner: Mechanism of Different Types of Ions. Sci. Rep. 2020, 10, 11330. [Google Scholar] [CrossRef] [PubMed]
  7. Cai, W.; Huang, H.; Chen, P.; Huang, X.; Gaurav, S.; Pan, Z.; Lin, P. Effects of Biochar from Invasive Weed on Soil Erosion under Varying Compaction and Slope Conditions: Comprehensive Study Using Flume Experiments. Biomass Conv. Bioref. 2020. [Google Scholar] [CrossRef]
  8. Smith, D.D.; Wischmeier, W.H. Rainfall Erosion. In Advances in Agronomy; Norman, A.G., Ed.; Academic Press: Cambridge, MA, USA, 1962; Volume 14, pp. 109–148. [Google Scholar]
  9. Fox, D.M.; Bryan, R.B. The Relationship of Soil Loss by Interrill Erosion to Slope Gradient. CATENA 2000, 38, 211–222. [Google Scholar] [CrossRef]
  10. Neal, J.H. The Effect of the Degree of Slope and Rainfall Characteristics on Runoff and Soil Erosion. Soil Sci. Soc. Am. J. 1938, 2, 525–532. [Google Scholar] [CrossRef]
  11. Fullen, M.A. Compaction, Hydrological Processes and Soil Erosion on Loamy Sands in East Shropshire, England. Soil Tillage Res. 1985, 6, 17–29. [Google Scholar] [CrossRef]
  12. Batey, T. Soil Compaction and Soil Management—A Review. Soil Use Manag. 2009, 25, 335–345. [Google Scholar] [CrossRef]
  13. Li, Y.; Zhang, F.; Yang, M.; Zhang, J. Effects of Adding Biochar of Different Particle Sizes on Hydro-Erosional Processes in Small Scale Laboratory Rainfall Experiments on Cultivated Loessial Soil. CATENA 2019, 173, 226–233. [Google Scholar] [CrossRef]
  14. Verheijen, F.G.A.; Jones, R.J.A.; Rickson, R.J.; Smith, C.J. Tolerable versus Actual Soil Erosion Rates in Europe. Earth-Sci. Rev. 2009, 94, 23–38. [Google Scholar] [CrossRef] [Green Version]
  15. Ledermann, T.; Herweg, K.; Liniger, H.P.; Schneider, F.; Hurni, H.; Prasuhn, V. Applying Erosion Damage Mapping to Assess and Quantify Off-Site Effects of Soil Erosion in Switzerland. Land Degrad. Dev. 2010, 21, 353–366. [Google Scholar] [CrossRef]
  16. Yang, X.; Zhang, X.; Lv, D.; Yin, S.; Zhang, M.; Zhu, Q.; Yu, Q.; Liu, B. Remote Sensing Estimation of the Soil Erosion Cover-Management Factor for China’s Loess Plateau. Land Degrad. Dev. 2020, 31, 1942–1955. [Google Scholar] [CrossRef]
  17. Swift, L.W. Gravel and Grass Surfacing Reduces Soil Loss from Mountain Roads. For Sci. 1984, 30, 657–670. [Google Scholar] [CrossRef]
  18. Quinton, J.N.; Edwards, G.M.; Morgan, R.P.C. The Influence of Vegetation Species and Plant Properties on Runoff and Soil Erosion: Results from a Rainfall Simulation Study in South East Spain. Soil Use Manag. 1997, 13, 143–148. [Google Scholar] [CrossRef]
  19. Loch, R.J. Effects of Vegetation Cover on Runoff and Erosion under Simulated Rain and Overland Flow on a Rehabilitated Site on the Meandu Mine, Tarong, Queensland. Soil Res. 2000, 38, 299–312. [Google Scholar] [CrossRef]
  20. Bissonnais, Y.L.; Lecomte, V.; Cerdan, O. Grass Strip Effects on Runoff and Soil Loss. Agronomie 2004, 24, 129–136. [Google Scholar] [CrossRef]
  21. Raya, A.M.; Zuazo, V.H.D.; Martínez, J.R.F. Soil Erosion and Runoff Response to Plant-Cover Strips on Semiarid Slopes (SE Spain). Land Degrad. Dev. 2006, 17, 1–11. [Google Scholar] [CrossRef]
  22. Winteraeken, H.J.; Spaan, W.P. A New Approach to Soil Erosion and Runoff in South Limburg—The Netherlands. Land Degrad. Dev. 2010, 21, 346–352. [Google Scholar] [CrossRef]
  23. Zhuang, Y.; Zhang, L.; Du, Y.; Yang, W.; Wang, L.; Cai, X. Identification of Critical Source Areas for Nonpoint Source Pollution in the Danjiangkou Reservoir Basin, China. Lake Reserv. Manag. 2016, 32, 341–352. [Google Scholar] [CrossRef]
  24. Kuoppamäki, K.; Hagner, M.; Lehvävirta, S.; Setälä, H. Biochar Amendment in the Green Roof Substrate Affects Runoff Quality and Quantity. Ecol. Eng. 2016, 88, 1–9. [Google Scholar] [CrossRef]
  25. Sadeghi, S.H.; Hazbavi, Z.; Harchegani, M.K. Controllability of Runoff and Soil Loss from Small Plots Treated by Vinasse-Produced Biochar. Sci. Total Environ. 2016, 541, 483–490. [Google Scholar] [CrossRef] [PubMed]
  26. Lehmann, J.; Rillig, M.C.; Thies, J.; Masiello, C.A.; Hockaday, W.C.; Crowley, D. Biochar Effects on Soil Biota – A Review. Soil Biol. Biochem. 2011, 43, 1812–1836. [Google Scholar] [CrossRef]
  27. Mohan, D.; Sarswat, A.; Ok, Y.S.; Pittman, C.U. Organic and Inorganic Contaminants Removal from Water with Biochar, a Renewable, Low Cost and Sustainable Adsorbent – A Critical Review. Bioresour. Technol. 2014, 160, 191–202. [Google Scholar] [CrossRef]
  28. Tripathi, M.K.; Sahu, J.N.; Ganesan, P.B. Effect of Process Parameters on Production of Biochar from Biomass Waste through Pyrolysis: A Review. Renew. Sustain. Energy Rev. 2016, 55, 467–481. [Google Scholar] [CrossRef]
  29. Xia, L.; Wang, Y.; Meng, J.; Chen, W.; Zhang, Z. The Influencing Factors of Biochar’s Characteristics and the Development of Carbonization Equipments: A Review. In Proceedings of the Geo-Informatics in Resource Management and Sustainable Ecosystem; Bian, F., Xie, Y., Eds.; Springer: Berlin/Heidelberg, Germany, 2016; pp. 760–769. [Google Scholar]
  30. Garg, A.; Huang, H.; Kushvaha, V.; Madhushri, P.; Kamchoom, V.; Wani, I.; Koshy, N.; Zhu, H.-H. Mechanism of Biochar Soil Pore–Gas–Water Interaction: Gas Properties of Biochar-Amended Sandy Soil at Different Degrees of Compaction Using KNN Modeling. Acta Geophys. 2019, 68, 207–217. [Google Scholar] [CrossRef]
  31. Huang, H.; Cai, W.-L.; Zheng, Q.; Chen, P.-N.; Huang, C.-R.; Zeng, Q.-J.; Kumar, H.; Zhu, H.-H.; Garg, A.; Zheenbek, K.; et al. Gas Permeability in Soil Amended with Biochar at Different Compaction States. IOP Conf. Ser.: Earth Environ. Sci. 2020, 463, 012073. [Google Scholar] [CrossRef]
  32. Wani, I.; Kumar, H.; Rangappa, S.M.; Peng, L.; Siengchin, S.; Kushvaha, V. Multiple Regression Model for Predicting Cracks in Soil Amended with Pig Manure Biochar and Wood Biochar. J. Hazard. Toxic Radioact. Waste 2021, 25, 04020061. [Google Scholar] [CrossRef]
  33. Wani, I.; Sharma, A.; Kushvaha, V.; Madhushri, P.; Peng, L. Effect of PH, Volatile Content, and Pyrolysis Conditions on Surface Area and O/C and H/C Ratios of Biochar: Towards Understanding Performance of Biochar Using Simplified Approach. J. Hazard. Toxic Radioact. Waste 2020, 24, 04020048. [Google Scholar] [CrossRef]
  34. Wani, I.; Ramola, S.; Garg, A.; Kushvaha, V. Critical Review of Biochar Applications in Geoengineering Infrastructure: Moving beyond Agricultural and Environmental Perspectives. Biomass Conv. Bioref. 2021, 1–29. [Google Scholar] [CrossRef]
  35. Wani, I.; Narde, S.R.; Huang, X.; Remya, N.; Kushvaha, V.; Garg, A. Reviewing Role of Biochar in Controlling Soil Erosion and Considering Future Aspect of Production Using Microwave Pyrolysis Process for the Same. Biomass Conv. Bioref. 2021, 1–27. [Google Scholar] [CrossRef]
  36. Kumar, H.; Ganesan, S.P.; Bordoloi, S.; Sreedeep, S.; Lin, P.; Mei, G.; Garg, A.; Sarmah, A.K. Erodibility Assessment of Compacted Biochar Amended Soil for Geo-Environmental Applications. Sci. Total Environ. 2019, 672, 698–707. [Google Scholar] [CrossRef]
  37. Lee, S.S.; Shah, H.S.; Awad, Y.M.; Kumar, S.; Ok, Y.S. Synergy Effects of Biochar and Polyacrylamide on Plants Growth and Soil Erosion Control. Environ. Earth Sci 2015, 74, 2463–2473. [Google Scholar] [CrossRef]
  38. Li, Y.; Zhang, F.; Yang, M.; Zhang, J.; Xie, Y. Impacts of Biochar Application Rates and Particle Sizes on Runoff and Soil Loss in Small Cultivated Loess Plots under Simulated Rainfall. Sci. Total Environ. 2019, 649, 1403–1413. [Google Scholar] [CrossRef] [PubMed]
  39. Abel, S.; Peters, A.; Trinks, S.; Schonsky, H.; Facklam, M.; Wessolek, G. Impact of Biochar and Hydrochar Addition on Water Retention and Water Repellency of Sandy Soil. Geoderma 2013, 202–203, 183–191. [Google Scholar] [CrossRef]
  40. Ouyang, L.; Wang, F.; Tang, J.; Yu, L.; Zhang, R. Effects of Biochar Amendment on Soil Aggregates and Hydraulic Properties. J. Soil Sci. Plant Nutr. 2013, 13, 991–1002. [Google Scholar] [CrossRef] [Green Version]
  41. Bordoloi, S.; Garg, A.; Sreedeep, S.; Lin, P.; Mei, G. Investigation of Cracking and Water Availability of Soil-Biochar Composite Synthesized from Invasive Weed Water Hyacinth. Bioresour. Technol. 2018, 263, 665–677. [Google Scholar] [CrossRef] [PubMed]
  42. Gopal, P.; Bordoloi, S.; Ratnam, R.; Lin, P.; Cai, W.; Buragohain, P.; Garg, A.; Sreedeep, S. Investigation of Infiltration Rate for Soil-Biochar Composites of Water Hyacinth. Acta Geophys. 2019, 67, 231–246. [Google Scholar] [CrossRef]
  43. Doan, T.T.; Henry-des-Tureaux, T.; Rumpel, C.; Janeau, J.-L.; Jouquet, P. Impact of Compost, Vermicompost and Biochar on Soil Fertility, Maize Yield and Soil Erosion in Northern Vietnam: A Three Year Mesocosm Experiment. Sci. Total Environ. 2015, 514, 147–154. [Google Scholar] [CrossRef] [PubMed]
  44. Abrol, V.; Ben-Hur, M.; Verheijen, F.G.A.; Keizer, J.J.; Martins, M.A.S.; Tenaw, H.; Tchehansky, L.; Graber, E.R. Biochar Effects on Soil Water Infiltration and Erosion under Seal Formation Conditions: Rainfall Simulation Experiment. J. Soils Sediments 2016, 16, 2709–2719. [Google Scholar] [CrossRef]
  45. Kushvaha, V.; Kumar, S.A.; Madhushri, P. Dynamic Fracture Toughness Index: A New Integrated Methodology for Mode-I Fracture Behaviour of Polymer Composite under Impact Loading. Mater. Res. Express 2019, 6, 115342. [Google Scholar] [CrossRef]
  46. Sharma, A.; Madhushri, P.; Kushvaha, V.; Kumar, A. Prediction of the Fracture Toughness of Silicafilled Epoxy Composites Using K-Nearest Neighbor (KNN) Method. In Proceedings of the 2020 International Conference on Computational Performance Evaluation (ComPE), Shillong, India, 2–4 July 2020; pp. 194–198. [Google Scholar]
  47. Kushvaha, V.; Kumar, S.A.; Madhushri, P.; Sharma, A. Artificial Neural Network Technique to Predict Dynamic Fracture of Particulate Composite. J. Compos. Mater. 2020, 54, 3099–3108. [Google Scholar] [CrossRef]
  48. Sharma, A.; Anand Kumar, S.; Kushvaha, V. Effect of Aspect Ratio on Dynamic Fracture Toughness of Particulate Polymer Composite Using Artificial Neural Network. Eng. Fract. Mech. 2020, 228, 106907. [Google Scholar] [CrossRef]
  49. Sharma, A.; Kushvaha, V. Predictive Modelling of Fracture Behaviour in Silica-Filled Polymer Composite Subjected to Impact with Varying Loading Rates Using Artificial Neural Network. Eng. Fract. Mech. 2020, 239, 107328. [Google Scholar] [CrossRef]
  50. Sharma, A.; Mukhopadhyay, T.; Rangappa, S.M.; Siengchin, S.; Kushvaha, V. Advances in Computational Intelligence of Polymer Composite Materials: Machine Learning Assisted Modeling. Anal. Des. 2021. [Google Scholar] [CrossRef]
  51. Garg, A.; Wani, I.; Zhu, H.; Kushvaha, V. Exploring Efficiency of Biochar in Enhancing Water Retention in Soils with Varying Grain Size Distributions Using ANN Technique. Acta Geotech. 2021, 1–12. [Google Scholar] [CrossRef]
  52. Bordoloi, S.; Gopal, P.; Boddu, R.; Wang, Q.; Cheng, Y.-F.; Garg, A.; Sreedeep, S. Soil-Biochar-Water Interactions: Role of Biochar from Eichhornia Crassipes in Influencing Crack Propagation and Suction in Unsaturated Soils. J. Clean. Prod. 2019, 210, 847–859. [Google Scholar] [CrossRef]
  53. Arif, N.; Danoedoro, P. Hartono Analysis of Artificial Neural Network in Erosion Modeling: A Case Study of Serang Watershed. IOP Conf. Ser. Earth Environ. Sci. 2017, 98, 012027. [Google Scholar] [CrossRef] [Green Version]
  54. Suliman, W.; Harsh, J.B.; Abu-Lail, N.I.; Fortuna, A.-M.; Dallmeyer, I.; Garcia-Perez, M. Influence of Feedstock Source and Pyrolysis Temperature on Biochar Bulk and Surface Properties. Biomass Bioenergy 2016, 84, 37–48. [Google Scholar] [CrossRef]
  55. Li, Y.; Ruan, G.; Jalilov, A.S.; Tarkunde, Y.R.; Fei, H.; Tour, J.M. Biochar as a Renewable Source for High-Performance CO2 Sorbent. Carbon 2016, 107, 344–351. [Google Scholar] [CrossRef]
  56. Poulsen, T.G.; Cai, W.; Garg, A. Water Evaporation from Cracked Soil under Moist Conditions as Related to Crack Properties and Near-Surface Wind Speed. Eur. J. Soil Sci. 2020, 71, 627–640. [Google Scholar] [CrossRef]
  57. Cuomo, S.; Della Sala, M.; Pierri, M. Experimental Evidences and Numerical Modelling of Runoff and Soil Erosion in Flume Tests. CATENA 2016, 147, 61–70. [Google Scholar] [CrossRef]
  58. Zhao, Q.; Li, D.; Zhuo, M.; Guo, T.; Liao, Y.; Xie, Z. Effects of Rainfall Intensity and Slope Gradient on Erosion Characteristics of the Red Soil Slope. Stoch. Environ. Res. Risk Assess. 2015, 29, 609–621. [Google Scholar] [CrossRef]
  59. Aksoy, H.; Gedikli, A.; Yilmaz, M.; Eris, E.; Unal, N.E.; Yoon, J.; Kavvas, M.L.; Tayfur, G. Soil Erosion Model Tested on Experimental Data of a Laboratory Flume with a Pre-Existing Rill. J. Hydrol. 2020, 581, 124391. [Google Scholar] [CrossRef]
  60. Ran, Q.; Su, D.; Li, P.; He, Z. Experimental Study of the Impact of Rainfall Characteristics on Runoff Generation and Soil Erosion. J. Hydrol. 2012, 424–425, 99–111. [Google Scholar] [CrossRef]
  61. TIBCO® Data Science. Available online: https://www.tibco.com/products/data-science (accessed on 2 January 2022).
  62. Maier, H.R.; Dandy, G.C. Neural Networks for the Prediction and Forecasting of Water Resources Variables: A Review of Modelling Issues and Applications. Environ. Model. Softw. 2000, 15, 101–124. [Google Scholar] [CrossRef]
  63. Albaradeyia, I.; Hani, A.; Shahrour, I. WEPP and ANN Models for Simulating Soil Loss and Runoff in a Semi-Arid Mediterranean Region. Environ. Monit Assess. 2011, 180, 537–556. [Google Scholar] [CrossRef]
  64. Chukwuka, K.S.; Alimba, C.G.; Ataguba, G.A.; Jimoh, W.A. Chapter 9 - The Impacts of Petroleum Production on Terrestrial Fauna and Flora in the Oil-Producing Region of Nigeria. In The Political Ecology of Oil and Gas Activities in the Nigerian Aquatic Ecosystem; Ndimele, P.E., Ed.; Academic Press: Cambridge, MA, USA, 2018; pp. 125–142. ISBN 978-0-12-809399-3. [Google Scholar]
  65. Garg, A.; Huang, H.; Cai, W.; Reddy, N.G.; Chen, P.; Han, Y.; Kamchoom, V.; Gaurav, S.; Zhu, H.-H. Influence of Soil Density on Gas Permeability and Water Retention in Soils Amended with In-House Produced Biochar. J. Rock Mech. Geotech. Eng. 2021, 13, 593–602. [Google Scholar] [CrossRef]
  66. Fu, X.T.; Zhang, L.P.; Wang, Y. Effect of Slope Length and Rainfall Intensity on Runoff and Erosion Conversion from Laboratory to Field. Water Resour 2019, 46, 530–541. [Google Scholar] [CrossRef]
  67. Las Heras, M.M.; Nicolau, J.M.; Merino-Martín, L.; Wilcox, B.P. Plot-Scale Effects on Runoff and Erosion along a Slope Degradation Gradient. Water Resour. Res. 2010, 46. [Google Scholar] [CrossRef] [Green Version]
  68. Jakub, S. Land use, soil conservation and rain harvesting structures on a slope land orchard at sufen (taiwan) during of action of typhoon herb–elementary numerical experiment. Agricultura Tropica Subtropica 2011, 44, 22–29. [Google Scholar]
  69. Parker, D.B.; Michel, T.G.; Smith, J.L. Compaction and Water Velocity Effects on Soil Erosion in Shallow Flow. J. Irrig. Drain. Eng. 1995, 121, 170–178. [Google Scholar] [CrossRef]
  70. Ekwue, E.I.; Harrilal, A. Effect of Soil Type, Peat, Slope, Compaction Effort and Their Interactions on Infiltration, Runoff and Raindrop Erosion of Some Trinidadian Soils. Biosyst. Eng. 2010, 105, 112–118. [Google Scholar] [CrossRef]
  71. Zhao, X.; Huang, J.; Gao, X.; Wu, P.; Wang, J. Runoff Features of Pasture and Crop Slopes at Different Rainfall Intensities, Antecedent Moisture Contents and Gradients on the Chinese Loess Plateau: A Solution of Rainfall Simulation Experiments. CATENA 2014, 119, 90–96. [Google Scholar] [CrossRef]
  72. Huang, X.; Niu, R.; Huang, X.; An, Y.; Li, J.; Li, M.; Huang, H.; Garg, A. Influence of Sustainable Biochars Produced from Kitchen Waste, Pig Manure, and Wood on Soil Erosion. Water 2021, 13, 2296. [Google Scholar] [CrossRef]
  73. Alburquerque, J.A.; Calero, J.M.; Barrón, V.; Torrent, J.; del Campillo, M.C.; Gallardo, A.; Villar, R. Effects of Biochars Produced from Different Feedstocks on Soil Properties and Sunflower Growth. J. Plant. Nutr. Soil Sci. 2014, 177, 16–25. [Google Scholar] [CrossRef]
  74. Chan, K.Y.; Zwieten, L.V.; Meszaros, I.; Downie, A.; Joseph, S. Using Poultry Litter Biochars as Soil Amendments. Soil Res. 2008, 46, 437–444. [Google Scholar] [CrossRef]
  75. Lal, R. Effect of Slope Length, Slope, Gradient, Tillage Methods and Cropping Systems and Run-off and Soil Erosion on a Tropical Alfisol: Preliminary Results. IAHS Publ 1988, 174, 79–88. [Google Scholar]
  76. Lei, O.; Zhang, R. Effects of Biochars Derived from Different Feedstocks and Pyrolysis Temperatures on Soil Physical and Hydraulic Properties. J. Soils Sediments 2013, 13, 1561–1572. [Google Scholar] [CrossRef]
Figure 1. Illustrative sketch of flume experiment.
Sustainability 14 00684 g001
Figure 2. ANN design model used for prediction of (a) Total Erosion Rate (b) Total Water Flow Rate.
Sustainability 14 00684 g002
Figure 3. Flowchart for ANN modelling.
Sustainability 14 00684 g003
Figure 4. Comparison between Experimental and Predicted (a) Total Erosion Rate and (b) Total Water Flow Rate.
Sustainability 14 00684 g004
Figure 5. Variation of experimental with ANN predicted values for (a) Total Erosion Rate and (b) Total Water Flow Rate.
Sustainability 14 00684 g005
Figure 6. Variation of Degree of Compaction with Total Erosion Rate and Total Water Flow Rate.
Sustainability 14 00684 g006
Figure 7. Variation of Total Erosion Rate and Total Water Flow Rate with the Rainfall Rate.
Sustainability 14 00684 g007
Figure 8. Variation of Total Erosion Rate and Total Water Flow Rate with the Slope Length.
Sustainability 14 00684 g008
Figure 9. Variation of Erosion Total Rate and Total Water Flow Rate with the Slope Gradient.
Sustainability 14 00684 g009
Figure 10. Variation of Erosion Rate and Total Water Flow Rate with the Biochar Amendment Ratio.
Sustainability 14 00684 g010
Figure 11. Relative Significance of Various Parameters on (a) Total Erosion Rate, (b) Total Water Flow Rate.
Sustainability 14 00684 g011
Publisher’s Note: MDPI stays neutral with regard to jurisdictional claims in published maps and institutional affiliations.

