
Evaluation of the Risk Induced by Soil Erosion on Land Use. Case Study: Guruslău Depression


 ,
,  , and
, and 
Abstract
:1. Introduction
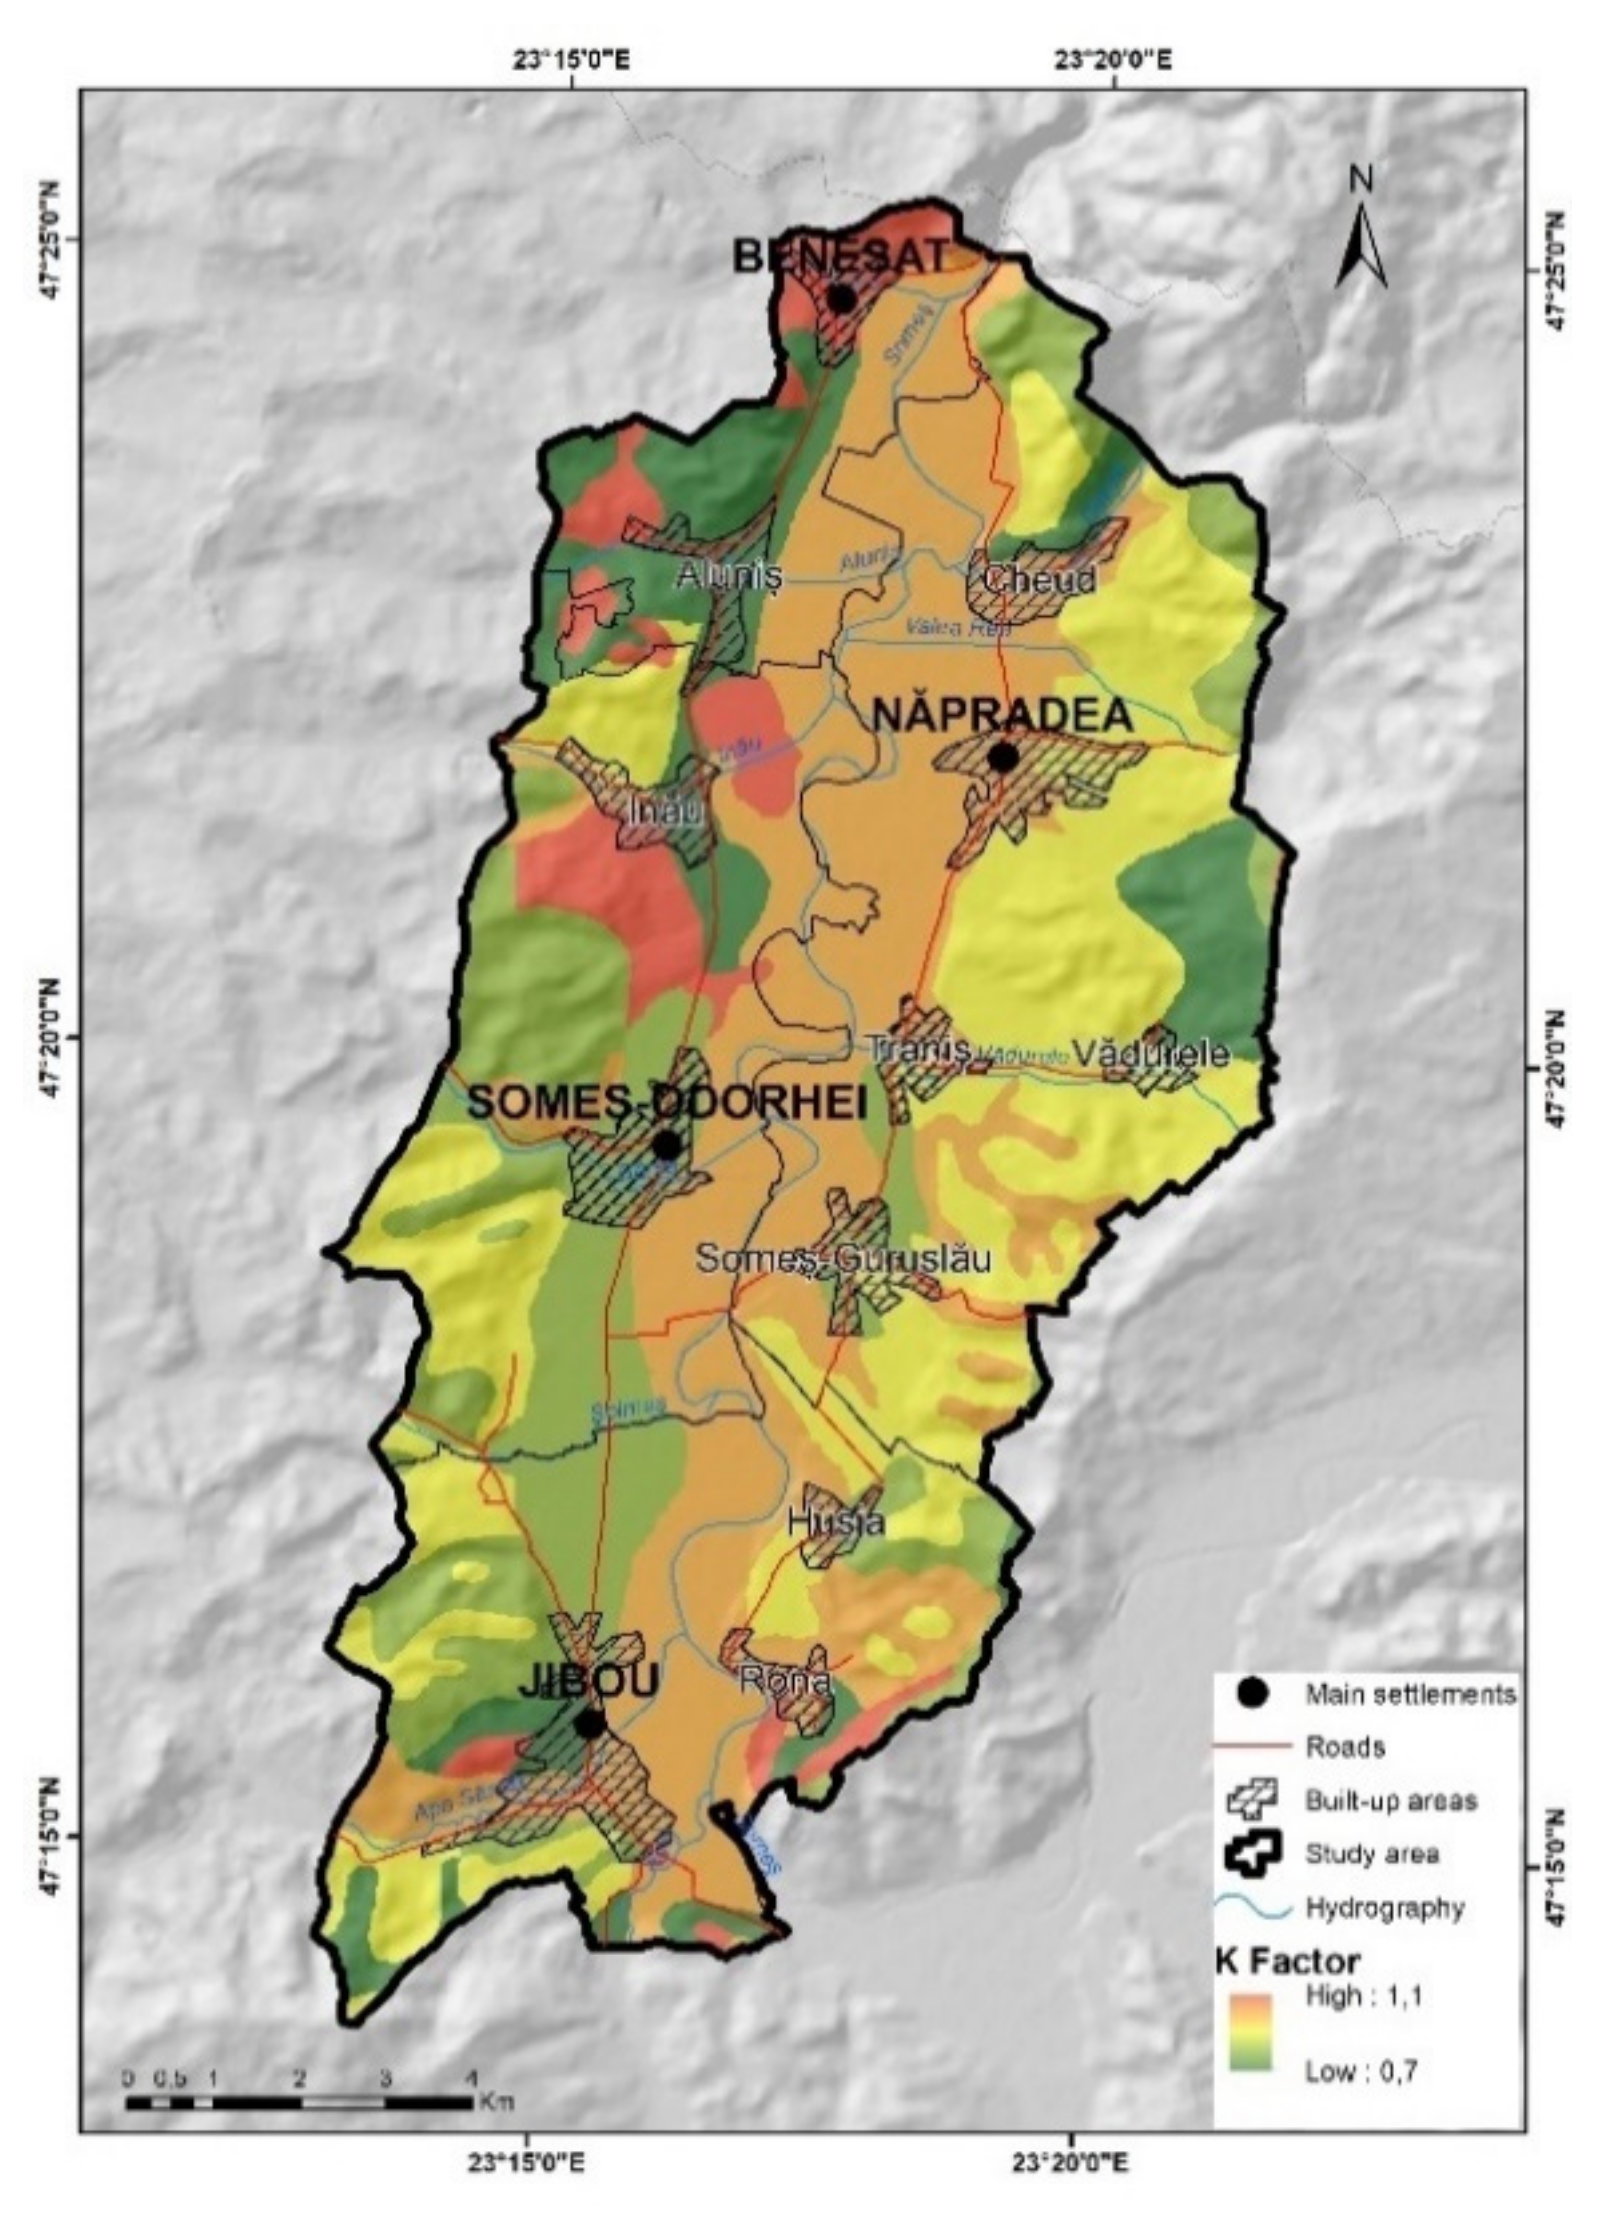
2. Study Area
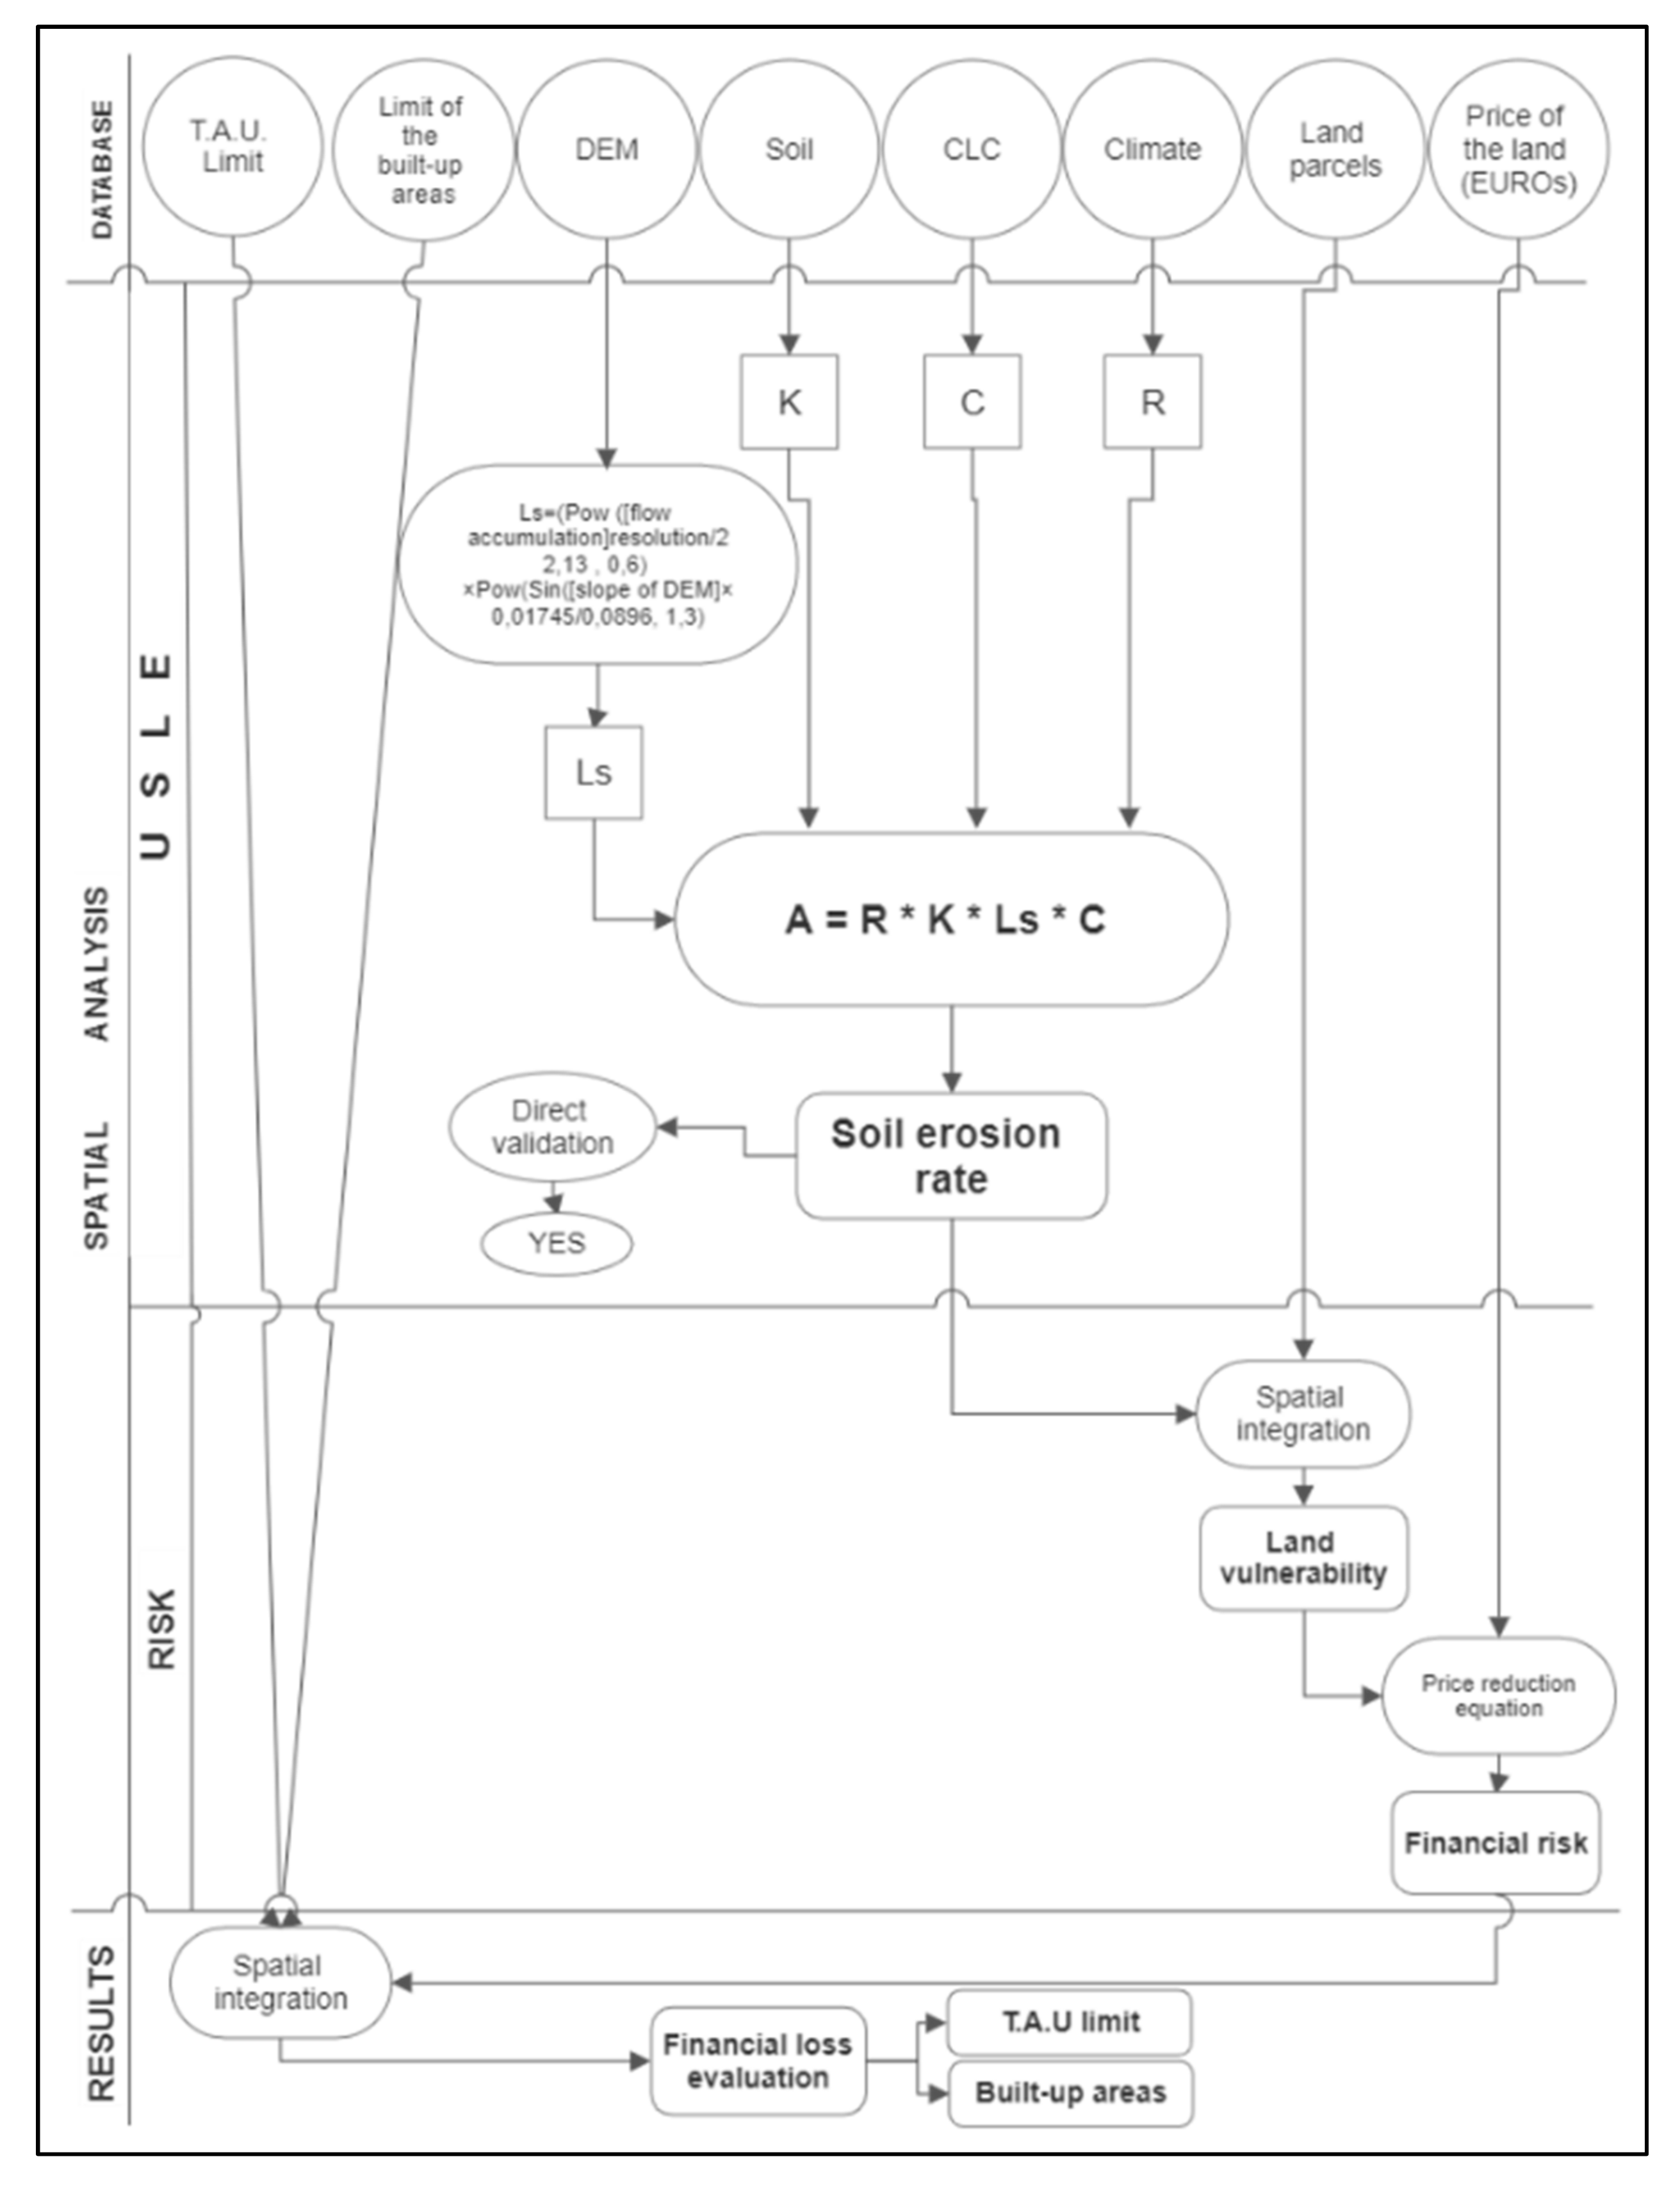
3. Materials and Methods
- A = annual soil losses
- R = rainfall erosivity factor
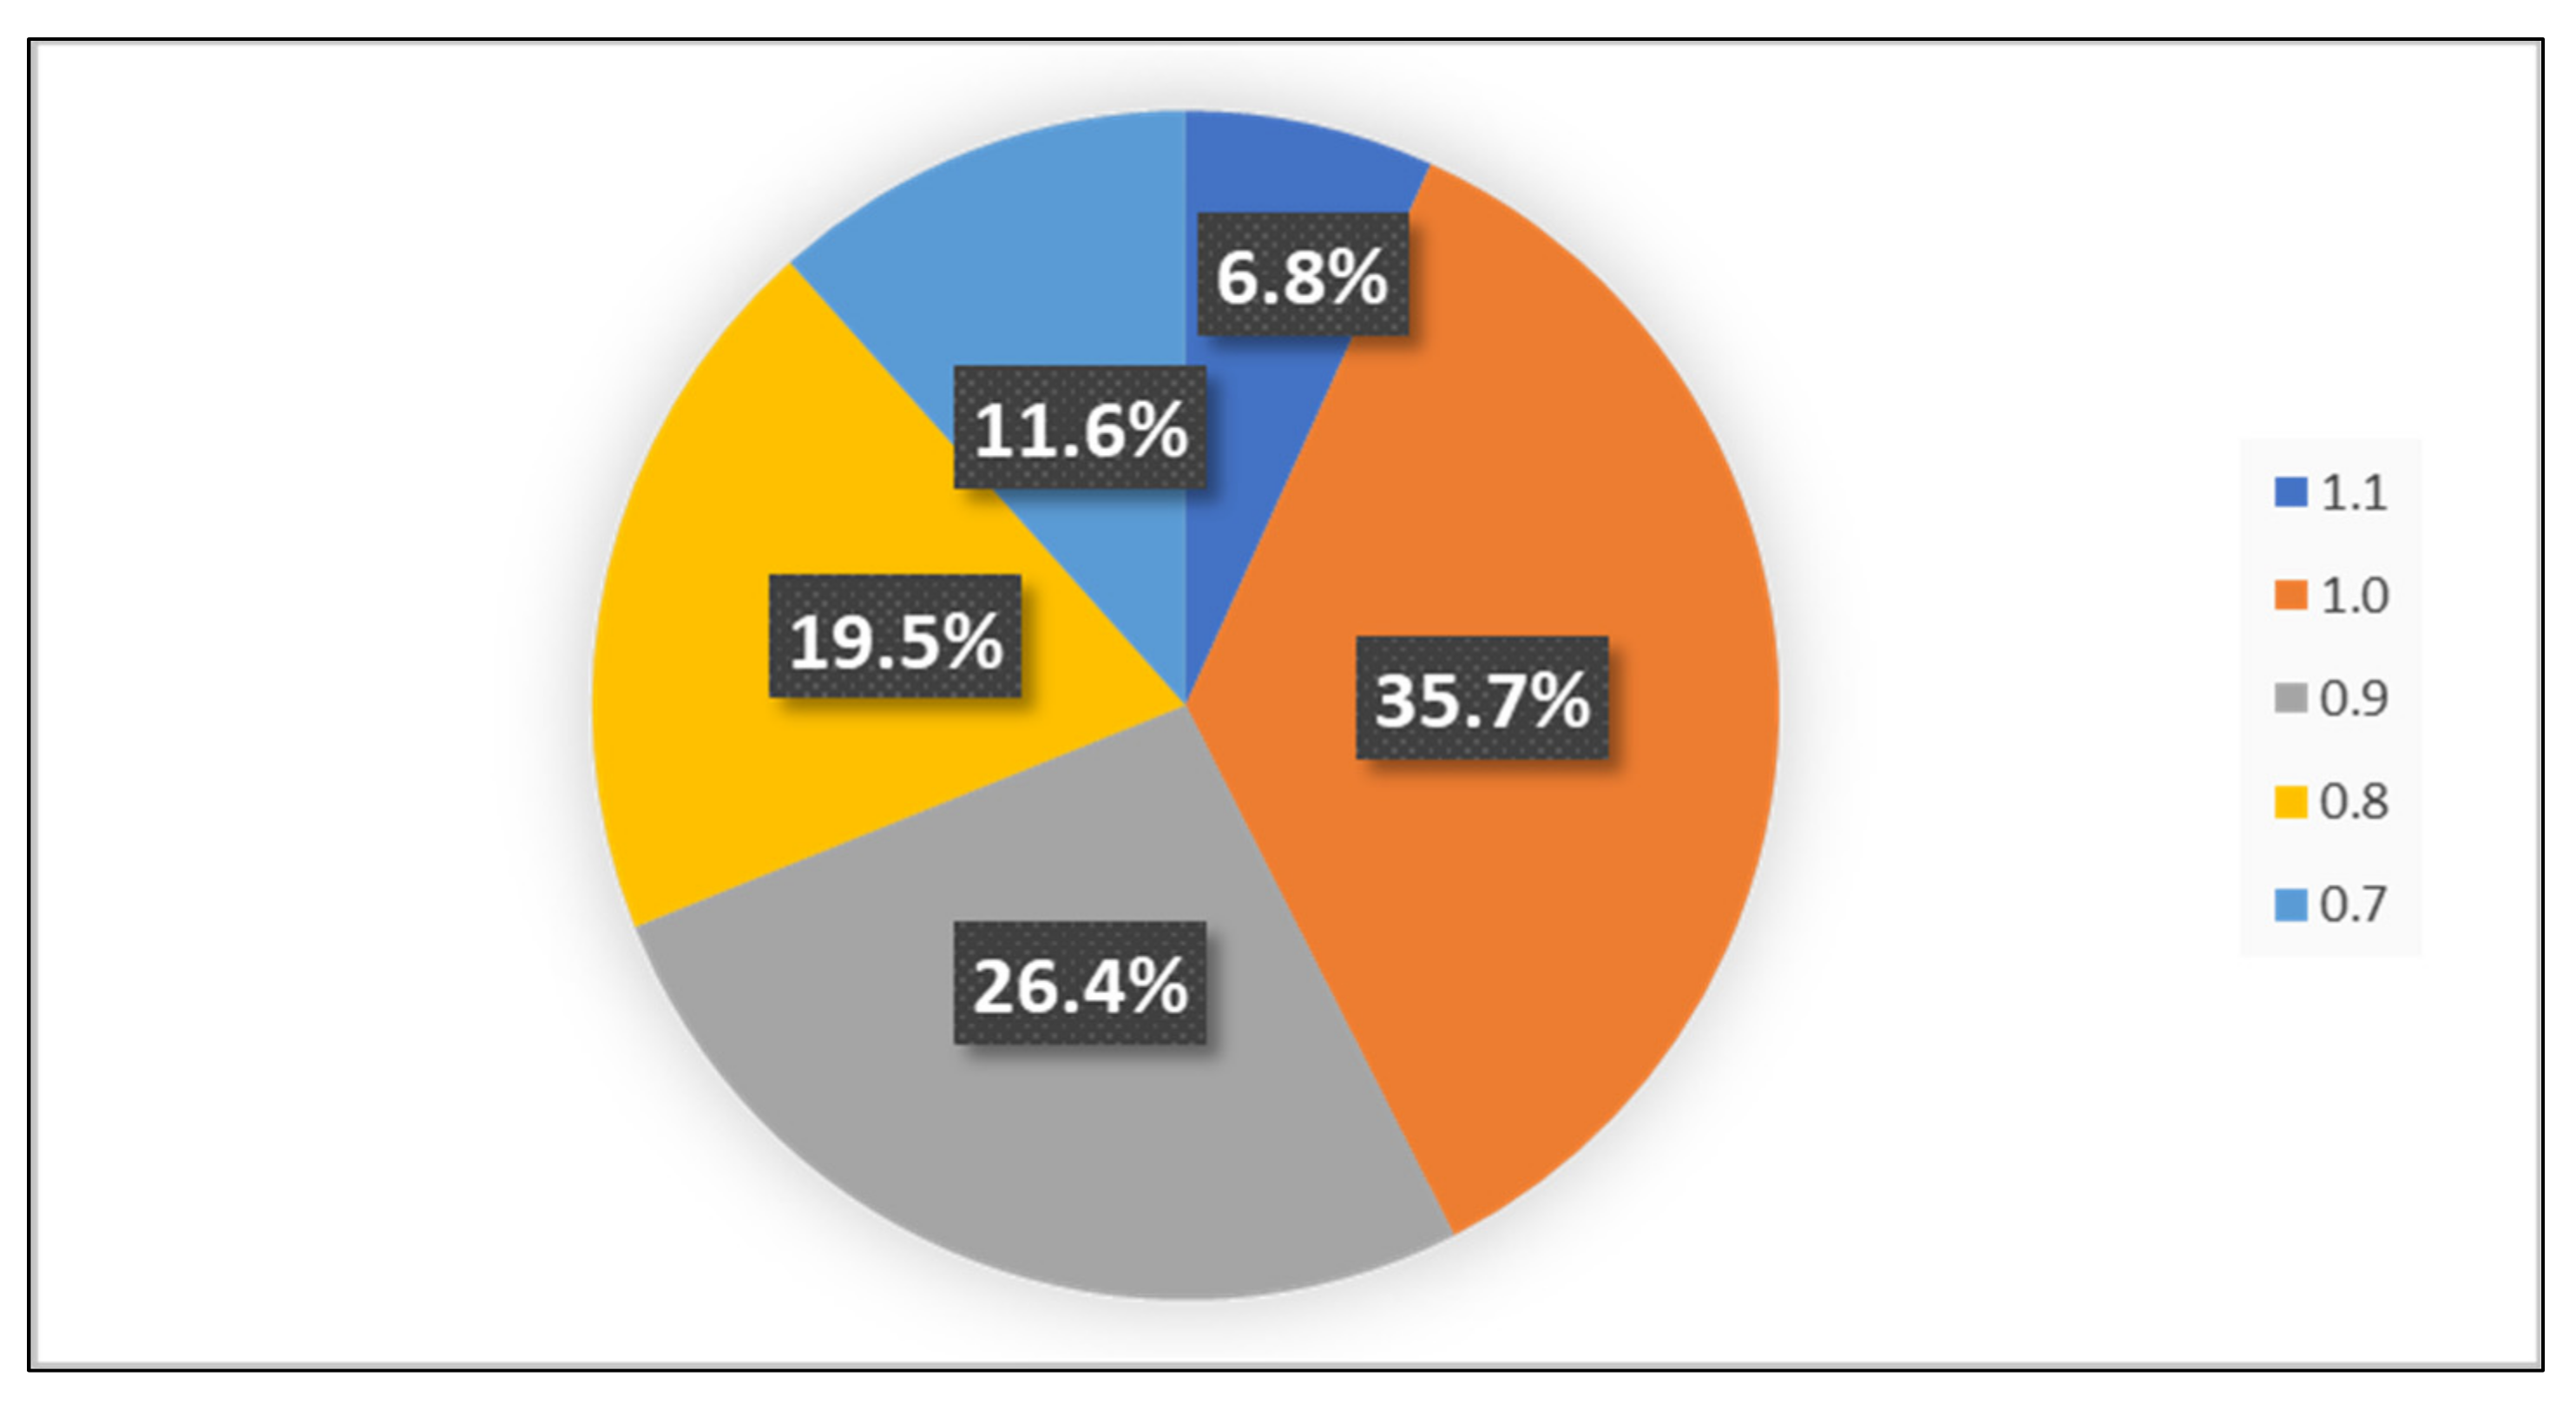
- K = soil erodibility index
- Ls = slope length and steepness factor
- C = cover and management factor
- P = support practice factor
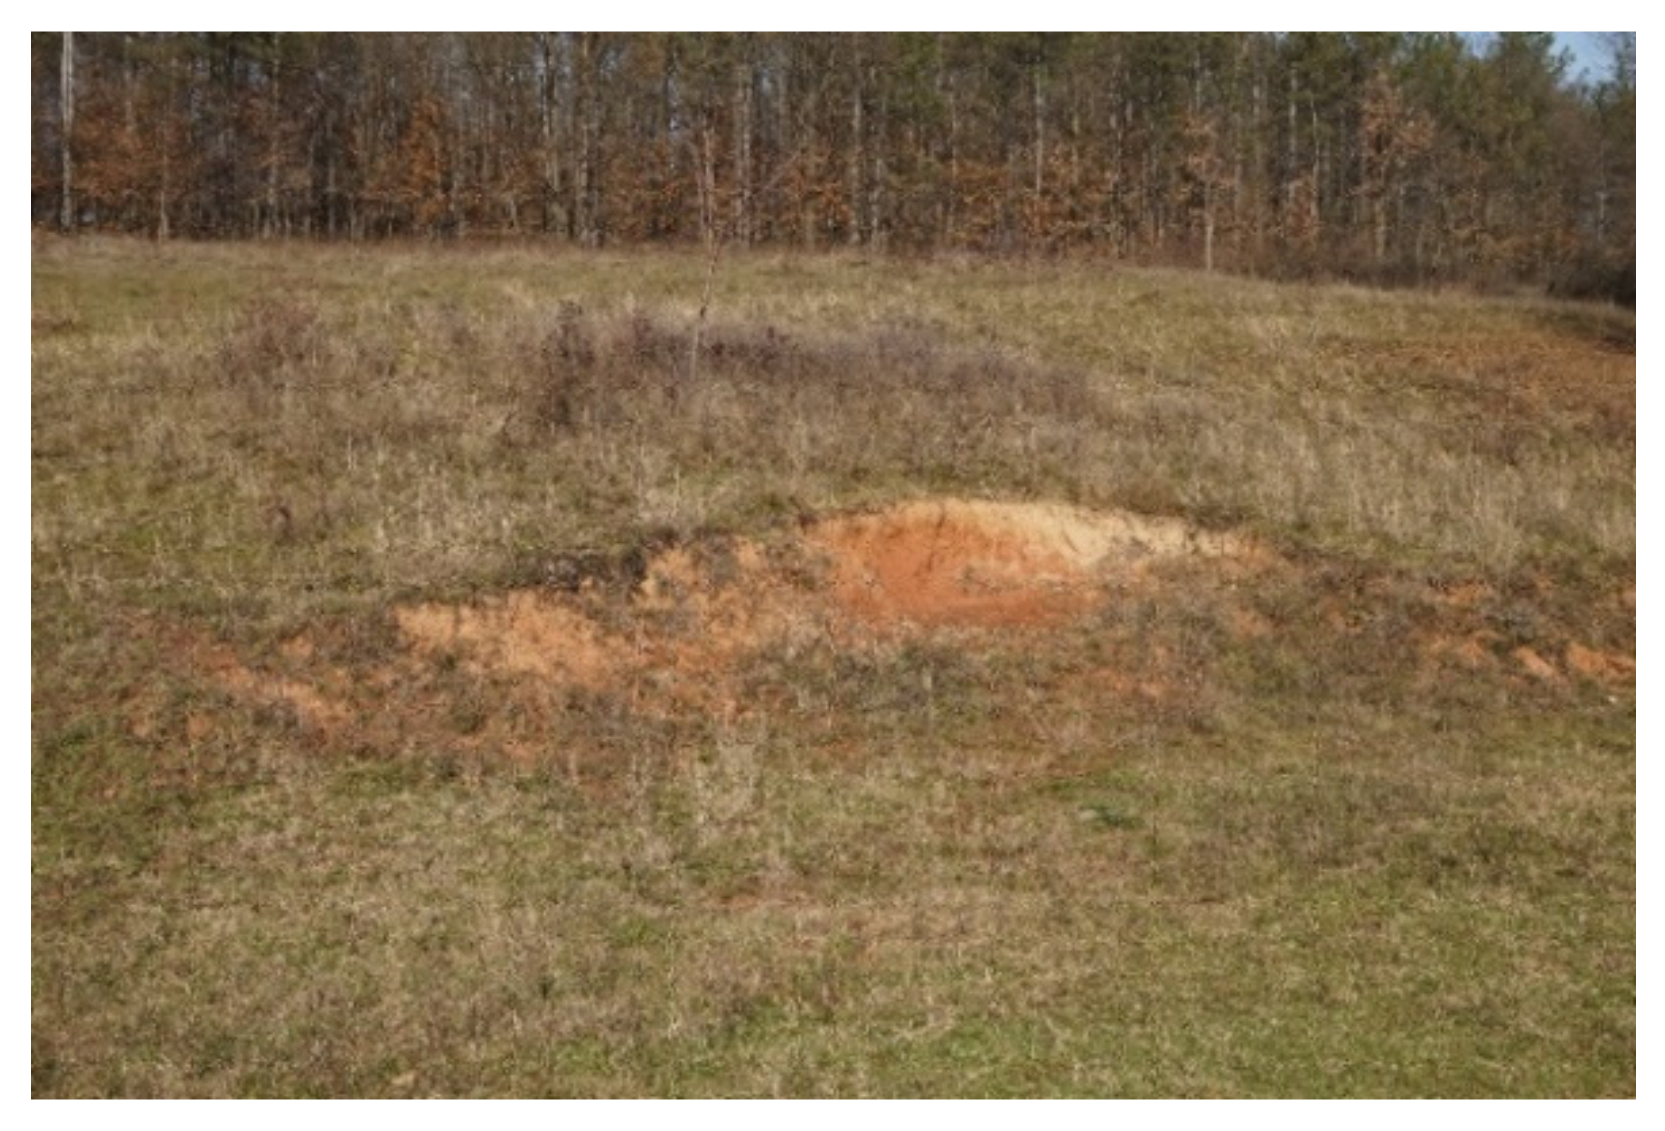
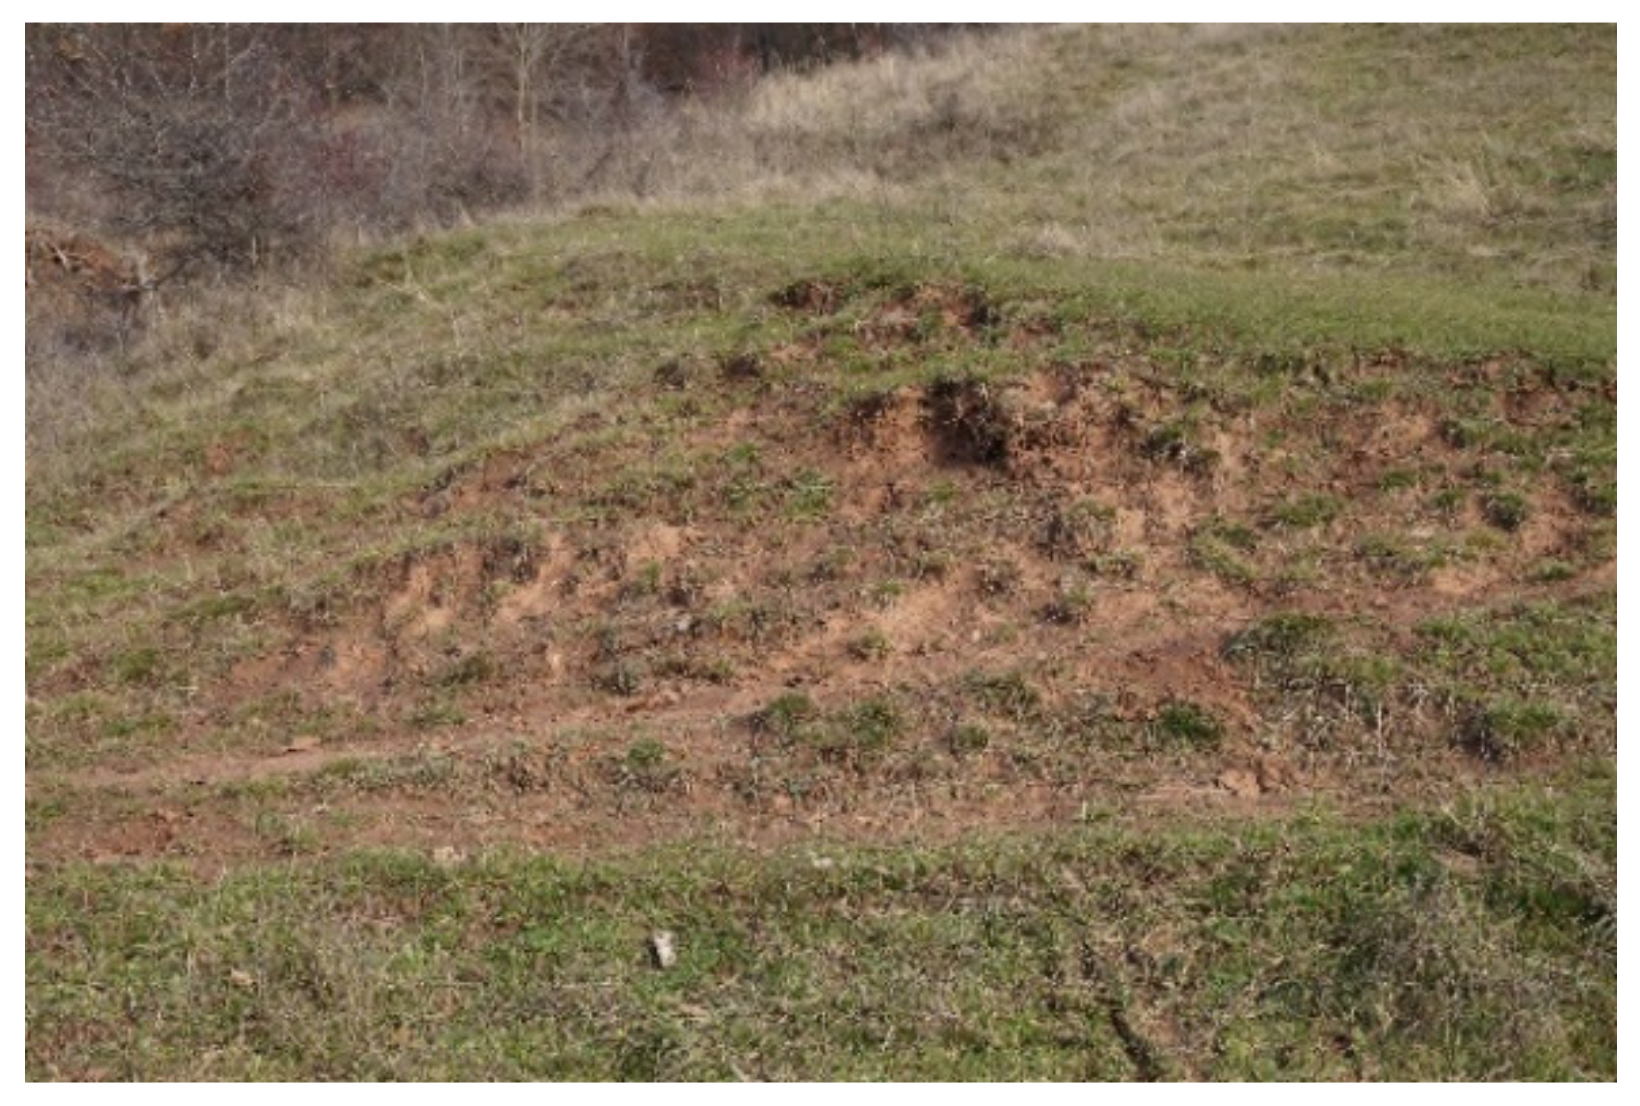
4. Results and Discussion
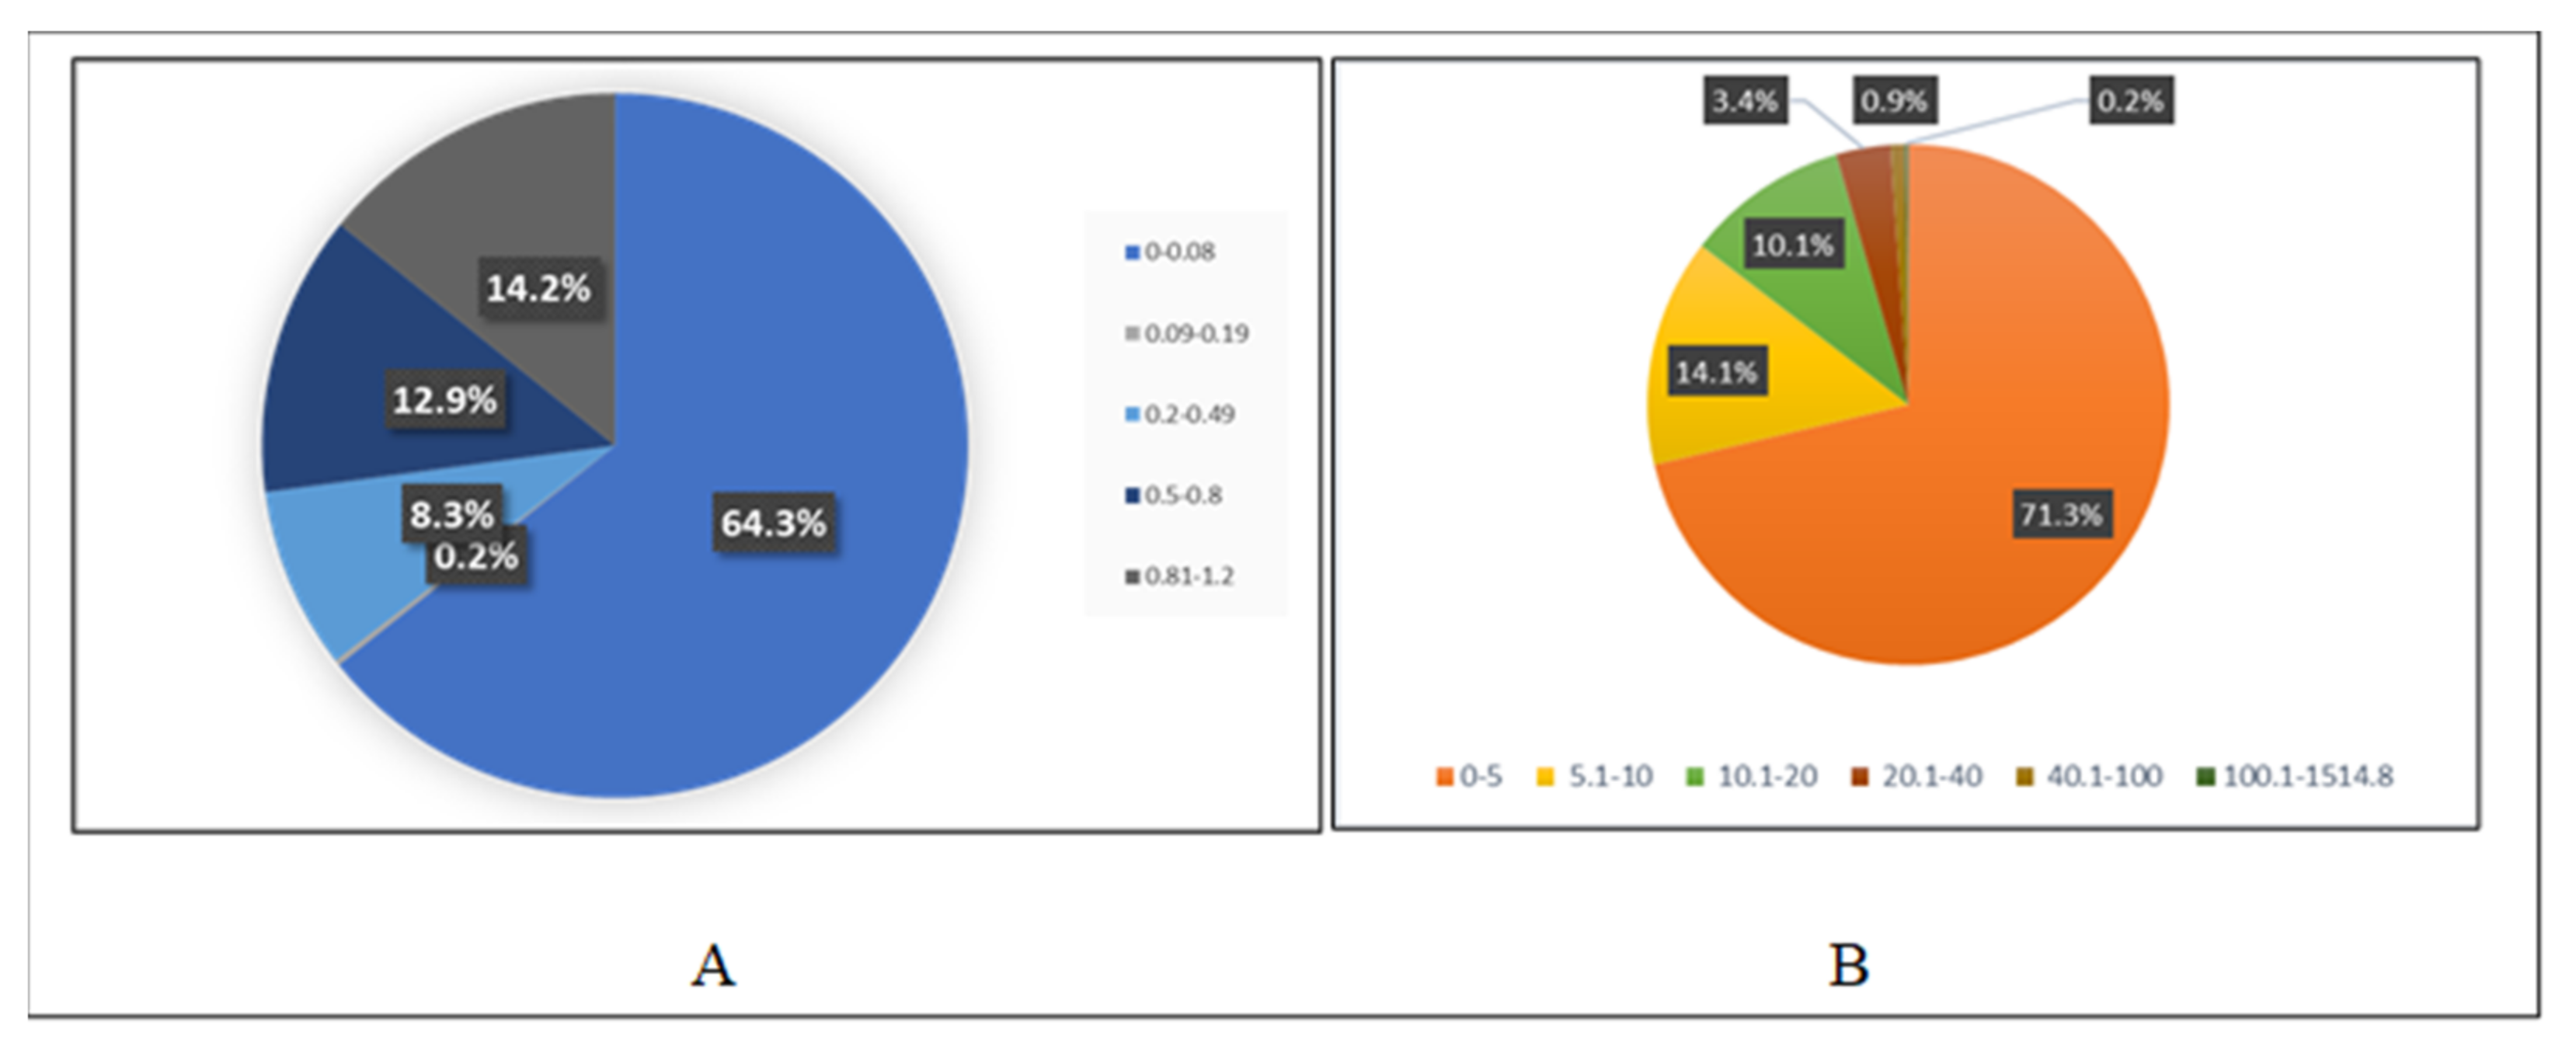
4.1. USLE Model Results
4.2. Risk Evaluation
5. Conclusions
Supplementary Materials
Author Contributions
Funding
Institutional Review Board Statement
Informed Consent Statement
Data Availability Statement
Conflicts of Interest
References
- Pimentel, D. Soil Erosion: A Food and Environmental Threat. Environ. Dev. Sustain. 2006, 8, 119–137. [Google Scholar] [CrossRef]
- Lal, R.; Steward, B.A. Soil Degradation; Springer: New York, NY, USA, 1990. [Google Scholar]
- Baskan, O.; Cebel, H.; Akgul, S.; Erpul, G. Conditional simulation of USLE/RUSLE soil erodibility factor by geostatistics in a Mediterranean Catchment, Turkey. Environ. Earth Sci. 2009, 60, 1179–1187. [Google Scholar] [CrossRef]
- Angima, S.; Stott, D.; O’Neill, M.; Ong, C.; Weesies, G. Soil erosion prediction using RUSLE for central Kenyan highland conditions. Agric. Ecosyst. Environ. 2003, 97, 295–308. [Google Scholar] [CrossRef]
- Hu, Y.; Gao, M. Batunacun Evaluations of water yield and soil erosion in the Shaanxi-Gansu Loess Plateau under different land use and climate change scenarios. Environ. Dev. 2020, 34, 100488. [Google Scholar] [CrossRef]
- Pimentel, D.; Kounang, N. Ecology of Soil Erosion in Ecosystems. Ecosystems 1998, 1, 416–426. [Google Scholar] [CrossRef]
- Tilman, D.; Downing, J.A. Biodiversity and stability in grasslands. Nature 1994, 367, 363–365. [Google Scholar] [CrossRef]
- Oldeman, L.R.; Hakkeling, R.; Sombroek, W.G. World Map of the Status of Human-Induced Soil Degradation: An Explanatory Note; International Soil Reference and Information Centre: Wageningen, The Netherlands, 1990. [Google Scholar]
- Oldeman, L.R. The global extent of land degradation. In Land Resilience and Sustainable Land Use; Greenland, D.J., Szabolcs, I., Eds.; CABI: Wallingford, UK, 1994. [Google Scholar]
- Ebrahimi, M.; Nejadsoleymani, H.; Sadeghi, A.; Daneshvar, M.R.M. Assessment of the soil loss-prone zones using the USLE model in northeastern Iran. Paddy Water Environ. 2021, 19, 71–86. [Google Scholar] [CrossRef]
- Lal, R. Soil erosion by wind and water: Problems and prospects. In 687 Soil Erosion Research Methods, 2nd ed.; Routledge: Oxford, UK, 2017; pp. 1–10. [Google Scholar]
- Oldeman, L.R. Global Extend of Soil Degradation, ISRIC Bi-Annual Report 1991–1992; ISRIC: Wageningen, The Netherlands, 1992; pp. 19–36. [Google Scholar]
- Hussein, M.H. Water erosion assessment and control in Northern Iraq. Soil Tillage Res. 1998, 45, 161–173. [Google Scholar] [CrossRef]
- Borrelli, P.; Robinson, D.A.; Panagos, P.; Lugato, E.; Yang, J.E.; Alewell, C.; Wuepper, D.; Montanarella, L.; Ballabio, C. Land use and climate change impacts on global soil erosion by water (2015–2070). Proc. Natl. Acad. Sci. USA 2020, 117, 21994–22001. [Google Scholar] [CrossRef] [PubMed]
- Surya, G. Simulating Climate Change Impact on Soil Erosion and Soil Carbon Sequestration; Indian Space Research Organization: Bangalore, India, 2015. [Google Scholar]
- Pruski, F.F.; Nearing, M.A. Runoff and soil loss responses to changes in precipitation: A computer simulation study. J. Soil Water Conserv. 2002, 57, 7–16. [Google Scholar]
- Vanacker, V.; Govers, G.; Barros, S.; Poesen, J.; Deckers, J. The effect of short-term socio-economic and demographic change on landuse dynamics and its corresponding geomorphic response with relation to water erosion in a tropical mountainous catchment, Ecuador. Landsc. Ecol. 2003, 18, 1–15. [Google Scholar] [CrossRef]
- Chakrabortty, R.; Pradhan, B.; Mondal, P.; Pal, S.C. The use of RUSLE and GCMs to predict potential soil erosion associated with climate change in a monsoon-dominated region of eastern India. Arab. J. Geosci. 2020, 13, 1073. [Google Scholar] [CrossRef]
- Koirala, P.; Thakuri, S.; Joshi, S.; Chauhan, R. Estimation of Soil Erosion in Nepal Using a RUSLE Modeling and Geospatial Tool. Geosciences 2019, 9, 147. [Google Scholar] [CrossRef] [Green Version]
- Uri, N.D. Agriculture and the Environment—The Problem of Soil Erosion. J. Sustain. Agric. 2000, 16, 71–94. [Google Scholar] [CrossRef]
- Keesstra, S.; Mol, G.; De Leeuw, J.; Okx, J.; Molenaar, C.; De Cleen, M.; Visser, S. Soil-Related Sustainable Development Goals: Four Concepts to Make Land Degradation Neutrality and Restoration Work. Land 2018, 7, 133. [Google Scholar] [CrossRef] [Green Version]
- Navas, A.; Valero-Garcés, B.L.; Machín, J. Research Note:An approach to integrated assessement of reservoir siltation: The Joaquín Costa reservoir as a case study. Hydrol. Earth Syst. Sci. 2004, 8, 1193–1199. [Google Scholar] [CrossRef] [Green Version]
- Samaras, A.G.; Koutitas, C.G. The impact of watershed management on coastal morphology: A case study using an integrated approach and numerical modeling. Geomorphology 2014, 211, 52–63. [Google Scholar] [CrossRef]
- Nearing, M.A. Potential changes in rainfall erosivity in the US withclimate change during the 21st century. J. Soil Water Conserv. 2001, 56, 229–232. [Google Scholar]
- Williams, J.; Nearing, M.; Nicks, A.; Skidmore, E.; Valentin, C.; King, K.; Savabi, R. Using soil erosion models for global change studies. J. Soil Water Conserv. 1996, 51, 381–385. [Google Scholar]
- O’Neal, M.R.; Nearing, M.; Vining, R.C.; Southworth, J.; Pfeifer, R.A. Climate change impacts on soil erosion in Midwest United States with changes in crop management. Catena 2005, 61, 165–184. [Google Scholar] [CrossRef]
- Lal, R. Climate Change and Soil Degradation Mitigation by Sustainable Management of Soils and Other Natural Resources. Agric. Res. 2012, 1, 199–212. [Google Scholar] [CrossRef] [Green Version]
- Nearing, M.A.; Foster, G.R.; Lane, L.J.; Finkner, S.C. A Process-Based Soil Erosion Model for USDA-Water Erosion Prediction Project Technology. Trans. ASAE 1989, 32, 1587–1593. [Google Scholar] [CrossRef]
- Flanagan, D.C.; Nearing, M.A. USDA Water Erosion Prediction Project: Hillslope Profile and Watershed Model Documentation; NSERL Report No. 10; USDA-ARS National Soil Erosion Research Laboratory: West Lafayette, IN, USA, 1995; pp. 1–123. [Google Scholar]
- Nearing, M.A.; Pruski, F.F.; O’Neal, M.R. Expected climate change impacts on soil erosion rates: A review. J. Soil Water Conserv. 2004, 59, 43–50. [Google Scholar]
- Nearing, M.A.; Deer-Ascough, L.; Laflen, J.M. Sensitivity Analysis of the WEPP Hillslope Profile Erosion Model. Trans. ASAE 1990, 33, 0839–0849. [Google Scholar] [CrossRef]
- Intergovernmental Panel on Climate Change (IPCC). Climate Change 1995. Working Group 1. IPPC; Cambridge University Press: Cambridge, CA, USA, 1995. [Google Scholar]
- Pimentel, D.; Harvey, C.; Resosudarmo, P.; Sinclair, K.; Kurz, D.; McNair, M.; Crist, S.; Shpritz, L.; Fitton, L.; Saffouri, R.; et al. Environmental and Economic Costs of Soil Erosion and Conservation Benefits. Science 1995, 267, 1117–1123. [Google Scholar] [CrossRef] [PubMed] [Green Version]
- Risti´c, R.; Kostadinov, S.; Radi´c, B.; Trivan, G.; Niki´c, Z. Torrential Floods in Serbia–Man Made and Natural Hazards. In Proceedings of the 12th Congress INTERPRAEVENT 2012, Grenoble, France, 23–26 April 2012; pp. 771–779. [Google Scholar]
- Ashiagbor, G.; Forkuo, E.; Laari, P.; Aabeyir, R. Modeling soil erosion using RUSLE and GIS tools. Int. J. Remote Sens. Geosci 2013, 2, 7–17. [Google Scholar]
- Telles, T.S.; Guimarães, M.D.F.; Dechen, S.C.F. The costs of soil erosion. Rev. Bras. Ciência Solo 2011, 35, 287–298. [Google Scholar] [CrossRef]
- Bertoni, J.; Lombardi Neto, F. Conservação do Solo, 6th ed.; Ícone: São Paulo, Brazil, 2008; p. 355. [Google Scholar]
- Marques, J.F. Costs of soil erosion from an area of high agricultural production. Rev. Econ. Sociol. Rural. 1998, 36, 227–244. [Google Scholar]
- Clark, E.H.; Haverkamp, J.A.; Chapman, W. Eroding Soils: The off Farm Impacts; The Conservation Foundation: Washington, DC, USA, 1985; p. 252. [Google Scholar]
- Crosson, P. Impacts of erosion on land productivity and water quality in the United States. In Soil Erosion and Conservation; el-Swaify, S.A., Moldenhauer, W.C., Lo, A., Eds.; SoilConservation Society of American: Ankeny, IA, USA, 1985; pp. 217–236. [Google Scholar]
- Lane, L.J.; Hernandez, M.; Nichols, M. Processes controlling sediment yield from watersheds as functions of spatial scale. Environ. Model. Softw. 1997, 12, 355–369. [Google Scholar] [CrossRef]
- Adinarayana, J.; Rao, K.G.; Krishna, N.R.; Venkatachalam, P.; Suri, J.K. A rule-based soil erosion model for Ahilly catchment. Catena 1999, 37, 309–318. [Google Scholar] [CrossRef]
- Abu Hammad, A. Watershed erosion risk assessment and management utilizing revised universal soil loss equation-geographic information systems in the Mediterranean environments. Water Environ. J. 2011, 25, 149–162. [Google Scholar] [CrossRef]
- Moore, I.D.; Wilson, J.P. Length-slope factors for the Revised Universal Soil Loss Equation: Simplified method of estimation. J. Soil Water Conserv. 1992, 47, 423–428. [Google Scholar]
- Wischmeier, W.H.; Smith, D.D. Predicting Rainfall Erosion Losses—A Guide to Conservation Planning; U.S. Department of Agriculture, Agriculture Handbook No. 537; U.S. Department of Agriculture: Washington, DC, USA, 1978. [Google Scholar]
- Renard, K.G.; Foster, G.R.; Weesies, G.A.; McCool, D.K.; Yoder, D.C. Predicting Soil Erosion by Water: A Guide to Conservation Planning With the Revised Universal Soil Loss Equation (RUSLE); U.S. Department of Agriculture, Agriculture Handbook No. 703; U.S. Department of Agriculture: Washington, DC, USA, 1997. [Google Scholar]
- Manyiwa, T.; Dikinya, O. Using Universal Soil Loss Equation and Soil Erodibility Factor to Assess Soil Erosion in Tshesebe Village, North East Botswana. Afr. J. Agric. Res. 2013, 8, 4170–4178. [Google Scholar] [CrossRef]
- Thomas, J.; Joseph, S.; Thrivikramji, K. Assessment of soil erosion in a tropical mountain river basin of the southern Western Ghats, India using RUSLE and GIS. Geosci. Front. 2018, 9, 893–906. [Google Scholar] [CrossRef]
- Grimm, M.; Jones, R.J.A.; Rusco, E.; Montanarella, L. Soil Erosion Risk in Italy: A Revised USLE Approach; European Soil Bureau Research Report No.11, EUR 20677 EN, (2002); Office for Official Publications of the European Communities: Luxembourg, 2003; p. 28. [Google Scholar]
- Gitas, I.Z.; Douros, K.; Minakou, C.; Silleos, G.N.; Karydas, C.G. Multi-temporal soil erosion risk assessment in N. Chalkidiki using a modified USLE raster model. EARSeL eProceedings 2009, 8, 40–52. [Google Scholar]
- Olsen, P.; Kristensen, P.R. Using a GIS system in mapping risks of nitrate leaching and erosion on the basis of SOIL/SOIL-N and USLE simulations. Nutr. Cycl. Agroecosyst. 1998, 50, 307–311. [Google Scholar] [CrossRef]
- van der Knijff, J.M.; Jones, R.J.; Montanarella, L.A. Soil Erosion Risk Assessment in Europe, Technical Report; Joint Research Centre European Soil Bureau: Brussels, Belgium, 2000. [Google Scholar]
- Blinkov, I.; Kostadinov, S. Applicability of Various Erosion Risk Assessment Methods for Engineering Purposes. Balwois 2010, 2010, 25–29. [Google Scholar]
- Nearing, M.; Jetten, V.; Baffaut, C.; Cerdan, O.; Couturier, A.; Hernandez, M.; Le Bissonnais, Y.; Nichols, M.; Nunes, J.P.; Renschler, C.S.; et al. Modeling response of soil erosion and runoff to changes in precipitation and cover. Catena 2005, 61, 131–154. [Google Scholar] [CrossRef]
- Bartok, B.; Telcian, A.-S.; Săcărea, C.; Horvath, C.; Croitoru, A.-E.; Stoian, V. Regional Climate Models Validation for Agroclimatology in Romania. Atmosphere 2021, 12, 978. [Google Scholar] [CrossRef]
- Harpa, G.; Croitoru, A.; Djurdjevic, V.; Horvath, C.; Djurjevic, V. Future changes in five extreme precipitation indices in the lowlands of Romania. Int. J. Clim. 2019, 39, 5720–5740. [Google Scholar] [CrossRef]
- Moţoc, M.; Munteanu, S.; Băloiu, V.; Stănescu, P.; Mihai, G. Eroziunea solului şi metode de combatere; Editura Ceres: Bucureşti, Romania, 1975; p. 301. [Google Scholar]
- Bilașco, Ș.; Roșca, S.; Vescan, I.; Fodorean, I.; Dohotar, V.; Sestras, P. A GIS-Based Spatial Analysis Model Approach for Identification of Optimal Hydrotechnical Solutions for Gully Erosion Stabilization. Case Study. Appl. Sci. 2021, 11, 4847. [Google Scholar] [CrossRef]
- Sestras, P.; Bilașco, Ș.; Roșca, S.; Dudic, B.; Hysa, A.; Spalević, V. Geodetic and UAV Monitoring in the Sustainable Management of Shallow Landslides and Erosion of a Susceptible Urban Environment. Remote Sens. 2021, 13, 385. [Google Scholar] [CrossRef]
- Matei, I.; Pacurar, I.; Roșca, S.; Bilașco, Ș.; Sestras, P.; Rusu, T.; Jude, E.T.; Tăut, F.D. Land Use Favourability Assessment Based on Soil Characteristics and Anthropic Pollution. Case Study Somesul Mic Valley Corridor, Romania. Agronomy 2020, 10, 1245. [Google Scholar] [CrossRef]
- Avram, S.; Ontel, I.; Gheorghe, C.; Rodino, S.; Roșca, S. Applying a Complex Integrated Method for Mapping and Assessment of the Degraded Ecosystem Hotspots from Romania. Int. J. Environ. Res. Public Health 2021, 18, 11416. [Google Scholar] [CrossRef]
- Ganasri, B.P.; Ramesh, H. Assessment of soil erosion by RUSLE model using remote sensing and GIS—A case study of Nethravathi Basin. Geosci. Front. 2016, 7, 953–961. [Google Scholar] [CrossRef] [Green Version]
- Mitasova, H.; Hofierka, J.; Zlocha, M.; Iverson, L.R. Modelling topographic potential for erosion and deposition using GIS. Int. J. Geogr. Inf. Syst. 1996, 10, 629–641. [Google Scholar] [CrossRef]
- Panagos, P.; Borrelli, P.; Meusburger, K.; van der Zanden, E.H.; Poesen, J.; Alewell, C. Modelling the effect of support practices (P-factor) on the reduction of soil erosion by water at European scale. Environ. Sci. Policy 2015, 51, 23–34. [Google Scholar] [CrossRef]
- Bilașco, Ș.; Horvath, C.; Cocean, P.; Sorocovschi, V.; Oncu, M. Implementation of the usle model using gis techniques. Case study the Someşean plateau. Carpathian J. Earth Environ. Sci. 2009, 4, 123–132. [Google Scholar]
- Roșca, S.; Bilașco, Ș.; Fodorean, I.; Vescan, I.; Petrea, D.; Pacurar, I.; Rusu, R. Pedological Risks in Romania. Preliminary Analysis. Riscuri si Catastrofe 2020, 27, 33–45. [Google Scholar] [CrossRef]
- Bilașco, Ș.; Roșca, S.; Fodorean, I.; Vescan, I.; Filip, S.; Petrea, D. Quantitative evaluation of the risk induced by dominant geomorphological processes on different land uses, based on GIS spatial analysis models. Front. Earth Sci. 2018, 12, 311–324. [Google Scholar]
- CONCRET DESIGN PLUS SRL. Market Study on Average Values Recorded on the Real Estate Market in 2020, Valid for 2021, Elaborated by SC. Available online: http://www.unnpr.ro/files/expertize2021/CNPCluj/salaj_2021.pdf (accessed on 19 April 2021).
- Bilașco, Ş.; Roșca, S.; Păcurar, I.; Moldovan, N.; Boț, A.; Negrușier, C.; Sestras, P.; Bondrea, M.; Naș, S. Identification of Land Suitability for Agricultural Use by Applying Morphometric and Risk Parameters Based on GIS Spatial Analysis. Not. Bot. Horti Agrobot. Cluj-Napoca 2016, 44, 302–312. [Google Scholar] [CrossRef] [Green Version]
- Bilașco, Ș.; Roșca, S.; Păcurar, I.; Moldovan, N.; Vescan, I.; Fodorean, I.; Petrea, D. Roads accesibility to agricultural crops using gis technology. Methodol. Aproach Geogr. Tech. 2018, 13, 12–30. [Google Scholar] [CrossRef]


Publisher’s Note: MDPI stays neutral with regard to jurisdictional claims in published maps and institutional affiliations. |
© 2022 by the authors. Licensee MDPI, Basel, Switzerland. This article is an open access article distributed under the terms and conditions of the Creative Commons Attribution (CC BY) license (https://creativecommons.org/licenses/by/4.0/).
Share and Cite
Costea, A.; Bilasco, S.; Irimus, I.-A.; Rosca, S.; Vescan, I.; Fodorean, I.; Sestras, P. Evaluation of the Risk Induced by Soil Erosion on Land Use. Case Study: Guruslău Depression. Sustainability 2022, 14, 652. https://doi.org/10.3390/su14020652
Costea A, Bilasco S, Irimus I-A, Rosca S, Vescan I, Fodorean I, Sestras P. Evaluation of the Risk Induced by Soil Erosion on Land Use. Case Study: Guruslău Depression. Sustainability. 2022; 14(2):652. https://doi.org/10.3390/su14020652
Chicago/Turabian StyleCostea, Andreea, Stefan Bilasco, Ioan-Aurel Irimus, Sanda Rosca, Iuliu Vescan, Ioan Fodorean, and Paul Sestras. 2022. "Evaluation of the Risk Induced by Soil Erosion on Land Use. Case Study: Guruslău Depression" Sustainability 14, no. 2: 652. https://doi.org/10.3390/su14020652
APA StyleCostea, A., Bilasco, S., Irimus, I.-A., Rosca, S., Vescan, I., Fodorean, I., & Sestras, P. (2022). Evaluation of the Risk Induced by Soil Erosion on Land Use. Case Study: Guruslău Depression. Sustainability, 14(2), 652. https://doi.org/10.3390/su14020652