Article

Industrial Structure Upgrading, Green Total Factor Productivity and Carbon Emissions

1
School of Economics and Finance, Xi’an Jiaotong University, Xi’an 710061, China
2
Department of Academic Affairs, Xi’an University of Finance and Economics, Xi’an 710100, China
3
School of Economics and Management, Northwest University, Xi’an 710127, China
*
Author to whom correspondence should be addressed.
Sustainability 2022, 14(2), 1009; https://doi.org/10.3390/su14021009
Submission received: 16 November 2021 / Revised: 21 December 2021 / Accepted: 14 January 2022 / Published: 17 January 2022

Abstract

:
Carbon emission reduction is becoming a global issue. Methods of reducing carbon emissions in developing countries have become a hot topic of discussion. Based on the obvious structural transformation in developing countries, this paper discusses the logical mechanisms among industrial structure upgrading, green total factor productivity improvements, and carbon emission reduction. In addition, this paper empirically tests these relationships with provincial data from 2000 to 2017 in China. The conclusions are as follows: (1) industrial structure upgrades have a significant impact on carbon emissions. The industrial structure rationalization remains a noteworthy inhibition on carbon emissions. The industrial structure’s advancement has obvious features of development at the current stage, and its effect on carbon emissions shows an inverted “V” trend, which is initially accelerating but then restraining. (2) Upgrades to industrial structures will decrease carbon emissions by raising green total factor productivity. (3) The rise of green total factor productivity in a certain region will have a relatively obvious inhibitory effect on carbon emissions, but it will exhibit a negative spatial spillover effect on the adjacent areas.

1. Introduction

In the modern era, as China’s economy has shifted from quantitative growth to quality development, the transformation of the development mode has gradually become a macro path, restricting the high-quality development of China’s economy. Green development has become the key choice and inevitable trend of the high-quality development of China’s economy. At the general debate of the 75th Session of the United Nations General Assembly on 22 September 2020, President Xi Jinping announced that China would scale up its Nationally Determined Contributions by adopting more vigorous policies and measures, strive to peak CO2 emissions before 2030, and achieve carbon neutrality before 2060. China is taking pragmatic actions towards these goals. At the macro level, carbon peaking and carbon neutrality are the country’s strategic guidance; at the micro level, carbon peaking and carbon neutrality are also closely related to individuals’ well-being. At the middle level of industrial development, carbon peaking and carbon neutrality are inseparable from supporting the upgrade of industrial structures. In consideration of that, it is of theoretical and practical significance to connect the upgrading of industrial structure with carbon emissions. Simultaneously, how green productivity, a pivotal indication of green development, plays its role in the impact of industrial structure upgrades on carbon emissions is also worth discussing. Hence, this paper’s focus is on the influence mechanism of optimizing industrial structure’s acting on carbon emissions and the effect of green total factor productivity within it. In other words, the logical relations among upgrading industrial structures, green total factor productivity, and carbon emissions will be taken into account through a unified framework, and then the emerging market economy of China will serve as the object of empirical research in order to provide enlightenment for carbon emission reduction in developing countries.

2. Literature Review

From the existing literature concerning research on the influencing factors of carbon emissions, Han et al. (2017) studied the influencing factors of carbon emissions in major countries and found that the urbanization rate and the proportion of renewable energy have an important impact on carbon emissions. For developing countries such as China, economic growth has an important impact on carbon emissions. The impact of China’s per capita carbon emissions cannot be ignored [1]. Xu et al. (2006) found that the contribution rate of economic development to China’s per capita carbon emissions increased exponentially [2]. Based on the EKC model, Hu et al. (2008) studied the influencing factors of carbon emissions by using the decomposition method of evenly distributed margins and found a positive scale effect of economic scale on carbon emissions and a negative structural effect of industrial structure on carbon emissions. However, its absolute value is too small, which means that it has a limited effect on suppressing carbon emissions [3]. Lin and Liu (2010) found that per capita GDP, energy intensity, and the level of urbanization significantly affect carbon emissions based on the cointegration equation model [4]. Lu et al. (2013) used the LMDI-based “two-tier complete decomposition method” to decompose China’s carbon emissions from 1994 to 2008. The total development output value and industrial structure were the first and second contributing factors to carbon emissions, respectively [5]. Xu et al. (2014) analyzed the impact of energy consumption on carbon emissions and decomposed the carbon emissions of energy consumption into energy structure, energy intensity, industrial structure, economic output, and population-scale effect. The results showed that the main driving factor of carbon emissions is the economy: output effect, followed by population-scale effect and energy structure effect [6]. Recently, Zhang et al. (2019), using EKC and STIRPAT models, found that economic growth is the factor that has the greatest impact on China’s carbon emissions, followed by fossil fuel use, urban population, alternative energy and nuclear use, total population, service industries value-added, and total import and export [7]. Based on the STIRPAT model, Huo et al. (2020) systematically discussed the multiple impacts of urbanization on carbon emissions from the two dimensions of quantity and structure and believed that urbanization is an important factor leading to soaring carbon emissions [8]. Azeem et al. (2020) explored the impact of Nigeria’s gross domestic income, trade integration, FDI, GDP, and capital on carbon emissions, and the results showed that the increase in FDI, GDP, and capital reduced Nigeria’s carbon emissions [9]. Yang and Wei (2019) investigated the impact of FDI and R&D on carbon emission reduction through China’s inter-provincial panel data, however, the results showed that FDI has a negative impact on China’s carbon emissions, and R&D investment has significantly improved carbon emissions [10]. In summary, the existing research on the influencing factors of carbon emissions has shown that carbon emissions are mainly affected by factors such as economic growth, changes in energy structure, FDI, urbanization, and industrial structure.
Furthermore, examining the existing literature on the impact of industrial structure on carbon emissions, Zhang and Xue (2011) showed that the type of industrial structure directly determines carbon emissions. Emissions are positively correlated, and the development of the tertiary industry reduces carbon emissions [11]. Wang and Xiang (2014) built a dynamic input–output model for industrial structure adjustment and found that industrial structure adjustment can contribute up to about 60% to achieving China’s carbon intensity target [12]. Mi et al. (2015) used the input–output model to assess the potential impact of industrial structure on carbon dioxide emissions, and the results showed that industrial structure adjustment has significant potential for energy conservation and emission reduction [13]. Yuan et al. (2016) studied the impact of industrial structure on regional carbon emissions using data from multiple countries. The empirical results showed that, in the early stages of economic development, carbon emissions are mainly affected by secondary industry with higher energy intensity. When the economy develops to a certain stage, the service industry will gradually become the leading force influencing carbon emissions [14]. Wang et al. (2016) conducted an empirical study on the key factors affecting carbon intensity at the national level and at eight economic regional levels, and the results also showed that the proportion of secondary industry was significantly positively correlated with carbon emission intensity [15]. Recently, Tian et al. (2019) asserted that changes in the industrial structure will lead to significant differences in the industrialization stages and carbon emission patterns of various regions. Taking Southwest China as an example, regarding the impact of CO2 emissions, it was found that development and the diversification of competitive industries have different impacts on CO2 emissions trends [16]. Pang et al. (2020) used impulse response analysis and the forecast variance method to conduct empirical research on the relationship between carbon emissions, industrial structure, and environmental regulations in the Yangtze River Economic Zone. The results show that the industrial structure adjustment has a significant effect on carbon emission reduction, but there is an obvious hysteresis effect [17]. Zheng et al. (2020) believe that the impact of regional industrial structure differences on regional carbon emissions differences has temporal heterogeneity [18]. Wu et al. (2021) believe that the energy-dependent industries’ structure is positively correlated with carbon emissions; however, industrial production and industrial structure upgrades have a negative regulatory effect on the impact of the energy-dependent industrial structures and indirectly reduce carbon emissions [19].
In summary, research on the impact of the existing industrial structure on carbon emissions has shown that the industrial structure is a key factor affecting carbon emissions. However, the existing results take the industrial structure as a whole into consideration. There are relatively few studies on influencing carbon emissions from different dimensions of the industrial structure, and there is a lack of intermediate mechanisms on the different dimensions of the industrial structure influencing carbon emissions. Combining existing relevant literature, this paper will attempt to achieve the following marginal contribution: Firstly, after decomposing the contents of upgrading the industrial structure hierarchically, the impact of industrial upgrading on carbon emissions will be analyzed from its two dimensions, respectively. Secondly, specific mechanisms will be identified, that is, through the core concept of green total factor productivity, further research will be conducted on the intermediate mechanism of how the industrial structure’s optimization has an effect on carbon emissions. The third is to distinguish the time frames and summarize the basic trend of industrial development utilizing the industrial structures’ time sequence characteristics, which is followed by the time node partition according to the overall trend. Furthermore, we use a piecewise regression model to explore the stage differences during which industrial structure upgrading affects the carbon emissions. Based on this, this article builds a regression model to study the different effects of industrial structure advancement and industrial structure rationalization on carbon emissions. On this basis, green total factor productivity is introduced as an intermediary variable to measure the impact of green total factor productivity on industrial structure upgrading and carbon emissions. The mediation effect of green total factor productivity is investigated, and then an empirical analysis of the spatial spillover effect of green total factor productivity on carbon emissions is conducted.

3. Theoretical Hypothesis

This paper constructs a logical framework to discuss the mechanisms among industrial structure upgrading, green total factor productivity, and carbon emissions.

3.1. Impact Mechanism of Industrial Structure Upgrading on Carbon Emissions

Industrial structure upgrading is mainly explained by two indexes—industrial structure advancement and industrial structure rationalization. The industrial structure advancement refers to the process of transitioning from low-level to high-level industrial structure, that is, the process of gradual transformation of industrial structure from labor-intensive and capital-intensive to knowledge-intensive industries. This process has obvious phase characteristics. Therefore, the industrial structure upgrades concerning carbon emissions should also have obvious temporal heterogeneity.
Aiming at the time series characteristics of the industrial structure, this article specifically analyzes the proportions of the three industries in China from 2000 to 2020, as shown in Figure 1.
The results show that there are obvious phase differences in the structure of the three industries with 2012 as the time node. In 2012, the proportion of the tertiary industry surpassed that of the secondary industry for the first time, and the different labor productivity and growth characteristics of the three industries exhibit obvious phase differences in the level of industrial structure advancement, which will also have a phase effect on carbon emissions. Looking at the trajectory of China’s economic development, it can be found that China’s economy entered a new phase in 2012. Prior to this, China’s industrial structure was dominated by labor-intensive and capital-intensive industries. During this period, China’s economy achieved rapid growth while also placing tremendous pressure on the environment. Therefore, at this stage, there is a positive relationship between industrial structure advancement and carbon emissions, achieving sustained GDP growth at the cost of higher carbon emissions. Since entering this new phase, as China’s economic development preference has gradually tilted towards quality development, the industrial structure is beginning to be dominated by knowledge-intensive industries which have environmentally-friendly industrial characteristics. At this stage, the industrial structure’s advancement should have a restraining effect on carbon emissions. Industrial structure rationalization refers to the quality of aggregation between industries, i.e., it can be used as a measure of the degree of coupling between the input structure and output structure of the factor, and to a certain extent reflects the level of effective use of resources in the process of industrial development. The industrial structure rationalization can restrain carbon emissions by promoting the efficiency of resource allocation. Compared with industrial structure advancement, the impact of industrial structure rationalization on carbon emissions will ensure time consistency and effectively reduce regional carbon emissions in the long term.
Hypothesis 1.
Industrial structure upgrading will have a positive impact on carbon emissions. Among them, the impact of industrial structure advancement on carbon emissions has phase characteristics, and industrial structure rationalization’s impact on carbon emissions shows a continuous inhibitory effect.

3.2. Green Total Factor Productivity as an Intermediary Variable

Green total factor productivity is a measure of input–output efficiency incorporating environmental factors on the basis of total factor productivity. In general, total factor productivity can be used as a key indicator to measure resource utilization efficiency, and green total factor productivity can be used as a green efficiency indicator for resource utilization. With the upgrading of industrial structure, green total factor productivity will improve, which will reduce carbon emissions. The reasons for this are: On the one hand, from the perspective of industrial structure advancement, as the industrial structure transforms from labor-intensive and capital-intensive to knowledge-intensive, the negative externalities that affect the environment in the industrial development stage are gradually reduced. The process of industrial structure upgrading is accompanied by the process of green productivity improvement. Thus, industrial structure advancement has an inhibitory effect on carbon emissions through green total factor productivity. On the other hand, from the perspective of industrial structure rationalization, the rationalization of industrial structure can promote resource allocation efficiency, which is directly reflected in the improvement of green total factor productivity, and thus has a restraining effect on carbon emissions. Therefore, industrial structure rationalization also has a negative effect on carbon emissions through green totality factor productivity.
Hypothesis 2.
Upgrading the industrial structure can inhibit carbon emissions through green total factor productivity.

3.3. Spatial Spillover Effect of Green Total Factor Productivity on Carbon Emissions

Carbon emissions should have strong regional relevance considering their physical characteristics. The carbon emissions of a certain region will not only be affected by upgrading a region’s industrial structure and green total factor productivity, but also by the spillover effects of neighboring regions. Firstly, the green total factor productivity of a region should be obviously negatively correlated with the region’s carbon emissions. That is, the higher the green total factor productivity in this region, the higher the green efficiency of factor allocation in the production process, and the lower the carbon emission intensity. Secondly, from a spatial perspective, green total factor productivity may exhibit a negative spatial spillover effect, that is, the higher the green total factor productivity of a certain region, the higher the carbon emission intensity of neighboring region. It has been pointed out above that industrial structure upgrading has a positive impact on the improvement of green total factor productivity. However, the process of upgrading a certain region’s industrial structure often involves the transfer of industries to a neighboring region, which will lead to spatial changes in the environment. In other words, carbon emissions in this region are negatively affected by the improvement of green total factor productivity in neighboring regions, leading to the negative spatial spillover effect of green total factor productivity.
Hypothesis 3.
From a spatial perspective, green total factor productivity should have a significant spatial spillover effect on carbon emissions.
The relationship between industrial structural upgrading, green total productivity improvement and carbon emission reduction is shown in Figure 2.

4. Empirical Test

This article first selects the corresponding industrial structure upgrade, green total factor productivity, and carbon emission indicators for calculation, and further builds an econometric model based on the indicator calculation. The specific research is as follows.

4.1. Index Selection and Calculation

From the existing literature, it can be found that the selection of industrial structure upgrading indicators mainly considers the two dimensions of industrial structure advancement and industrial structure rationalization.
Industrial structure advancement is the flow of production factors and resources in the direction of high-productivity industries. There are two main contents for industrial structure advancement, namely, the increase in the proportion of high-productivity industries and the increase in the productivity of traditional industries. Therefore, this article refers to the indicators of industrial structure advancement constructed by Huang et al. (2013) [20], as shown in Equation (1).
H i t = j = 1 J S i j t × P i j t
In the above formula, i , j , t represent region, industry, and time, respectively, where i is 1–30, representing 30 provinces in China; j is 1, 2, 3, representing the primary industry, secondary industryand tertiary industry and t is 1–18, representing the years 2000–2017. Due to missing data, the observation area does not include Tibet, Hong Kong, Macau, and Taiwan. The same is true below. S i j t is the ratio of the added value of j industry in region i to the total value added at time t , and P i j t is the productivity index of industry j in region i at time t . According to the results of existing research, it can be found that the labor productivity, capital productivity, and total factor productivity can all be used as productivity indicators. We selected the labor productivity data as productivity indicators. Labor productivity is the ratio of the value-added of industry j to the number of employees. H i t is the sum of the product of the proportion of each industry and its labor productivity in region i at time t , which is the index of the industrial structure’s advancement.
Regarding the industrial structure rationalization, this mainly reflects the coordination between industries, that is, the difference between industries. The connotation of this index and the Theil index shows strong consistency. Therefore, this article refers to the design of the indicator of the industrial structure rationalization by Gan (2011) and uses the extended application of the Theil index to measure the industrial structure rationalization [21]. That is shown as Equation (2).
T L = j = 1 J ( Y j Y ) l n ( Y j L j / Y L )
where Y and L represent the output value and the number of employees, respectively, j represents industry, and TL is an indicator of industrial structure rationalization. When the industrial structure is in equilibrium, TL should approach 0; that is, the higher the level of industrial rationalization, the closer the TL is to 0. In the application process of specific indicators, to facilitate quantitative analysis, the absolute value of this indicator is often taken first followed by the reciprocal. At this time, the larger the TL, the higher the level of industrial rationalization in the region.
Therefore, the original data which are used for calculation of the industrial structure advancement and the industrial structure rationalization come from several sources, involving China Statistical Yearbook and the Statistical Yearbook and Statistical Bulletin of the provinces and regions in China over the years.
For measuring the green total factor productivity, this paper uses the SBM directional distance function, according to the Malmquist–Luenberger index (M–L index) [22], proposed by Chambers et al. Based on the Malmquist index [23], we use the classic SBM-ML index. Regarding GDP as the expected output, the undesired output is industrial wastewater, industrial waste gas, general industrial solid waste, and carbon emissions, and the input elements are fixed assets (perpetual inventory method) and the number of employees at the end of the year. The specific calculation process is as follows.
Assume that there are n inputs X = {x1, x2, ……, xn}, Q expected outputs Y = {y1, y2, ……, yn}, and L undesirable outputs B = {b1, b2, ……, bn} for each production decision unit, namely, region I = (1…I). Under the condition of alterable returns to scale, the non-radical and non-angular SBM directional distance functions containing the expected and undesirable outputs of i are:
D V t ( x i t ,   y i t ,   b i t ) = ρ ^ = m i n 1 [ 1 N n = 1 N s n x x n i ] 1 + [ 1 Q + L ( q = 1 Q s q y y q i + l = 1 L s l b b l i )
s . t . { i = 1 I z i t y i , q t s q y = y i , q t , q = 1 , 2 , , Q ; i = 1 I z i t x i , n t + s n x = x i , n t , n = 1 , 2 , , N ; i = 1 I z i t b i , l t + s l b = b i , l t , l = 1 , 2 , , L ; i = 1 I z i t = 1 , z i t 0 , s q y 0 , s n x 0 , s l b 0 , i = 1 , 2 , , I
Moreover, from an intertemporal perspective, set up the SBM-ML index with the adjacent reference (taking the production possibility sets of sequential year t and t + 1 as reference) as follows:
( SBM ML ) t t + 1 = [ D V t ( x t + 1 , y t + 1 , b t + 1 ) D V t ( x t , y t , b t ) × D V t + 1 ( x t + 1 , y t + 1 , b t + 1 ) D V t + 1 ( x t , y t , b t ) ] 1 2
= D V t + 1 ( x t + 1 , y t + 1 , b t + 1 ) D V t ( x t , y t , b t ) × [ D V t ( x t + 1 , y t + 1 , b t + 1 ) D V t + 1 ( x t + 1 , y t + 1 , b t + 1 ) × D V t ( x t , y t , b t ) D V t + 1 ( x t , y t , b t ) ] 1 / 2
According to the calculation mechanism of the ML index, it can be found that ML is a dynamic indicator. When ML > 1, the green total factor productivity has increased; when ML < 1, the green total factor productivity has decreased. Therefore, in the later calculation process, the initial value of the green total factor productivity (GTFP) in 2000 is set to 1, and the cumulative method is used to calculate the GTFP of each region in the current period. The original data in the GTFP indicators are from the China Energy Statistical Yearbook, Environmental Statistical Yearbook, National Statistical Yearbook and Provincial Statistical Yearbook, and the China Carbon Accounting Database (CEADs).

4.2. Model Construction and Variable Selection

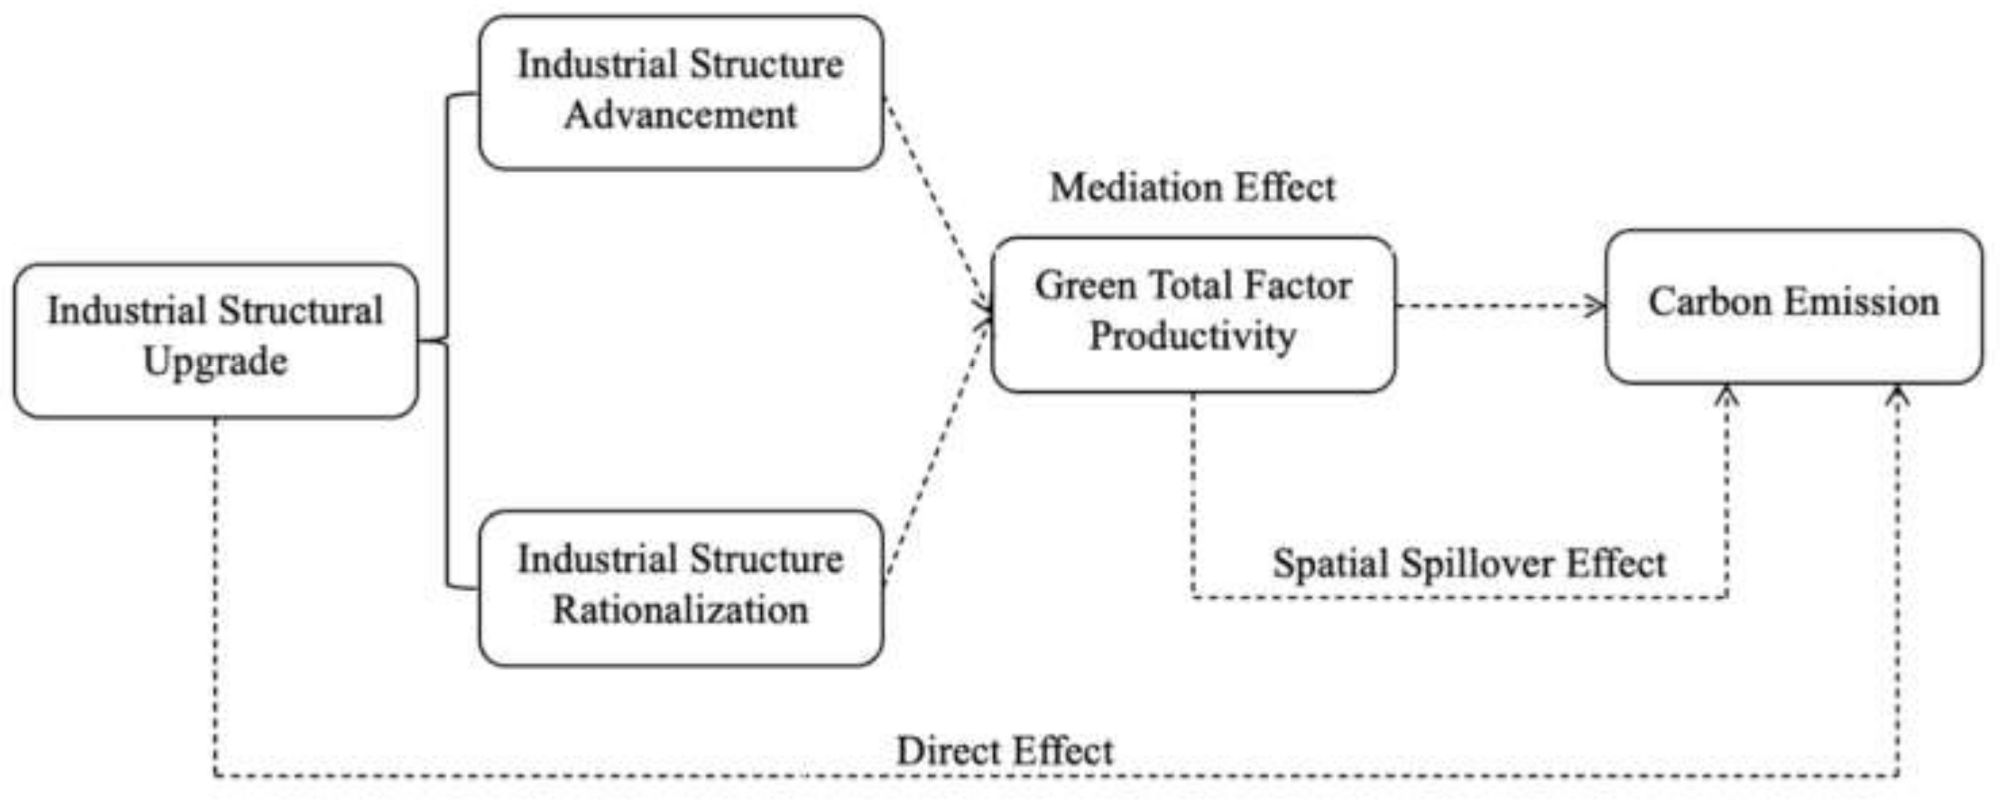
Based on the theoretical hypotheses, we further built an empirical mode. This paper focuses on the impact mechanism between industrial structure upgrading, green total factor productivity, and carbon emissions, and proposes three core propositions from three dimensions. They are the hypothesis of direct effects of industrial structure upgrading on the carbon emissions, the hypothesis of indirect effects of industrial structure upgrading through green total factor productivity on the carbon emissions, and the hypothesis of spatial spillover effect of green total factor productivity on carbon emissions. Therefore, we use the benchmark regression model, the intermediary regression model, and the spatial econometric model to conduct empirical tests on the theoretical propositions. Considering that the intermediary regression model includes benchmark regression testing, only the intermediary regression model and the spatial measurement model are constructed, and the regression result analysis will be divided into three theoretical propositions for testing.
Firstly, we built a model of the mediation effect wherein industrial structure upgrades affect carbon emissions through green total factor productivity. Refer to the mediation effect test model proposed by Wen (2004) [24], as in Equation (5). As shown, C is carbon dioxide emissions, H is the industrial structure advancement index, TL is the industrial structure rationalization index, GTFP is the green total factor productivity, and i and t represent different regions and time, respectively. Using the traditional method of successively testing regression coefficients [25], when the following two conditions are established, it is believed that the industrial structure upgrading affects carbon emissions through green total factor productivity: one is that industrial structure upgrading significantly affects carbon emissions, and the other is that industrial structure upgrading significantly affects the green total factor productivity, and green total factor productivity has a significant impact on carbon emissions. If this process is a completely intermediary process, that is, if green total factor productivity is added to the regression model of industrial structure upgrading on carbon emissions, the regression coefficient of industrial structure upgrading on carbon emissions is not significant. In the regression model of industrial structure upgrading on carbon emissions after adding green total factor productivity, the regression coefficient of industrial structure upgrading on carbon emissions is still significant, which is part of the mediating effect. From analyzing the model regression in Equation (5), the above conditions can be expressed as: ① α 1 , α 2 are significant; ② β 1 , β 2 , γ are significant. If both α 3 , α 4 are not significant, it is a complete mediation effect, and if either α 3 or α 4 are significant, it is a partial mediation effect.
C i t = α 1 H i t + α 2 T L i t + e 1
G T F P i t = β 1 H i t + β 2 T L i t + e 2
C i t = α 3 H i t + α 4 T L i t + γ G T F P i t + e 3
Secondly, construct the spatial spillover effect model of green total factor productivity on carbon emissions using the traditional binary adjacency space weight matrix W. A matrix element of 1 means adjacent, and a matrix element of 0 means non-adjacent. Refer to the classic spatial Dubin model (SDM) setting, as shown in Equation (6).
  C i t = λ 0 W C i t + λ 1 g t f p i t + λ 2 W g t f p i t + λ 3 Z i t + λ 4 W Z i t + υ
Compared with the Spatial Lag Model (SLM) and the Spatial Error Model (SEM), the Spatial Durbin Model (SDM) that includes exogenous interaction effects is, relatively, much better. The related studies, such as Greene (2005) [26] and LeSage (2009) [27], recommend the setting of the SDM. As carbon emissions also have obvious environmental externalities, so inter-regional interactions should have a strong spatial correlation, which means that the SDM can be used to empirically test the spatial spillover effects between GTFP and carbon emissions.
For the selection of control variable Z, based on the existing literature, the influencing factors of carbon emissions mainly include the following aspects: Guo (2011) [28] believes that the most important factor leading to the increase in China’s carbon emissions is economic growth, so the economic scale (GDP) is taken as the key control variable. Kaya (1989) [29] defined the main driving forces of carbon emissions as the four factors of population, per capita GDP, energy consumption per unit of GDP, and carbon emissions per unit of energy consumption. Combined with China’s development phase, Lin and Liu (2010) [4] make appropriate corrections to Kaya’s identities. Urbanization is introduced, and the population structure variable (urbanization level) is used to replace the total population variable. This article continues to use the previous thesis, selects the level of urbanization (the number of permanent population in the urban area/the number of total population) and people’s living standards (per capita GDP) as important control variables. Furthermore, considering the correlation between the carbon emissions and energy use, Wang et al. (2005) [30] believe that energy consumption structure has a significant inhibitory effect on carbon emissions, so energy consumption structure (total coal consumption/total energy consumption) can be used as an important control variable. In addition, the existing literature also shows that international trade has a significant impact on carbon emissions. Ning’s (2009) [31] research on the relationship between China’s carbon emissions and commodity exports from 1988 to 2007 shows that there is a clear co-integration relationship between international trade and carbon emissions. Therefore, this article also takes the economic structure (total import and export/GDP) as the control variable of the model.
In summary, the economic scale (GDP), the level of urbanization, energy consumption structure, economic structure, and people’s living standards are used as control variables in the regression model. The descriptive statistics of the indicators are shown in Table 1. The original data are from the Statistics Database of China Economic Information at https://db.cei.cn/ (accessed on 10 March 2021) and the China Energy Statistical Yearbook.

4.3. Empirical Results and Analysis

Through model construction and variable selection, we further conducted quantitative analysis on the panel data of various regions in China from 2000 to 2017, so as to obtain the effect path of industrial structure upgrading on carbon emissions.

4.3.1. Baseline Regression Analysis of the Impact of Industrial Structure Upgrading on Carbon Emissions

In order to facilitate analysis, the logarithm of the explained variables–carbon emissions was taken, then added to the baseline regression model. The regression results are shown in Table 2. Baseline regression results show that, whether it is a pooled regression model, a fixed-effects model, or a random-effects model, industrial structure advancement and rationalization have a significant impact on carbon emissions at the 1% significance level; however, the effect is in the opposite direction. Furthermore, it can be found, with the addition of control variables added to these regression models, that the significance and the direction of the coefficient are unchanged.
From the impact of industrial structure advancement and industrial structure rationalization on carbon emissions, according to the regression results, it can be found that the industrial structure advancement leads to an increase in regional carbon emissions, while the industrial structure rationalization has a restraining effect on carbon emissions. Considering the staged characteristics of the industrial structure advancement, according to the Petty–Clark theorem, the early stage of industrial development is mainly the evolution from the primary industry to the secondary industry. Since 2000, the industrial structure advancement of China has been mainly manifested as the upgrading of the primary industry to the secondary industry. Generally, the secondary industry often has higher fuel demand and energy consumption, resulting in relatively higher carbon emissions. Especially considering China’s traditional industrial development model, its characteristics of high energy consumption and high emissions are obvious [32]. Therefore, the initial improvement of the industrial structure advancement will significantly promote the carbon emission level. With the further improvement of industry advancement, that is, upgrading the industrial structure from secondary industry to tertiary industry, carbon emission will be reduced. Therefore, this is consistent with research concluding that the change in industrial structure is the key factor leading to the inverted “V” shaped change in carbon emissions [33].
In order to further analyze the carbon emissions influenced by different stages of industrial structure advancement, we take the obvious time node of China’s industrial structure transformation in 2012 as the boundary and conduct regression respectively in two different stages. The regression results are shown in Table 3 and Table 4.
The results of Table 3 and Table 4 show that the industrial structure advancement has obvious phase characteristics, and the impact on carbon emissions has an inverted “V” characteristic that first promotes and then inhibits, and the industrial structure rationalization always has a significant restraining effect on carbon emissions, which is to verify the first hypothesis from an empirical point of view. By further explaining this conclusion, we can find that since China’s industrial structure entered a new phase in 2012, the two dimensions of industrial structure upgrading have significantly inhibited carbon emissions. Although the regression coefficients of some models are not significant, from a comprehensive perspective, the regression results of multiple models show that both the improvement in industrial structure advancement and industrial structure rationalization will have a significant negative impact on carbon emissions. From the regression results of Table 3 and Table 4, since the content of industrial structure advancement during 2000–2011 was the transformation from primary industry to secondary industry—that is, the characteristics and development mode of secondary industry—industrial advancement significantly promotes carbon emissions before 2012, while the direction of regression coefficient changed significantly after 2012. All these prove the inverted “V”shaped impact of industrial structure on carbon emissions.

4.3.2. The Regression of the Mediation Effect Model of the Impact Path of Industrial Structure Upgrading on Carbon Emissions

The above baseline regression results meet the first condition that α 1 and α 2 are significant in the intermediary model. Based on the mediation effect model, to test the significance of β 1 , β 2 , and γ , we further build a regression model to test the impact of industrial structure upgrading on GTFP, and both industrial structure upgrading and GTFP were used as explanatory variables for regression carbon emissions. Taking into account the stage characteristics of China’s industrial economic development, in the mediation effect model and the subsequent econometric model, the period from 2012 to 2017 is taken as the observation period so that the panel data in this period are tested. The results of the mediation effect model are shown in Table 5.
From the results of Table 5, β 1 , β 2 , and γ coefficients are all significant at the 1% significance level; that is to say, industrial structure upgrading has an important impact on carbon emissions through the mediation effect of green total factor productivity, and thus Hypothesis 2 is verified. From the specific regression results, since 2012, both the industrial structure advancement and the industrial structure rationalization are significantly positive in the improvement of GTFP. Then, when the GTFP and industrial structure upgrading are combined into the regression model affecting carbon emissions, industrial structure upgrading can reduce carbon emissions through driving the increase in GTFP. Based on the regression results of the two dimensions of industrial structure upgrading, it can be found that α 3 is still significant. Industrial structure advancement has an inhibitory effect on carbon emissions through the partial mediation effect of GTFP. Since α 4 is not significant, the industrial structure rationalization can restrain carbon emissions through the complete mediation effect of GTFP.

4.3.3. Analysis of the Spatial Spillover Effect of Green Total Factor Productivity on Carbon Emissions

Based on the mediation model test, the spatial spillover effect of GTFP on carbon emissions is further considered. Firstly, the global Moran index is used to test the correlation of carbon emissions in various regions over different years. From Table 6, there is a significant spatial correlation in carbon emissions, and there is a strong positive correlation at the significance level of 5%. Secondly, the spatial Dubin model (SDM) is used to analyze the spatial spillover effects of GTFP on carbon emissions. We chose the SDM with fixed effects for testing and analysis.
Further, we decomposed the direct effect, indirect effect, and total effect of GTFP on carbon emissions. The direct effect refers to the influence of GTFP in each region on local carbon emissions, as well as the feedback effect including the influence of other regions which in turn affects the local region. For example, assuming there are two regions A and B, the direct effect of GTFP on carbon emissions includes both the impact of GTFP in region A on carbon emissions in region A and the feedback effect of GTFP in region A on carbon emissions in region A by influencing carbon emissions in region B. Indirect effects represent spatial spillover effects which are used to measure the impact of GTFP in neighboring regions on a certain region’s carbon emissions. The total effect is the sum of the direct effect and the indirect effect. The regression results are shown in Table 7.
From Table 7, the influence coefficient of GTFP on carbon emissions is significantly negative at the level of 1%. Every unit increase in GTFP reduces regional carbon emissions by 1.08%. Furthermore, there are negative spatial spillover effects; that is, if the GTFP increases by one unit in the neighboring region, the carbon emission will rise by 0.78% in the local region. Thus, Hypothesis 3 is verified empirically. The main reasons for this negative spatial spillover effect are as follows: according to the reality of upgrading China’s industrial structure, it is not difficult to find that some regions undertake international and domestic industrial transfer as an important path to realize the transformation of industrial structure [34], and the migration of some energy-intensive industries leads to the increase in carbon emissions in receiving areas. In other words, some regions have realized the improvement of green total factor productivity through the transfer of high input and high energy-consuming industries to neighboring regions, while neighboring regions have experienced the sharp increase in carbon emissions in the process of undertaking industrial transfer. This conclusion is supported by relevant studies. Cheng and Wei (2013) analyzed the characteristics of regional industrial transfer and carbon emission intensity in China and found that the energy intensity of the net transfer out of the region is decreasing, while the carbon emission intensity of the net transfer in the region is increasing [35]. The empirical research of Xiao et al. (2014) has shown that there are obvious problems of “carbon emission transfer” and “carbon leakage” in China’s regional industrial transfer [36]. Thus, in the process of industrial structure upgrading, industrial transfer will cause obvious environmental problems in the regions of industrial inflow and has a significant reduction effect on the carbon emission intensity in the regions of industrial outflow. This is exactly consistent with the negative spatial spillover effect of GTFP on carbon emissions. Some regions have promoted the level of their industrial structure through industrial transfer, thus improving green total factor productivity and reducing carbon emissions, while exacerbating the carbon emission problem of neighboring regions. In space, it presents a significant feature of beggar-thy-neighbor.

5. Conclusions

When carbon emission reduction becomes a global consensus, all countries will regard the facilitation of carbon emission reduction as their emphasis for future development. This paper focuses on the issue of carbon emission reduction, which starts from the view of industrial structure upgrading and discusses the logic of industrial structure upgrading improving carbon emission reduction through the promotion of green total factor productivity. Taking the data from China, the largest developing country, as an example, we empirically verify the aforesaid theoretical proposition. As a result, the following conclusions are drawn: (1) industrial structure upgrading will have a significant impact on carbon emissions. The industrial structure rationalization will maintain a noteworthy inhibition on carbon emissions. The industrial structure advancement has obvious features of development at the current stage, and its effect on carbon emission shows an inverted “V” trend, that is, firstly accelerating but then restraining. This is the reason why industrial structure advancement generally accompanies the transformation among the three industries. When the industrial structure is changing from primary to secondary industry, carbon emissions will increase, whereas after that carbon emissions will be apparently suppressed while secondary industry is transforming to the tertiary. (2) The upgrading of industrial structure will decrease carbon emissions by raising green total factor productivity. (3) The rise of green total factor productivity in a certain region will have a relatively obvious inhibitory effect on carbon emissions, but it will show a negative spatial spillover effect on the adjacent areas. Therefore, with respect to developing countries, we can take multiple measures utilizing various policies to boost the optimizing of domestic industrial structure so that the goal of carbon emission reduction will be achieved. After promoting green productivity through the structural upgrading effect, the engineering of the “green gene” must be realized in the productive process to cut down on carbon emissions with green production.
Admittedly, there are still some limitations in this research. Although the paper discusses the logical relationship among industrial structure upgrading, green total factor productivity, and carbon emissions, yet more factors should be taken into consideration. Meanwhile, more meaningful comparative research between developing countries should be scrutinized in order that the relevant theoretical conclusions will be verified more conclusively.

Author Contributions

Conceptualization, Y.Y.; methodology, J.W.; software, X.G.; validation, X.W., Y.Y. and J.W.; formal analysis, Y.Y.; data curation, X.G.; writing—original draft preparation, Y.Y. and J.W.; writing—review and editing, J.W.; visualization, X.W.; supervision, X.G.; project administration, Y.Y.; funding acquisition, J.W. All authors have read and agreed to the published version of the manuscript.

Funding

This research was funded by the National Natural Science Foundation of China (Nos. 7210040759, No. 71804146), the National Social Science Foundation of China (Nos. 19BJY177), General Special Scientific Research Project of Shaanxi Department of Education (Nos. 21JK0138), and the Scientific Research Support Program of Xi’an University of Finance and Economics (Nos. 21FCJH001).

Institutional Review Board Statement

No applicable.

Informed Consent Statement

Informed consent was obtained from all subjects involved in the study.

Data Availability Statement

The series data are mainly from China Statistics Yearbook, China Statistical Yearbook on Environment, China Statistical Yearbook on Energy, Statistics Database of China Economic Information, Chinese Research Data Services Platform (CNRDS), China Carbon Accounting Database (CEADs)and some scholars’ research reports in China.

Conflicts of Interest

The authors declare no conflict of interest. The funders had no role in the design of the study; in the collection, analyses, or interpretation of data; in the writing of the manuscript, or in the decision to publish the results.

References

  1. Han, M.; Liu, W.; Tang, Z.; Xia, Y. Carbon emission impact factor analysis of major countries based on varying coefficient panel modeling. Resour. Sci. 2017, 39, 2420–2429. [Google Scholar]
  2. Xu, Q.; Liu, Z.; Jiang, Z. Decomposition model and empirical study of carbon emissions for China, 1995–2004. China Popul. Resour. Environ. 2006, 6, 158–161. [Google Scholar]
  3. Hu, C.; Huang, X.; Zhong, T.; Tan, D. Character of carbon emission in China and its dynamic development analysis. China Popul. Resour. Environ. 2008, 3, 38–42. [Google Scholar]
  4. Lin, B.; Liu, X. China’s carbon dioxide emissions under the urbanization process: Influence factors and abatement policies. Econ. Res. J. 2010, 45, 66–78. [Google Scholar]
  5. Lu, W.; Chou, T.; Du, L. A study on influence factors of carbon emissions under different economic growth stages in China. Econ. Res. J. 2013, 48, 106–118. [Google Scholar]
  6. Xu, S.; He, Z.; Long, R. Factors that influence carbon emissions due to energy consumption in China: Decomposition analysis using LMDI. Appl. Energy 2014, 127, 182–193. [Google Scholar] [CrossRef]
  7. Zhang, Q.; Zhang, Y.; Pan, B. Analysis of factors affecting China’s economic growth and carbon emissions during the 40 years of reform and opening. J. Arid. Land Resour. Environ. 2019, 33, 9–13. [Google Scholar]
  8. Huo, T.; Li, X.; Cai, W.; Zuo, J.; Jia, F.; Wei, H. Exploring the impact of urbanization on urban building carbon emissions in China: Evidence from a provincial panel data model. Sustain. Cities Soc. 2020, 56, 102068. [Google Scholar] [CrossRef]
  9. Oluwaseyi, Z.A.; Abdul-Rahim, A.S.; Madina, D.A. Does gross domestic income, trade integration, FDI inflows, GDP, and capital reduces CO2 emissions? An empirical evidence from Nigeria. Curr. Res. Environ. Sustain. 2020, 2, 100009. [Google Scholar]
  10. Yang, Y.; Wei, X. Impact of FDI and R&D on China’s industrial CO2 emissions reduction and trend prediction. Atmos. Pollut. Res. 2019, 10, 1627–1635. [Google Scholar]
  11. Zhang, Z.; Xue, Q. Low-carbon economy, industrial structure and changes in China’s development mode based on the data of 1996–2009 in empirical analysis. Energy Procedia 2011, 5, 2025–2029. [Google Scholar]
  12. Wang, W.; Xiang, W. Adjustment of industrial structure and the potential assessment of energy saving and carbon reduction. China Ind. Econ. 2014, 1, 44–56. [Google Scholar]
  13. Mi, Z.; Pan, S.; Yu, H.; Wei, Y. Potential impacts of industrial structure on energy consumption and CO2 emission: A case study of Beijing. J. Clean. Prod. 2015, 103, 455–462. [Google Scholar] [CrossRef] [Green Version]
  14. Yuan, Y.; Xi, Q.; Sun, T.; Li, G. The impact of the industrial structure on regional carbon emission: Empirical evidence across countries. Geogr. Res. 2016, 35, 82–94. [Google Scholar]
  15. Wang, Z.; Zhang, B.; Liu, T. Empirical analysis on the factors influencing national and regional carbon intensity in China. Renew. Sustain. Energy Rev. 2016, 55, 34–42. [Google Scholar] [CrossRef]
  16. Tian, X.; Bai, F.; Jia, J.; Liu, Y.; Shi, F. Realizing low-carbon development in a developing and industrializing region: Impacts of industrial structure change on CO2 emissions in southwest China. J. Environ. Manag. 2019, 233, 728–738. [Google Scholar] [CrossRef]
  17. Pang, Q.; Zhou, W.; Yang, T. Research on the influence mechanism of carbon emission, industrial structure and environmental regulation in the Yangtze river economic belt. J. Ind. Technol. Econ. 2020, 39, 141–150. [Google Scholar]
  18. Zheng, H.; Gao, X.; Sun, Q.; Han, X.; Wang, Z. The impact of regional industrial structure differences on carbon emission differences in China: An evolutionary perspective. J. Clean. Prod. 2020, 257, 120506. [Google Scholar] [CrossRef]
  19. Wu, L.; Sun, L.; Qi, P.; Ren, X.; Sun, X. Energy endowment, industrial structure upgrading, and CO2 emissions in China: Revisiting resource curse in the context of carbon emissions. Resour. Policy 2021, 74, 102329. [Google Scholar] [CrossRef]
  20. Huang, L.; An, Y.; Liu, S. Industrial structure change in China: Measures based on three different dimensions. China Ind. Econ. 2013, 10, 70–82. [Google Scholar]
  21. Gan, C.; Zheng, R.; Yu, D. An empirical study on the effects of industrial structure on economic growth and fluctuations in China. Econ. Res. J. 2011, 5, 4–16. [Google Scholar]
  22. Malmquist, S. Index numbers and indifference surfaces. Trab. Estad. 1953, 4, 209–242. [Google Scholar] [CrossRef]
  23. Chambers, R.G.; Chung, Y.; Färe, R. Benefit and distance functions. J. Econ. Theory 1996, 70, 407–419. [Google Scholar] [CrossRef]
  24. Wen, Z.; Zhang, L.; Hou, J.; Liu, H. Testing and application of the mediating effects. Acta Psychol. Sinica 2004, 5, 614–620. [Google Scholar]
  25. Baron, R.M.; Kenny, D.A. The moderator-mediator variable distinction in social psychological research: Conceptual, strategic and statistical considerations. J. Personal. Soc. Psychol. 1987, 51, 1173. [Google Scholar] [CrossRef]
  26. Greene, W.H. Econometric Analysis, 6th ed.; Prentice Hall: Englewood Cliffs, NJ, USA, 2008. [Google Scholar]
  27. LeSage, J.; Pace, R.K. Introduction to Spatial Econometrics; CRC Press: Boca Raton, FL, USA, 2009. [Google Scholar]
  28. Guo, C. The factor decomposition on carbon emission of China: Based on LMDI decomposition Technology. Chin. Popul. Resour. Environ. 2011, 9, 42–47. [Google Scholar]
  29. Kaya, Y. Impact of Carbon Dioxide Emission on GNP Growth: Interpretation of Proposed Scenarios; Working Paper; IPCC Energy and Industry Subgroup: Paris, France, 1989. [Google Scholar]
  30. Wang, C.; Chen, J.; Zou, J. Decomposition of energy-related CO2 emission in China 1957–2000. Energy 2005, 30, 73–83. [Google Scholar] [CrossRef]
  31. Ning, X. A Survey on interrelationship between carbon emission and exports in China. Ecol. Econ. 2009, 11, 51–54, 96. [Google Scholar]
  32. Chen, S. Energy consumption, CO2 emission and sustainable development in Chinese industry. Econ. Res. J. 2009, 44, 41–55. [Google Scholar]
  33. Stefanski, R.L. Essays on Structural Transformation in International Economics. Ph.D. Thesis, University of Minnesota, Minneapolis, MN, USA, 2009. [Google Scholar]
  34. Shi, E.; Wang, N. Financial development, industrial transfer and industrial upgrading in the Midwest. Nankai Econ. Stud. 2018, 6, 3–19. [Google Scholar]
  35. Cheng, A.; Wei, H. Target design on carbon reduction of promoting regional industrial transfer orderly and coordinated development. China Popul. Resour. Environ. 2013, 23, 55–62. [Google Scholar]
  36. Xiao, Y.; Wan, Z.; Liu, H. An empirical study of carbon emission transfer and carbon leakage in regional industrial transfer in China: Analysis based on inter-regional input-output model in 2002 and 2007. J. Financ. Econ. 2014, 40, 75–84. [Google Scholar]
Figure 1. The composition of China’s three industries from 2000 to 2020.
Sustainability 14 01009 g001
Figure 2. Logical analysis diagram of industrial structure upgrading, green total factor productivity, and carbon.
Sustainability 14 01009 g002
Table 1. Descriptive statistical results of basic indicators.
VariableObsMeanStd. Dev.MinMax
Carbon emission5405.1780.993−0.2117.347
Industrial structure advancement index540704.602448.490111.1822476.768
Industrial structure rationalization index5400.0690.0780.0110.560
Green total factor productivity5401.3010.2870.8883.515
Economic scale54012,850.97714,078.904263.6891,648.727
Economic structure5400.3130.3550.0121.664
The level of urbanization5400.4850.1630.1490.898
People’s living standards54029,304.12923,250.022275913,7596
Energy consumption structure5400.4520.1540.0440.8023
Table 2. Baseline regression results from 2000 to 2017.
Model SelectionPooled OLSFixed EffectRandom EffectPooled OLSFixed EffectRandom Effect
VariableslnClnClnClnClnClnC
H0.001295 ***0.001254 ***0.001257 ***0.001090 ***0.000485 ***0.000475 ***
(0.000104)(0.000060)(0.000060)(0.000163)(0.000140)(0.000147)
TL−4.931448 ***−2.917503 ***−3.078133 ***−2.179669 ***−1.472259 ***−1.615485 ***
(0.599203)(0.609991)(0.591491)(0.654691)(0.556312)(0.581788)
GDP 0.000007 **0.000007 **−0.000002
(0.000004)(0.000003)(0.000003)
Economic structure 0.1250540.335442 **0.089471
(0.161135)(0.162774)(0.151561)
Urbanization 2.340224 ***0.677264 *0.251228
(0.337468)(0.365403)(0.352833)
GDP per capita 0.000011 **0.000015 ***0.000016 ***
(0.000005)(0.000004)(0.000004)
Energy consumption structure 2.119748 ***2.190751 ***2.091948 ***
(0.206608)(0.172419)(0.178735)
Constant4.606597 ***4.496339 ***4.504772 ***4.823710 ***5.462517 ***5.521365 ***
(0.070220)(0.046698)(0.150850)(0.209534)(0.188298)(0.210723)
Control variableNoNoNoYesYesYes
Observations540540540540540540
Number of id303030303030
Note: *, **, *** represent significance at the levels of 0.1, 0.05, 0.01, respectively, and the estimated robust standard deviations are in parentheses.
Table 3. Baseline regression results from 2000 to 2011.
Model SelectionPooled OLSFixed EffectRandom Effect
VariableslnClnClnC
H0.002225 ***0.001650 ***0.001815 ***
(0.000404)(0.000291)(0.000311)
TL−1.307804−2.396176 ***−2.899614 ***
(1.378575)(0.767587)(0.830951)
Constant4.061434 ***4.998202 ***5.272104 ***
(0.250518)(0.196270)(0.229208)
Control variableYesYesYes
Observations360360360
Number of id303030
Note: *** represent significance at the levels of 0.01, and the estimated robust standard deviations are in parentheses.
Table 4. Baseline regression results from 2012 to 2017.
Model SelectionPooled OLSFixed EffectRandom Effect
VariableslnClnClnC
H−0.000501 ***−0.000623 ***−0.000619 ***
(0.000177)(0.000196)(0.000184)
TL−0.993158 *−0.526402−1.155656 **
(0.573237)(0.616634)(0.568300)
Constant4.703085 ***4.273137 ***4.774951 ***
(0.361249)(0.500818)(0.412423)
Control variableYesYesYes
Observations180180180
Number of id303030
Note: *, **, *** represent significance at the levels of 0.1, 0.05, 0.01, respectively, and the estimated robust standard deviations are in parentheses.
Table 5. Regression results of the mediation effect model from 2012 to 2017.
VariablesPooled RegressionFixed EffectRandom EffectPooled RegressionFixed EffectRandom Effect
GTFPGTFPGTFPInCInCInC
GTFP −0.521645 ***−0.455850 ***−0.487843 ***
(0.149472)(0.164572)(0.153880)
H0.000250 ***0.000294 ***0.000284 ***−0.000352 **−0.000489 **−0.000461 **
(0.000087)(0.000099)(0.000090)(0.000177)(0.000198)(0.000186)
TL1.549598 ***1.190544 ***1.629196 ***−0.2254310.016307−0.380442
(0.288749)(0.311514)(0.284416)(0.600927)(0.633317)(0.608749)
GDP−0.000004 **−0.000001−0.000004 **0.000009 ***0.0000040.000009 ***
(0.000002)(0.000002)(0.000002)(0.000003)(0.000004)(0.000003)
Economic structure0.1009520.256096 **0.1509820.2978630.1260380.284935
(0.088976)(0.125644)(0.106841)(0.183908)(0.246536)(0.219325)
Urbanization−1.903117 ***−3.747518 ***−2.097404 ***0.0714050.749455−0.022065
(0.307743)(0.458260)(0.360376)(0.673809)(1.079477)(0.828470)
GDP per capita0.000010 ***0.000007 ***0.000010 ***0.000009 **0.000011 ***0.000008 **
(0.000002)(0.000002)(0.000002)(0.000004)(0.000004)(0.000004)
Energy consumption structure−0.531910 ***−0.606607 ***−0.614957 ***0.610827 **0.3894390.766847 **
(0.149589)(0.152433)(0.150809)(0.299850)(0.311147)(0.309779)
Constant1.928274 ***2.962087 ***2.014086 ***5.794403 ***5.623405 ***5.862116 ***
(0.175258)(0.253006)(0.191429)(0.469936)(0.690569)(0.526667)
Observations180180180180180180
Number of id303030303030
Note: **, and *** represent significance at the levels of 0.05, and 0.01, respectively, and the estimated robust standard deviations are in parentheses.
Table 6. Global Moran index.
YearsIE (I)Sd (I)zp-Value
20000.203−0.0340.1082.2050.027
20010.233−0.0340.1082.4730.013
20020.245−0.0340.1082.5910.01
20030.241−0.0340.1082.5580.011
20040.245−0.0340.1072.6190.009
20050.261−0.0340.1042.8470.004
20060.225−0.0340.1022.5440.011
20070.208−0.0340.1032.3660.018
20080.221−0.0340.1052.4410.015
20090.246−0.0340.1052.6620.008
20100.274−0.0340.1072.8810.004
20110.288−0.0340.1082.9770.003
20120.273−0.0340.1082.8580.004
20130.28−0.0340.13.1560.002
20140.251−0.0340.0992.890.004
20150.243−0.0340.1012.750.006
20160.226−0.0340.1022.5580.011
20170.215−0.0340.1012.4820.013
Table 7. Decomposition table of influence effect of SDM.
lnCCoef.Std. Err.zp-Value > |z|95% Conf.Interval
Direct effectGTFP−1.0822170.120840−8.960.000−1.319060−0.845375
GDP−0.0000090.000003−2.910.004−0.000015−0.000003
Economic structure−0.1803120.141615−1.270.203−0.4578710.097248
Urbanization−0.1715370.328087−0.520.601−0.8145740.471501
GDP per capita0.0000080.0000032.570.0100.0000020.000014
Energy consumption structure−2.2751370.170545−13.340.000−2.609399−1.940874
Indirect effectGTFP0.7787160.2641842.950.0030.2609261.296507
GDP0.0000110.0000061.770.077−0.0000010.000023
Economic structure0.4961130.2948571.680.092−0.0817961.074022
Urbanization−1.4591680.564340−2.590.010−2.565254−0.353082
GDP per capita−0.0000110.000006−1.680.094−0.0000240.000002
Energy consumption structure0.7508200.4525681.660.097−0.1361961.637837
Total effectGTFP−0.3035010.296076−1.030.305−0.8837990.276798
GDP0.0000020.0000060.350.723−0.0000100.000014
Economic structure0.3158010.3538810.890.372−0.3777921.009395
Urbanization−1.6307050.670859−2.430.015−2.945564−0.315845
GDP per capita−0.0000030.000008−0.420.674−0.0000180.000012
Energy consumption structure−1.5243160.549036−2.780.005−2.600407−0.448225
Publisher’s Note: MDPI stays neutral with regard to jurisdictional claims in published maps and institutional affiliations.

