Article

Optimal Scheduling of Hybrid Sustainable Energy Microgrid: A Case Study for a Resort in Sokhna, Egypt

by
Ashraf K. Abdelaal
1,
Elshahat F. Mohamed
2 and
Attia A. El-Fergany
3,*
1
Electrical Power and Machines Department, Faculty of Technology, Suez University, Suez 43512, Egypt
2
Mechanical Power Engineering Department, Faculty of Engineering, Zagazig University, Zagazig 44519, Egypt
3
Electrical Power and Machines Engineering Department, Faculty of Engineering, Zagazig University, Zagazig 44519, Egypt
*
Author to whom correspondence should be addressed.
Sustainability 2022, 14(19), 12948; https://doi.org/10.3390/su141912948
Submission received: 23 September 2022 / Revised: 6 October 2022 / Accepted: 7 October 2022 / Published: 10 October 2022
(This article belongs to the Special Issue Sustainability of Distributed Generation through Virtual Power Plant)

Abstract

:
This paper is focused on analyzing, investigating, and designing a hybrid energy system based on sustainable or renewable resources, namely solar and wind energy, in addition to using a diesel generator and battery storage to supply a small resort in Suez, Egypt. The resort is located in Sokhna, which is on the Suez gulf and is about 50 km from the Suez governorate and 100 km from Cairo, Egypt. The Sokhna coast has plenty of high solar radiation and wind energy all year. At the same time, the Egyptian government is building many wind and photovoltaic projects there. Thus, it is expected that it will be very economic to use solar and wind energy in that area to supply the resort. The optimal combinations of energy resources to meet the load demand under various scenarios are considered. The optimal mix of sources is investigated with and without the presence of the grid. The cropped outcomes show that the hybrid energy system, which is also in the presence of the grid, is a very economical solution that provides the resort with an acceptable energy cost. The cost of energies (CoEs) is equal to 0.0441 and 0.0443 $/kWh for cases 2 and 4 (with grid), respectively. However, the CoEs are equal to 0.141 and 0.134 $/kWh for cases 1 and 3 (without grid), respectively.

1. Introduction

Extensive human use of fossil fuels has led to a huge rise in carbon dioxide (CO2) emissions and thus there is global concern about CO2 emissions due to its harmful effects [1]. To stop, or at least to reduce, CO2 emissions rising and to relieve climate change, there is a strong need to replace fossil fuels with clean energy sources, such as renewable energy sources for electricity production. The last decade saw a promising enhancement in both wind and solar energy sources [2,3]. From 2010 to 2020, the capacity of renewable power generation worldwide increased by a factor of 3.7 [4]. For example, from 2019 to 2020, the new worldwide added capacity of solar energy was 261 GW and the worldwide added capacity of wind energy was 76 GW [4,5]. From 2019 to 2020, the total added capacity of renewable energy in China, the world’s first market for renewables, was 136 GW, including 72 GW of wind and 49 GW of solar [6]. In the United States of America, the world’s second largest market, the added capacity was 29 GW of sustainable energy, including 15 GW of solar and 14 GW of wind [6]. As a result of this huge added installed capacity, the cost of renewable energy greatly reduced. The reduction from utility solar photovoltaic (PV) decreased by 85% from 0.381 $/kWh in 2010 to 0.057 $/kWh in 2020. At the same time, the concentrating solar power (CSP) decreased by 68%, from 0.34 USA $/kWh in 2010, to 0.108 $/kWh in 2020 [4]. However, the price of onshore wind energy was reduced by 56%, from 0.089 $/kWh in 2010, to only 0.039 $/kWh in 2020, and the price of offshore wind energy was reduced by 48%, from 0.162 $/kWh in 2010, to 0.084 $/kWh in 2020 [4]. Thus, the average price of onshore wind energy in 2020 was 0.039 $/kWh and the utility-scale solar PV was 0.057 $/kWh [4]. From an installed capacity point of view, the average total installed cost of solar PV dropped by 81% from 2010 to 2020. In other words, it dropped from 4731 $/kW in 2010, to just 883 $/kW in 2020, and onshore wind farms declined from 1971 $/kW in 2010 to 1355 $/kW in 2020 [4]. As a result of these reductions in the costs of installed capacity, the cost of energy (CoE) generated from the sources of sustainable energy came closer to the cost of traditional fuels, and these energy sources were very competitive with fossil fuels, which had an average cost of 0.076 $/kWh [4]. Additionally, there was significant progress in solar cell manufacturing materials, namely the emergence of the perovskite solar cell, which has a much lower cost price and high efficiency [7].
This paper investigates and analyzes the application of renewable energy (namely PV and onshore wind) to supply the power demand of a coastal resort in the Gulf of Suez, Egypt. The resort has 25 villas, and the total demand is 300 kW. The project is located in the Sokhna area, which is a coastal area on the Gulf of Suez, approximately 50 km from Suez and 100 km from Cairo. Its coordinates are 29.589° N and 32.336° E [8]. Sokhna weather is hot and sunny throughout the year, with average temperatures of 29.2 to 38 degrees Celsius [9]. The high temperature falls between June and October, and it is mild from October to June. Sokhna has both a high level of solar radiation and moderate wind speed, which means that it can be considered for building renewable energy plants, which will be very economical. The area already has a large wind energy power plant in it and the government is planning to build new solar power plants.
The available sources used for the suggested microgrid are wind energy, solar PV, a diesel generator, and battery storage. These sources are used to meet the load requirements. The resort should have a reliable electric source throughout the year. The optimal mix of energy resources with and without the grid is considered in various cases.
The organization of this paper as follows: Section 2 provides a full description of the hybrid microgrid, which includes the basic principle and equations of PV energy, the operation of wind energy, and some notes on the storage techniques available. Section 3 explains some economic terms used and the optimization. The Section 4 provides the results under various anticipated cases and the optimal mix of renewable energy resources are cropped. Finally, concluding remarks are recapped in Section 5.

2. Description of the Hybrid Microgrid

This section provides short notes about the different components in the system. This section starts with solar energy and the PV cell model, which passes through a wind energy turbine, and ends with notes concerning storage.

2.1. Solar Energy

Sun is the principle available energy source that supplies the Earth with most of its energy and can be utilized to generate electrical energy [10,11]. This is because the Earth has a high amount of solar radiation from the sun daily. This makes it a very attractive source to generate electricity. With the help of advanced emerging techniques, the world has to tackle these sources in a superior, smoother, and more cost-effective way, thus resulting in lower installation costs. Lower costs attract more attention to solar energy, and it is expected to be the wildest expanding source of sustainable energy in the near future [12]. Solar energy can be harnessed in many ways, for example, water can be heated using direct sun radiation in domestic applications. Utilities solar energy can be converted into electrical energy in two ways: First, by using PV systems [13] and second by thermal power systems or CSP [14]. CSP systems use reflectors, and at the same time, use sun follower systems to track the sun to concentrate the sun rays on a specific point. As a result, sun energy is converted into heat [15]. Then, the generated heat is utilized to create steam, which drives a turbine to generate electrical power. However, a PV system is composed of one or more solar panels, and creates an electric current through a process called the PV effect [16].
As mentioned previously, the average cost of a PV system was 883 $/kW in 2020, with an energy cost of 0.057 $/kWh [5]. The lowest price in the Middle East is approximately 0.03 $/kWh [17]. The world’s total PV utilized capacity was 714 GW in 2020 [6].
The PV cell can be modeled, as shown in Figure 1. This model can be represented by the cell equations, as explained later in this paper [18,19,20,21].
When sunlight hits the cell, the light photons excite some of the electrons in the semiconductors, resulting in electron–hole pairs that lead to the flow of an electric current. Thus, the effects of sunlight on the cell are equivalent to a current source. The value of this current source ( I p h ) is proportional to the sun’s radiating intensity (G). As shown in Figure 1, the output current (I) produced by the solar cell is calculated using Kirchhoff’s current law, as expressed in Equation (1).
I = I p h I D I S H
If the terminal voltage at the cell ends is denoted as V, then the voltage at the diode terminal V D is
V D = V + I   R s
where R s represents the internal series resistance of the PV cell.
Using the Shockley diode equation, the current of the diode ( I D )  is:
I D = I s   [   e ( q V D n K T ) 1 ]
where IS represents the saturation current and n represents the ideality factor of the cell (equal to one for ideal cell). This is an indicator of the recombination mechanisms the rule inside the diode. K is the Boltzmann constant, q is the electron charge, and T is the room operating temperature in kelvin.
Using Ohm’s law, and from Figure 1, the shunt current ISH flowing in the resistor RSH is:
I S H = V D R S H = V + I   R s R S H
The constant R S H represents the shunt resistance of the PV cell. Replacing the above-mentioned currents with their values in Equation (1) results in the output current of the PV cell in terms of the output voltage and the parameters of the PV cell:
I = N P   I p h N P I s   [ e ( q V D N S   n k T ) 1 ]   ( V + I   R s R S H )
I s = I R S   ( T T r ) 3   e q × E g o n K   ( 1 T r 1 T )
where I p h is the photocurrent generated by solar radiation G, E g o defines the energy band gap (1.12 eV for silicon), I R S is the reverse current of the diode, N S and N P are the number of cells connected in the cascade and in parallel, and T r is the nominal temperature in K.
There are two important parameters of a PV cell, namely the voltage at the open circuit ( V O C ) and the current at the short circuit ( I s c ) . Since the value of the shunt resistance is very high, its value is neglected in Equation (5). The V O C can be calculated as:
V O C   n k T q ln   ( I p h I s + 1 )
In the same way, if the terminals of the PV cell are short circuit, then the output voltage V is equal to zero. The flowing output current in this case is named the short circuit current. In the case of using a high-quality PV cell, the value of both R s and I s are low and can be neglected. At the same time, the value of RSH is very high and can also be neglected. The result is a very simple equation of the short circuit current, which is represented as:
I s c I p h
Since the output power P (P = VI) is zero at either V or I is equal to zero, the output power of the PV cell is zero in the open circuit or short circuit states.
Solar panels require low maintenance and must be cleaned two times a year to remove any dirt that could be present. The PV panels are considered to have a depreciation factor of 85% and an estimated lifetime of 20 years.

2.2. Wind Energy

As stated in the first part of this paper, the average cost of onshore wind is 0.039 $/kWh, which is the lowest among all renewable energies. In 2020, the average installation cost of one KW of onshore wind fluctuated between 1038 $/kW in India, to a high value of 3189 $/kW [4]. The weighted-average installed costs of utility-scale onshore wind energy was 150% of that of a solar PV. The average costs of offshore wind energy fell from 4706 $/kW in 2010 to 3185 $/kW in 2020. In other words, the costs were reduced by 32% in one decade [4].
Wind kinetic energy can be converted into electrical energy using wind turbines. The electrical power extracted by the wind turbine, PW, is represented as follows [22]:
P w = 0.5   ρ   C p ( λ ,   β ) A w   V w 3
where ρ is the density of air in kg/m3, A w defines the swept area by the blades of the rotor in m2, and V w   is the wind speed in m/s, C p . The wind turbine power coefficient and β denote the pitch angle.
The value of C p is a function of the ratio of the speed of the blades and the wind speed. This ratio is known as the tip speed ratio λ and is defined in Equation (10) [22]:
λ = ω . R V w  
The constant R represents the length of the radius of the swept area by the turbine blades in meters and ω is the angular speed of the turbine shaft in rad/s.
In every period, the wind turbine output power was computed in three steps, as follows:
(i)
The velocity of the wind at the hub height of the turbine is calculated. The hub height wind speed uses the average velocity of the wind at the anemometer height (corresponding to the wind data) by applying the logarithmic theory, and according to the next equation, it is used for estimation [23,24].
V h u b V a n e m = ln ( h h u b h o ) ln ( h a n e m h o )
where V h u b is the speed of the wind, determined at the hub height of the turbine, V a n e m is the velocity of the wind at the anemometer height, h h u b is the hub height of the turbine, h a n e m is the height of the anemometer, and h o is the roughness length of the surface.
(ii)
The output power of the wind turbine at the calculated velocity from the first step and at a nominal air density of 1.225 kg/m3 (compatible with nominal pressure and temperature conditions) is obtained.
(iii)
The value of the calculated output power to the actual conditions is adjusted. This is achieved by multiplying the calculated output power by the ratio of air density, i.e., the ratio of the real density of the air to the nominal air density, according to the following equation [25]:
P w = (   ρ ρ o   ) P w , s t
The parameter ρ represents the real density of the air, ρ0 is the nominal air density at nominal states, P w is the output power of the wind turbine, and P w , s t is the power of the wind turbine at nominal conditions
The wind turbine begins to create power at certain speeds, which are called the cut-in speeds, and the turbine output power cubically increases with the increasing wind speed above the cut in speed. The turbine stops generating power at a speed called the cut-out. The turbine-rated power (generally the maximum power output) occurs at the rated wind speed.
The limiting of the wind turbines output power at high wind speeds is necessary for all wind turbines to protect them from being overloaded. There are two aerodynamic control approaches, namely stall control and pitch control. In stall control, power is controlled or regulated by stalling or blocking the blades when a nominal speed is reached. In pitch control, the power can be held nearly constant at a rated value by adjusting the blade pitch angle.
The power-speed characteristics depend on the speed control strategy. The difference between the two power control methods is shown in Figure 2, which illustrates the typical power-speed curves [26]. Generally, output power in stall-control reduces slightly after the wind speed becomes higher than the rated speed of the turbine, however this depends on its aerodynamic design. For pitch control, the turbine keeps the output power constant when the rated wind velocity is attained, and it retains its constant power until it reaches the cut-off speed.
In general, small wind turbines require at least a wind velocity of 4.5 m/s to be capable of generating useful output power.

2.3. Energy Storage

Generally, there is an area with extra energy during the day, and at other times, there is an energy shortage, especially during night. Thus, energy production oscillates during the day. The storage of energy is therefore required to save extra energy during the energy production peak times and to use it when there is a shortage in energy production. Therefore, the storage of energy is an essential component of any microgrid. There are many methods to store electrical energy that can be achieved by using mechanical, electrochemical, chemical, electrical, and thermal techniques [27]. There is a serious disadvantage of energy storage, namely its high initial prices. Consequently, there is a considerable increase in the costs of the microgrid. It is worth mentioning that, near the resort, the Egyptian government is planning to build an enormous, pumped storage plant. The project aims to install an approximately 2.4 GW pumped storage power plant. More details regarding the project can be found in Reference [28]. In the present work, batteries were used for energy storage.
The complete system scheme is illustrated in Figure 3.

3. Optimization Approach

Optimization techniques are mathematical tools that are used to obtain the minimum costs (or maximum profit) of an objective function that is subjected to certain equal and unequal constraints. There are many methods to obtain the optimal solution that are based on mathematical methods, starting from linear programming and nonlinear programming. Other methods are based on heuristic methods. A good review of heuristic methods can be found in Reference [29].
There are many tools that can be used to obtain the optimal solution [30,31,32,33,34,35,36,37,38]. Among them is a powerful software tool to optimize hybrid renewables systems introduced by the National Renewable Energy Laboratory in the United States and is called the Hybrid Optimization Model for Electric Renewables. The operation of the studied system for the whole year, in small time periods ranging from one minute to one hour, can be considered [37]. There are many criteria that can be used to select the optimal solution. The main criterion is focused on the whole net present cost (NPC) [38,39]. Thus, the whole NPC is computed by adding the whole discounted cash flows in each year for the whole lifetime of the project. To calculate the NPC, the following equation was used [38,39,40,41,42]:
N P C = t o t a l   a n n u a l   c o s t capital   recovery   factor
where the capital recovery factor ( C R F i , N ) is the ratio of a fixed annuity to the current value of obtaining that annuity for a specified period [23]. It is given by:
C R F i , N = i   ( 1 + i ) N ( 1 + i ) N 1
where i is the rate of annual interest, and the integer N represents the number of annuities received.
Another important measure of optimization is the CoE. CoE is given by:
CoE = T o t a l   A n u a l   C o s t s Primary   Load + Deferrable   Load + Energy   sold   to   the   grid   per   year
Another important factor that can be taken into account is the CO 2 emissions. The CO 2 emissions can be computed using the next equation [38]:
Amount   of   CO 2   emissions = 3.667 . m f .   H V f . C E F f . X c
where m f is the quantity of fuel in the litter, H V f is the value of the fuel heating in the mega Joule per Liter, C E F f is the factor of the carbon emission in tons of carbon per Tera Joule, and X c is part of the oxidized carbon.
An important fact that must be taken into consideration when dealing with the CO 2 emissions is that 3.667 g of CO 2 has 1 g of carbon [38].

4. Numerical Results and Discussions

In this section, the suggested system will be simulated for different cases. First, a short description of the system is presented before four cases are analyzed.

4.1. The Simulated System

The proposed system is given in Figure 3, which illustrates the different component of the complete system. It is worth noting that the grid-considered price in this paper is 0.07 $/kWh (average price in Egypt is about 1.4 LE/kWh).
From the available sources and load considerations, the complete system components considered to meet the required load and the stored energy are shown in Figure 3. The system load is a resort that has a total load of 300 kW, which is distributed between 25 villas. The daily load profile is given in Figure 4. A deferrable load is used to irrigate the resort’s garden and is supplied during the off-peak load. Additionally, there are batteries to store the access energy. The resources used to supply the loads are wind turbines, PV, storage batteries, and a diesel generator. Converters were also used.
Numerous cases are anticipated for further analysis and their summaries are presented in Table 1.

4.2. Case 1: PV and Diesel

In this case study, only the PV and diesel generation were considered (no grid). The base case was considered and a diesel generator with a total of 47 kW and an initial cost of $14,100 is used. The NPC of the base case equals $758,938, with a levelized CoE (LCoE) of 0.492 $/kWh. While the initial cost of the base case system is very low, both the NPC and CoE are very high and were not acceptable. The wining system or the optimal system obtained consisted of an installed capacity PV of 58.8 kW and a diesel generator with a capacity equal to 47.0 kW. Its monthly energy generation is shown in Figure 5. The NPC of the winning system is equal to $218,182, which is 28.7% of the NPC of the base case system. The CoE was 0.141 $/kWh, which is much less than that of the base case system. The initial cost was $77,950, which is five times the initial cost of the base case system. The total PV generation is 66,572 kWh/year or 75.2% of the energy generated by the system. The total PV generation penetration divided by the load is 84.7%. The excess energy of that system equals 44,123 kWh/year or 49.9%, which is too high and can be used for additional loads for future extension. Case 1 shows that, with PV and a diesel generator, the winning scheme has an NPC of $218,182 and LCoE of 0.141 $/kWh, which is expensive and not acceptable.

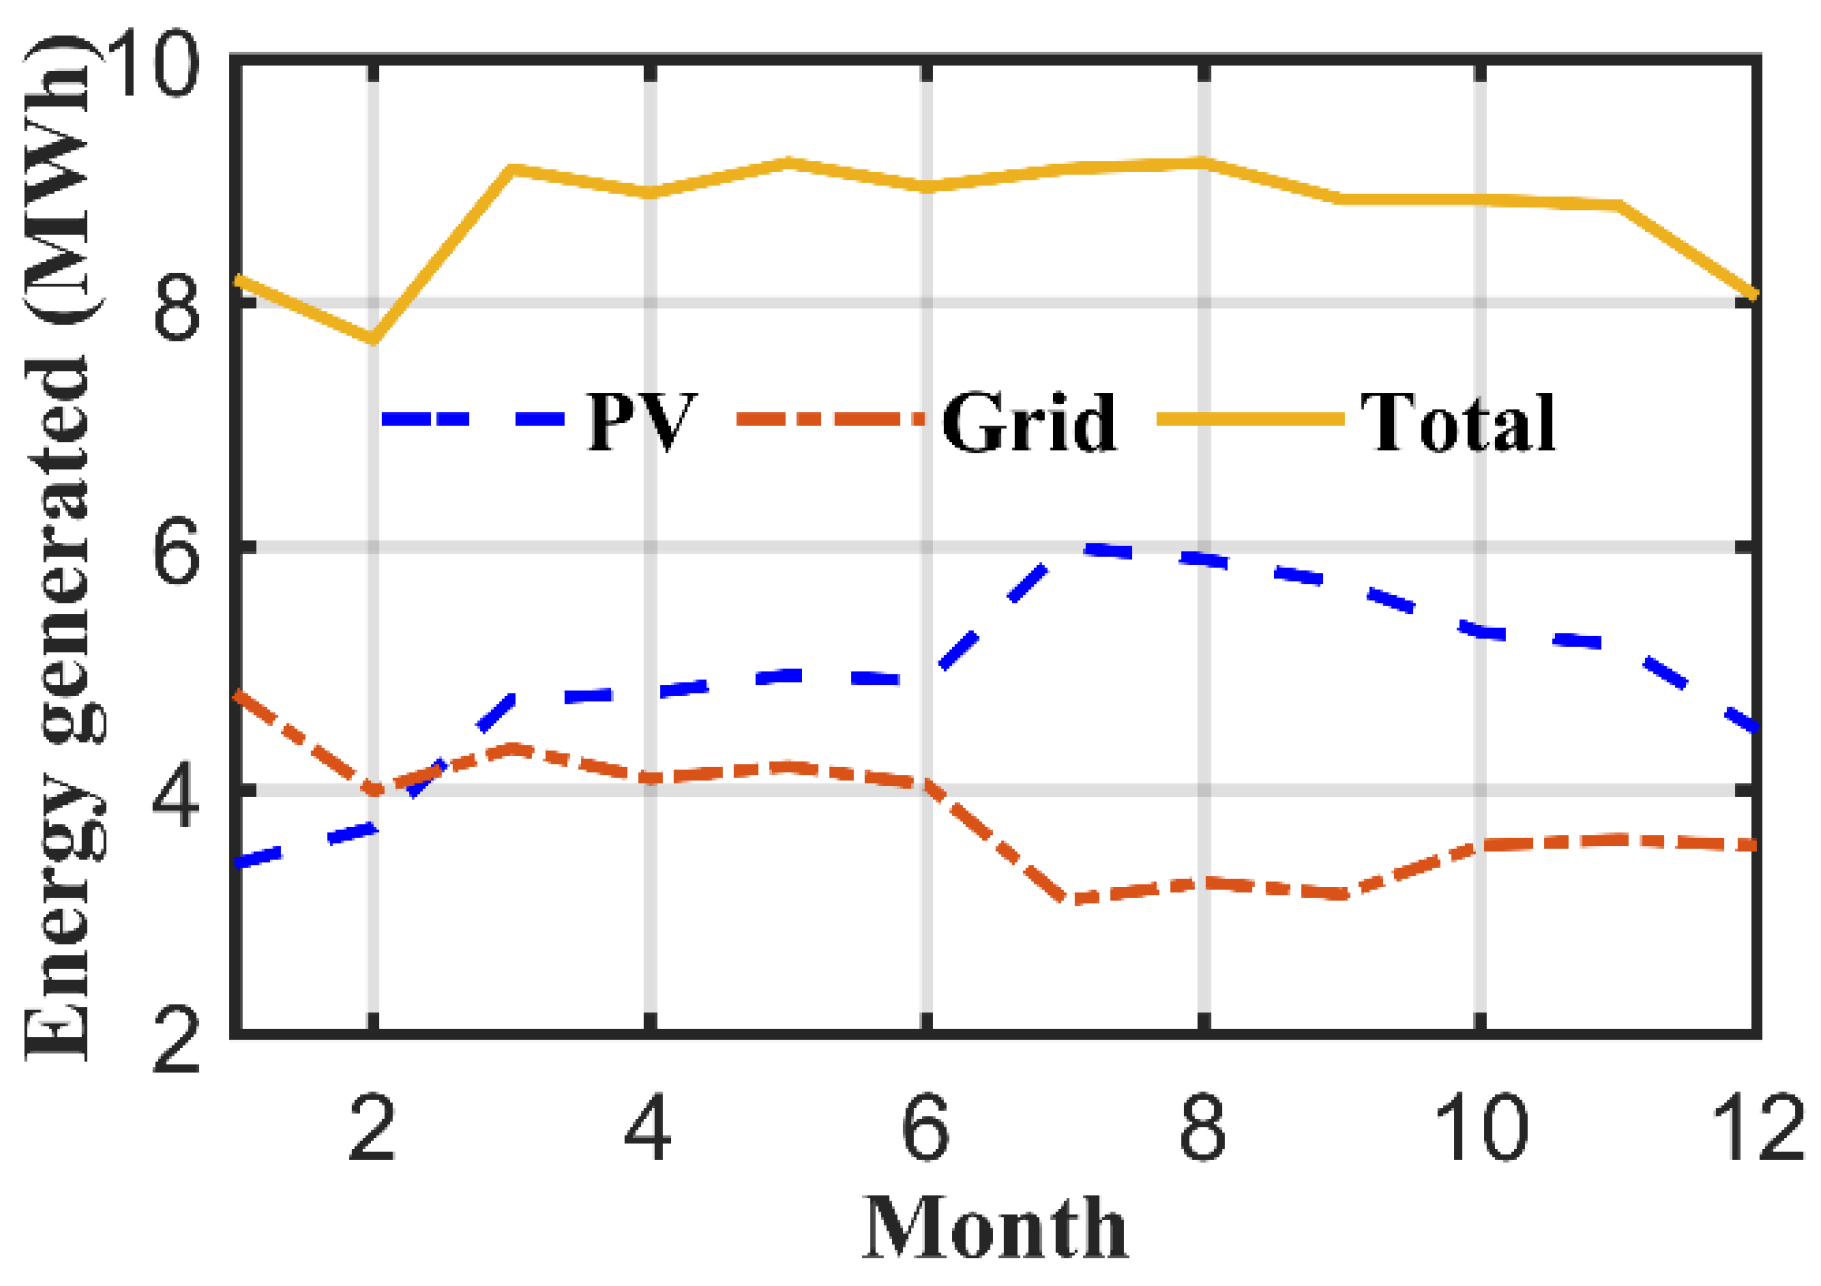
4.3. Case 2: PV, Diesel, and Grid

Here, the system load is supplied by PV, the grid, and diesel. The winning system architecture consists of 31.5 kW PV and the grid. Its monthly energy generation can be seen in Figure 6.
The NPC of the winning scheme is $89,367, with CoE of 0.0441 $/kWh. The PV generation is 52,114 kWh/year or 49.9% and the PV energy penetration divided by the load is 50.4%. The excess of energy is too small, with a value of 3165 kWh/year or 3.03%.
When using the grid, both the NPC and LCoE reduced to approximately a third of case 1. It should be noticed that there are no storage batteries or diesel generators that exist in the winning scheme. The electricity is supplied by the PV and if there is excess PV, it is fed to the grid, otherwise the grid feeds the load at a tariff of 0.07 $/kWh.

4.4. Case 3: PV, Diesel, and Wind without Grid

In this case, the system depends only on renewables (PV and wind), in addition to diesel to meet the load demand. This is the only solution to be considered if there is no direct link to the network [40,41,42] or the network is very far from the resort, or some additional substations that must be set up near the area, which is very costly. The optimal mix architecture of the winning system consists of 44.2 kW PV, 10 kW wind turbine, and 47 kW diesel engines. Its monthly generation is shown in Figure 7. Additionally, there is a battery storage capacity of 55 kW. The NPC is $206,713, which is much higher than case 2. The LCoE is 0.134 $/kWh. The PV energy contribution is 61,083 kWh/year or 64.4%, and the wind energy penetration is 14,888 kWh/year or 15.7%. The total renewable penetration divided by the load is 96.6%. The excess electricity that can be used for future extensions is 31,068 kWh/year or 32.8%. This means that the resort can build an additional eight homes in future without adding any extra energy supply requirements.
It should be noted that the storage batteries have 55 strings, with a nominal capacity of 194 kWh and an expected lifetime of five-years. The total energy input to the batteries is 29,764 kWh/year and the total energy delivered to the system from batteries is 29,323 kWh/year, with losses of 597 kWh/year and a storage depletion of 155 kWh/year.
It should be noted that, from the simulation, PV and wind are only used to supply the load; the NPC is too costly at 1.98 M$ and a LCoE of 1.28 $/kWh, which also is very expensive.

4.5. Case 4: PV, Diesel, Wind, and Grid

This case is the final and more general case in which all sources are added to the system before selecting the optimal mix. The winning system architecture consists of 30.8 kW PV with the grid to meet the load and its monthly energy generation is shown in Figure 8. This shows that the NPC of the winning scheme is $89,356 with CoE equal to 0.0443 $/kWh, which is less than the grid price. This is like case 2. It means that no wind energy is used to supply the load, which could be explained by the higher initial cost of the wind energy.
From an electrical side view, an installed capacity of PV is 30.8 kW is responsible for generating 51,369 kWh/year or 49.5 % of the load each year. It is necessary to mention that the net saving from the winning scheme (that has NPC of $89,356), as compared to the base case system (grid only has an NPC of $107,944) is $18,588.
From the simulation results, there is another interesting system that is close to the wining system, but it has the lowest CoE, with a value of 0.0403 $/kWh and an NPC of $90,162 (slightly less than the winning system that has an NPC of 89,356 $). This system has a PV installed capacity of 30.9 kW and wind installed capacity of 10 kW. The PV generation is 51,541 kWh/year or 44.7% of the yearly load, and the wind energy generation is 20,367% or 17.7%. The renewable fraction is 62.1%. This system, although providing the lowest CoE, has an NPC that slightly higher than the winning system. This indicates that the NPC is a good choice to measure the wining system. Another important point of view is the CO2 emission. The total emissions from the wining system is 33,164 kg/year. The summaries of the afore-mentioned cases are arranged in Table 2. It is apparent, as depicted in that Table, that (i) the CoEs are equal to 0.0441 and 0.0443 $/kWh for cases 2 and 4 (with grid), respectively, and (ii) the CoEs are equal to 0.141 and 0.134 $/kWh for cases 1 and 3 (without grid), respectively.

5. Conclusions

Sources of sustainable energy, especially wind and solar energies, are both efficient and economical energy sources that are environmentally friendly. This paper analyzed the application of renewable energy sources (namely, PV and onshore wind) to supply a coastal resort located in the Gulf of Suez, Egypt. The resort has 25 villas, with a total load of 300 kW. To supply the resort with a reliable electric source, this paper attempted to find the optimal combination of wind, PV, battery storage, and diesel generator sources to meet the load demand. The optimal mix of the energy resources, with and without the grid, have been considered. The main outcomes of the study showed that both PV and onshore wind are economical solutions for high load demands. At low loads, the presence of the grid helps to enhance the reduction in energy costs. The CoEs are equal to 0.0441 and 0.0443 $/kWh for cases 2 and 4 (with grid), respectively. However, the COEs are equal to 0.141 and 0.134 $/kWh for cases 1 and 3 (without grid), respectively. According to the simulation results for the different cases investigated above, for very small or small projects, it is advisable to use PV and wind in the present of the grid to reduce both the NPC and LCoE. If the system is very small, the cost of both PV and wind energy is costly. PV and wind are more economical solutions to be used alone in medium or large-scale projects (namely, above 10 MW). This provides a strong argument for the specified area, which has plenty of both solar energy and wind energy that can be harnessed at very economical prices.

Author Contributions

Conceptualization, A.K.A.; methodology and software, E.F.M.; validation, and formal analysis, A.K.A.; investigation and resources, E.F.M.; data curation, A.K.A.; writing—original draft preparation, A.K.A. and E.F.M.; writing-review and editing, A.A.E.-F.; visualization, A.K.A. and E.F.M.; supervision, A.A.E.-F. All authors have read and agreed to the published version of the manuscript.

Funding

This research received no external funding.

Institutional Review Board Statement

Not applicable.

Informed Consent Statement

Not applicable.

Data Availability Statement

Not applicable.

Conflicts of Interest

The authors declare no conflict of interest.

Nomenclature & Abbreviations

A w Swept area by the blades of the wind rotor
C p Wind turbine power coefficient
CEF f Factor of carbon emission
E go Energy band gap (1.12 eV for silicon)
h hub Hub height of the turbine
h anem Height of the anemometer
h o Roughness length of the surface
HV f Value of fuel heating
IOutput current produced by the solar cell
I ph Photocurrent generated by solar radiation
I RS Reverse current of the diode
ISSaturation current
I sc Current at short circuit
ISHShunt current
iRate of annual interest
kBoltzmann constant
m f Quantity of fuel
nIdeality factor of the cell (equal to 1 for ideal cell)
NNumber of annuities received
N P Number of cells connected in parallel
N S Number of cells connected in cascade
P w Output power of the wind turbine
P w , st Power of the wind turbine at nominal conditions
qElectron charge
RLength of the radius of the swept area by the turbine blades
R s Internal series resistance of the PV cell
R SH Shunt resistance of the PV cell
TRoom operating temperature
T r Nominal temperature
V D Voltage at the diode terminal
VTerminal voltage at the cell ends
V anem Velocity of wind at anemometer height
V hub Speed of wind determined at the hub height of the turbine
V OC Voltage at open circuit
V w   Wind speed
X c Part of oxidized carbon
β Pitch angle
λTip speed ratio
ω Angular speed of the turbine shaft
ρReal density of air
ρ0Nominal air density at nominal states
CO2Carbon dioxide
CoEs Cost of energies
CRF i , N   Capital recovery factor
CSP Concentrating solar power
LCoELevelized CoE
NPCNet present cost
PVPhotovoltaic

References

  1. Abeydeera, L.H.U.W.; Mesthrige, J.W.; Samarasinghalage, T.I. Global Research on Carbon Emissions: A Scientometric Review. Sustainability 2019, 11, 3972. [Google Scholar] [CrossRef] [Green Version]
  2. IRENA. Renewable Power Generation Costs in 2017; IRENA: Abu Dhabi, United Arab Emirates, 2018; ISBN 978-92-9260-040-2. [Google Scholar]
  3. Temiz, M.; Dincer, I. Development of solar and wind based hydrogen energy systems for sustainable communities. Energy Convers. Manag. 2022, 269, 116090. [Google Scholar] [CrossRef]
  4. IRENA. Renewable Power Generation Costs in 2020; IRENA: Abu Dhabi, United Arab Emirates, 2021; ISBN 978-92-9260-348-9. [Google Scholar]
  5. IRENA. Renewable Capacity Statistics 2021; IRENA: Abu Dhabi, United Arab Emirates, 2021; ISBN 978-92-9260-342-7. [Google Scholar]
  6. IRENA. Renewable Capacity Highlights; IRENA: Abu Dhabi, United Arab Emirates, 2022; Available online: https://www.irena.org/-/media/Files/IRENA/Agency/Publication/2022/Apr/IRENA_-RE_Capacity_Highlights_2022.pdf?la=en&hash=6122BF5666A36BECD5AAA2050B011ECE255B3BC7 (accessed on 23 August 2022).
  7. Cai, M.; Wu, Y.; Chen, H.; Yang, X.; Qiang, Y.; Han, L. Cost-Performance Analysis of Perovskite Solar Modules. Adv. Sci. 2016, 4, 1600269. [Google Scholar] [CrossRef] [PubMed]
  8. Al Ayn as Sukhnah. www.geonames.org. Available online: https://www.geonames.org/359541/al-ayn-as-sukhnah.html (accessed on 15 September 2022).
  9. As Sukhnah Monthly Weather Averages. Available online: https://www.weather2visit.com/middle-east/yemen/as-sukhnah.htm (accessed on 10 September 2022).
  10. Shahsavari, A.; Akbari, M. Potential of solar energy in developing countries for reducing energy-related emissions. Renew. Sustain. Energy Rev. 2018, 90, 275–291. [Google Scholar] [CrossRef]
  11. Kabalci, E. Design and analysis of a hybrid renewable energy plant with solar and wind power. Energy Convers. Manag. 2013, 72, 51–59. [Google Scholar] [CrossRef]
  12. Solar Energy Is the Fastest Growing Renewable Energy Source. Available online: https://quebecsolar.ca/solar-energy-is-the-fastest-growing-renewable-energy-source (accessed on 5 September 2022).
  13. Moheb, A.M.; El-Hay, E.A.; El-Fergany, A.A. Comprehensive Review on Fault Ride-Through Requirements of Renewable Hybrid Microgrids. Energies 2022, 15, 6785. [Google Scholar] [CrossRef]
  14. Ding, Z.; Hou, H.; Yu, G.; Hu, E.; Duan, L.; Zhao, J. Performance analysis of a wind-solar hybrid power generation system. Energy Convers. Manag. 2018, 181, 223–234. [Google Scholar] [CrossRef]
  15. Zheng, Z.; Zhou, J.; Xu, F.; Zhang, R.; Deng, G. Integrated operation of PV assisted ground source heat pump and air source heat pump system: Performance analysis and economic optimization. Energy Convers. Manag. 2022, 269. [Google Scholar] [CrossRef]
  16. Ginidi, A.; Ghoneim, S.M.; Elsayed, A.; El-Sehiemy, R.; Shaheen, A.; El-Fergany, A. Gorilla Troops Optimizer for Electrically Based Single and Double-Diode Models of Solar Photovoltaic Systems. Sustainability 2021, 13, 9459. [Google Scholar] [CrossRef]
  17. IRENA. Renewable Power Generation Costs in 2019; IRENA: Abu Dhabi, United Arab Emirates, 2020; ISBN 978-92-9260-244-4. [Google Scholar]
  18. Piprek, J. Handbook of Optoelectronic Device Modeling and Simulation: Lasers, Modulators, Photodetectors, Solar Cells, and 469 Numerical Methods, 1st ed.; CRC Press: Boca Raton, FL, USA, 2017. [Google Scholar] [CrossRef]
  19. Fraas, L.; Partain, L. Solar Cells and their Applications, 2nd ed.; John Wiley & Sons, Inc.: Hoboken, NJ, USA, 2010. [Google Scholar] [CrossRef]
  20. Bellia, H.; Youcef, R.; Fatima, M. A detailed modeling of photovoltaic module using MATLAB. NRIAG J. Astron. Geophys. 2014, 3, 53–61. [Google Scholar] [CrossRef] [Green Version]
  21. Ma, T.; Yang, H.; Lu, L. Solar photovoltaic system modeling and performance prediction. Renew. Sustain. Energy Rev. 2014, 36, 304–315. [Google Scholar] [CrossRef]
  22. Heier, S. Grid Integration of Wind Energy, 1st ed.; John Wiley & Sons: Hoboken, NJ, USA, 2014. [Google Scholar] [CrossRef]
  23. Ibrahim, M.M.; Mostafa, N.H.; Osman, A.H.; Hesham, A. Performance analysis of a stand-alone hybrid energy system for desalination unit in Egypt. Energy Convers. Manag. 2020, 215, 112941. [Google Scholar] [CrossRef]
  24. Baneshi, M.; Hadianfard, F. Techno-economic feasibility of hybrid diesel/PV/wind/battery electricity generation systems for non-residential large electricity consumers under southern Iran climate conditions. Energy Convers. Manag. 2016, 127, 233–244. [Google Scholar] [CrossRef]
  25. Antonio Barrozo Budes, F.; Valencia Ochoa, G.; Obregon, L.G.; Arango-Manrique, A.; Ricardo Núñez Álvarez, J. Energy, Economic, and Environmental Evaluation of a Proposed Solar-Wind Power On-grid System Using HOMER Pro®: A Case Study in Colombia. Energies 2020, 13, 1662. [Google Scholar] [CrossRef]
  26. Stiebler, M. Wind Energy Systems for Electric Power Generation, 1st ed.; Springer: Berlin/Heidelberg, Germany, 2008. [Google Scholar] [CrossRef]
  27. Hu, Z. Energy Storage for Power System Planning and Operation, 1st ed.; John Wiley & Sons: Hoboken, NJ, USA, 2020. [Google Scholar] [CrossRef]
  28. Project Spotlight: 2400-MW Ataqa Pumped Storage in Egypt. Available online: https://www.hydroreview.com/world-regions/project-spotlight-2-400-mw-ataqa-pumped-storage-in-egypt/#gref (accessed on 20 August 2022).
  29. Rodríguez, N.; Gupta, A.; Zabala, P.L.; Cabrera-Guerrero, G. Optimization Algorithms Combining (Meta)heuristics and Mathematical Programming and Its Application in Engineering. Math. Probl. Eng. 2018, 2018, 3967457. [Google Scholar] [CrossRef]
  30. Jung, J.; Villaran, M. Optimal planning and design of hybrid renewable energy systems for microgrids. Renew. Sustain. Energy Rev. 2017, 75, 180–191. [Google Scholar] [CrossRef]
  31. Cardenas, G.A.R.; Khezri, R.; Mahmoudi, A.; Kahourzadeh, S. Optimal Planning of Remote Microgrids with Multi-Size Split-Diesel Generators. Sustainability 2022, 14, 2892. [Google Scholar] [CrossRef]
  32. Rahimi, M.; Ardakani, F.J.; Ardakani, A.J. Optimal stochastic scheduling of electrical and thermal renewable and non-renewable resources in virtual power plant. Int. J. Electr. Power Energy Syst. 2020, 127, 106658. [Google Scholar] [CrossRef]
  33. Ahmad, S.; Ullah, I.; Jamil, F.; Kim, D. Toward the Optimal Operation of Hybrid Renewable Energy Resources in Microgrids. Energies 2020, 13, 5482. [Google Scholar] [CrossRef]
  34. Ramli, M.A.; Bouchekara, H.; Alghamdi, A.S. Optimal sizing of PV/wind/diesel hybrid microgrid system using multi-objective self-adaptive differential evolution algorithm. Renew. Energy 2018, 121, 400–411. [Google Scholar] [CrossRef]
  35. Emmanouil, S.; Philhower, J.; Macdonald, S.; Khadim, F.; Yang, M.; Atsbeha, E.; Nagireddy, H.; Roach, N.; Holzer, E.; Anagnostou, E. A Comprehensive Approach to the Design of a Renewable Energy Microgrid for Rural Ethiopia: The Technical and Social Perspectives. Sustainability 2021, 13, 3974. [Google Scholar] [CrossRef]
  36. AlKassem, A.; Draou, A.; Alamri, A.; Alharbi, H. Design Analysis of an Optimal Microgrid System for the Integration of Renewable Energy Sources at a University Campus. Sustainability 2022, 14, 4175. [Google Scholar] [CrossRef]
  37. HOMER Pro 3.14 User Manual. Available online: https://www.homerenergy.com/products/pro/docs/latest/index.html (accessed on 3 April 2020).
  38. Bahramara, S.; Moghaddam, M.P.; Haghifam, M.R. Optimal planning of hybrid renewable energy systems using HOMER: A review. Renew. Sustain. Energy Rev. 2016, 62, 609–620. [Google Scholar] [CrossRef]
  39. Bhandari, B.; Lee, K.-T.; Lee, G.-Y.; Cho, Y.-M.; Ahn, S.-H. Optimization of hybrid renewable energy power systems: A review. Int. J. Precis. Eng. Manuf. Technol. 2015, 2, 99–112. [Google Scholar] [CrossRef]
  40. Conteh, F.; Takahashi, H.; Hemeida, A.M.; Krishnan, N.; Mikhaylov, A.; Senjyu, T. Analysis of Hybrid Grid-Connected Renewable Power Generation for Sustainable Electricity Supply in Sierra Leone. Sustainability 2021, 13, 11435. [Google Scholar] [CrossRef]
  41. Vengala, J.; Ramesh, K.; Manjunatha, M.; Dharek, M.S.; Kumar, B.K.S. Embodied energy and operational energy computations for a typical G+3 residential building in Vijayawada city of Andhra Pradesh, India. Int. J. Adv. Technol. Eng. Explor. 2021, 8, 1049–1058. [Google Scholar] [CrossRef]
  42. Elomari, Y.; Norouzi, M.; Marín-Genescà, M.; Fernández, A.; Boer, D. Integration of Solar Photovoltaic Systems into Power Networks: A Scientific Evolution Analysis. Sustainability 2022, 14, 9249. [Google Scholar] [CrossRef]
Figure 1. Single diode model of a PV system.
Sustainability 14 12948 g001
Figure 2. Difference between the output power characteristics of two methods of power control (stall and pitch control) of wind turbines.
Sustainability 14 12948 g002
Figure 3. The complete system architecture of the proposed system.
Sustainability 14 12948 g003
Figure 4. The daily load of the proposed system.
Sustainability 14 12948 g004
Figure 5. The monthly energy generation of the wining system of case 1.
Sustainability 14 12948 g005
Figure 6. The monthly energy generation of the wining system for case 2.
Sustainability 14 12948 g006
Figure 7. The monthly energy generation of the wining system of case 3.
Sustainability 14 12948 g007
Figure 8. The monthly energy generation of the wining system of case 4.
Sustainability 14 12948 g008
Table 1. Anticipated cases for further studies.
CasePVWindDieselGridStorage
1
2
3
4
Note: means used and ꭗ means not used.
Table 2. Summaries of the studied cases.
Test CaseCase 1Case 2Case 3Case 4
NPC ($)218,18289,367206,71389,356
CoE ($/kWh)0.1410.04410.1340.0443
PV (kW)58.831.544.230.8
Wind (kW)----
Diesel (kW)47-47-
Storage (kW)48-55-
Grid (kW)-exist-exist
Publisher’s Note: MDPI stays neutral with regard to jurisdictional claims in published maps and institutional affiliations.

