Article

The Interrelationship between Road Pricing Acceptability and Self-Driving Vehicle Adoption: Insights from Four Countries

1
Department of Transport Technology and Economics, Budapest University of Technology and Economics, Műegyetem rkp. 3, 1111 Budapest, Hungary
2
Department of Civil, Structural and Environmental Engineering, Trinity College Dublin, 2 Dublin, Ireland
*
Author to whom correspondence should be addressed.
Sustainability 2022, 14(19), 12798; https://doi.org/10.3390/su141912798
Submission received: 9 August 2022 / Revised: 3 October 2022 / Accepted: 5 October 2022 / Published: 7 October 2022
(This article belongs to the Special Issue Transportation Planning and Urban Sustainability)

Abstract

:
Driverless vehicles (i.e., autonomous and shared autonomous vehicles) are associated with many advantages for the transportation market. However, they may also increase the traveled miles on roads due to improved accessibility, thus aggravating congestion. Road pricing (RP) is a possible solution for mitigating traffic-related problems like congestion. Despite its benefits, RP is usually resented by the public, which may hinder its introduction. This study investigates the factors that may influence RP acceptability in the era of driverless vehicles and driverless vehicle adoption in the presence of RP. For this purpose, a survey was distributed in Hungary, Jordan, Ukraine, and Brazil. The study applied factor analysis, multiple linear regression, and multinomial logit modeling to examine RP acceptability and driverless vehicle adoption. All examined factors have a significant impact on mode choice. For instance, respondents willing to share their trips with others due to the application of RP, opted for shared autonomous vehicles, while those who enjoy driving were less likely to choose autonomous vehicles. In terms of RP acceptability, the respondents who were environmentally conscious in their trip planning showed more acceptance of RP. This study shows the significant impacts of the investigated factors on RP acceptability and driverless vehicle adoption.

1. Introduction

Advancement and expansion in the field of autonomous vehicles (AVs) and shared autonomous vehicles (SAVs) are burgeoning quickly, with the intense competition among motor companies to capture market share. The Navigant Research Leaderboard set ten criteria (e.g., vision, technology, marketing, and others) for evaluating which manufacturers are better positioned in the sector of automated driving [1,2]. Considering the increasing role of AVs and SAVs as future travel modes worldwide, increased legislation is being reviewed and implemented in various countries and regions [3,4]. In addition to AVs, SAVs will also likely emerge as an on-demand travel service, being used as taxis or for carsharing [5]. Consequently, growth in the AV and SAV sectors opens a wide field of research and development both in industrial and academic contexts.
Since AVs are new travel modes with no human intervention [6], users of AVs can utilize their travel time more effectively by executing other activities such as reading, working, or even sleeping instead of driving [6,7]. Moreover, AV sensors can assess the environment and traffic conditions, thus providing comfort and safety for users [8]. AVs and SAVs are expected to have substantial benefits, particularly in regard to improving energy consumption, reducing environmental impacts, and increasing accessibility [9,10]. However, the impact of AVs and SAVs on road network congestion is unclear and may lead to serious problems [11,12,13].
On the one hand, the tighter headways between AVs and optimal utilization of intersections will increase traffic throughput [7,14,15]. On the other hand, AVs and SAVs will most likely increase the number of trips and traveled miles on roads due to their improved accessibility. In particular, their use by those who cannot drive because of age or disability will increase the number of cars on the road and aggravate congestion [10,16].
Road pricing (RP) is regarded by many transport professionals, economists, and traffic engineers as a successful measure in mitigating traffic-related problems such as congestion and reducing carbon emissions [17,18,19]. Moreover, RP is being adopted by several cities worldwide such as Singapore, Oslo, London, Stockholm, and Milan [20]. Therefore, the use of RP as a travel demand management tool can also play an important role in tackling the expected upsurge in congestion associated with the emergence of AVs and SAVs.
Despite the expected improvement of traffic-related problems through the application of RP, there is also public resentment towards such schemes, as drivers do not want to pay for the use of roads that were previously free [21,22,23]. Low public acceptance of implementing an RP scheme hinders its introduction [24]. For example, authorities in Auckland, Copenhagen, the Netherlands, and Edinburgh failed to implement RP schemes due to public rejection [25,26,27]. However, case studies from Stockholm and Milan showed that public acceptance of RP schemes could be enhanced if they are properly introduced and include measures such as using revenues for improving public transport (PuT) services [28,29,30].
Adoption of new travel technologies such as AVs and SAVs, and the successful implementation of RP, require initial public acceptance. Therefore, since the late 1980s, numerous studies have investigated the acceptability of RP and generated a vast amount of literature. Likewise, many researchers and consultancy companies have developed questionnaires to investigate public perceptions of the advantages and disadvantages of AVs and SAVs [31]. However, to the best of the authors’ knowledge, there is no study yet that has investigated RP acceptability in connection with the adoption of AVs and SAVs and the factors influencing them. Therefore, addressing this gap was the primary research aim of the authors of this study. Considering AVs and SAVs will likely be operating on the streets in the future, RP will be a suitable measure to manage the travel demand, but it still requires public acceptance.
In this research, a questionnaire was developed and distributed to residents of Brazil, Jordan, Ukraine, and Hungary. Six hundred and fifty-seven valid responses were received. The questionnaire included various latent variables derived from previous well-known models to explore public preferences relating to RP, AVs, and SAVs. An analysis of the received data using different econometric models provided insight into the public perception of RP, AVs, and SAVs. It also sheds light on the relationship between the survey’s latent variables and public perception.
A review of previous research studies on the acceptability of RP and the adoption of AVs and SAVs indicates that this study is distinctive with respect to simultaneously studying the relationships among RP acceptability, preference for future cars, latent variables, and socio-demographic characteristics. Therefore, this research opens new avenues for understanding the factors influencing RP acceptability for addressing traffic congestion issues foreseen as a result of the increased accessibility of self-driving cars and an increase in their presence due to their various benefits. Here, it is worth mentioning the recent study by Shatanawi et al., that discussed RP adaptation to future cars, in which the authors deployed a stated preference experiment including different attributes (e.g., travel time and travel cost). However, the research results were limited to the impact of socio-demographic characteristics on both RP acceptability and future car choice [32].
Thus, the contribution of this paper to the literature on RP, AVs, and SAVs is twofold: firstly, it investigates the relationship among RP acceptability, future car choice (AV or SAV), and the studied latent variables. Secondly, it explores the cognitive determinants of RP acceptability and future car choice. The collected data were analyzed using various econometric models, including a factor analysis, multiple linear regression (MLR), multinomial logit model (MNL), and descriptive statistics.
The economic level of a given country has been shown to play a role in influencing the adoption of automated vehicles through GDP per capita [33]. Therefore, the countries selected in this research illustrate its breadth by analyzing the research impacts in countries from four different regions: Hungary (Central Europe), Brazil (South America), Ukraine (Eastern Europe), and Jordan (Middle East). These countries also represent different economic conditions: Jordan and Brazil have developing economies, Ukraine has an economy in transition, and Hungary has a developed economy [34]. However, little research has been carried out in these countries with reference to RP, AVs, and SAVs. In light of this, participants belonging to different demographics, cultures, languages, and exposures (in terms of transportation systems, economic conditions, environmental conditions, and other factors) are involved in this research, highlighting its broad scope. Table 1 summarizes a few characteristics of the four studied countries to provide an overview. The data for the Area, Population, Density, and GDP are based on the year 2020, while the data for Vehicles in Use/1000 People, Passenger Vehicles Annual Sales, Roadway Density (Km/100 Km2), and Rail Network Length (Km) are based on the data of the years 2015, 2016, 2018, and 2019, respectively.
This paper is structured as follows: Section 2 provides a review of the previous research relevant to RP, AVs, and SAVs. Section 3 presents the theoretical background of the latent variables used to investigate the acceptability of RP, AVs, and SAVs. Section 4 elaborates on the survey design and presents the survey instruments along with the analytical framework of the research. The results of this study are provided in Section 5 and discussed in Section 6. Finally, Section 7 highlights the conclusions of this research and provides insights into policy implications as well as the limitations of the study.

2. Literature Review

Extensive research has been carried out on the acceptability of RP since the late 1980s, with comparatively fewer studies being conducted regarding public concerns related to the adoption of AVs and SAVs. However, to the best of the authors’ knowledge, there are as of yet no studies that interlink both RP acceptability and the adoption of AVs and SAVs, including the impacts of various factors on both. This study aims to contribute to bridging this research gap. The section that follows is divided into three parts: The first recapitulates the literature related to RP acceptability, while the second and third parts summarize the main findings of questionnaire studies examining public perspectives on the adoption of AVs and SAVs, respectively.

2.1. RP Acceptability

Since Pigou introduced the concepts of negative externalities and corrective tax about a century ago [35], many economists have emphasized the efficacy of RP in alleviating traffic-related problems [17,18,36,37]. Despite the sound economic theory behind RP, it has low public and political acceptance, which hampers its introduction and international spread [38]. Some of the reasons behind its low acceptability are that the aims of implementing RP can also be achieved by taking alternative measures like improving PuT or using access restriction rules. Moreover, RP is often perceived as unfair because it is a new tax supplementing existing taxes [39].
Several studies have developed different models to study the impact of individuals’ attitudes, behaviors, and characteristics on RP acceptability. Verhoef et al. gathered data using a survey on RP from road users in Randstad, the Netherlands, during morning peak hours. The results showed that their willingness to pay to save trip time significantly depends on their income level and the compensations offered to users for paying the toll [40]. Likewise, a similar study in the Netherlands by Rienstra et al. concluded that the effectiveness of the proposed policy and problem perceptions influence the acceptability of transport policy measures. Moreover, participants with certain socio-demographic characteristics supported the transport policy measures; for instance, a higher level of education was shown to positively impact acceptability, while having a car had a negative impact [41]. Strikingly, income level did not show a significant influence on the acceptability of the transport policy measures. In contrast, a study investigating congestion charging acceptability in Athens showed that respondents aged from 35 to 64 years old with high household incomes tended to travel through the charging areas using a passenger vehicle [42]. An analysis of survey data that investigated various transport policies in Texas by Kockelman et al. revealed that the implementation of congestion pricing would likely motivate the elderly to decrease their travel and large household members to alter their travel routes, while full-time employees would be less likely to change their travel patterns [43].
Attitudinal surveys were the most frequently used method to explore the factors that affect RP acceptability. Jones performed twelve surveys in the United Kingdom on the public perception of traffic-related issues and support for various pricing measures. However, the analysis of the data did not reveal interdependence between the proposed measures’ acceptance and the examined factors [44]. This gap was addressed by Schade and Schlag, who investigated RP acceptability levels in four European cities, as well as the relationship between the investigated factors and the acceptability of RP in particular [24,45]. The latter model was replicated in Vienna [46,47] and five capitals around the world by Shatanawi et al. [48]. Some of the key findings from the four previously mentioned studies include the significant positive relationships between RP acceptability and the three predictors: “personal outcome expectation”, “social norm”, and “perceived effectiveness”. A stated preference experiment was carried out in London and Leeds by Jaensirisak to evaluate the impact of different aspects of scheme design, such as the value of charges, location and period of charging, type of charging, and utilization of revenue on acceptability. The key findings of the study were that non-car users who considered congestion and environmental problems as serious and perceived RP as an effective measure of alleviating these problems were more receptive to the scheme’s implementation. Furthermore, it confirmed that the impact of attitudinal variables on the acceptability of RP is greater than the impact of socio-demographic characteristics [28].
Public opinion is a critical determinant of any new technology or policy, and RP is no different. Hensher and Li reviewed voting behavior in various RP referendums in cities such as Stockholm, Milan, and Edinburgh. They concluded that lack of knowledge about the RP scheme and uncertainty about its effectiveness were the main reasons for voting against its implementation. To successfully implement RP schemes and gain public support, they proposed developing a forecasting model during the design phase to inform the public about expected changes and introducing a trial period preceding a referendum, later evaluating and displaying the outcomes to the public through media [49]. The latter point is consistent with the findings of Winslott-Hiselius et al., who analyzed the effect of the Stockholm congestion trial on public attitudinal changes toward the proposed RP scheme [50]. The findings are also consistent with Gu et al., who claimed that one of the possible reasons for the rejection of the proposal to introduce a congestion pricing scheme in New York City (in 2007) was the lack of an RP trial [51]. In addition, the media also plays a vital role in affecting public opinion; for instance, newspapers in Edinburgh reported negative coverage on the introduction of the RP scheme, which led to its rejection in the 2005 referendum [26]. On the other hand, the abundance of information announced regarding the effectiveness of the RP schemes implemented in Stockholm, Milan, and London had a major role in their success and acceptance by the public [51]. A review of public opinion data before and after the implementation of RP in California, Texas, and Minnesota by Ungemah and Collier revealed that the public support for applying tolls increased over time in the case of the SR-91 Express Lanes and I-15 FasTrak High Occupancy Toll (HOT) Lanes in California, and especially after their implementation [52]. For more information about the SR-91 Express HOT Lane and other HOT lanes in the U.S., see [38].
Palma et al. summarized the results of public opinion surveys concerning RP. They found that the allocation of revenues from RP to explicit and particular uses within the transport sector increases the public acceptability of RP [38]. Several studies have discussed the optimal distribution of revenues. Small suggested returning 70% of the revenues to commuters and earmarking 30% to improve the transportation system [53]. Estimation of a bivariate probit model applied to the responses collected from Southern California residents by Harrington et al. showed that allocation of the revenues collected by implementing RP to reduce other taxes increased the acceptability of RP by 7% [54]. Farrell and Saleh recommended using the revenues from RP to enhance the PuT system by improving ticketing systems and reliability by offering more discounts, expanding the network coverage, and providing real-time information [55]. Ubbels and Verhoef stated that the acceptability of RP will increase if the revenues are allocated to reduce the fuel tax and abolish car taxation [56].
Equity was identified as one of the key public concerns regarding RP by Kocak et al. due to the scheme’s potential to cause economic or social disturbances, constrain the free movement of individuals and goods, and threaten the economic viability of companies in RP zones [57]. These concerns are reflected in a study by Sun et al. on the impact of several variables affecting RP acceptability in China [58]. The RP scheme can be made more equitable and fair, according to Hao et al., by offering low-income and short-travel-distance groups a transportation subsidy, as well as by providing the low-income and long travel distance groups a tax subsidy, thus taking vertical equity into consideration. Horizontal equity can be achieved by using part of the tax for passenger benefits and lowering taxes on users’ vehicles [59]. The distributional effects of nine different RP schemes on commuters in Paris were simulated and compared using an econometric model developed by Bureau and Glachant. A key finding was that equity patterns are influenced by the level of traffic reduction and the RP scheme design [60].

2.2. Adoption of AVs

The boom in AV technology is evident, and the number of studies have estimated that AVs will capture future market share. Payre et al. investigated the opinions of French travelers regarding AVs. Out of 421 respondents, 78% were willing to buy an AV at a much higher price than a regular car. The survey results revealed that the most preferred situations for using an AV were monotonous driving situations such as highways or stressful driving conditions such as congested areas [61]. Another international survey-based study investigating public opinion on automated vehicles by Kyriakidis et al. estimated that automated vehicles will acquire 50% market share by the year 2050. However, higher prices of AVs will also generate negative externalities, resulting in market stagnation if innovative measures are not implemented [62]. Nevertheless, pricing incentives (e.g., subsidies) are expected to have a significant role in accelerating the market penetration of AVs. If government agencies subsidize AVs in the early deployment and near-saturation stage, the market share of AVs can increase drastically [63]. Furthermore, the results of a survey investigating the network effects of connected and AVs in South Korea indicated that consumers prefer AVs over conventional cars (CC), and the network effects of AVs significantly affect consumer choice [64].
AV adoption in relation to individuals’ status was studied by Bansal et al. through an online survey in Austin, Texas. The results showed that new technology lovers, those living in urban areas, and those who have experienced road crashes are interested in adopting AVs [65]. On the other hand, the adoption of AVs in relation to attitudinal variables was investigated by Leicht et al. through a survey that studied the relationship between consumer innovativeness and intention to purchase AVs in France. The main findings showed that consumers’ performance expectancy, effort expectancy, and social influence, as defined by Venkatesh et al. [66], are major drivers of AV purchase intention [67]. Another empirical study focused on the adoption factors of AVs, which were necessary for millennials in smart cities, found that the perceived benefits of AVs are vital for their adoption, and their perceived safety can significantly affect concerns regarding their use. Moreover, personal and societal benefits were the most influential factors for adopting AVs for people aged between 20 and 30 years [68].
AV’s economic and other beneficial aspects (e.g., improved accessibility) are vital for the adoption of future cars. AVs can facilitate the movement of elderly and disabled people who were not previously able to drive [10,69]. Fagnant and Kockelman stated that AV technology is expected to alleviate congestion, lower parking demand, enhance fuel economy, and drastically change the transportation systems in the U.S. [10]. Their research estimated the annual economic benefits of using AVs at around $27 billion with only a 10% market share, and has an estimated potential of $450 billion in annual savings in the U.S. only. Rahimi et al. explain that negating public concerns surrounding AVs and promoting their benefits in terms of cost, time, and functionality will increase the inclination towards AV adoption in the U.S. [70].
Previous studies highlighted the perceived risks associated with AV adoption, such as system hacking and loss of data privacy. These public concerns about AVs undermine their acceptability. For instance, public acceptance of AVs will decrease if they are programmed to sacrifice their passengers in case of a crash to save the people on the road [71]. Research has shown that the willingness of Americans to pay for the adoption of AVs will not drastically increase if the associated policies are not introduced, and the prices of AVs are not rapidly reduced [72]. Similar survey-based research has reported that Americans are more worried about AVs with respect to system failures, data privacy, and interaction with human-driven vehicles [73]. A survey in Dublin concluded that the majority of respondents were concerned about the interaction of AVs with other road users, and technical failure [74]. Bezai et al. examined 400 papers worldwide related to AVs, and an analysis of the shortlisted 140 papers concluded that all the barriers affecting the acceptability of AVs could be separated into two categories: user/government perspectives about AVs and information and communication technology of AVs [75]. The diversification of the rapidly increasing research in the field of AVs is reviewed by Sciaccaluga and Delponte, who recommend the use of new instruments such as gamification to analyze users’ sensations, perceptions, and fears about using AVs in a new way [76]. Another barrier to the adoption of AV technology is cyber and information security threats which were investigated by Maeng et al.; they found that consumers are highly sensitive about their personal data privacy and communication failures in AVs [77].
AVs are expected to function as future long-distance travel modes. A study exploring the implications of long-distance travel in Michigan after introducing AVs by LaMondia et al. estimated that AVs would emerge as the preferred long-distance travel mode for less than 500 miles against private cars and airlines [78]. Other estimations of shifts in long-distance travel modes using the rJourney model in the U.S. indicated that wide acceptance of AVs as a long-distance travel mode would reduce U.S. domestic airline revenues by 53%, and that the advent of AVs would impact the destination choice of passengers [79]. Anticipation of how AVs and SAVs will affect travel across the Texas megaregion showed that domestic air travel is expected to fall by 82%, and congestion of roads is expected due to the 47% increase in vehicle miles traveled by the year 2040 unless regulatory policies like RP are implemented [80].

2.3. Adoption of SAVs

With recent advances in the field of AVs, SAVs have been presented as a solution to traffic-related problems. A study on the adoption of single-occupant SAVs in Singapore, using actual travel data, found that each SAV can replace three privately owned vehicles [81]. Fagnant and Kockelman designed an agent-based model for SAVs in a grid-based urban area to estimate the environmental benefits of adopting SAVs instead of conventional vehicles. The study concluded that each SAV could replace up to 11 conventional private vehicles, while on the other hand it would require 10% more travel distance [16]. A similar simulation in Austin, Texas, revealed that each SAV could replace nine CCs with an additional 8% traveled miles added to the trip [82]. Another study by Chen et al. produced a model showing that electric SAVs can have a similar per-mile cost compared to CCs for low-mileage households. Each electric SAV can replace nine conventional private vehicles and remain competitive against conventional carsharing services [83]. However, the last three mentioned studies [81] did not consider the ride sharing option in the simulation of SAVs, as they considered the SAV to operate as a driverless taxi. A study that accommodated ride-sharing options for a fully electric SAV fleet, as the adoption of electric vehicles is growing worldwide [84], investigated the implications of SAVs on the performance of the Budapest road network using simulation-based dynamic traffic assignment. The results showed that increasing the SAVs share would improve the overall network performance [85]. An analysis of the potential benefits of dynamic ride sharing using SAVs over traditional taxis in New York City demonstrated that the fleet size could be reduced by 59% without increasing the waiting time. A reduction of carbon emissions of up to 866 metric tonnes per day was also reported in the same study [86].
Similarly to AVs, the acceptability of SAVs is connected to individual’s status and attitudinal variables. Results of a stated choice survey indicate that young travelers are more attracted to the adoption of SAVs with dynamic ride sharing [5]. Similar results regarding young people’s willingness to adopt new transportation technologies were found by Tian et al., who added that consumers’ main concerns about SAVs as an alternative to car-sharing options are their cost, access time, and availability [87]. Merfeld et al. conducted a Delphi study on drivers, barriers, and future developments of car sharing with SAVs in the next ten years and found that a strong perception of technological aspects, consumer acceptance considerations, and legislative concerns are the most important factors in the adoption of SAVs [88]. In Italy, the inhabitant of Naples showed resistance to using future cars, as they are willing to pay more or spend additional travel time in traditional transport modes rather than using new traffic technologies for the same trip. The reason behind this reluctance is related to concerns over security and safety. However, the same research indicated that males and young bus or taxi users are less reluctant to use SAVs as driverless taxis than females and older users (above 40 years old), respectively [89].
SAVs with dynamic ride sharing implies that passengers would travel with strangers in the same vehicles for a certain period of time, and also entails an increase in travel time due to the loading and unloading of other passengers. Lavieri and Bhat examined these issues and found that trip purpose determines the anxiety towards these concerns. Travelers on a leisure trip are more sensitive to riding with strangers but are less sensitive to extra travel time and vice versa on a commute trip [90]. Nevertheless, various studies predict that AVs will likely function as pooled AVs. For example, a choice experiment showed that 61% of Swiss users opted for pooled AVs rather than private AVs [91]. A study on the willingness to pay for SAVs accommodating dynamic ride sharing with strangers used 70 questions in a stated preference survey and was answered by 2588 respondents; it suggested that willingness to pay for ride sharing will increase over time. The study also suggested that SAVs will be preferred for long-distance business travel [92].

3. Theoretical Background

This section investigates the latent variables which may affect the acceptability of RP, AVs, and SAVs. Many of them were drawn from a previously developed heuristic model [24,45,93,94] and are based on the theory of reasoned action and planned behavior [95,96]. Ajzen’s “Theory of planned behavior” aimed to anticipate the behavior of people in life’s different aspects and believed that most patterns of social behavior are consciously controlled. On the other hand, Fishbein and Ajzen’s “Theory of reasoned action” focuses on the relationship between behaviors and attitudes with regard to actions that determine a person’s behavior [46]. The latent variables were derived from the before-mentioned model due to its coherent methodology, clear concept of definitions, detailed research framework, and the acceptance of the method by the scientific community as reflected in its use in various publications [46,47,48]. The term acceptability refers to a potential decision regarding a hypothetical measure that would be presented in the course of time [45]. The following factors and their expected impact on the acceptability of RP, AVs, and SAVs are described below.
  • Awareness
People have lower levels of information about pricing measures like RP compared to other demand management measures like “improving PuT”. Lack of knowledge about RP results in a lower acceptability level [94]. The hypothesis is that those with more information about the RP scheme will be more receptive towards its implementation due to a higher awareness of its benefits and effectiveness. A similar concept applies to the adoption levels of AVs and SAVs.
  • Effectiveness
Perceived effectiveness represents the extent to which the policy objectives are achieved. For example, if the RP scheme is implemented in a city to achieve specific aims such as improving air quality, higher expectations of achieving the goals will result in higher acceptability of the scheme [45]. This implies a positive relationship between the acceptability of a measure and its perceived effectiveness [24,46,97]. However, people may justify their refusal of a coercive measure or policy by evaluating it as ineffective in the context of a strategic response [41]. This research makes a distinction between perceived effectiveness and personal effectiveness. The latter represents a change in travel behavior due to the application of the RP scheme; reducing the number of trips using personal cars after RP implementation is an example of personal effectiveness [41,56].
  • Social Norm
Social norm is a social factor that refers to the “perceived social pressure” to comply with certain behavior, where social pressure is defined as the perceptions, beliefs, and judgments of other households and community members. Both attitudes and social norms are grounded in the belief systems of an individual [98,99]. For instance, if close relations such as family or friends favor implementing a specific policy measure, this will create a positive social influence on the person to accept the same measure. Hence a policy or measure has a higher probability of being accepted if the social environment accepts it [22,24].
  • Sensing Traffic Problems
People who understand the implications of traffic-related problems are more open to accepting measures or policies that intend to mitigate their adverse effects [45]. However, according to empirical findings, this approach is not fully confirmed and needs to be ascertained. For example, stakeholders in Spain refused an RP measure despite perceiving traffic related issues as serious problems [100]. Rienstra et al., on the other hand, found a relationship between the acceptability of policy measures and problem perception, with the public supporting policy measures that improve safety, the environment, or reduce congestion [41]. The same concept can be applied to AVs and SAVs, as they are expected to reduce the impact of traffic-related problems [10,83].
  • Equity
One of the main reasons for the low acceptability of RP schemes is that people consider them to be unfair. Hence, perceived equity is one of the essential requirements for a scheme’s acceptability [101]. The “intrapersonal” component of perceived equity concerns the respondents’ personal cost–benefit ratio before and after applying the policy measure [24]. In our study, equity refers to perceived intrapersonal equity and this component is considered for analysis.
  • Fairness
Similar to equity, perceiving an RP scheme as fair is also a prerequisite for its successful implementation. This can be achieved by the appropriate utilization of expected revenues, which is proven to be an essential factor for the acceptability of RP schemes [44,101]. The fairness of an RP scheme can be assessed through perceived optimal revenue usage, the level of trust in their government, and the perception of other elements of fairness (e.g., RP should be implemented for all vehicles without exemptions; RP should vary according to the congestion level).
  • Travel Behavior and Attitudes
The items used to investigate the respondents’ travel behavior and attitudes are drawn from Haustein [102]. Mobility-related attitudes are measured using a five-point Likert scale. Travel behavior and attitudes of respondents are measured to evaluate how respondents interpret a certain behavior (e.g., cycling, walking, and using PuT).
  • Safety and Security
A number of studies have explored public opinion concerning new travel technologies and have shown that respondents regard safety as the paramount advantage and essential factor for adopting AVs and SAVs [65,103]. Some of the studies revealed concerns about the safety of AVs, such as a vehicle’s computer system being hacked or a vehicle’s system failure [73,104,105]. Other issues include legal liability, traveler privacy, and interactions with CC.
  • Socio-Demographic Characteristics
Schade and Schlag argued that socio-demographic characteristics might influence the acceptability of RP [45]. For instance, higher income groups should be more interested in the implementation of RP than lower income groups [41]. Moreover, other researchers found a relationship between socio-demographic characteristics and variables which might affect acceptability. For example, Wang et al. concluded that “gender, age, and education level have a significant effect on the perceived uncertainty about effectiveness and fairness of congestion charging” [106]. Conversely, the direct impacts of personal features on the acceptability of RP were found to be rather low in some studies [22,41]. On the other hand, other studies have found a relationship between age and adoption level of AVs and SAVs (e.g., younger travelers are more likely to use SAVs) [5,68].

4. Methods

This section describes the methods used in the study. The survey design will begin with a description of the valid response rate among the four countries of interest. This will be followed by an explanation of the survey instruments and analytical framework to provide a holistic picture of the study goals. Multiple statistical techniques were used in the study (i.e., factor analysis, MLR, and MNL). With the help of these techniques, a set of models were constructed. The purpose of the models is to answer the following research questions:
  • What factors play a role in affecting RP acceptability in the four countries of interest? Do socio-demographic characteristics (e.g., age and income) influence the RP acceptability in the four countries of interest?
  • What factors play a role in affecting the adoption of AVs and SAVs in the four countries of interest?
  • Do the added variables (e.g., RP_Awareness, AV_Perceived_Ease_of_Use, and Sensing_Traffic_Problems) significantly affect RP acceptability or the adoption of AVs and SAVs in the four countries of interest? How do the additional variables impact the acceptability of RP and willingness to adopt AVs and SAVs in the four countries of interest?
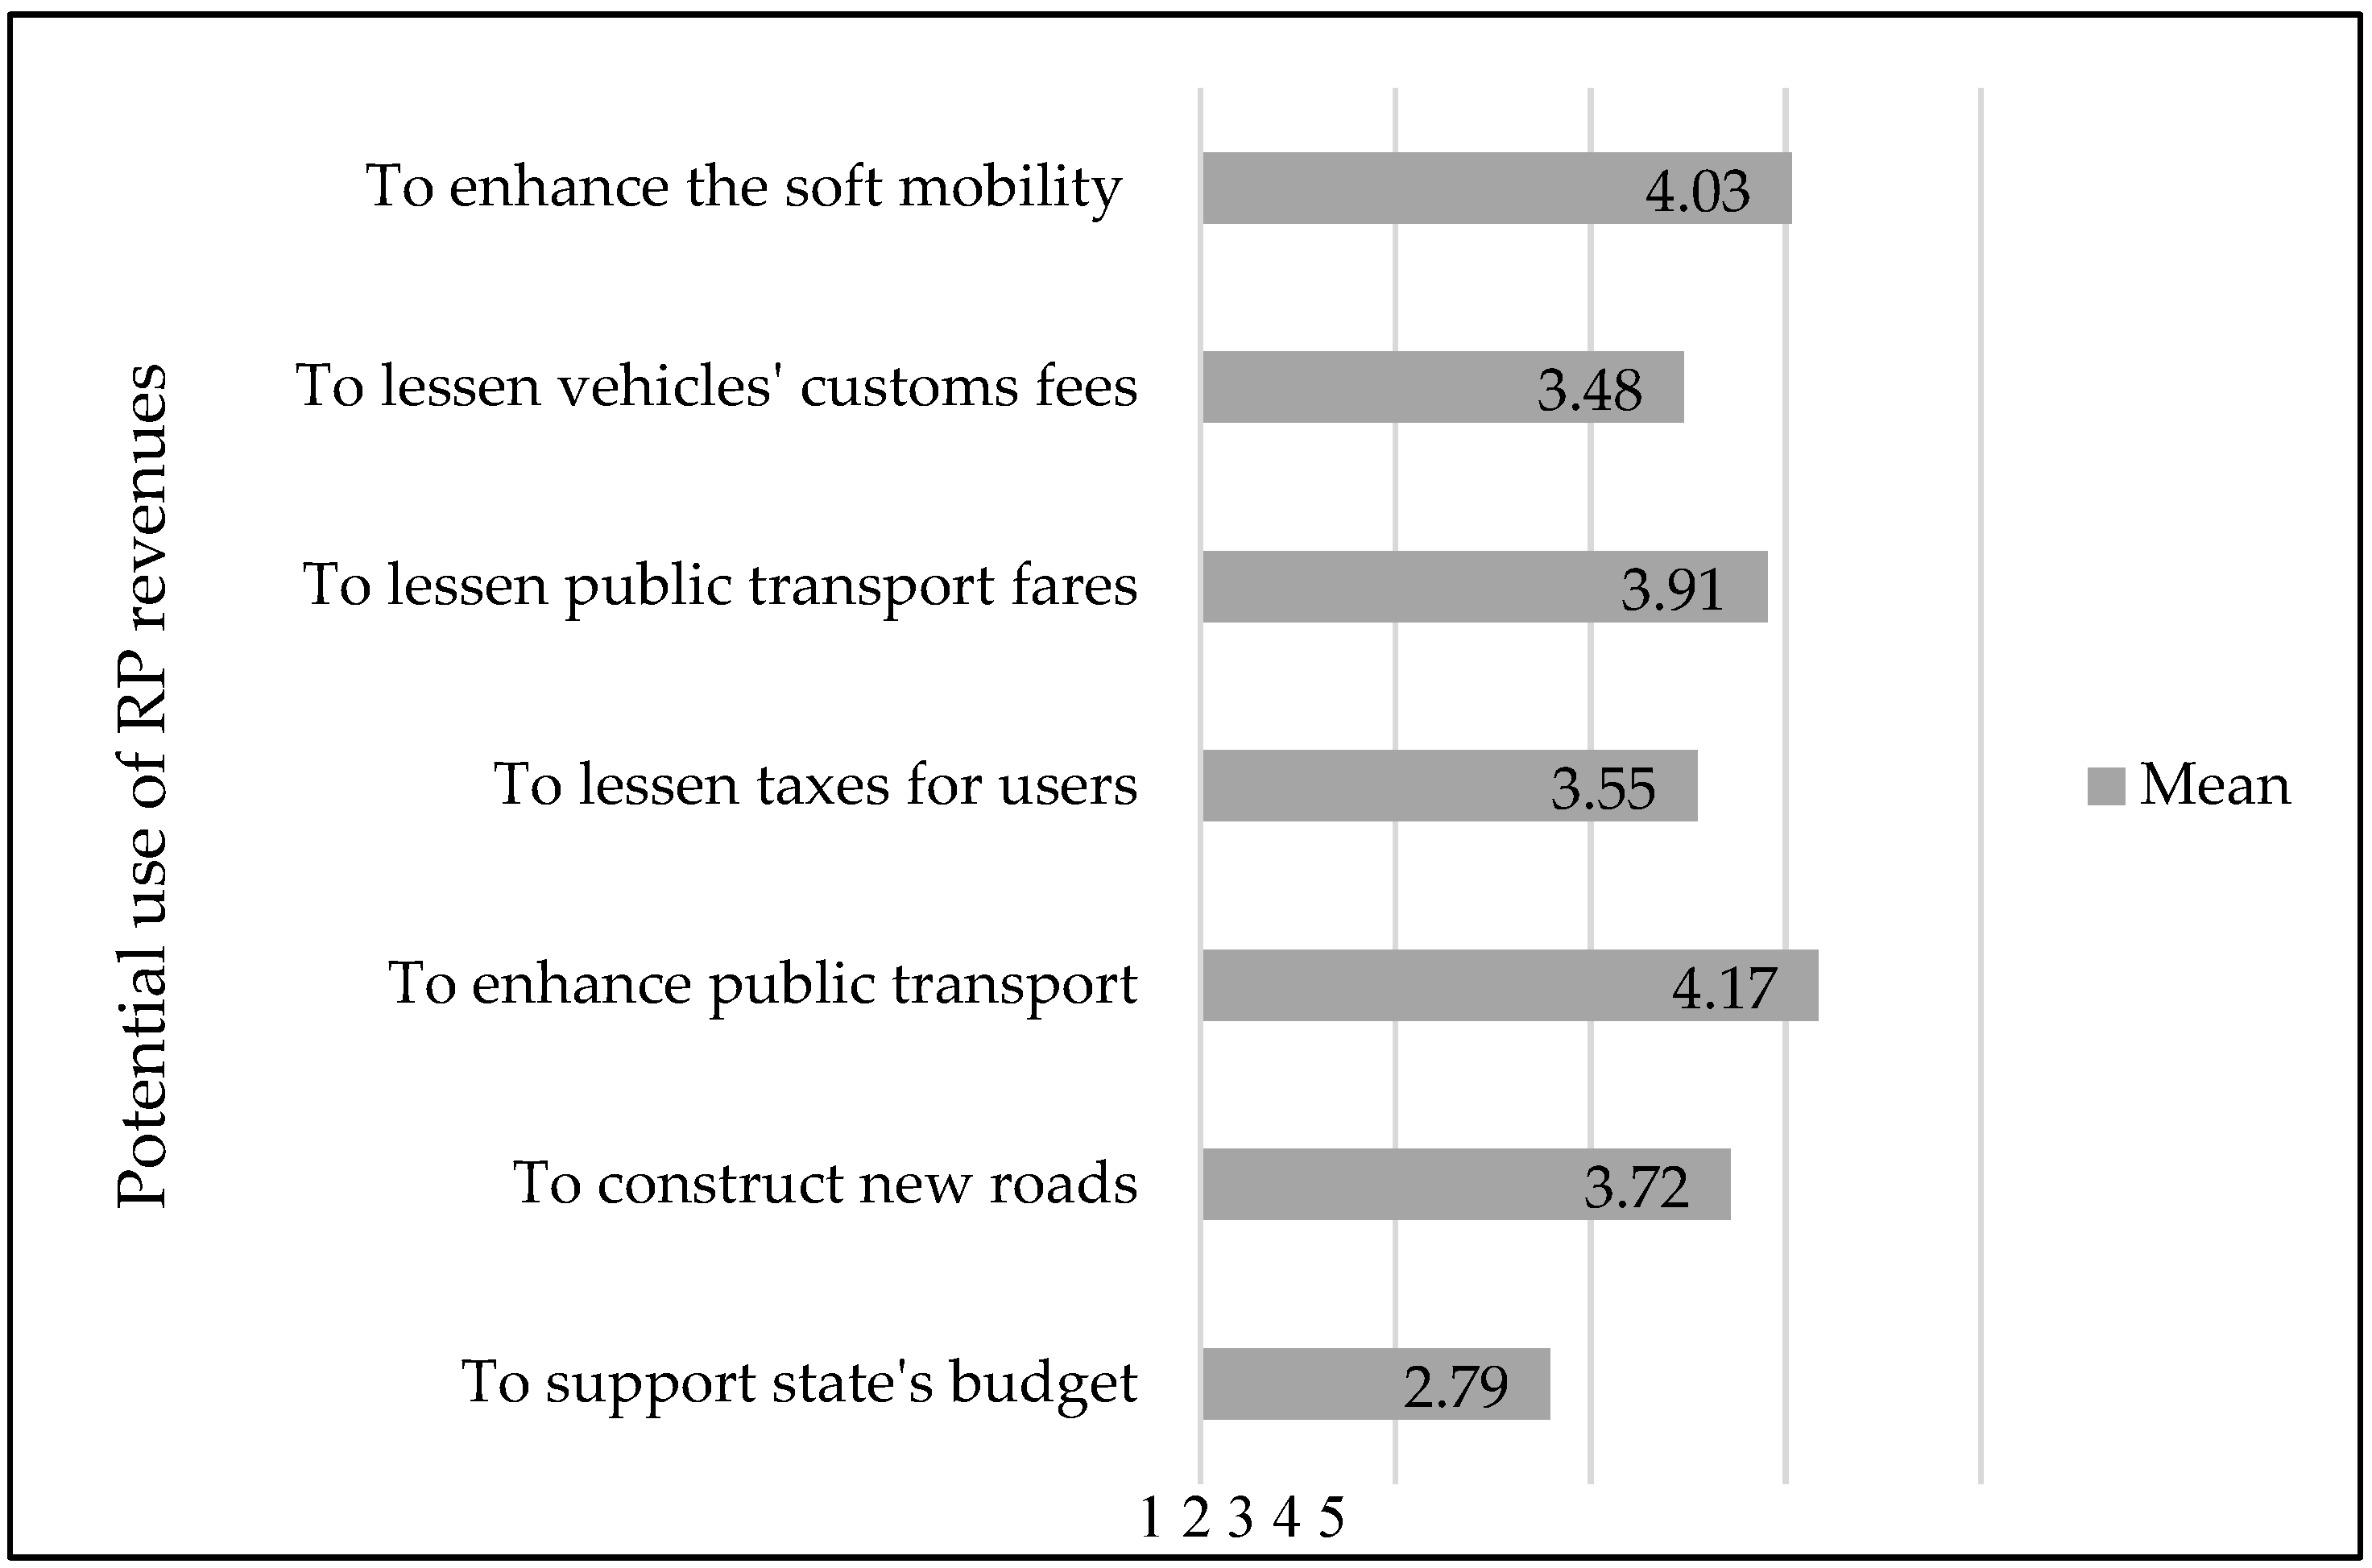
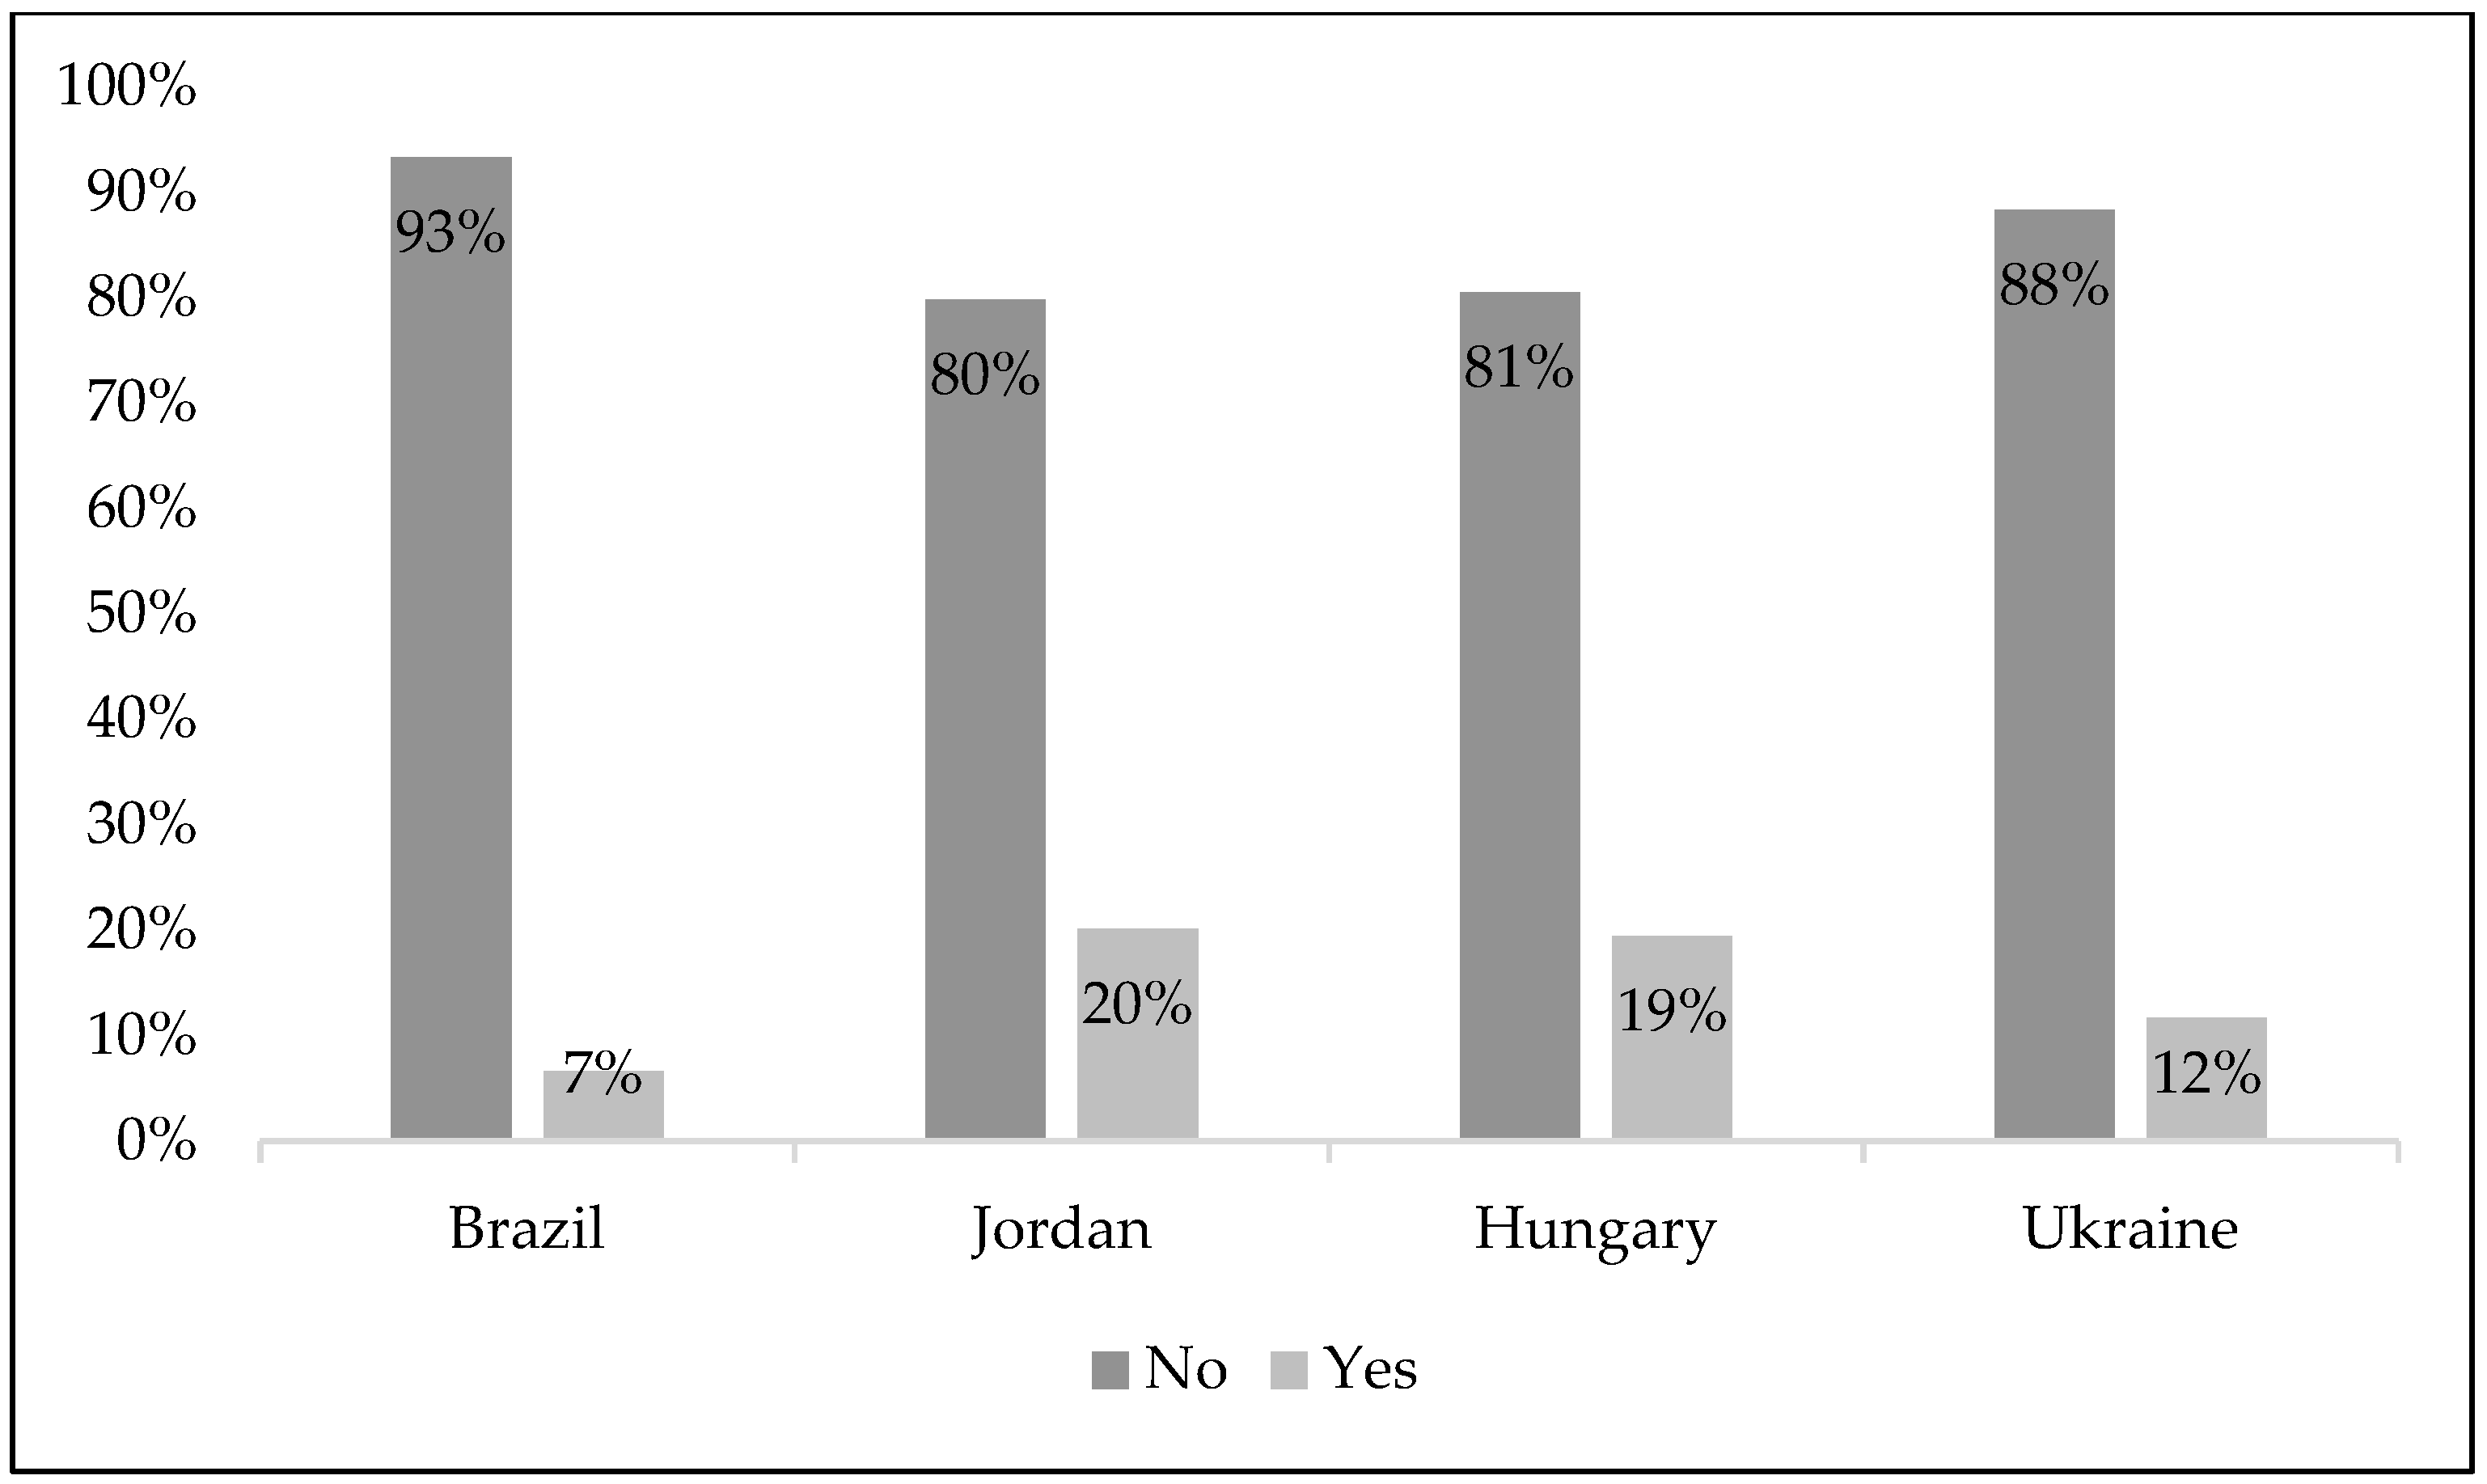
  • To what extent do the respondents from the four countries of interest perceive their governments as trustworthy in collecting RP tolls? In which areas do the respondents from the four countries of interest expect their government to spend the collected road toll?

4.1. Survey Design

An online survey was distributed simultaneously in Brazil and Jordan during January and February of 2020 and in Hungary and Ukraine during March and April of 2020. Qualtrics survey software was used to create the survey. Explanatory videos about RP, AVs, and SAVs were integrated into the survey to provide respondents with a better understanding of these concepts. These videos conveyed the information in the native languages of the respondents, which allowed a better understanding of the survey. In this way, a large amount of textual information was summarized rather than being included in the survey. The videos introduced respondents to AVs, SAVs, and RP. It was highlighted that AVs are driverless cars that do not require human intervention while driving; therefore, travel time can be used to engage in different activities such as reading, sleeping, working, and relaxing instead of driving. SAVs are treated as driverless shared taxis, which can be requested through a smartphone. This implies that other passengers with a similar destination may share the SAV, resulting in lower cost, less privacy, a lower level of comfort, and a longer waiting time. Information presented in the video regarding SAVs was drawn from Lokhandwala and Cai [86]. At the end of the video, the concept of RP was explained. As the responses have the potential to be significantly affected by how the introduced concepts are presented, the video was presented in a neutral manner, with no evaluative adjectives used to avoid the problem of induced bias and endogeneity. In addition, backward translation was carried out.
The survey was distributed randomly using social media platforms such as Facebook. Consequently, self-selection sampling was adopted, as the participants made the decision either to participate or not in the survey. Out of 1999 initial respondents to the survey, only 723 respondents completed it. Only the respondents who answered the questionnaire in more than 10 min and were declared as “A normal response” by Qualtrics were considered. The final number of total usable responses was 657, as detailed in Table 2. The valid response rate in this research ranged between 24% and 43% and fell within the range of response rates (20% and 54%) mentioned in [107,108], indicating that the distribution was wide and unbiased.
The questionnaire consisted of three main parts. First, questions about the behavioral response towards the latent variables which may influence RP acceptability and the adoption of AVs and SAVs were presented. Secondly, questions related to RP acceptability, future car choice, and the utilization of revenues were introduced (e.g., the respondents were asked to assess their level of acceptance of the application of road pricing in their cities based on a 5-point Likert scale from totally unacceptable (1) to totally acceptable (5)). Finally, the socio-demographic characteristics of respondents were collected.

4.2. Survey Instrument

This section presents the derivation of the factors from the original survey questions. Building a model utilizing raw survey questions may be challenging and can also result in a difficult interpretation of the results. Therefore, to overcome this issue, factor analysis is often applied. For example, the previously explained variable “perceived effectiveness” in the Section 3 resulted in two factors that were derived from nine items, as shown in Table 3. The items utilized to develop each of the investigated factors are presented in Table A1, Appendix A.

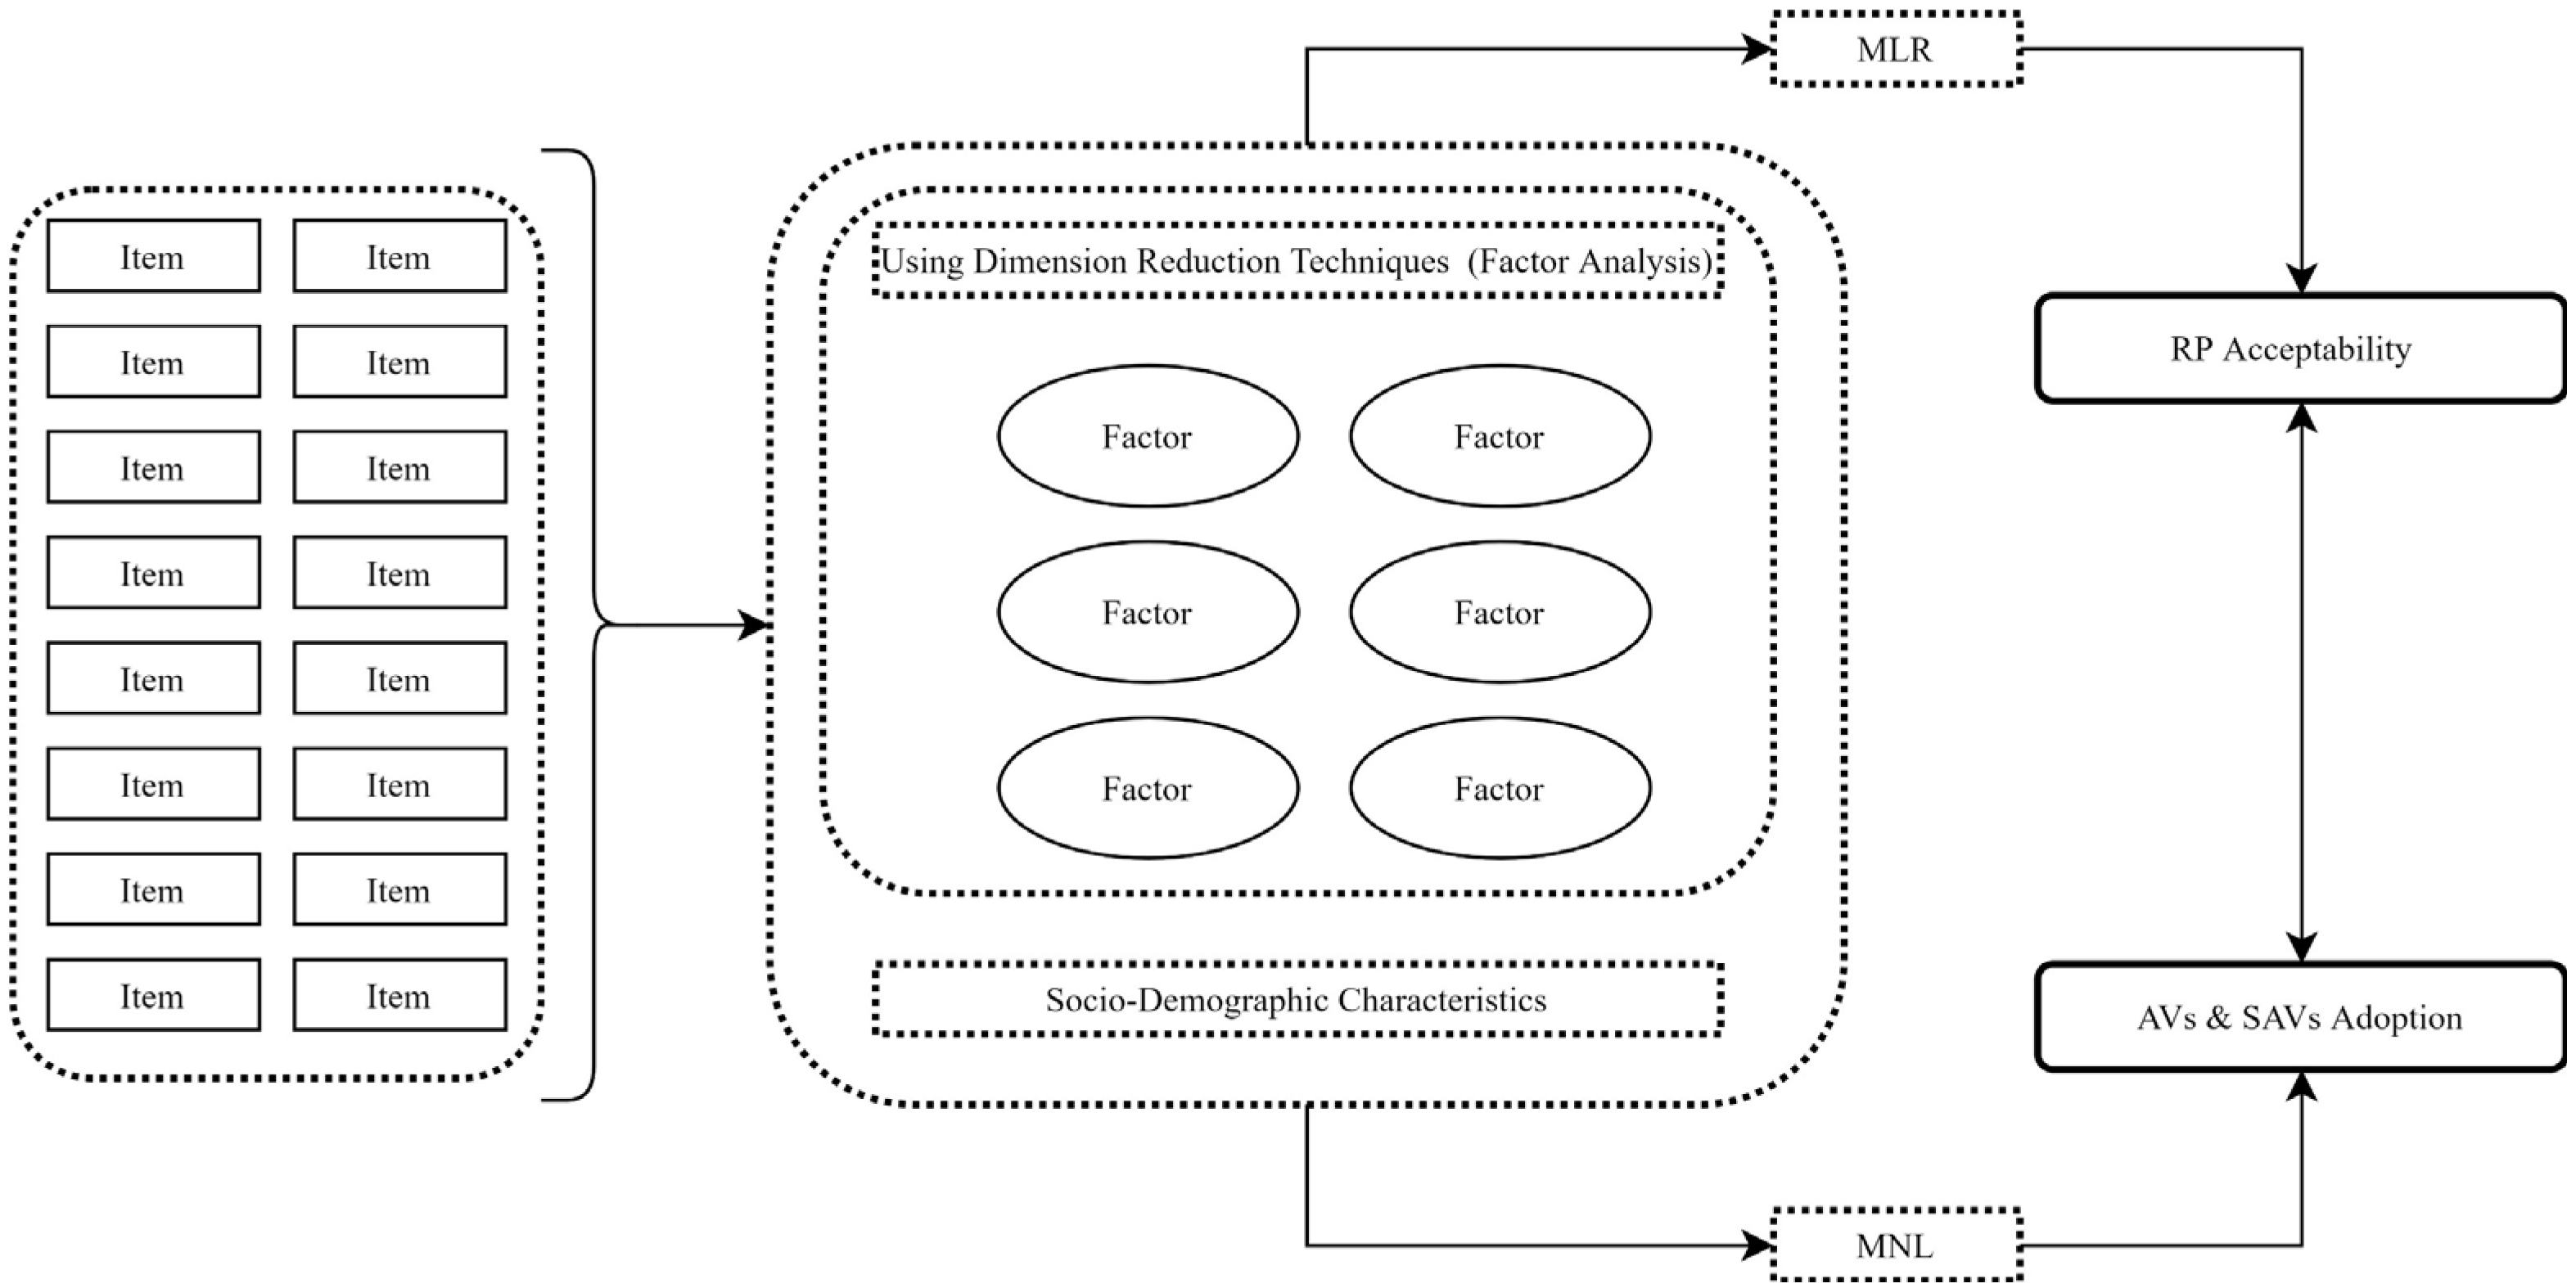
4.3. Analytical Methods

A two-step approach was applied in the data analysis. First, a factor analysis was conducted to reduce the large set of items into a lower number of factors. A principal components analysis was used as the extraction method with varimax rotation. Cronbach’s Alpha results indicated a sufficient level of internal consistency, with each factor explaining more than 50% of its total variance, except “AV_Safety_Security_Concerns” in the Jordan sample. All the extracted factors achieved satisfying results; a sample of the factor analysis results is shown in Table 4.
With the use of a dimension reduction technique (i.e., principal components analysis), the large initial set of items was reduced to a reasonable number of factors. Variables were checked for multicollinearity before the regression analysis, and no multicollinearity was found between the variables. Next, the selected factors with socio-demographic characteristics were used to understand RP acceptability through the use of MLR, while the AV and SAV adoption preferences were modeled with MNL. This is further depicted in Figure 1, where the items used and factors obtained are presented in Table A1 in Appendix A.

4.4. Descriptive Statistics

Table 5 shows the distribution of the socio-demographic characteristics in the form of “country profiles” for the four countries. A total of 657 valid responses were collected from the four countries, with Brazil having the highest share with about 39% of the total collected sample and Jordan having the second highest share with about 38%, while Hungary and Ukraine accounted for about 23% collectively. The age distribution of the respondents is relatively young, with all four countries having more than 70% of their respondents falling below the age of 38. The gender distribution was relatively balanced across the four selected countries. In each country, the higher income group was shown to be the smallest out of the three income levels. The majority of the respondents reported being educated, and those with a bachelor’s or a postgraduate degree (PhD or master’s) showed the highest number of responses compared with other educational levels. Similarly, regarding their employment status, the respondents reported being full-time workers, which mirrors the respondents’ age distribution. The results concerning driving licenses and car ownership illustrate the status of PuT in each of the four countries. Respondents from Brazil and Jordan report higher rates of having a driving license or owning a car compared to respondents from Hungary and Ukraine. This finding might reflect that the possibility of owning a vehicle increases in countries with lower quality of PuT.
The use of revenue is one of the most crucial factors that determines the public acceptance of RP [38,56]. An item was included in the questionnaire containing seven suggested approaches for using the revenue from RP. The answers are based on a Likert scale from 1 to 5 representing “Totally disagree” to “Totally agree”; the responses to this item can be seen in Figure 2. The respondents were shown to favor approaches pertaining to soft mobility, reducing vehicle taxes, reducing PuT and vehicle customs fees, improving PuT, and constructing new roads, with the exception being the approach that RP revenues should be used to support the state’s budget, where the average responses showed the lowest mean value. Figure 2 summarizes the results from the four countries together, showing that respondents from all four countries of interest showed a similar pattern in answering this question.
The reluctance of the respondents to use RP revenues to support the state budget can be inferred from Figure 3. The respondents were asked to state whether or not they trust the government using the revenues of RP. Figure 3 shows that most respondents in the four countries do not trust their governments to responsibly invest the collected revenues. Findings reflect the respondents’ lack of confidence in their respective governments in the four countries.

5. Results

This section presents and examines the effects of the investigated factors on RP acceptability using MLR. In addition, the results of AV and SAV adoption using MNL models are analyzed to understand individual preferences toward AVs and SAVs based on the investigated factors.

5.1. RP Acceptability

The effects of the investigated factors and socio-demographic characteristics on RP acceptability using MLR in Hungary, Jordan, Ukraine, and Brazil are presented in Table 6, which includes the factors’ estimated parameters, level of significance, and model fit. The socio-demographic characteristics are income and age. Overall, 20 parameters for each country were estimated for the RP acceptability model. The intercept significantly differs from zero in four models. The Hungarian model intercept is positive, indicating that Hungarian respondents would accept applying RP regardless of the effects of other factors, while a negative tendency is associated with respondents from other countries. While many of the estimated parameters vary across the countries, some of them were found to share a common sign.
Unsurprisingly, the “Environmental_Oriented_Users” factor has a significant positive effect on RP acceptability. This indicates that respondents who consider their environmental impact while planning their trips (e.g., using less polluting vehicles) are more likely to accept the implementation of RP. Similarly, in all models, “Social_Norm” is statistically significant and has a remarkable positive effect on RP acceptability; this implies that the respondents from the four countries can be positively influenced by their family and friends to accept the application of RP. The explained variance differed across countries of interest. Models of Hungary and Ukraine explained about 54.6% and 54.9% of the variation in RP acceptability, respectively, whereas the Brazilian model explained 31.4%. The least explanatory model was Jordan, with only 16.4%.

5.2. AV and SAV Adoption

The estimated parameters of the MNL models are presented in this section. Two models were generated for each country to assess the respondents’ behavior regarding the adoption of AVs and SAVs. Model 1 describes the vehicle choice as a function of 19 factors derived from the original survey’s questions using a factor analysis. Model 2 enumerates the estimation results for the MNL model, such that both Model 1 variables and individual-related variables were involved in this model. Model 2 was generated to determine the impact of the investigated factors in Model 1 plus the inclusion of socio-demographic characteristics and driving habit variables, including “Age”, “Income”, “Gender”, “Education”, “Employment”, “Driving license”, “Car ownership”, “Access to car as driver”, and “Access to car as passenger”.
Table 7, Table 8, Table 9 and Table 10 display the parameters of the two models for each country separately. The parameters of AVs and SAVs are relative to the reference mode CC. The models representing each country’s data are determined based on statistical tests like the Akaike information criterion (AIC), Bayesian information criterion (BIC), and McFadden R2.
The alternative specific constant (ASC) represents the mean of all unobserved resources of the utility. It could be noticed that ASCAV and ASCSAV are significantly different from zero in the MNL models. Based on the Hungarian responses, both constants have a positive sign; however, there is a preference for choosing AV over the other two modes. Regarding the Jordanian model, both ASCAV and ASCSAV are significant and positively affect the utility functions of these modes. Unlike Hungarian respondents, Jordanian respondents prefer SAVs over AVs and CCs. In terms of the Ukrainian responses, ASCSAV is associated with a negative sign, which increases the disutility of the SAV mode. Thus, based on the Ukrainian respondents’ viewpoint, CCs are still the preferred mode compared to SAVs. The responses from the Brazilian model show that ASCSAV is significant and positively affects the utility function, and SAVs are considered the most preferred mode.

6. Discussion

This section provides a discussion of the presented results from the previous section. The discussion is divided into three sub-sections. The Section 6.1 and Section 6.2 discuss the MLR and MNL, respectively. The Section 6.3 provides a summary of the results.

6.1. RP Acceptability

Road network congestion and its related issues are considered major problems in the transport sector. Therefore, regulatory traffic policies are needed to control travel demand and alleviate congestion. RP schemes are regarded as an effective solution to tackle such traffic-related problems; however, authorities are presented with the challenge of trying to implement RP schemes in an effective way that at the same time will not be rejected by the public. For example, Selmoune et al. reviewed eight cases of RP scheme implementation that were either accepted or rejected. This and other studies highlighted the difficulty in applying RP schemes without strong political and public support and acceptability [109,110]. Recently many studies have investigated the public acceptability of applying RP schemes in various countries [106,111]. In their studies, Gu et al. and Noordegraaf et al. stated that only four main factors of RP were used in most previous studies, namely equity, complexity, privacy, and uncertainty [51,112]. The current study expanded on these with the inclusion of other factors related to RP implementation as well as the adoption of AVs and SAVs to investigate the effect of these factors on RP acceptability in the era of AVs and SAVs.
The current research shows that the examined factors are significant and have a direct effect on RP acceptability. Moreover, income has a statistically significant effect on RP adoption only for Ukrainian respondents, while in the case of Jordan and Brazil, respondents’ age was shown to have a statistically significant effect on the acceptability of RP. The results differ in different national contexts, such that there are some fluctuations in the parameters that significantly affect the acceptability of RP in each country. It can be inferred from Table 6 that Hungarian respondents prefer applying RP in their cities. Although these models show irregularity in the parameters across the investigated countries, the “Environmental_Oriented_Users”, “Negative_Expectations_RP”, and “Social_Norm” variables are statistically significant and positively affect RP acceptability in all countries. This study showed that there is a significant and direct effect of the AV-related variables on RP acceptability except in the case of “AV_Perceived_Ease_of_Use”, which is statistically significant only in the case of Hungary. Consequently, only the Hungarian respondents who expect that using AVs will be easy are more likely to accept RP schemes.

6.2. AV and SAV Adoption

This section discusses the effects of the investigated factors, travel behavior and attitudes, and socio-demographic characteristics on preferred transport mode choice (AV, SAV, CC). It is inferred from the results that most of the factors considered have a major role in determining preferences toward choosing and adopting AVs and SAVs. Particularly, “AV_Awareness” was associated with a positive attitude toward AVs and SAVs, which shows that respondents who have more knowledge of new technologies are more likely to prefer AVs and SAVs relative to CCs. An exception can be seen in the Ukrainian and Brazilian models, which demonstrate the opposite perspective toward the adoption of both AVs and SAVs. The results showed that respondents who enjoy driving are less likely to choose AVs and SAVs, which is compatible with previous research findings [113,114]. Not surprisingly, the “Environmental_Oriented_Users” factor was positively significant in all countries except Ukraine, so respondents with high sensitivity towards environmental issues have a high propensity to use AVs and SAVs [113]. In all models, respondents willing to share their trips with others are more likely to use AVs and SAVs. Additionally, the estimated parameter for SAVs outweighs those of AVs in all models except the Hungarian, which means those who desire to share their daily transport mode with others have more acceptance of using SAVs than AVs.
Respondents with more interest in new technologies like AVs, measured by the “Technology_Interest” factor, have a positive attitude toward adopting AVs and SAVs. The Hungarian model is the exception in this case, as it demonstrates that this variable was associated with a significant negative tendency toward AV and SAV adoption; this can be interpreted according to Schade and Schlag, who stated that having more information about the scheme might lead to higher evaluation and assessment and consequently higher reluctance to accept it [24]. In both Jordan and Ukraine, the “Cost_Oriented_Users” factor that represents respondents sensitive to the trip cost (i.e., those who regard trip cost as the most important factor in planning a trip) are more likely to choose AVs and SAVs. Moreover, the estimated parameter associated with SAVs is greater than AVs, reflecting a higher tendency to use SAVs. A probable reason for these findings could be that people assume AVs optimize the road network, decrease travel time, and reduce travel costs [62,73,104]. In contrast, an opposite attitude is found in the Hungarian model, where respondents were less likely to choose AVs and SAVs. This significant negative relation in the Hungarian model could be due to concerns about the high prices of new technologies, as is consistent with previous research [15,104,105]. Those who consider traffic-related issues as major or serious problems (e.g., congestion, air pollution, and traffic noise) are less likely to choose Avs and SAVs. This disutility could be explained by considering that respondents do not consider self-driving vehicles to be helpful in reducing such traffic problems. An exception is found in the Jordanian model, where this variable was associated with significant positive attitudes.
For the respondents in Jordan, Hungary, and Ukraine, the factor “RP_Perceived_Anxiety” was associated with a positive attitude toward adopting Avs and SAVs. Those who prefer changing their route instead of paying tolls are more likely to choose Avs and SAVs; on the contrary, this factor was associated with a negative attitude toward using Avs for Brazilian respondents. The “Equity” factor was statistically significant and associated with a positive attitude toward choosing Avs and SAVs. Respondents who realize that RP will provide them with benefits are more likely to use Avs and SAVs. It can be noticed that an increase in the level of education also increases the likelihood of choosing Avs and SAVs. The results do not demonstrate a strong relationship between age and the tendency to use any of the hypothetical alternative modes. A negative statistically significant relationship associated with an increase in age is only revealed in the Brazilian model, which means that older individuals are relatively less likely to select Avs and SAVs. This stands in contrast to the assumption that Avs could be an attractive transport mode for the elderly [10]. Gender was not statistically significant in any of the models except for the Jordanian models, where males were significantly associated with a negative attitude toward adopting Avs and SAVs.

6.3. Result’s Summary

This section summarizes the effects of the investigated factors on the acceptability of RP and the adoption of Avs and SAVs. As shown in Table 11, there is heterogeneity in the significance of these factors as well as their effects, whether positive (✔) or negative (✖) or insignificant (empty cells). The factors behave differently in the four countries. Although most of the factors are significant in most countries, none of the factors managed to significantly affect RP acceptability, AV choice, and SAV choice in all countries at once. Considering the significant factors only and looking closely at their impact on each of the three dependent variables (RP acceptability and AV and SAV choice) separately, it can be noticed that few of these factors have the same influence in all countries.
For example, in all countries “Environmental_Oriented_Users” and “Willingness_to_Share” factors have a positive impact on AV and SAV choice, respectively. Similarly, the “Enjoy_Driving” and “AV_Safety_Security_Concerns” factors have a negative impact on AV and SAV choice, respectively, while the influence of the other factors fluctuates between positive, negative, and non-significant. This can be explained by the presence of unobserved factors that affect people’s behavior based on the circumstances of every country. These results are logical as residents of every country have different perspectives, cultures, economic situations, and other relevant characteristics. Regarding the socio-demographic characteristics, the results show that they play a more vital role in AV and SAV adoption than in RP acceptability. Moreover, in line with a previous study [28], the results revealed that the attitudinal variables have more influence on RP acceptability than socio-demographic characteristics.
Finally, the main findings of this research show that respondents who enjoy driving are less likely to choose AV, while respondents who desire to share their trips with others prefer SAV. People who care about the environment while travelling are more willing to accept RP and prefer AV and SAV over CC. People can be positively influenced by their family and friends to accept RP schemes.

7. Conclusions

In conclusion, this study investigates the effect of attitudinal factors and socio-demographic characteristics on RP acceptability and AV and SAV adoption. The results of the current study show that respondents from different countries have different behaviors regarding RP acceptability and AV and SAV adoption. Such findings are in line with previous research by Fürst and Dieplinger, who replicated the AFFORD study [45] in Vienna to investigate the factors that affect the acceptability of RP. They concluded that “both studies differ in terms of influencing factors” [46]. In terms of RP acceptability, according to the responses obtained, all investigated factors have a significant effect on RP acceptability in most or all of the studied countries. An exception can be seen in the factor “AV_Perceived_Ease_of_Use” which is significant only in the Hungarian model. Socio-demographic characteristics do not show a strong significant relationship with RP acceptability. Among the factors used, it was found that the following factors, “Environmental_Oriented_Users”, “Negative_Expectations_RP”, and “Social_Norm” are statistically significant and positively affect RP acceptability in all countries from the respondents’ perspective. Hungarian respondents would accept applying an RP scheme regardless of the effect of other factors, while a negative tendency is found for respondents from other countries.
Regarding AV and SAV adoption, the examined factors have a significant effect on the respondent’s adoption of AVs and SAVs in all or most of the countries. The “Environmental_Oriented_Users” factor is positively significant in all countries except Ukraine. Similarly, respondents willing to share their trips with others due to the application of RP are more likely to use AVs and SAVs. It can also be seen that respondents with a high level of education are more likely to adopt AVs and SAVs. The results do not demonstrate a strong relationship between age and the tendency to use any of the presented alternative transportation modes. Furthermore, the results show that respondents do not trust their government to use the revenues from road tolls to support the state’s budget, and they prefer more clear and transparent approaches to using RP revenues.
Finally, the results show that the examined factors influence the acceptability of RP and the adoption of AVs and SAVs, demonstrating the interrelationship between them and the importance of their simultaneous study. For instance, people who enjoy driving are less willing to opt for AV, while those willing to share their trips are more likely to choose SAV. Family and friends can positively influence people to accept RP schemes, and people who consider the environment are more likely to accept RP and choose AVs and SAVs [29,112]. People in the four countries lack confidence in their governments to use the RP revenues appropriately. They require the allocation of RP revenues be utilized explicitly and for particular uses, such as improving PuT.

7.1. Insights for Policy Implication

Results of this research can provide meaningful insights to stakeholders and policymakers for anticipating and planning policy controls related to the adoption of AVs and SAVs and RP acceptability in the transportation sector. It is difficult to generalize the policy implications derived from this research due to the small sample size; however, some factors in the analyzed models have almost the same effect on RP acceptability and AV and SAV adoption across the investigated countries. We shed light on the effect of these factors in this section.
The results demonstrate that respondents’ awareness of new technologies and RP is an important factor in their adoption and implementation. Therefore, educational campaigns through different platforms and various methods should be held to inform people about the expected benefits of driverless vehicles and RP, which will help raise their acceptability. Similarly, the “Environmental_Oriented_Users” factor positively affects RP acceptability. Gaining the support of this group by spreading the word about the environmental benefits of implementing RP schemes will facilitate the authorities’ task in applying such changes in their countries. Additionally, respondents want their governments to use RP revenues in areas where the residents can feel their impact, such as enhancing PuT systems. Such policies are critical as the respondent’s trust is very low in government entities regarding the use of revenues. Therefore, it is advised to clearly explain the methods of utilizing the revenues from RP to satisfy the public’s requirements so that authorities can reduce the trust gap with their citizens. Furthermore, RP schemes that provide benefits to citizens are seen as more acceptable. Policy makers should thus consider giving special attention to these aspects.
It is evident from the results that respondents who are willing to share their trips with others are more open to accepting RP and using AVs and SAVs. This point can be utilized by promoting and allowing ride sharing services to operate freely; as the number of users of these services increases, the acceptability of RP, AVs, and SAVs is likely to increase. Respondents with safety and security concerns about AVs and SAVs are reluctant to use them. This information can be used to devise policies to promote the safety and security features of AVs and SAVs and reduce the anxiety of using these new travel modes. Most likely, the public will initially resent the implementation of RP, AVs, and SAVs; the results of this research shed light on the potential reasons for such rejection (e.g., safety and security concerns) and the positive influencing factors (e.g., environmentally oriented users). Consequently, public agencies can further elaborate on these insights to motivate the public to be in favor of RP, AVs, and SAVs. Moreover, this research shows that neither RP acceptability nor AVs and SAVs adoption can be generalized over a large population; therefore, city-specific policies will be necessary to efficiently shift the transportation mode from CCs to AVs and SAVs and, similarly, to increase the acceptability of RP.

7.2. Limitations and Directions for Future Research

This study paves the way to incorporate two research topics, RP acceptability and the adoption of AVs and SAVs, into a single study. However, the research faces a set of limitations. The first limitation can be identified in the sample size, which is relatively small compared to the total population of the selected countries. This is likely a consequence of the utilization of online questionnaires, which favor youth and individuals who have access to the internet. Although the online questionnaire provided a video to establish a unified perception of RP, AVs, and SAVs, it is still doubtful whether all the respondents have come to the same conclusion after watching the short video. Therefore, the use of the results in the context of the larger population groups should be carried out critically. Directions for further research are also possible and highly recommended. There are several approaches in regard to future research. Researchers can include new variables (e.g., cost, maintenance cost, technology maturity, AVs, SAVs perceived safety, AVs, SAVs legal liability, or AVs, SAVs perceived comfort). Moreover, they may conduct research, relying on a large sample size, using a prototype of AVs and SAVs alongside RP. This allows them to gain more useful insights into how the presence of RP and the inclusion of AV and SAV experience is likely to influence potential users to accept the concept of RP, AVs, and SAVs. In addition, future research may use a stated preference experiment to explore the effect of RP attributes (e.g., toll value) on AV and SAV adoption, which can give more insight into how different RP tolls could affect vehicle adoption.

Author Contributions

Conceptualization, M.S. and F.M.; methodology, M.S., M.H., B.E. and F.M.; software, M.S., M.H. and B.E.; formal analysis, M.S., M.H. and B.E.; data curation, M.S., M.H. and B.E.; writing—original draft preparation, M.S., M.H. and B.E.; writing—review and editing, M.S. and F.M.; supervision, F.M. All authors have read and agreed to the published version of the manuscript.

Funding

This research received no external funding.

Institutional Review Board Statement

Not applicable.

Informed Consent Statement

Not applicable.

Data Availability Statement

Not applicable.

Acknowledgments

We extend our deepest gratitude to everyone who participated in this survey, especially Engineer Manoel V. A. Oliveira, Engineer Rodrigo N. de Souza, Engineer Yasmin F. C. Quirino from Brazil, Abdallah Al-Shatanawi from Jordan, and Yevhenii Kutsenko from Ukraine for facilitating survey translation into the local languages and helping to distribute the survey. Special thanks to Zsolt Berki and Fatma Abdelkhalek for their critical review, advice, and invaluable assistance with data analysis.

Conflicts of Interest

The authors declare no conflict of interest.

Appendix A

The items below were used to extract the investigated factors. The respondents were asked to assess their level of agreement with the items based on a 5-point Likert scale from strongly disagree (1) to strongly agree (5).
Table A1. Items used to extract factors from original survey’s questions.
Awareness
AV_Awareness
Item 1I am aware of the concept of autonomous cars.
Item 2I am familiar with the topic of autonomous cars.
Item 3I am confident that I am able to explain what an autonomous car is to anyone.
RP_Awareness
Item 4I am aware of the concept of road pricing.
Item 5I am familiar with the topic of road pricing.
Travel Behavior and Attitudes
PuT_Users
Item 6I use public transport on a regular basis.
Item 7I commute using public transport.
Item 8I rely on public transport for the majority of my trips.
Enjoy_Driving
Item 9I enjoy driving.
Item 10Driving is exciting to me.
Item 11I like the feeling of being in full control of my car.
Cycling_Users
Item 12I cycle on a regular basis.
Item 13I commute by cycling.
Item 14I rely on cycling for the majority of my trips.
Walkers
Item 15I walk on a regular basis.
Item 16I commute by walking.
Item 17I rely on walking for the majority of my trips.
Technology_Interest
Item 18I think autonomous cars will be fun.
Item 19I desire to learn about autonomous cars.
Item 20I am excited to experience autonomous cars.
Cost_Oriented_Users
Item 21The price of my trip will significantly influence my transport mode.
Item 22My main priority is to travel at the lowest possible price.
Environmental_Oriented_Users
Item 23The emission of my trip will significantly influence my transport mode.
Item 24My main priority is to travel using less polluting vehicles.
Item 25I take into consideration the environmental impact of my trip.
Sensing Traffic Problems
Sensing_Traffic_Problems
Item 26I notice traffic congestion on a regular basis.
Item 27I think road traffic is the primary source of air pollution.
Item 28I think traffic causes a lot of noise, annoyance and disturbance.
Item 29I think car parking is a significant problem.
Item 30I think the public transport system is inadequate.
Item 31I observe many traffic accidents and incidents on a daily basis.
Perceived Effectiveness
Perceived_Usefulness_RP
Item 32I think the application of road pricing is likely to reduce travel time.
Item 33I think the application of road pricing is likely to decrease the congestion level.
Item 34I think the application of road pricing is likely to reduce air pollution.
Item 35I think the application of road pricing is likely to reduce noise, annoyance, and disturbance.
Item 36I think the application of road pricing is likely to result in a better fuel economy.
Item 37I think the application of road pricing is likely to reduce the number of accidents and incidents.
Negative_Expectations_RP
Item 38I think the application of road pricing is likely to increase the price of the trip.
Item 39I think the application of road pricing is likely to make public transport modes more crowded.
Item 40I think the application of road pricing is likely to result in increasing social inequality among the citizens.
Personal Effectiveness
Willingness_to_Share
Item 41If road pricing is applied, I think that I will use public transport more in the future.
Item 42If the road pricing is applied, I think that I will reduce the number of unnecessary trips that I make on a daily basis.
Item 43If the road pricing is applied, I think that I will start using shared autonomous vehicles more in the future.
Item 44If the road pricing is applied, I think that I will share my cars with others in the future.
RP_Perceived_Anxiety
Item 45If road pricing is applied, I will protest against it.
Item 46If the road pricing is applied, I will change my traveling routes to avoid paying the tolls.
Item 47If the road pricing is applied, I am afraid that I would not understand how road pricing works.
Safety and Security
AV_Safety_Security_Concerns
Item 48 I will be worried if any equipment or system fails in autonomous cars during any adverse conditions (e.g., heavy rainfall, fog).
Item 49I am afraid about the legal liability for owner(s)/ operator(s) of autonomous cars.
Item 50I am concerned about the possibility of autonomous cars’ computer systems being hacked.
Item 51I am concerned about data privacy when using autonomous cars (e.g., disclosure of my travel destinations to third parties).
Item 52I am concerned how autonomous cars will interact with other road users (e.g., conventional vehicles and bicycles).
Item 53I think autonomous cars will not be safe to use.
Item 54I will not feel secure to use autonomous cars on a daily basis.
AV_Perceived_Ease_of_Use
Item 55I think it will be easy to learn how to use autonomous cars.
Item 56I think autonomous cars will be simple to control.
Item 57I think autonomous cars will be easy to use.
Social norms concerning RP acceptability
Social_Norm
Item 58People whose opinions are important to me think that I should accept the application of road pricing.
Item 59My friends, family, and colleagues expect me to accept the application of road pricing.
Equity
Equity
Item 60I think the application of road pricing will be in my favor.
Item 61I think the application of road pricing will benefit me more than other road users.
Fairness
Fairness
Item 62I think road pricing should be implemented for all vehicles without exemptions.
Item 63I think road pricing should vary according to the congestion level.
Item 64I think road pricing should vary according to the quality of the road

References

  1. Lindsay Funicello-Paul Navigant Research Names Waymo, Ford Autonomous Vehicles, Cruise, and Baidu the Leading Developers of Automated Driving Systems. Available online: https://www.businesswire.com/news/home/20200407005119/en/Navigant-Research-Names-Waymo-Ford-Autonomous-Vehicles (accessed on 20 May 2020).
  2. Muoio, D. RANKED: The 18 Companies Most Likely to Get Self-Driving Cars on the Road First. Available online: https://www.businessinsider.com/the-companies-most-likely-to-get-driverless-cars-on-the-road-first-2017-4 (accessed on 20 May 2020).
  3. Autovista Group. The State of Autonomous Legislation in Europe. Available online: https://autovista24.autovistagroup.com/news/state-autonomous-legislation-europe/ (accessed on 20 May 2020).
  4. NCSL Autonomous Vehicles|Self-Driving Vehicles Enacted Legislation. Available online: https://www.ncsl.org/research/transportation/autonomous-vehicles-self-driving-vehicles-enacted-legislation.aspx (accessed on 20 May 2020).
  5. Krueger, R.; Rashidi, T.H.; Rose, J.M. Preferences for Shared Autonomous Vehicles. Transp. Res. Part C Emerg. Technol. 2016, 69, 343–355. [Google Scholar] [CrossRef]
  6. van den Berg, V.A.C.; Verhoef, E.T. Autonomous Cars and Dynamic Bottleneck Congestion: The Effects on Capacity, Value of Time and Preference Heterogeneity. Transp. Res. Part B Methodol. 2016, 94, 43–60. [Google Scholar] [CrossRef]
  7. Simoni, M.D.; Kockelman, K.M.; Gurumurthy, K.M.; Bischoff, J. Congestion Pricing in a World of Self-Driving Vehicles: An Analysis of Different Strategies in Alternative Future Scenarios. Transp. Res. Part C Emerg. Technol. 2019, 98, 167–185. [Google Scholar] [CrossRef] [Green Version]
  8. Chen, Y.; Wenyuan, X.; Jianhao, L. Can You Trust Autonomous Vehicles: Contactless Attacks against Sensors of Self-Driving Vehicle. Def. Con. 2016, 24, 109. [Google Scholar]
  9. Mitropoulos, L.; Kouretas, K.; Kepaptsoglou, K.; Vlahogianni, E. A Total Cost of Ownership Model for Hybrid, Electric Semi-Automated, and Automated Vehicles: A Case Study for France 2022. In Proceedings of the Transportation Research Board 101st Annual Meeting, Transportation Research Board, Washington, DC, USA, 9–13 January 2022; Available online: https://trid.trb.org/view/1996359 (accessed on 3 October 2022).
  10. Fagnant, D.J.; Kockelman, K. Preparing a Nation for Autonomous Vehicles: Opportunities, Barriers and Policy Recommendations. Transp. Res. Part A Policy Pract. 2015, 77, 167–181. [Google Scholar] [CrossRef]
  11. Shatanawi, M.; Alatawneh, A.; Mészáros, F. Implications of Static and Dynamic Road Pricing Strategies in the Era of Autonomous and Shared Autonomous Vehicles Using Simulation-Based Dynamic Traffic Assignment: The Case of Budapest. Res. Transp. Econ. 2022, 101231. [Google Scholar] [CrossRef]
  12. Litman, T. Autonomous Vehicle Implementation Predictions: Implications for Transport Planning; Victoria Transport Policy Institute: Victoria, BC, Canada, 2020; p. 45. [Google Scholar]
  13. Wadud, Z.; MacKenzie, D.; Leiby, P. Help or Hindrance? The Travel, Energy and Carbon Impacts of Highly Automated Vehicles. Transp. Res. Part A Policy Pract. 2016, 86, 1–18. [Google Scholar] [CrossRef] [Green Version]
  14. Shatanawi, M.; Mészáros, F. Implications of the Emergence of Autonomous Vehicles and Shared Autonomous Vehicles: A Budapest Perspective. Sustainability 2022, 14, 10952. [Google Scholar] [CrossRef]
  15. Howard, D.F.; Dai, D. Public Perceptions of Self-Driving Cars: The Case of Berkeley, California. Available online: https://www.semanticscholar.org/paper/Public-Perceptions-of-Self-Driving-Cars%3A-The-Case-Howard-Dai/39a10ac3ad0ab01bce3aa5d323f9700e53f7f34e (accessed on 20 May 2020).
  16. Fagnant, D.J.; Kockelman, K.M. The Travel and Environmental Implications of Shared Autonomous Vehicles, Using Agent-Based Model Scenarios. Transp. Res. Part C Emerg. Technol. 2014, 40, 1–13. [Google Scholar] [CrossRef]
  17. Ministry of Transport. Road Pricing: The Economic and Technical Possibilities; H.M. Stationery Office: London, UK, 1964.
  18. May, A.D. Road Pricing: An International Perspective. Transportation 1992, 19, 313–333. [Google Scholar] [CrossRef]
  19. Wang, Y.; Peng, Z.; Wang, K.; Song, X.; Yao, B.; Feng, T. Research on Urban Road Congestion Pricing Strategy Considering Carbon Dioxide Emissions. Sustainability 2015, 7, 10534–10553. [Google Scholar] [CrossRef]
  20. Munir, T.; Dia, H.; Ghaderi, H. A Systematic Review of the Role of Road Network Pricing in Shaping Sustainable Cities: Lessons Learned and Opportunities for a Post-Pandemic World. Sustainability 2021, 13, 12048. [Google Scholar] [CrossRef]
  21. Heyns, W.; Schoeman, C.B. Urban Congestion Charging: Road Pricing as a Traffic Reduction Measure. In Proceedings of the Urban Transport XII: Urban Transport and the Environment in the 21st Century; WIT Press: Prague, Czech Republic, 2006; Volume 1, pp. 923–932. [Google Scholar]
  22. Jakobsson, C.; Fujii, S.; Gärling, T. Determinants of Private Car Users’ Acceptance of Road Pricing. Transp. Policy 2000, 7, 153–158. [Google Scholar] [CrossRef]
  23. Rouhani, O. Next Generations of Road Pricing: Social Welfare Enhancing. Sustainability 2016, 8, 265. [Google Scholar] [CrossRef] [Green Version]
  24. Schade, J.; Schlag, B. Acceptability of Urban Transport Pricing; VATT-Tutkimuksia; Valtion Taloudellinen Tutkimuskeskus: Helsinki, Finland, 2000; ISBN 9789515613547. [Google Scholar]
  25. Shatanawi, M.; Boudhrioua, S.; Mészáros, F. Comparing Road User Charging Acceptability in the City of Tunis and Damascus. MATEC Web Conf. 2019, 296, 02002. [Google Scholar] [CrossRef]
  26. Ryley, T.; Gjersoe, N. Newspaper Response to the Edinburgh Congestion Charging Proposals. Transp. Policy 2006, 13, 66–73. [Google Scholar] [CrossRef] [Green Version]
  27. Vrtic, M.; Schuessler, N.; Erath, A.; Axhausen, K.W. Design Elements of Road Pricing Schemes and Their Acceptability; ETH: Zurich, Switzerland, 2007. [Google Scholar]
  28. Jaensirisak, S.; Wardman, M.; May, A.D. Explaining Variations in Public Acceptability of Road Pricing Schemes. J. Transp. Econ. Policy 2005, 39, 127–153. [Google Scholar]
  29. Kottenhoff, K.; Brundell Freij, K. The Role of Public Transport for Feasibility and Acceptability of Congestion ChargingThe Case of Stockholm. Transp. Res. Part A Policy Pract. 2009, 43, 297–305. [Google Scholar] [CrossRef]
  30. Shatanawi, M.; Csete, M.S.; Mészáros, F. Road User Charging: Adaption to the City of Amman; University of Dunaújváros: Dunaújváros, Hungary, 2018; p. 10. [Google Scholar]
  31. Milakis, D.; van Arem, B.; van Wee, B. Policy and Society Related Implications of Automated Driving: A Review of Literature and Directions for Future Research. J. Intell. Transp. Syst. 2017, 21, 324–348. [Google Scholar] [CrossRef]
  32. Shatanawi, M.; Ghadi, M.; Mészáros, F. Road Pricing Adaptation to Era of Autonomous and Shared Autonomous Vehicles: Perspective of Brazil, Jordan, and Azerbaijan. Transp. Res. Procedia 2021, 55, 291–298. [Google Scholar] [CrossRef]
  33. Nordhoff, S.; de Winter, J.; Kyriakidis, M.; van Arem, B.; Happee, R. Acceptance of Driverless Vehicles: Results from a Large Cross-National Questionnaire Study. J. Adv. Transp. 2018, 2018, 1–22. [Google Scholar] [CrossRef] [Green Version]
  34. WESP World Economic Situation and Prospects 2020. p. 41. Available online: https://www.un.org/development/desa/dpad/publication/world-economic-situation-and-prospects-2022/ (accessed on 23 April 2022).
  35. Pigou, A. The Economics of Welfare; Palgrave Classics in Economics; Palgrave Macmillan: London, UK, 1920; ISBN 9780230249318. [Google Scholar]
  36. Vickrey, W. Some Implications of Marginal Cost Pricing for Public Utilities. Am. Econ. Rev. 1955, 45, 605–620. [Google Scholar]
  37. Walters, A.A. Track Costs and Motor Taxation. J. Ind. Econ. 1954, 2, 135–146. [Google Scholar] [CrossRef]
  38. De Palma, A.; Lindsey, R.; Quinet, E.; Vickerman, R. A Handbook of Transport Economics; Edward Elgar Publishing: Camberley, UK, 2011; ISBN 9780857930873. [Google Scholar]
  39. Jones, P. Urban Road Pricing: Public Acceptability and Barriers to Iimplementation. In Road Pricing, Traffic Congestion and the Environment: Issues of Efficiancy and Social Feasibility; Edward Elgar Publishing: Camberley, UK, 1998. [Google Scholar]
  40. Verhoef, E.T.; Nijkamp, P.; Rietveld, P. The Social Feasibility of Road Pricing. A Case Study for the Randstad Area. J. Transp. Econ. Policy 1997, 31, 255–276. [Google Scholar]
  41. Rienstra, S.A.; Rietveld, P.; Verhoef, E.T. The Social Support for Policy Measures in Passenger Transport. A Statistical Analysis for the Netherlands. Transp. Res. Part D Transp. Environ. 1999, 4, 181–200. [Google Scholar] [CrossRef]
  42. Rentziou, A.; Milioti, C.; Gkritza, K.; Karlaftis, M.G. Urban Road Pricing: Modeling Public Acceptance. J. Urban Plann. Dev. 2011, 137, 56–64. [Google Scholar] [CrossRef]
  43. Kockelman, K.M.; Podgorski, K.; Bina, M.; Gadda, S. Public Perceptions of Pricing Existing Roads and Other Transportation Policies: The Texas Perspective. J. Transp. Res. Forum 2012, 48, 2316. [Google Scholar] [CrossRef] [Green Version]
  44. Jones, P.M. UK Public Attitudes to Urban Traffic Problems and Possible Countermeasures: A Poll of Polls. Env. Plann C Gov. Policy 1991, 9, 245–256. [Google Scholar] [CrossRef]
  45. Schade, J.; Schlag, B. Acceptability of Urban Transport Pricing Strategies. Transp. Res. Part F Traffic Psychol. Behav. 2003, 6, 45–61. [Google Scholar] [CrossRef]
  46. Fürst, E.W.M.; Dieplinger, M. The Acceptability of Road Pricing in Vienna: The Preference Patterns of Car Drivers. Transportation 2013, 41, 765–784. [Google Scholar] [CrossRef]
  47. Dieplinger, M.; Fürst, E. The Acceptability of Road Pricing: Evidence from Two Studies in Vienna and Four Other European Cities. Transp. Policy 2014, 36, 10–18. [Google Scholar] [CrossRef]
  48. Shatanawi, M.; Abdelkhalek, F.; Mészáros, F. Urban Congestion Charging Acceptability: An International Comparative Study. Sustainability 2020, 12, 5044. [Google Scholar] [CrossRef]
  49. Hensher, D.A.; Li, Z. Referendum Voting in Road Pricing Reform: A Review of the Evidence. Transp. Policy 2013, 25, 186–197. [Google Scholar] [CrossRef]
  50. Winslott-Hiselius, L.; Brundell-Freij, K.; Vagland, Å.; Byström, C. The Development of Public Attitudes towards the Stockholm Congestion Trial. Transp. Res. Part A Policy Pract. 2009, 43, 269–282. [Google Scholar] [CrossRef]
  51. Gu, Z.; Liu, Z.; Cheng, Q.; Saberi, M. Congestion Pricing Practices and Public Acceptance: A Review of Evidence. Case Stud. Transp. Policy 2018, 6, 94–101. [Google Scholar] [CrossRef]
  52. Ungemah, D.; Collier, T. I’ll Tell You What I Think!: A National Review of How the Public Perceives Pricing. Transp. Res. Rec. 2007, 1996, 66–73. [Google Scholar] [CrossRef]
  53. Small, K.A. Using the Revenues from Congestion Pricing. Transportation 1992, 19, 359–381. [Google Scholar] [CrossRef] [Green Version]
  54. Harrington, W.; Krupnick, A.J.; Alberini, A. Overcoming Public Aversion to Congestion Pricing. Transp. Res. Part A Policy Pract. 2001, 35, 87–105. [Google Scholar] [CrossRef] [Green Version]
  55. Farrell, S.; Saleh, W. Road-User Charging and the Modelling of Revenue Allocation. Transp. Policy 2005, 12, 431–442. [Google Scholar] [CrossRef]
  56. Ubbels, B.; Verhoef, E. Acceptability of Road Pricing and Revenue Use in the Netherlands; Institute for the Study of Transport within the European Economic Integration: Trieste, Italy, 2006; Volume 16. [Google Scholar]
  57. Kocak, N.A.; Jones, P.; Whibley, D. Tools for Road User Charging (RUC) Scheme Option Generation. Transp. Policy 2005, 12, 391–405. [Google Scholar] [CrossRef]
  58. Sun, X.; Feng, S.; Lu, J. Psychological Factors Influencing the Public Acceptability of Congestion Pricing in China. Transp. Res. Part F Traffic Psychol. Behav. 2016, 41, 104–112. [Google Scholar] [CrossRef]
  59. Hao, X.; Sun, X.; Lu, J. The Study of Differences in Public Acceptability Towards Urban Road Pricing. Procedia—Soc. Behav. Sci. 2013, 96, 433–441. [Google Scholar] [CrossRef] [Green Version]
  60. Bureau, B.; Glachant, M. Distributional Effects of Road Pricing: Assessment of Nine Scenarios for Paris. Transp. Res. Part A Policy Pract. 2008, 42, 994–1007. [Google Scholar] [CrossRef] [Green Version]
  61. Payre, W.; Cestac, J.; Delhomme, P. Intention to Use a Fully Automated Car: Attitudes and a Priori Acceptability. Transp. Res. Part F Traffic Psychol. Behav. 2014, 27, 252–263. [Google Scholar] [CrossRef]
  62. Kyriakidis, M.; Happee, R.; de Winter, J.C.F. Public Opinion on Automated Driving: Results of an International Questionnaire among 5000 Respondents. Transp. Res. Part F Traffic Psychol. Behav. 2015, 32, 127–140. [Google Scholar] [CrossRef]
  63. Luo, Q.; Saigal, R.; Chen, Z.; Yin, Y. Accelerating the Adoption of Automated Vehicles by Subsidies: A Dynamic Games Approach. Transp. Res. Part B Methodol. 2019, 129, 226–243. [Google Scholar] [CrossRef]
  64. Maeng, K.; Jeon, S.R.; Park, T.; Cho, Y. Network Effects of Connected and Autonomous Vehicles in South Korea: A Consumer Preference Approach. Res. Transp. Econ. 2020, 90, 100998. [Google Scholar] [CrossRef]
  65. Bansal, P.; Kockelman, K.M.; Singh, A. Assessing Public Opinions of and Interest in New Vehicle Technologies: An Austin Perspective. Transp. Res. Part C Emerg. Technol. 2016, 67, 1–14. [Google Scholar] [CrossRef]
  66. Venkatesh, V.; Morris, M.G.; Davis, G.B.; Davis, F.D. User Acceptance of Information Technology: Toward a Unified View. MIS Q. 2003, 27, 425. [Google Scholar] [CrossRef] [Green Version]
  67. Leicht, T.; Chtourou, A.; Ben Youssef, K. Consumer Innovativeness and Intentioned Autonomous Car Adoption. J. High Technol. Manag. Res. 2018, 29, 1–11. [Google Scholar] [CrossRef]
  68. Manfreda, A.; Ljubi, K.; Groznik, A. Autonomous Vehicles in the Smart City Era: An Empirical Study of Adoption Factors Important for Millennials. Int. J. Inf. Manag. 2019, 58, 102050. [Google Scholar] [CrossRef]
  69. Pettigrew, S.; Cronin, S.L. Stakeholder Views on the Social Issues Relating to the Introduction of Autonomous Vehicles. Transp. Policy 2019, 81, 64–67. [Google Scholar] [CrossRef]
  70. Rahimi, A.; Azimi, G.; Jin, X. Examining Human Attitudes toward Shared Mobility Options and Autonomous Vehicles. Transp. Res. Part F Traffic Psychol. Behav. 2020, 72, 133–154. [Google Scholar] [CrossRef]
  71. Bonnefon, J.-F.; Shariff, A.; Rahwan, I. The Social Dilemma of Autonomous Vehicles. Science 2016, 352, 1573–1576. [Google Scholar] [CrossRef]
  72. Bansal, P.; Kockelman, K.M. Forecasting Americans’ Long-Term Adoption of Connected and Autonomous Vehicle Technologies. Transp. Res. Part A Policy Pract. 2017, 95, 49–63. [Google Scholar] [CrossRef]
  73. Schoettle, B.; Sivak, M. Public Opinion about Self-Driving Vehicles in China, India, Japan, U.S., UK, and Australia; The University of Michigan Transportation Research Institute: Ann Arbour, MI, USA, 2014; p. 35. [Google Scholar]
  74. Acheampong, R.A.; Cugurullo, F. Capturing the Behavioural Determinants behind the Adoption of Autonomous Vehicles: Conceptual Frameworks and Measurement Models to Predict Public Transport, Sharing and Ownership Trends of Self-Driving Cars. Transp. Res. Part F Traffic Psychol. Behav. 2019, 62, 349–375. [Google Scholar] [CrossRef] [Green Version]
  75. Bezai, N.E.; Medjdoub, B.; Al-Habaibeh, A.; Chalal, M.L.; Fadli, F. Future Cities and Autonomous Vehicles: Analysis of the Barriers to Full Adoption. Energy Built Environ. 2020, 2, 65–81. [Google Scholar] [CrossRef]
  76. Sciaccaluga, M.; Delponte, I. Investigation on Human Factors and Key Aspects Involved in Autonomous Vehicles -AVs- Acceptance: New Instruments and Perspectives. Transp. Res. Procedia 2020, 45, 708–715. [Google Scholar] [CrossRef]
  77. Maeng, K.; Kim, W.; Cho, Y. Consumers’ Attitudes toward Information Security Threats against Connected and Autonomous Vehicles. Telemat. Inform. 2021, 63, 101646. [Google Scholar] [CrossRef]
  78. LaMondia, J.J.; Fagnant, D.J.; Qu, H.; Barrett, J.; Kockelman, K. Shifts in Long-Distance Travel Mode Due to Automated Vehicles: Statewide Mode-Shift Simulation Experiment and Travel Survey Analysis. Transp. Res. Rec. 2016, 2566, 1–11. [Google Scholar] [CrossRef]
  79. Perrine, K.A.; Kockelman, K.M.; Huang, Y. Anticipating Long-Distance Travel Shifts Due to Self-Driving Vehicles. J. Transp. Geogr. 2020, 82, 102547. [Google Scholar] [CrossRef]
  80. Huang, Y.; Kockelman, K.M.; Quarles, N. How Will Self-Driving Vehicles Affect U.S. Megaregion Traffic? The Case of the Texas Triangle. Res. Transp. Econ. 2020, 84, 101003. [Google Scholar] [CrossRef]
  81. Spieser, K.; Treleaven, K.B.; Zhang, R.; Frazzoli, E.; Morton, D.; Pavone, M. Toward a Systematic Approach to the Design and Evaluation of Automated Mobility-on-Demand Systems: A Case Study in Singapore; Springer: Cham, Switzerland, 2014. [Google Scholar]
  82. Fagnant, D.J.; Kockelman, K.M.; Bansal, P. Operations of Shared Autonomous Vehicle Fleet for Austin, Texas, Market. Transp. Res. Rec. 2016, 2563, 98–106. [Google Scholar] [CrossRef] [Green Version]
  83. Chen, T.D.; Kockelman, K.M.; Hanna, J.P. Operations of a Shared, Autonomous, Electric Vehicle Fleet: Implications of Vehicle & Charging Infrastructure Decisions. Transp. Res. Part A Policy Pract. 2016, 94, 243–254. [Google Scholar] [CrossRef]
  84. Meszaros, F.; Shatanawi, M.; Ogunkunbi, G.A. Challenges of the Electric Vehicle Markets in Emerging Economies. Period. Polytech. Transp. Eng. 2020, 49, 93–101. [Google Scholar] [CrossRef] [Green Version]
  85. Matalqah, I.; Shatanawi, M.; Alatawneh, A.; Mészáros, F. Impact of Different Penetration Rates of Shared Autonomous Vehicles on Traffic: Case Study of Budapest. Transp. Res. Rec. 2022, 03611981221095526. [Google Scholar] [CrossRef]
  86. Lokhandwala, M.; Cai, H. Dynamic Ride Sharing Using Traditional Taxis and Shared Autonomous Taxis: A Case Study of NYC. Transp. Res. Part C Emerg. Technol. 2018, 97, 45–60. [Google Scholar] [CrossRef]
  87. Tian, Z.; Feng, T.; Timmermans, H.J.P.; Yao, B. Using Autonomous Vehicles or Shared Cars? Results of a Stated Choice Experiment. Transp. Res. Part C Emerg. Technol. 2021, 128, 103117. [Google Scholar] [CrossRef]
  88. Merfeld, K.; Wilhelms, M.-P.; Henkel, S.; Kreutzer, K. Carsharing with Shared Autonomous Vehicles: Uncovering Drivers, Barriers and Future Developments–A Four-Stage Delphi Study. Technol. Forecast. Soc. Chang. 2019, 144, 66–81. [Google Scholar] [CrossRef]
  89. Cartenì, A. The Acceptability Value of Autonomous Vehicles: A Quantitative Analysis of the Willingness to Pay for Shared Autonomous Vehicles (SAVs) Mobility Services. Transp. Res. Interdiscip. Perspect. 2020, 8, 100224. [Google Scholar] [CrossRef]
  90. Lavieri, P.S.; Bhat, C.R. Modeling Individuals’ Willingness to Share Trips with Strangers in an Autonomous Vehicle Future. Transp. Res. Part A Policy Pract. 2019, 124, 242–261. [Google Scholar] [CrossRef]
  91. Stoiber, T.; Schubert, I.; Hoerler, R.; Burger, P. Will Consumers Prefer Shared and Pooled-Use Autonomous Vehicles? A Stated Choice Experiment with Swiss Households. Transp. Res. Part D Transp. Environ. 2019, 71, 265–282. [Google Scholar] [CrossRef]
  92. Gurumurthy, K.M.; Kockelman, K.M. Modeling Americans’ Autonomous Vehicle Preferences: A Focus on Dynamic Ride-Sharing, Privacy & Long-Distance Mode Choices. Technol. Forecast. Soc. Chang. 2020, 150, 119792. [Google Scholar] [CrossRef]
  93. Schlag, B.; Teubel, U. Public acceptability of transport pricing. IATSS Res. 1997, 21, 134–142. [Google Scholar]
  94. Schlag, B.; Schade, J. Public Acceptability of Traffic Demand Management in Europe. Traffic Eng. Control 2000, 41, 314–318. [Google Scholar]
  95. Fishbein, M.; Ajzen, I. Belief, Attitude, Intention, and Behavior: An Introduction to Theory and Research. Addison-Wesley Publishing Company: Boston, MA, USA, 1975; ISBN 978-0-201-02089-2. [Google Scholar]
  96. Ajzen, I. The Theory of Planned Behavior. Organ. Behav. Hum. Decis. Process. 1991, 50, 179–211. [Google Scholar] [CrossRef]
  97. Bamberg, S.; Rölle, D.; Weber, C. Does Habitual Car Use Not Lead to More Resistance to Change of Travel Mode? Transportation 2003, 30, 97–108. [Google Scholar] [CrossRef]
  98. Ajzen, I.; Madden, T.J. Prediction of Goal-Directed Behavior: Attitudes, Intentions, and Perceived Behavioral Control. J. Exp. Soc. Psychol. 1986, 22, 453–474. [Google Scholar] [CrossRef]
  99. Strydom, W. Applying the Theory of Planned Behavior to Recycling Behavior in South Africa. Recycling 2018, 3, 43. [Google Scholar] [CrossRef] [Green Version]
  100. Di Ciommo, F.; Monzón, A.; Fernandez-Heredia, A. Improving the Analysis of Road Pricing Acceptability Surveys by Using Hybrid Models. Transp. Res. Part A Policy Pract. 2013, 49, 302–316. [Google Scholar] [CrossRef] [Green Version]
  101. Teubel, U. The Welfare Effects and Distributional Impacts of Road User Charges on Commuters—An Empirical Analysis of Dresden. Int. J. Transp. Econ./Riv. Internazionale Di Econ. Dei Trasp. 2000, 27, 231–255. [Google Scholar]
  102. Haustein, S. Mobility Behavior of the Elderly: An Attitude-Based Segmentation Approach for a Heterogeneous Target Group. Transportation 2012, 39, 1079–1103. [Google Scholar] [CrossRef]
  103. Schoettle, B.; Sivak, M. A Survey of Public Opinion about Connected Vehicles in the U.S., the U.K., and Australia. In Proceedings of the 2014 International Conference on Connected Vehicles and Expo (ICCVE), IEEE, Vienna, Austria, 3–7 November 2014; pp. 687–692. [Google Scholar]
  104. Fraedrich, E.; Lenz, B. Automated Driving: Individual and Societal Aspects. Transp. Res. Rec. 2014, 2416, 64–72. [Google Scholar] [CrossRef]
  105. Jardim, A.S.; Quartulli, A.M.; Casley, S.V. A Study of Public Acceptance of Autonomous Cars; Worcester Polytechnic Institute: Worcester, MA, USA, 2013; p. 156. [Google Scholar]
  106. Wang, Y.; Wang, Y.; Xie, L.; Zhou, H. Impact of Perceived Uncertainty on Public Acceptability of Congestion Charging: An Empirical Study in China. Sustainability 2018, 11, 129. [Google Scholar] [CrossRef] [Green Version]
  107. Nulty, D.D. The Adequacy of Response Rates to Online and Paper Surveys: What Can Be Done? Assess. Eval. High. Educ. 2008, 33, 301–314. [Google Scholar] [CrossRef] [Green Version]
  108. Baruch, Y.; Holtom, B.C. Survey Response Rate Levels and Trends in Organizational Research. Hum. Relat. 2008, 61, 1139–1160. [Google Scholar] [CrossRef] [Green Version]
  109. Selmoune, A.; Cheng, Q.; Wang, L.; Liu, Z. Influencing Factors in Congestion Pricing Acceptability: A Literature Review. J. Adv. Transp. 2020, 2020, 1–11. [Google Scholar] [CrossRef]
  110. Jones, P.; Schade, J.; Schlag, B. (Eds.) Acceptability of Road User Charging: Meeting the Challenge. In Acceptability of Transport Pricing Strategies; Emerald Group Publishing Limited: Bigley, UK, 2003; pp. 27–62. ISBN 9780080441993. [Google Scholar]
  111. Glavic, D.; Mladenovic, M.; Luttinen, T.; Cicevic, S.; Trifunovic, A. Road to Price: User Perspectives on Road Pricing in Transition Country. Transp. Res. Part A Policy Pract. 2017, 105, 79–94. [Google Scholar] [CrossRef]
  112. Vonk Noordegraaf, D.; Annema, J.A.; van Wee, B. Policy Implementation Lessons from Six Road Pricing Cases. Transp. Res. Part A Policy Pract. 2014, 59, 172–191. [Google Scholar] [CrossRef]
  113. Haboucha, C.J.; Ishaq, R.; Shiftan, Y. User Preferences Regarding Autonomous Vehicles. Transp. Res. Part C Emerg. Technol. 2017, 78, 37–49. [Google Scholar] [CrossRef]
  114. Yap, M.D.; Correia, G.; van Arem, B. Preferences of Travellers for Using Automated Vehicles as Last Mile Public Transport of Multimodal Train Trips. Transp. Res. Part A Policy Pract. 2016, 94, 1–16. [Google Scholar] [CrossRef]
Figure 1. Analytical Framework.
Sustainability 14 12798 g001
Figure 2. Mean values of respondent’s preferences for using RP revenues.
Sustainability 14 12798 g002
Figure 3. Respondent’s trust in their governments regarding the use of RP revenues.
Sustainability 14 12798 g003
Table 1. Overview of the key characteristics of the countries under study.
CriteriaBrazilJordanUkraineHungary
Area (Mkm2)8.50.0890.6030.093
Population (million)2101041.79.76
Density (inhabitant/km2)2511369105
GDP (billion US$)143444.566 153.895154.562
Vehicles in Use/1000 People210.07 ^123.38 ^213.66 ^377.52 ^
Passenger Vehicles Annual Sales1752,32814,00088,437131,885
Roadway Density (Km/100 Km2)23828227
Rail Network Length (Km)29817622197877945
Table 2. Distribution of responses across countries.
BrazilJordanUkraineHungaryTotal
Survey Initiations5988853152011999
Survey Completions26927010084723
Survey Completions in more than 10 min2552487777657
Valid Response Rate43%28%24%38%33%
Table 3. Factor analysis example.
#Item DescriptionExtracted Factor
1 I think the application of road pricing is likely to reduce travel time.Perceived_Usefulness_RP
2 I think the application of road pricing is likely to decrease the congestion level.
3 I think the application of road pricing is likely to reduce air pollution.
4 I think the application of road pricing is likely to reduce noise, annoyance, and disturbance.
5 I think the application of road pricing is likely to result in a better fuel economy.
6 I think the application of road pricing is likely to reduce the number of accidents and incidents.
7 I think the application of road pricing is likely to increase the price of the trip.Negative_Expectations_RP
8 I think the application of road pricing is likely to make the PuT modes more crowded.
9 I think the application of road pricing is likely to result in increasing social inequality among the citizens.
Table 4. Descriptive values of some factors were generated by a factor analysis.
CountryVariable NameNumber of ItemsAlpha
Cronbach
Total Variance Explained
BrazilPerceived_Usefulness_RP60.8252.99
Sensing_Traffic_Problems60.8050.45
Social_Norm20.7278.26
JordanPerceived_Usefulness_RP60.8456.02
AV_Safety_Security_Concerns70.7944.95
Social_Norm20.7781.16
HungaryPerceived_Usefulness_RP50.8563.47
Negative_Expectations_RP30.7566.51
Willingness_to_Share40.7557.52
UkraineAV_Awareness30.8577.61
Social_Norm20.8385.43
Perceived_Usefulness_RP50.8258.74
Table 5. Socio-demographic characteristics “Country profiles”.
n = 657BrazilJordanHungaryUkraine
Count
(Percentage%)
255
(38.8%)
248
(37.7%)
77
(11.7%)
77
(11.7%)
Characteristics
Age
<2013 (5.1%)8 (3.2%)7 (9.1%)32 (41.6%)
20–2678 (30.6%)74 (29.8%)30 (39%)33 (42.9%)
27–3295 (37.3%)59 (23.8%)15 (19.5%)6 (7.8%)
33–3812 (4.7%)37 (14.9%)9 (11.7%)2 (2.6%)
39–4414 (5.5%)23 (9.3%)5 (6.5%)2 (2.6%)
45–5012 (4.7%)28 (11.3%)4 (5.2%)0 (0%)
>5031 (12.2%)19 (7.7%)7 (9.1%)2 (2.6%)
Gender
Male110 (43.1%)136 (54.8%)44 (57.1%)39 (50.6%)
Female145 (56.9%)112 (45.2%)33 (42.9%)38 (49.4%)
Educational Level
Elementary school certificate5 (2%)0 (0%)0 (0%)3 (3.9%)
High school certificate52 (20.4%)13 (5.2%)21 (27.3%)14 (18.2%)
Bachelor or Diploma139 (54.5%)151 (60.9%)27 (35.1%)36 (46.8%)
Postgraduate studies (PhD or master’s)49 (19.2%)80 (32.3%)28 (36.4%)14 (18.2%)
Others10 (3.9%)4 (1.6%)1 (1.3%)10 (13%)
Employment Status
Full-time worker111 (43.5%)112 (45.2%)37 (48.1%)42 (54.5%)
Part-time worker25 (9.8%)19 (7.7%)5 (6.5%)35 (45.5%)
Unemployed13 (5.1%)13 (5.2%)3 (3.9%)0 (0%)
Student78 (30.6%)59 (23.8%)21 (27.3%)0 (0%)
Unpaid volunteer work1 (0.4%)3 (1.2%)1 (1.3%)0 (0%)
Retired9 (3.5%)11 (4.4%)3 (3.9%)0 (0%)
House Keeping5 (2%)24 (9.7%)2 (2.6%)0 (0%)
Others13 (5.1%)7 (2.8%)5 (6.5%)0 (0%)
Driving License
Yes211 (82.7%)202 (81.5%)61 (79.2%)42 (54.5%)
No44 (17.3%)46 (18.5%)16 (20.8%)35 (45.5%)
Car Ownership
Yes142 (55.7%)147 (59.3%)32 (41.6%)37 (48.1%)
No113 (44.3%)101 (40.7%)45 (58.4%)40 (51.9%)
Table 6. MLR Parameters of RP acceptability.
VariableHungaryJordanUkraineBrazil
Intercept0.16 *−0.47 ***−0.23 *−0.34 ***
RP_Awareness0.1 ***0.032−0.26 ***−0.17 ***
AV_Awareness0.08 **−0.05 **−0.050−0.06 ***
PuT_Users−0.16 ***−0.030−0.15 ***0.010
Enjoy_Driving−0.19 ***0.04 *−0.15 ***0.07 ***
Cycling_Users0.040−0.0300.13 ***0.11 ***
Walkers−0.12 ***0.030−0.020−0.010
Technology_Interest 0.06 *0.0400.47 ***−0.04 *
Environmental_Oriented_Users0.17 ***0.17 ***0.11 ***0.11 ***
Cost_Oriented_Users0.0600.0300.08 **−0.04 *
Sensing_Traffic_Problems0.19 ***0.05 **−0.0500.2 ***
Negative_Expectations_RP0.2 ***0.05 *0.16 ***0.11 ***
Willingness_to_Share0.41 ***0.19 ***−0.2 ***0.11 ***
RP_Perceived_Anxiety−0.14 ***0.0200.14 ***0.030
AV_Perceived_Ease_of_Use0.1 ***0.0030.0000.010
AV_Safety_Security_Concerns0.16 ***0.1 ***−0.0500.07 ***
Social_Norm0.38 ***0.16 ***0.21 ***0.31 ***
Fairness−0.010−0.06 ***−0.08 **0.11 ***
Equity−0.07 **−0.0200.23 ***0.17 ***
Income0.0040.0010.0002 *−0.001
Age−0.0040.01 ***0.0100.01 ***
R-Square Adjusted0.5460.1640.5490.314
Significance Level: * (0.1 ≥ p > 0.05); ** (0.05 ≥ p > 0.01); *** (p ≤ 0.01).
Table 7. MNL of vehicle adoption in Hungary.
VariableAV Vs. CCSAV Vs. CC
Model 1Model 2Model 1Model 2
ASC (Intercept)3.81 ***1.791.24 ***2.5
Awareness
AV_Awareness1.49 ***4.57 ***2.12 ***5.15 ***
RP_Awareness−0.110.11−0.26−0.01
Travel Behavior and Attitudes
PuT_Users0.160.420.10−0.29
Enjoy_Driving−0.5 *−1.57 ***0.27−0.44
Cycling_Users−0.45−0.91 **−0.62 *−0.98 *
Walkers0.5 *0.730.220.55
Technology_Interest −0.12−0.38−0.78 **−1.42 **
Environmental_Oriented_Users0.481.98 **0.572.28 **
Cost_Oriented_Users−0.77 **−2.37 ***−0.37−2.04 **
Sensing Traffic Problems
Sensing_Traffic_Problems−0.66 *−0.52−0.84 **−0.80
Perceived Effectiveness
Perceived_Usefulness_RP−0.88 **−1.49 **−1.03 **−1.69 ***
Negative_Expectations_RP−0.47−2.0 ***−0.54−2.09 **
Personal Effectiveness
Willingness_to_Share0.69 *1.25 *0.60.61
RP_Perceived_Anxiety0.353.22 ***0.363.33 ***
Safety and Security
AV_Safety_Security_Concerns0.06−0.800.30−0.52
AV_Perceived_Ease_of_Use−0.40−0.50−0.27−0.20
Social norms concerning RP acceptability
Social_Norm−0.34−1.8 ***−0.23−1.44 **
Fairness
Fairness0.55 **1.38 **0.54 *1.1 *
Equity
Equity0.272.14 **0.031.98 *
Age 0.002 −0.07
Income (ref: Low)
Medium income 3.83 ** 2.87
High income 0.15 −1.07
Gender (ref: Female)
Male −0.12 1
Education (ref: less than bachelor)
Bachelor 3.67 ** 1.44
Postgraduate studies (PhD or Master) 3.45 ** 2.77 *
Employment (ref: Working)
Not Working 4.3 ** 3.35 *
Driving license (ref: Yes)
No 1.39 0.83
Car ownership (ref: Yes)
No −2.98 −3.44 **
Access to car as driver (ref: Yes)
No 0..68 1.77
Access to car as passenger (ref: Yes)
No 3.07 * 2.03
AIC361.5409.5361.5409.5
BIC533683.9533683.9
McFadden R20.2650.340.2650.34
Significance Level: * (0.1 ≥ p > 0.05); ** (0.05 ≥ p > 0.01); *** (p ≤ 0.01).
Table 8. MNL of vehicle adoption in Jordan.
VariableAV Vs. CCSAV Vs. CC
Model 1Model 2Model 1Model 2
ASC (Intercept)0.15 *−0.140.95 ***1.83 ***
Awareness
AV_Awareness0.12 *0.14 *0.3 ***0.44 ***
RP_Awareness
Travel Behavior and Attitudes
PuT_Users−0.28 ***−0.28 ***−0.26 ***−0.17 **
Enjoy_Driving0.020.030.110.13 *
Cycling_Users−0.01−0.01−0.10−0.09
Walkers0.14 *0.130.030.04
Technology_Interest0.34 ***0.36 ***0.17 **0.09
Environmental_Oriented_Users0.14 *0.17 *0.23 ***0.27 ***
Cost_Oriented_Users0.32 ***0.29 ***0.63 ***0.61 ***
Sensing Traffic Problems
Sensing_Traffic_Problems0.34 ***0.35 ***0.35 ***0.31 ***
Perceived Effectiveness
Perceived_Usefulness_RP0.49 ***0.45 ***0.060.08
Negative_Expectations_RP0.02−0.0020.17 **0.16 *
Personal Effectiveness
Willingness_to_Share0.25 ***0.26 ***0.54 ***0.6 ***
RP_Perceived_Anxiety0.16 *0.17 *0.29 ***0.33 ***
Safety and Security
AV_Safety_Security_Concerns−0.3 ***−0.26 ***−0.22 ***−0.16 **
AV_Perceived_Ease_of_Use−0.03−0.03−0.09−0.08
Social norms concerning RP acceptability
Social_Norm−0.01−0.030.130.19 **
Fairness
Fairness−0.12−0.13−0.010.02
Equity
Equity−0.01−0.010.14 *0.13
Age 0.01 −0.02 **
Income (ref: Low)
Medium income 0.29 −0.18
High income −0.01 0.05
Gender (ref: Female)
Male −0.56 *** −0.46 ***
Education (ref: less than bachelor)
Bachelor 0.01 0.16
Postgraduate studies (PhD or Master) 0.3 * 0.46 ***
Employment (ref: Working)
Not Working 0.03 −0.03
Driving license (ref: Yes)
No 0.37 −0.04
Car ownership (ref: Yes)
No 0.4 * −0.25
Use the vehicle as driver (ref: Yes)
No −0.51 *** 0.32 *
Use the vehicle as passenger (ref: Yes)
No −0.05 −0.05
AIC2206.52380.32206.52380.3
BIC2406.02707.82406.02707.8
McFadden R20.130.160.130.16
Significance Level: * (0.1 ≥ p > 0.05); ** (0.05 ≥ p > 0.01); *** (p ≤ 0.01).
Table 9. MNL of vehicle adoption in Ukraine.
VariableAV Vs. CCSAV Vs. CC
Model 1Model 2Model 1Model 2
ASC (Intercept)0.10−3.05 ***−0.42 ***0.06
Awareness
AV_Awareness0.14−0.37 **−0.37 **−0.54 **
RP_Awareness0.230.54 **0.32 **0.37
Travel Behavior and Attitudes
PuT_Users0.62 ***0.87 ***−0.09−0.12
Enjoy_Driving−0.45 ***−1 ***0.18−0.13
Cycling_Users0.28 *0.33 *0.070.07
Walkers0.100.37 **0.250.45 **
Technology_Interest−0.20−0.21−0.24−0.27
Environmental_Oriented_Users−0.25 *−0.07−0.21−0.12
Cost_Oriented_Users0.33 **0.230.33 **0.31
Sensing Traffic Problems
Sensing_Traffic_Problems−0.47 ***−0.8 ***0.070..04
Perceived Effectiveness
Perceived_Usefulness_RP−0.42 ***−0.58 **−0.6 ***−0.88 ***
Negative_Expectations_RP0.37 **0.35 *0.48 ***0.6 ***
Personal Effectiveness
Willingness_to_Share0.4 **0.080.35 **0.55 ***
RP_Perceived_Anxiety0.35 ***0.250.64 **0.29
Safety and Security
AV_Safety_Security_Concerns0.06−0.3 *−0.28 **−0.12
AV_Perceived_Ease_of_Use−0.3 **−0.24−0.23−0.32 *
Social norms concerning RP acceptability
Social_Norm0.63 ***0.51 **0.51 ***0.53 **
Fairness
Fairness−0.140.15−0.0020.14
Equity
Equity0.44 ***0.41 **−0.13−0.11
Age 0.05 * −0.03
Income (ref: Low)
Medium income 0.22 0.59
High income −0.40 −0.92 **
Gender (ref: Female)
Male 2.2 *** 0.68
Education (ref: Less than bachelor)
Bachelor −0.29 0.24
Postgraduate studies (PhD or Master) 0.09 0.30
Employment (ref: Working)
Not Working 0.57 −0.30
Driving license (ref: Yes)
No 2.13 *** −0.28
AIC633707.7633707.7
BIC804.5952.8804.5952.8
McFadden R20.180.270.180.27
Significance Level: * (0.1 ≥ p > 0.05); ** (0.05 ≥ p > 0.01); *** (p ≤ 0.01).
Table 10. MNL of vehicle adoption in Brazil.
VariableAV Vs. CCSAV Vs. CC
Model 1Model 2Model 1Model 2
ASC (Intercept)0.150.31.93 ***2.96 ***
Awareness
AV_Awareness−0.21 **−0.13 *0.14 *0.16 *
RP_Awareness0.19 *0.120.03−0.08
Travel Behavior and Attitudes
PuT_Users−0.05−0.09−0.06−0.005
Enjoy_Driving−0.08−0.22 *0.12−0.09
Cycling_Users0.05−0.010.24 ***0.09
Walkers−0.15−0.09−0.14 *0.06
Technology interest0.48 ***0.51 ***0.31 ***0.29 ***
Environmental_Oriented_Users0.23 **0.26 **0.26 ***0.24 **
Cost_Oriented_Users0.10.04−0.002−0.1
Sensing Traffic Problems
Sensing_Traffic_Problems−0.19 *−0.21 **0.10.004
Perceived Effectiveness
Perceived_Usefulness_RP0.160.17−0.22 **−0.16
Negative_Expectations_RP−0.050.05−0.15 *−0.13
Personal Effectiveness
Willingness_to_Share0.170.180.55 ***0.59 ***
RP_Perceived_Anxiety−0.14−0.23 **−0.14−0.17 *
Safety and Security
AV_Safety_Security_Concerns0.03−0.010.02−0.05
AV_Perceived_Ease_of_Use−0.090.010.020.12
Social norms concerning RP acceptability
Social_Norm0.03−0.07−0.2 *−0.27 **
Fairness
Fairness−0.16−0.2 *0.080.03
Equity
Equity0.23 **0.31 ***0.18 **0.29 ***
Age −0.02 *** −0.06 ***
Income (ref: Low)
Medium income 0.43 0.09
High income 0.85 *** 0.91 ***
Gender (ref: Female)
Male 0.13 0.05
Education (ref: Less than Bachelor)
Bachelor 0.35 −0.001
Postgraduate studies (PhD or Master) 0.13 0.52 **
Employment (ref: Working)
Not Working −0.07 0.3
Driving license (ref: Yes)
No 0.71 ** 0.49
Car owning (ref: Yes)
No −0.24 −0.16
Use the vehicle as driver (ref: Yes)
No 0.52 * 0.38
Use the vehicle as passenger (ref: Yes)
No −0.14 −0.29
AIC1747.921815.081747.921815.08
BIC1967.412166.261967.412166.26
McFadden R20.100.150.100.15
Significance Level: * (0.1 ≥ p > 0.05); ** (0.05 ≥ p > 0.01); *** (p ≤ 0.01).
Table 11. The relationship between the studied factors, RP acceptability, and future car choice in the four investigated countries.
FactorRPAVSAV
BRJOHUUABRJOHUUABRJOHUUA
Awareness
AV_Awareness
RP_Awareness
Travel Behavior and Attitudes
PuT_Users
Enjoy_Driving
Cycling_Users
Walkers
Technology_Interest
Environmental_Oriented_Users
Cost_Oriented_Users
Sensing Traffic Problems
Sensing_Traffic_Problems
Perceived Effectiveness
Perceived_Usefulness_RP
Negative_Expectations_RP
Personal Effectiveness
Willingness_to_Share
RP_Perceived_Anxiety
Safety and Security
AV_Safety_Security_Concerns
AV_perceived_ease_of_use
Social norms concerning RP acceptability
Social_Norm
Fairness
Fairness
Equity
Equity
Background Characteristics
Age
Gender (ref: Female)
Male
Education (ref: Less than bachelor)
Postgraduate studies
Employment (ref: Working)
Not Working
Use vehicle as driver (ref: Yes)
No
Note: BR—Brazil; JO—Jordan; HU—Hungary; UA—Ukraine.
Publisher’s Note: MDPI stays neutral with regard to jurisdictional claims in published maps and institutional affiliations.

