Article

Dynamic Co-Movements among Oil Prices and Financial Assets: A Scientometric Analysis

by
Nini Johana Marín-Rodríguez
1,*,
Juan David González-Ruiz
2 and
Sergio Botero Botero
3
1
Programa de Ingeniería Financiera, Facultad de Ingenierías, Universidad de Medellín, Medellín 050026, Colombia
2
Grupo de Investigación en Finanzas y Sostenibilidad, Departamento de Economía, Universidad Nacional de Colombia, Sede Medellín, Medellín 050034, Colombia
3
Departamento de Ingeniería de la Organización, Facultad de Minas, Universidad Nacional de Colombia—Sede Medellín, Medellín 050034, Colombia
*
Author to whom correspondence should be addressed.
Sustainability 2022, 14(19), 12796; https://doi.org/10.3390/su141912796
Submission received: 1 September 2022 / Revised: 1 October 2022 / Accepted: 3 October 2022 / Published: 7 October 2022

Abstract

:
In this study, we examined the extant literature on the dynamic association between oil prices and financial assets with special emphasis on the methodologies for measuring the dependence among oil prices, exchange rates, stock prices, energy markets, and assets related to sustainable finance. We performed a scientometric review of the structure and global trends of the dynamic association among oil prices and financial assets, based on research from 1982 to 2022 (September) using techniques such as the analysis of (i) sources, (ii) authors, (iii) documents, and (iv) cluster analysis. A total of 746 bibliographic records from Scopus and Web of Science databases were analyzed to generate the study’s research data through scientometric networks. The findings indicate that the most promising areas for further research in this field are represented by co-movement, copula, wavelet, dynamic correlation, and volatility analysis. Furthermore, energy markets and assets related to sustainable finance emerge as crucial trends in investigating dynamic co-movements with oil prices. They also suggest a research gap in analyzing by means of machine learning, deep learning, big data, and artificial intelligence for measuring dynamic co-movements among oil prices and assets in financial and energy markets, especially in emerging countries. Thus, these methodologies can be implemented in further research because these methods could more robustly quantify the association among such variables. The analysis provides researchers and practitioners with a comprehensive understanding of the existing literature and research trends on the dynamic association among oil prices and financial assets. It also promotes further studies in this domain. The identification of these relations presents benefits in risk diversification, hedges, speculation, and inflation targeting.

1. Introduction

As globalization advances, economic issues and societal shifts are influencing economic, social, and governance aspects in scenarios where sustainability plays a pivotal role. Analyzing changes in the relationships among the principal financial markets provides new and enriched studies regarding the importance of cross-border cooperation, strategies, synergies, and transactions that are already reshaping the global economic and socioeconomic panorama. Regarding financial markets, it is crucial to analyze the link between oil prices and financial assets because identifying these relationships provides benefits in terms of risk diversification, hedging, speculation, and inflation targeting, especially in a global decarbonization scenario toward more sustainable energy sources [1]. Among the financial assets, we can primarily mention exchange rates, stocks, bonds, and commodities, but we focus our analysis on the foreign exchange and stock markets because both mainly reflect the impacts of shocks on oil prices. The evidence suggests that much of the co-movements across markets are driven by the energy market, principally oil and natural gas [2]. Thus, it has been found that oil has a leading role in the global economy [3]. It has been estimated that oil is the most common energy source, with approximately one-third of the total energy consumption. In this way, oil is the most used energy source and is a natural resource that gives political and economic power to countries that have abundant reserves [4,5,6]. Thus, oil prices are expected to be correlated with changes in financial markets’ prices [7], energy markets, assets related to sustainable finance, and other variables in the real economy.
Among the main studies that have analyzed the relationship between oil shocks and financial markets, Refs. [7,8,9] can be mentioned. The results indicate that changes in oil returns had an impact on stock markets. Conversely, the literature also proposes different channels connecting international oil prices and exchange rates [8,10,11,12,13,14]. For example, fluctuations in the price of oil will affect supply and demand channels of the economy, causing inflationary pressures, which will be reflected in changes in interest rates [12]. These changes will finally be reflected in the value of the national currency [12]. Furthermore, according to the International Trade Theory, fluctuations in oil prices and real exchange rates are related through their effects on the terms of trade and parity conditions caused by arbitrage forces [10,11]. Other studies examine the linkages among oil prices, energy markets, and assets related to sustainable finance [15,16,17,18,19]. For example, Ref. [15] studied the dynamic relationships among green bonds, CO2 emissions, and oil prices. They found that green bonds have a negative dynamic correlation to the oil return and the future CO2 return and present a strong negative correlation in uncertainty periods.
Co-movements can be approached from the concepts of contagion and interdependence. Contagion refers to short-term dependence and interdependence to long-term interrelationship. Thus, it is important to analyze what is meant by the concepts of financial contagion and financial interdependence and if there is a consensus among the authors for these concepts. There are different types of co-movements among oil prices and financial markets (including energy markets and assets related to sustainable finance). However, this paper focuses on financial interdependence and financial contagion because we are interested in knowing the short- and long-term relationships between a country’s most important financial variables and oil prices. According to Ref. [20], the difference between these two concepts is that financial interdependence is defined as the relationship between asset classes on average during the sample period, and financial contagion is specified as a change in the transmission mechanism among different types of assets in times of crisis. Ref. [20] found that interdependence is more notable in advanced and emerging economies in the case of the stock market, and financial spillovers are more evident within the stock market in Latin America and emerging Asia. The response to shocks differs depending on the source of the disturbance. Then, the methodologies to measure financial contagion and interdependence play an important role due to the globalization process that increases the bond or correlated movement of the different financial variables of the markets in the international context.
When first searching for “dynamic linkage*” OR “dynamic co-movement*” OR “dynamic dependence*” OR “dynamic interdependence*” in Scopus and Web of Science (WoS), four significant themes appeared, as shown in Figure 1. The first topic is related to biological models in humans and animals. The second is associated with computational methods and algorithms. The third deals with CO2 emissions, energy markets, sustainability, and renewable energies. Thus, in this scenario, energy markets and sustainable finance emerge as crucial trends in investigating dynamic co-movements with oil prices. Finally, a fourth one is related to financial markets, stock markets, oil prices, and time series analysis. These topics are the central focus object of research due to the importance and development in recent times in the financial arena.
Then, identifying the methodologies used to quantify the co-movements between oil prices and financial markets (including energy markets and sustainable finance) appears as an opportunity for understanding the financial impact of the energy transition in the global economy to more sustainable energy sources. Moreover, the energy transition promotes the use of clean energy resources and discourages fossil fuel energy consumption from ensuring sustainability [21]. Thus, due to oil having an essential impact on the financial and economic markets, this change in the source of energy will affect the assessments of global change and development of the countries.

1.1. Knowledge Gap, Objective, and Contributions

Few literature review articles have been published on dynamic co-movements among oil prices and assets in financial markets (including energy markets and assets related to sustainable finance). For instance, Ref. [22] conducted one about the relationship between oil prices and the stock markets. The review applied a scientometric analysis of 1342 academic publications that provided a broad understanding of the state of research and trends on this subject. Thus, [22] divided their research hotspots into three segments: (i) basic relationships analysis, (ii) analysis based on updated econometric methods, and (iii) expanded analysis combining other financial sectors and market characteristics.
Moreover, Ref. [23] conducted a meta-literature review of financial market integration research, including 260 articles from 1981 to 2021. This study identified five research groups in the analysis of financial market integration: (i) portfolio diversification with financial market integration, (ii) general equity market integration, (iii) financial market relationship concerning crises and events, (iv) time-varying financial market integration, and (v) co-movements and spillovers between commodities and financial markets; they also presented possible further research directions.
Similarly, Ref. [4] undertook a bibliometric analysis of papers related to oil price shocks, stock market returns, and volatility spillovers. This author examined 684 studies in order to identify research trends in oil price shocks, stock market returns, and volatility spillover effects. Among the findings, the co-occurrence and keyword analysis highlighted that oil price shocks, equity returns, and volatility spillover are the most significant terms in the current literature. Likewise, the joint citation analysis divided the literature into three groups: (i) oil price shocks, stock market activity, and the emerging economies; (ii) oil volatility behavior and spillover effects in oil exporting and importing countries; and (iii) oil prices, stock market returns, and portfolio management.
This research aims at conducting a comprehensive scientometric study of the dynamic co-movements among oil prices and financial markets (including energy markets and assets related to sustainable finance) to provide researchers, investors, and policy makers a broad understanding of the status quo of the literature on this topic. Additionally, it identifies research trends that provide a framework driving further research.
According to this paper’s inquiry, there is no previous research in the body of knowledge about dynamic co-movements among oil prices and assets in financial markets (including energy markets and assets related to sustainable finance) that employ maps and working relationships employing networks using VOSviewer and Bibliometrix. Although the analysis of Ref. [4] is the most similar to this research, there are three fundamental differences: (i) our purpose is to study the nexus between oil prices and financial markets in general, not only stock markets but also to extend the analysis to the impact that oil prices can have on exchange rates. (ii) Our analysis uses two databases, Scopus and WoS, whereas Ref. [4] only use WoS, but the author admits that the inclusion of additional databases will increase the robustness of findings from further studies. Finally, (iii) this study uses the VOSviewer and Bibliometrix tools, but Ref. [4] only uses Bibliometrix.
This study’s findings will allow understanding the trends on this topic and thus establish the bases for the research processes on this field. We also outline strategies to provide data to expand the knowledge frontier in analyzing co-movements among oil prices and assets in financial markets (including energy markets and sustainable finance). This study is also expected to help investors and policy makers have more information for making decisions. For investors, knowing the co-movements among oil prices and assets (particularly correlation) provides insights into their investments’ potential diversification and hedging benefits. For policy makers, such as central banks, knowing the links between these variables will help them have a better frame of reference for making monetary policy decisions.
Then, this study strives to make three considerable contributions to the existing body of literature and practice. Primarily, it is the first to integrate a scientometric analysis using the VOSviewer and Bibliometrix tools into the research topic. These tools provide an appropriate framework for articulating and understanding co-movement among oil prices and financial assets (including energy markets and sustainable finance). Second, this study compiles and classifies a broad range of documents about the topic of research on dynamic linkages among oil prices and assets in financial markets. Third, it reveals how opportunities for further research can be identified by applying maps of networks and topic cluster reviews, and thus, it is possible to find emerging themes from empirical and theoretical literature.
This study is organized as follows. In Section 2, the research approach utilized and the literature search strategy are discussed. Section 3 presents the results of the different scientometric methods used in this study with different knowledge maps of links and tables along with their interpretation. Section 4 outlines the discussion of the main topics of the findings. Finally, Section 5 indicates the main findings and conclusions.

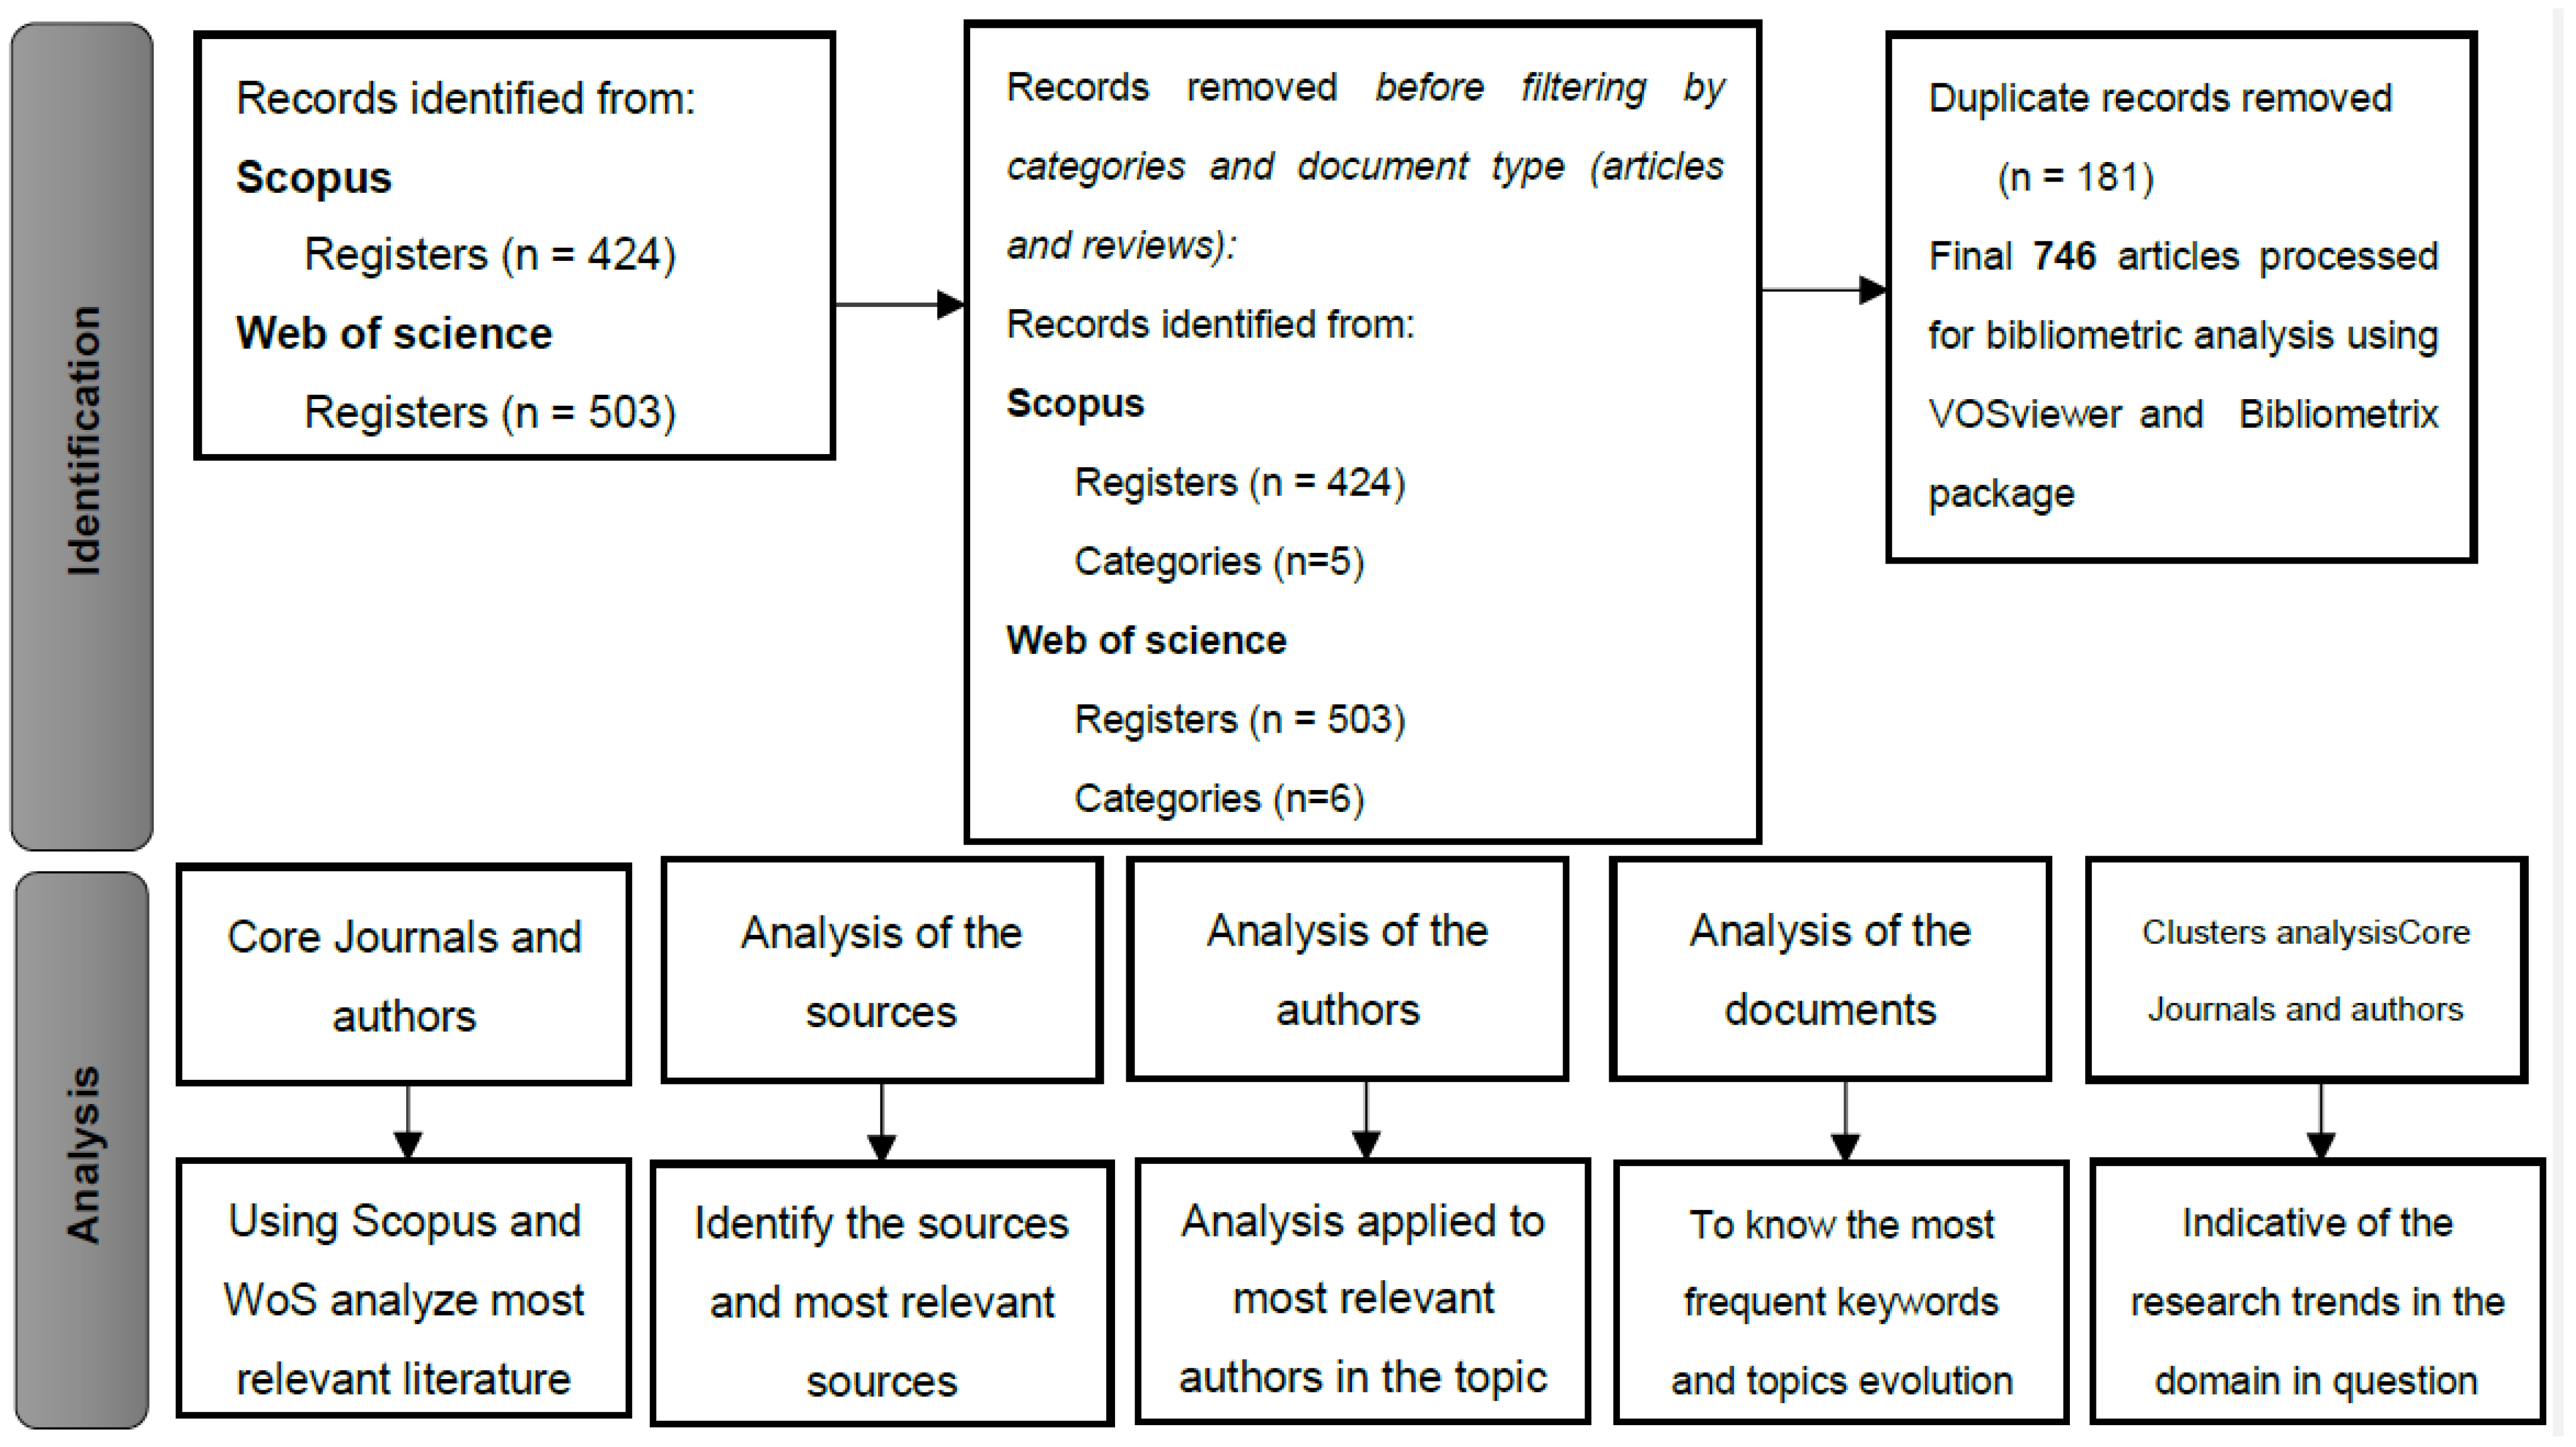
2. Materials and Methods

We analyzed the dynamic association among oil prices and assets in financial markets with a special focus on the methodologies for measuring the dependence among the oil prices, exchange rates, stock prices, energy markets, and assets related to sustainable finance variables using network analysis based on word diagrams and maps provided by scientometric techniques. Four scientometric techniques were implemented, which analyze (1) sources, (2) authors, (3) documents, and (4) cluster analysis. The visualization of the research results was performed using the VOSviewer software version 1.6.18 developed by Ref. [24] and the Bibliometrix package for R conceived by Ref. [25]. The four scientometric techniques selected are employed to (i) track the frontier of knowledge of the research area; (ii) identify the principal researchers, institutions, countries, and key subject categories; (iii) research keywords and co-citation clusters; and (v) infer the emerging research topics in the area.
The academic databases used for publication search and selection were Scopus and Web of Science (WoS). The search equation was: (TITLE-ABS-KEY (“stock market*” OR “Exchange rate*” OR “foreign exchange*” OR “financial market*” OR “asset market*”) AND TITLE-ABS-KEY (“oil price*”) AND TITLE-ABS-KEY (“contagion” OR “interdependence*” OR “co-movement*” OR “correlation*”)). A total of 927 studies were obtained from Scopus and WoS as far as September 2022. All these were downloaded and indexed into the Mendeley reference manager for reading and content analysis. Figure 2 illustrates the framework implementation of the current review. The process of document analysis and screening consisted of the removal of duplicate records in the screening. After the screening process, a total of 746 articles were included in the analysis.

3. Scientometric Analysis

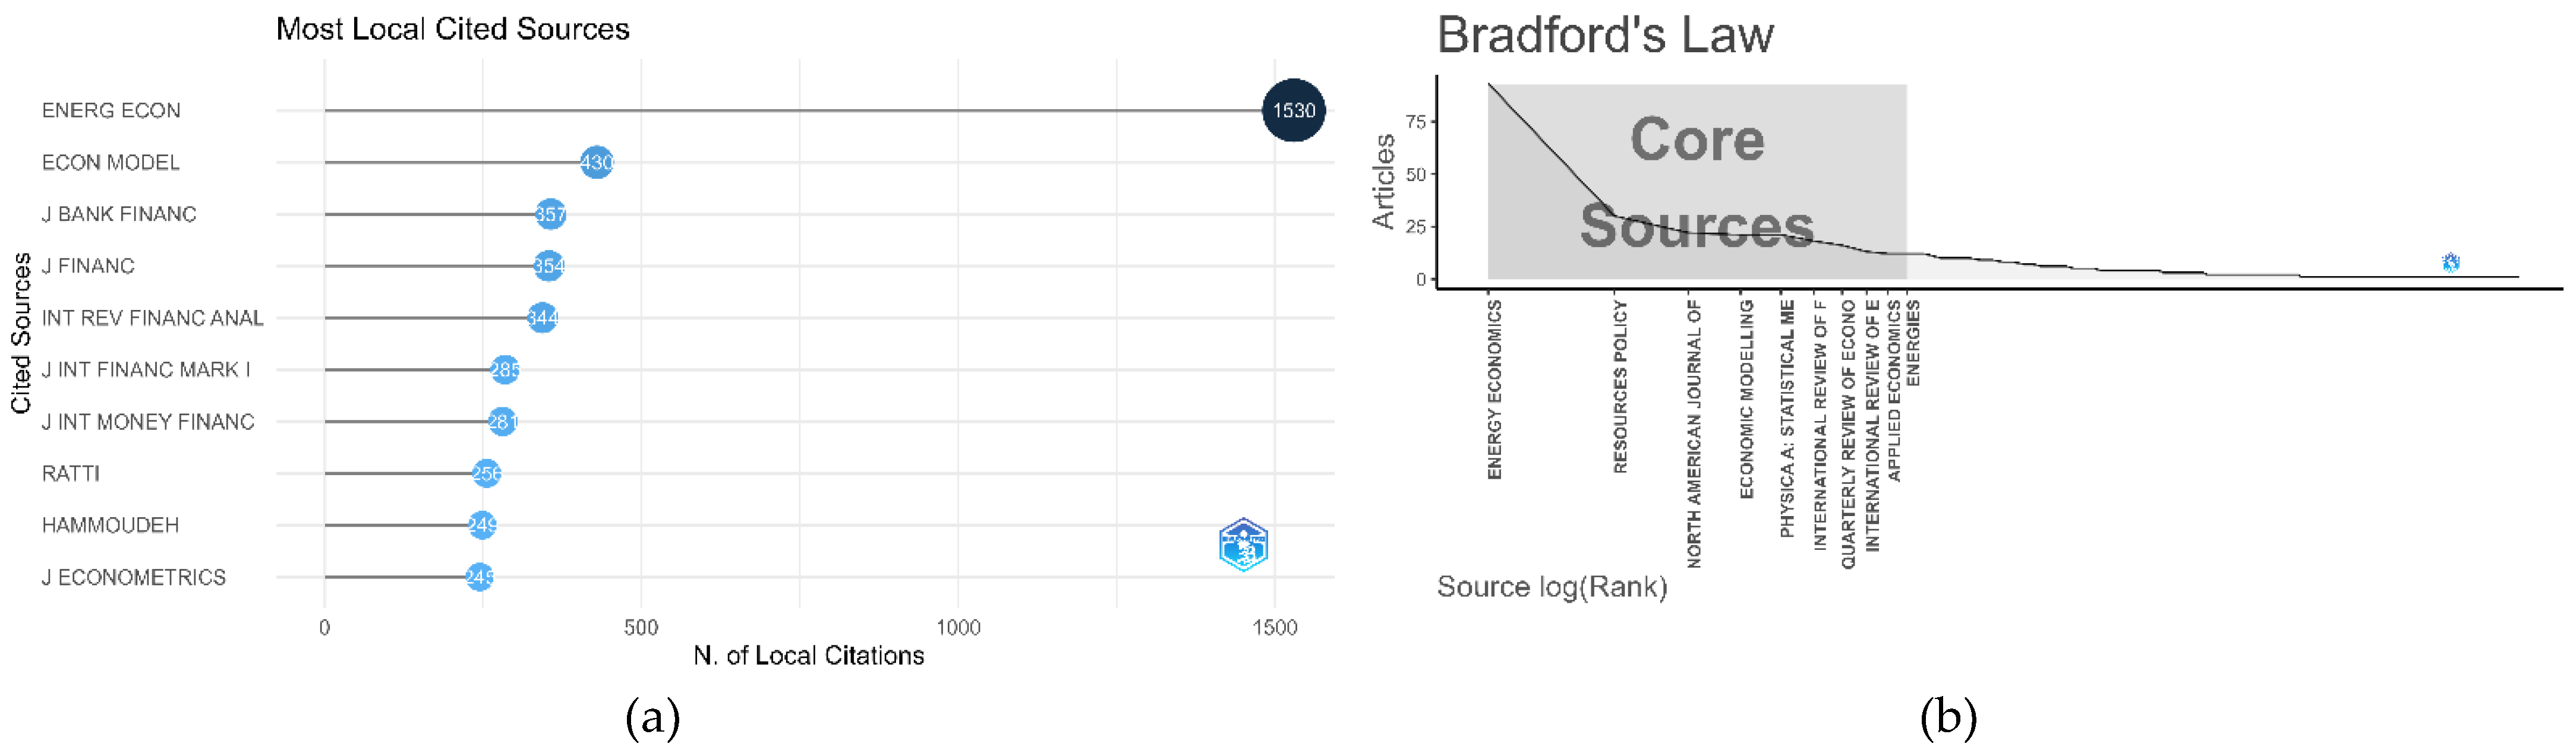
3.1. Analysis of the Sources

3.1.1. General Information

Among the 746 documents selected for this study, 1358 authors were identified. The average number of citations per document is 26.79, which is highly regarded in academe. The annual growth rate increased by 11.54% per year. The main document type is article (672). A total of 1778 KeyWords Plus and 1792 author keywords were identified. Table 1 summarizes the general information about the examined papers in this study.

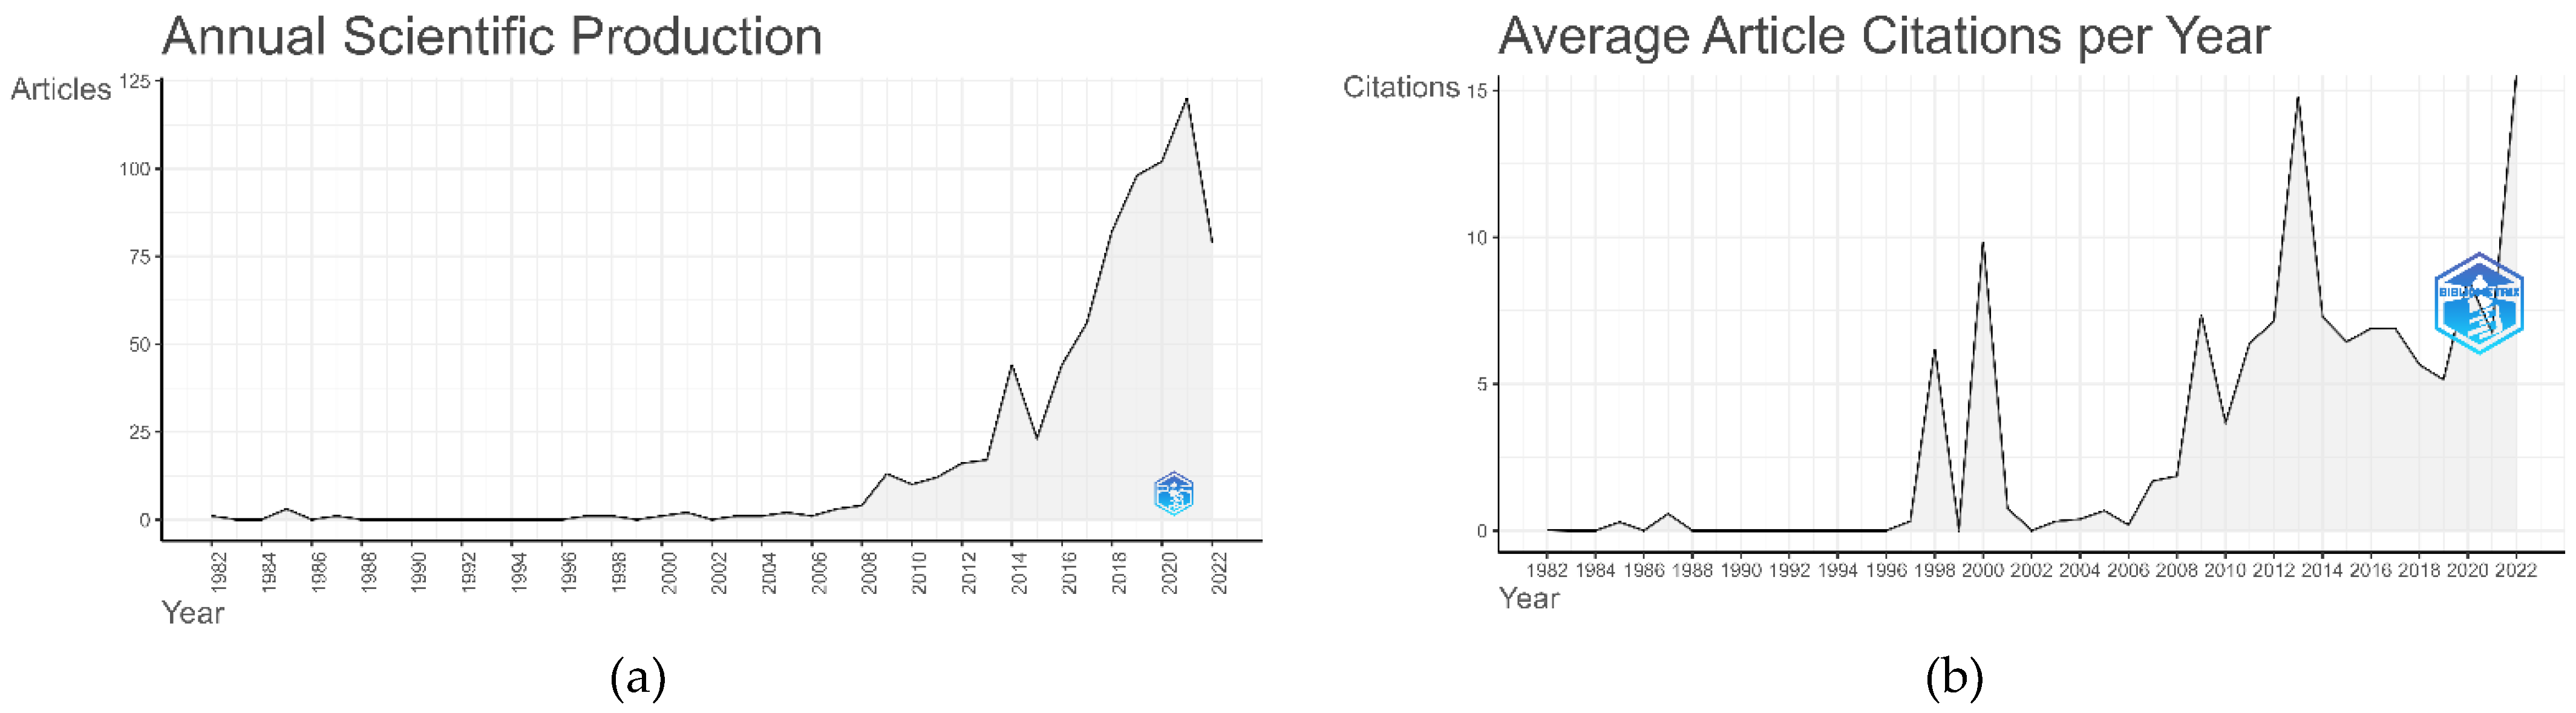
3.1.2. Publication Output

Figure 3a shows an important increase in studies published over the previous years, indicating the academic community’s increasing interest. The annual growth rate changed from 1 document in 1982 to 120 documents in 2021. In 2022 (September), there are 79 published studies about this topic thus far, so this trend is expected to continue through 2022 and into the future. However, annual publication trends can be divided into two time periods. During the first one, until 2014, there were limited research contributions. The second period is from 2014 on (September 2022), when there was a significant increase in the research contributions due to the advance in the methodologies to address the issue. Figure 2b illustrates the average number of citations per year, indicating that 2014 was the year with the highest average number of citations (14.8%).

3.1.3. Discipline-Wise Analysis

Figure 4 shows the articles published by each source in order of importance in researching dynamic co-movements among oil prices and financial assets (including energy markets and assets related to sustainable finance). It was found that this topic has been extensively studied, mainly in the journal Energy Economics (93). The second leading journal in occurrences was Resources Policy (30), and the third and fourth most relevant journals were the North American Journal of Economics and Finance (22) and Economic Modelling (21), respectively. This shows that these are essential sources for the associated research.

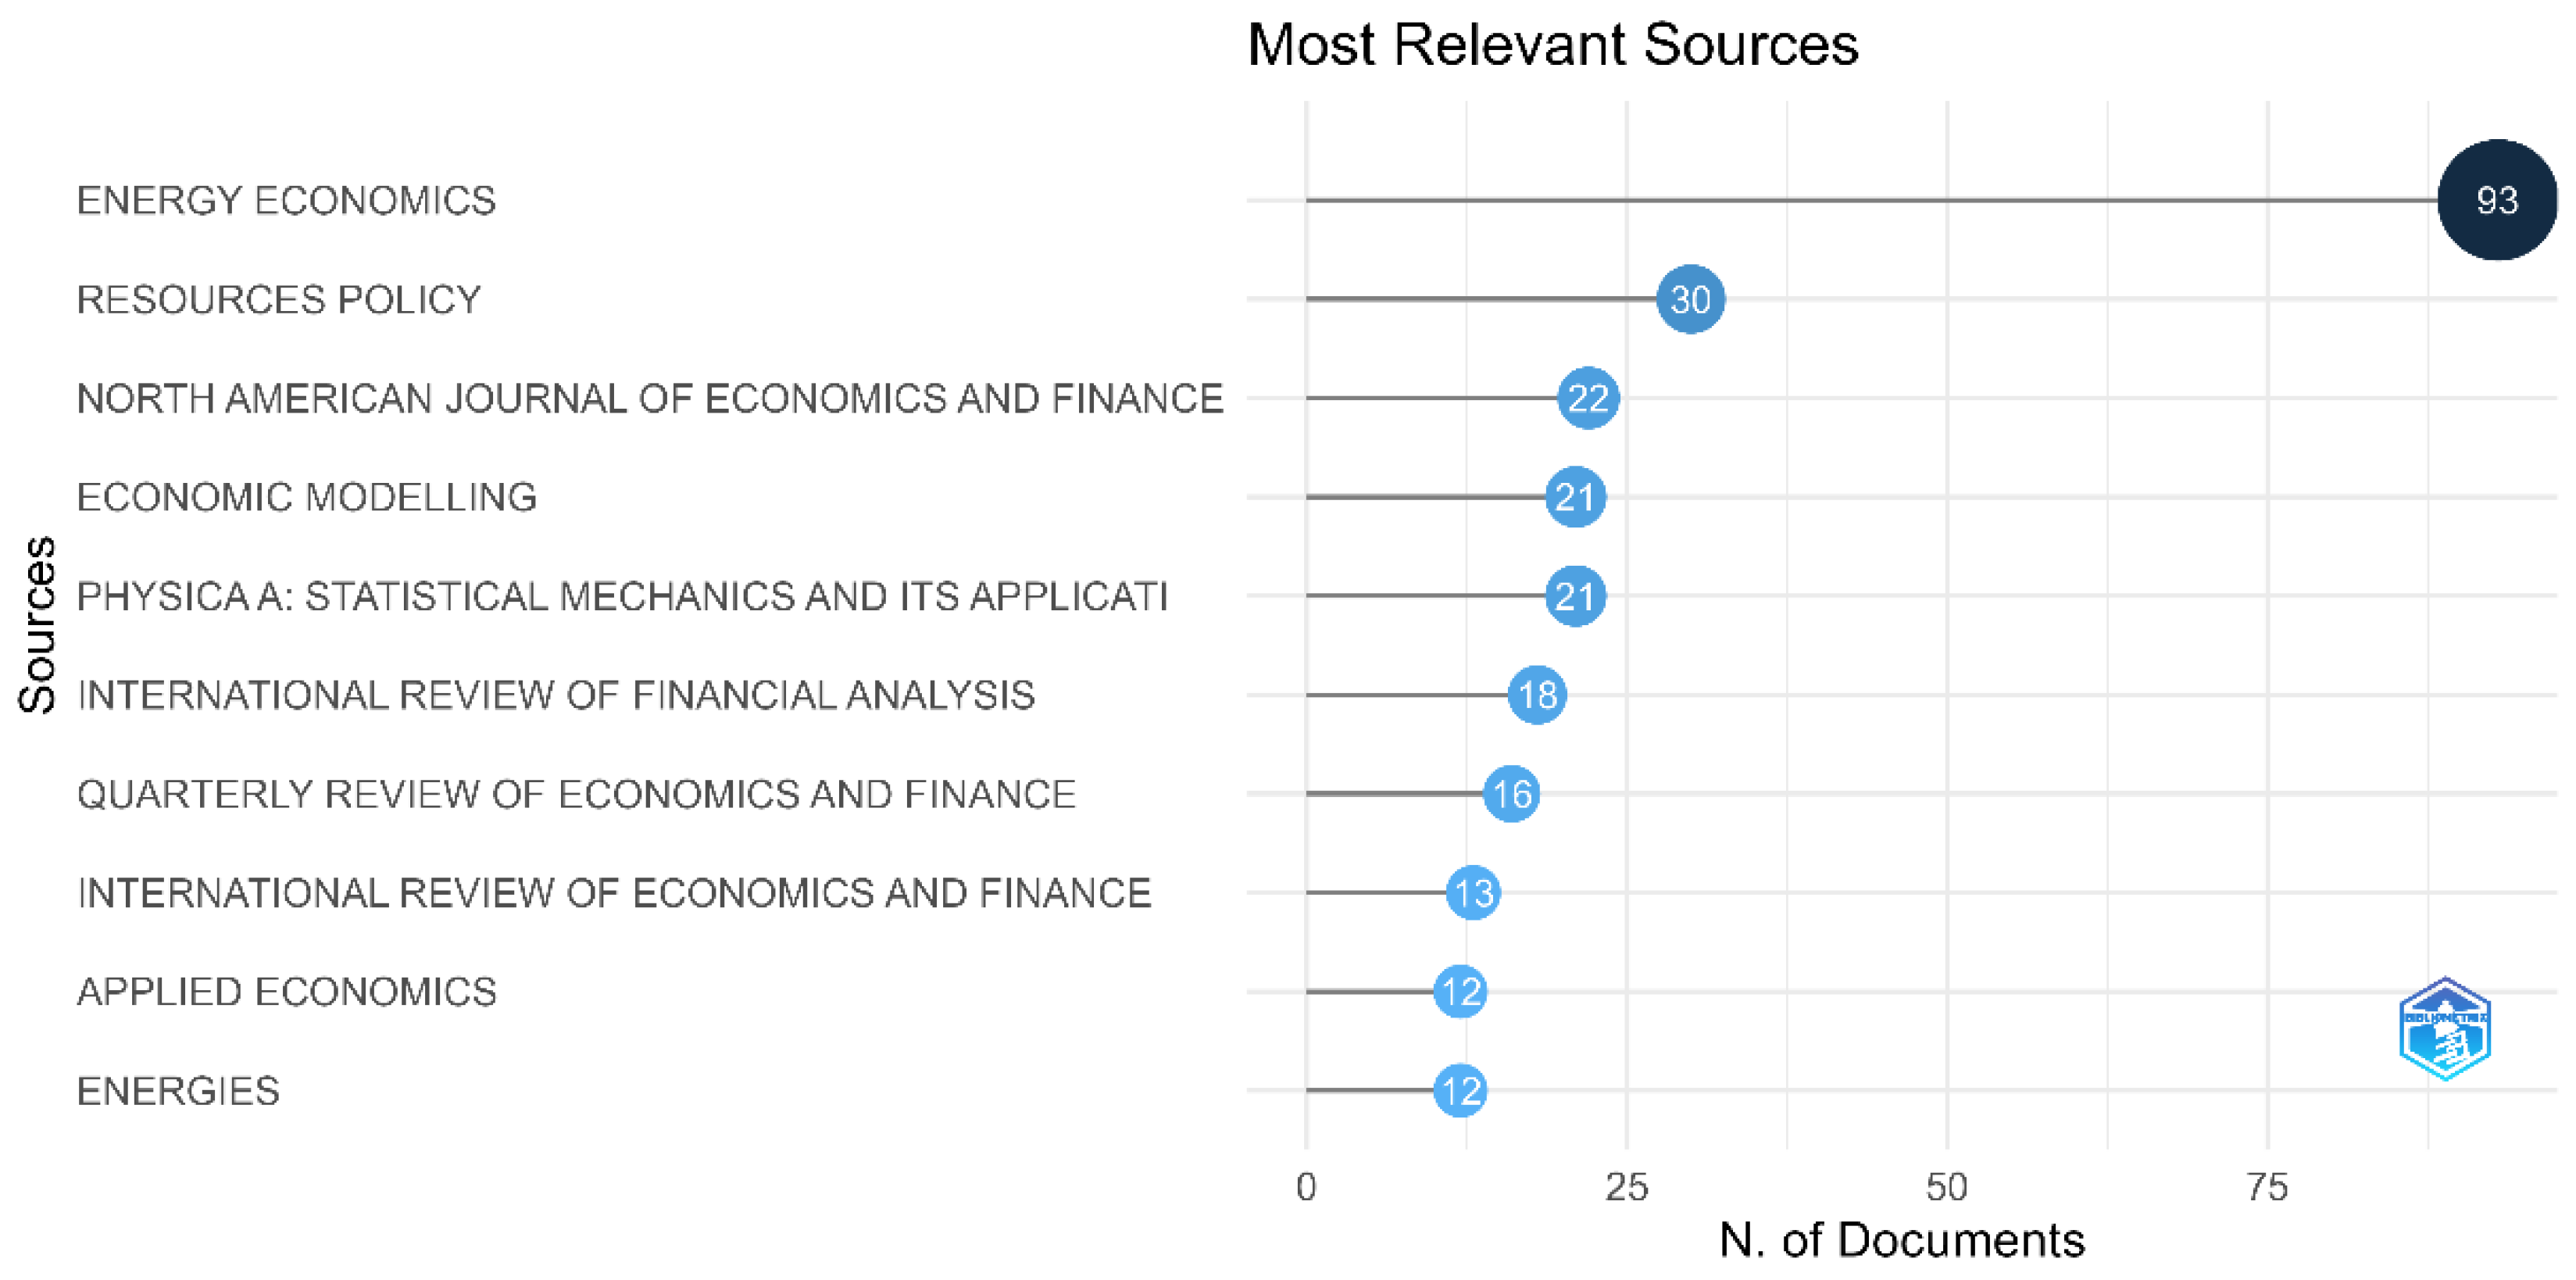
3.1.4. Most Relevant Sources

This section discusses the most significant and influential sources in the research of dynamic co-movements among oil prices and assets in financial markets (including energy markets and sustainable finance). Figure 5a illustrates the distribution of the most cited sources. According to the number of citations, Energy Economics with 1530 citations is ranked at the top, followed by Economic Modelling (430) and Journal of Banking & Finance (357). These results agree with [4], showing that Energy Economics is the most significant platform in our research area, focusing on analyzing the oil prices–stock market relationship. Bradford’s Law [26] (Figure 5b) includes only ten journals in zone 1 or the core area that is the most frequently cited in the literature of this subject. These, along with their frequency, are Energy Economics (93), Resources Policy (30), North American Journal of Economics and Finance (22), Economic Modelling (21), Physica A: Statistical Mechanics and Its Applications (21), International Review of Financial Analysis (18), Quarterly Review of Economics and Finance (16), International Review of Economics and Finance (13), Applied Economics (12), and Energies (12). Zones 2 and 3 have 55 and 224 journals, respectively. The dominance of two open access journals in the core of this research discourse emphasizes the importance of scientific knowledge being freely and openly accessible.

3.2. Analysis of the Authors

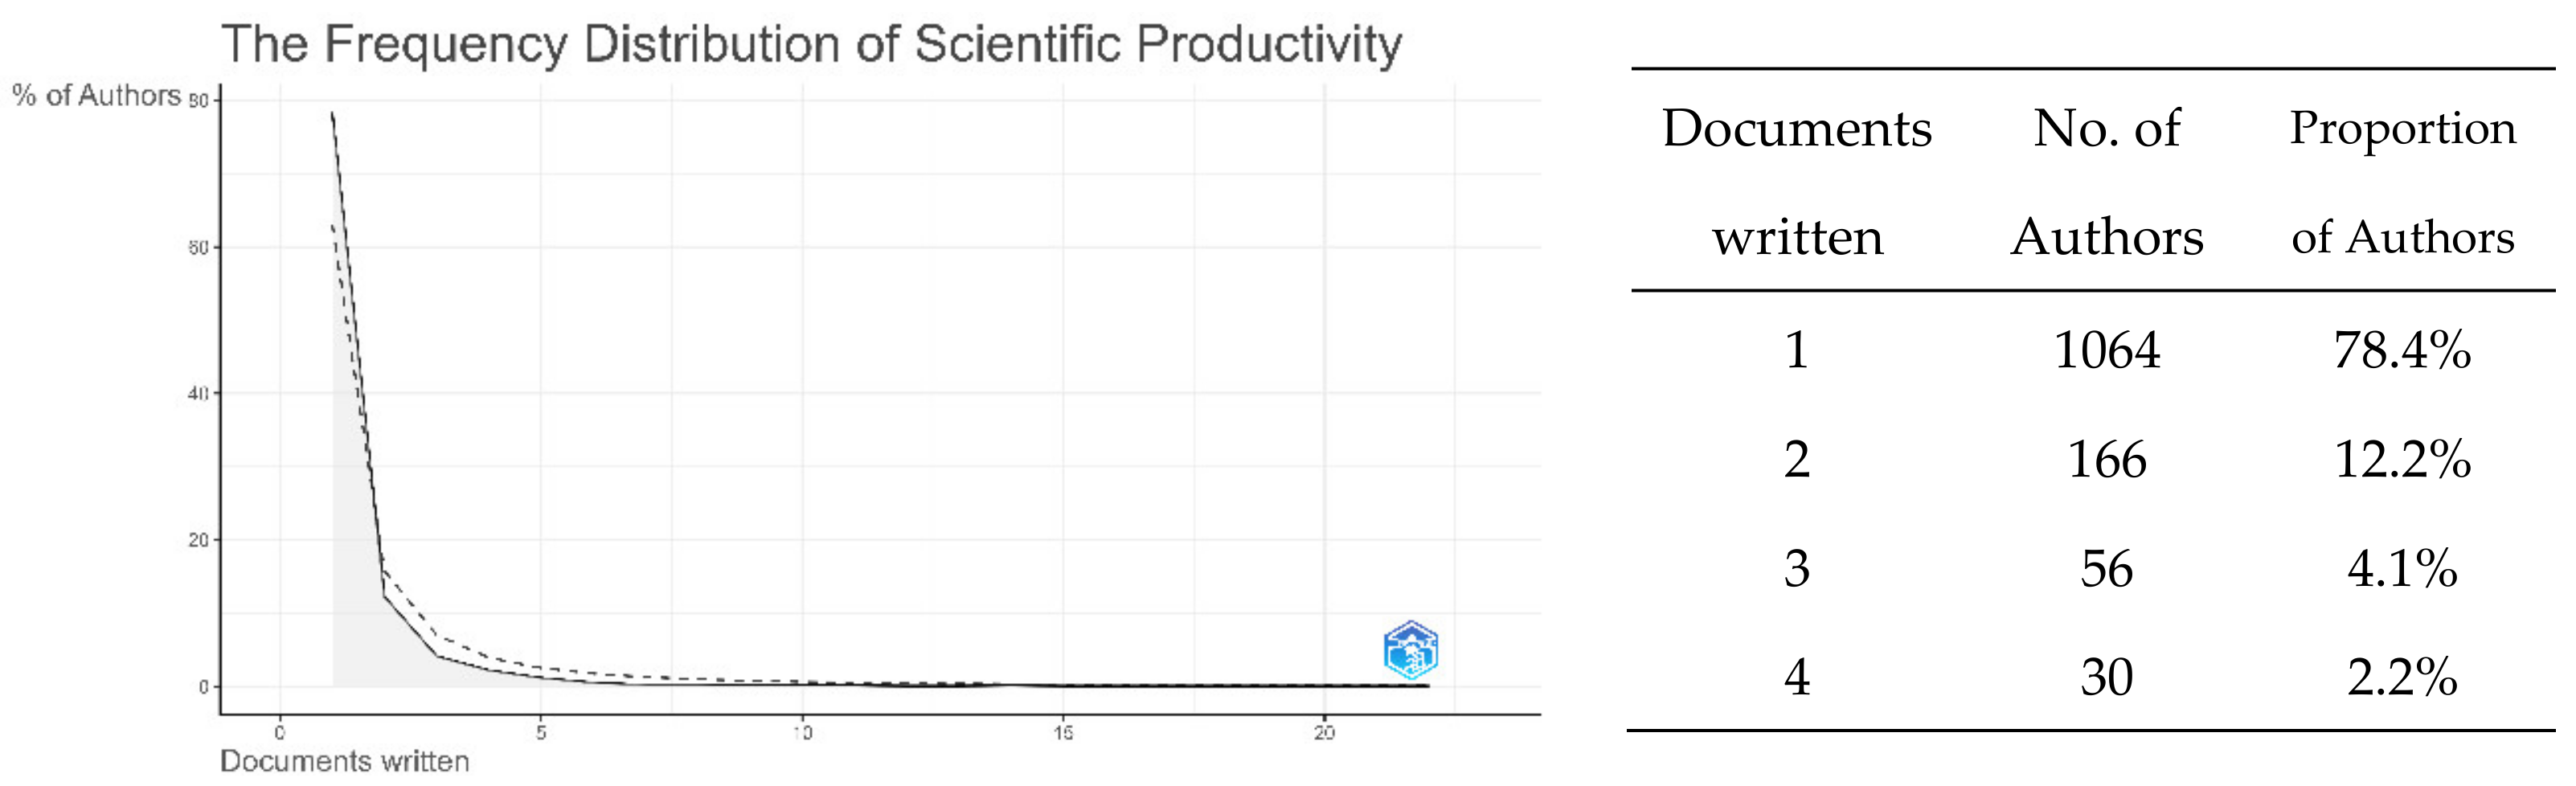
3.2.1. Authors’ Productivity

Lotka’s Law [27] identifies and describes researchers with a higher production frequency in a given knowledge area. Figure 6 presents the results for papers on dynamic co-movements among oil prices and financial assets (including energy markets’ sustainable finance) alongside the predicted distribution according to Lotka. For this study, the results indicate a Lotka’s index in which 78.4% of the authors would write one article, 12.2% would write two, 4.1% would write three, and 2.2% would write four. This indicates that dynamic co-movements among oil prices and assets in financial markets authorship do not currently comply with Lotka’s Law. The dashed line in the figure depicts the graph that should be in accordance with Lotka’s Law.

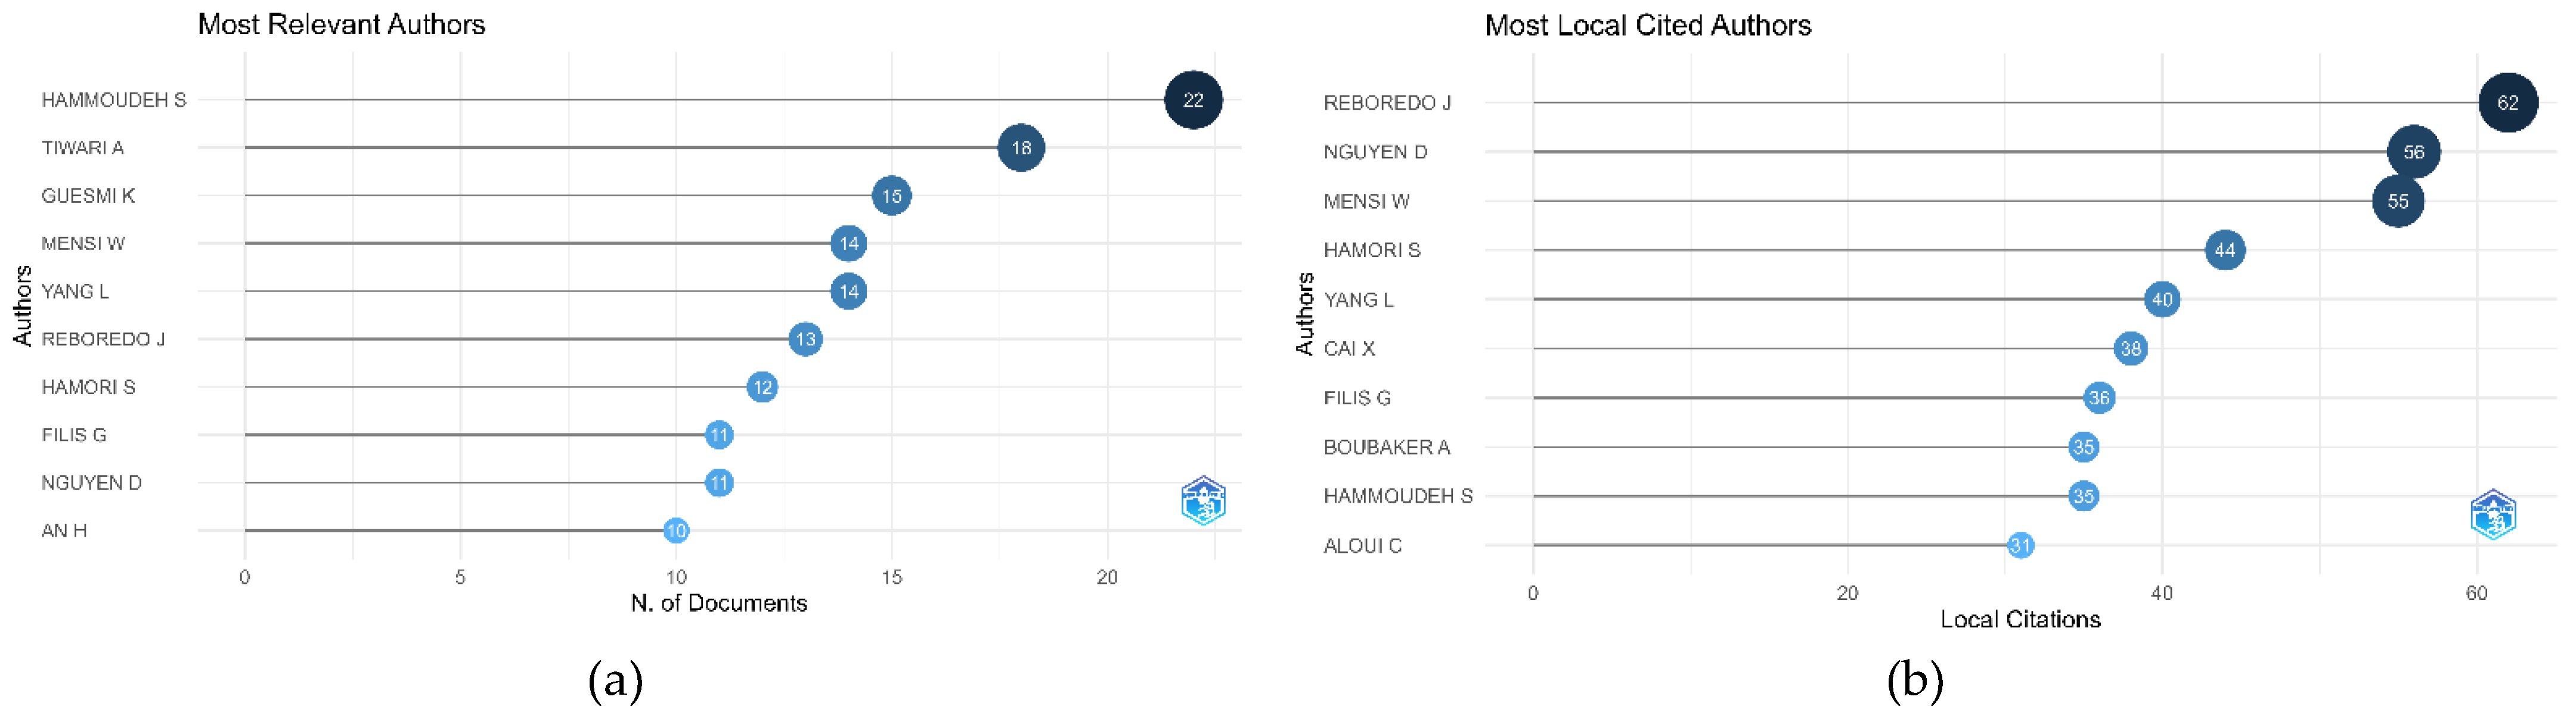
3.2.2. Most Relevant Authors and Authors’ Impacts

Figure 7 illustrates the top five most relevant authors based on the number of published articles: (i) Hammoudeh, (ii) Tiwari, (iii) Guesmi, (iv) Mensi, and (v) Yang. Based on the number of local citations, the top five authors concerning the impact on dynamic co-movements among oil prices and assets in financial markets publication outputs are (i) Reboredo, (ii) Nguyen, (iii) Mensi, (iv) Hamori, and (v) Yang. Table 2 shows the top 20 most relevant authors in publications on dynamic co-movements among oil prices and financial assets between 1982 and 2022 based on the H_index.

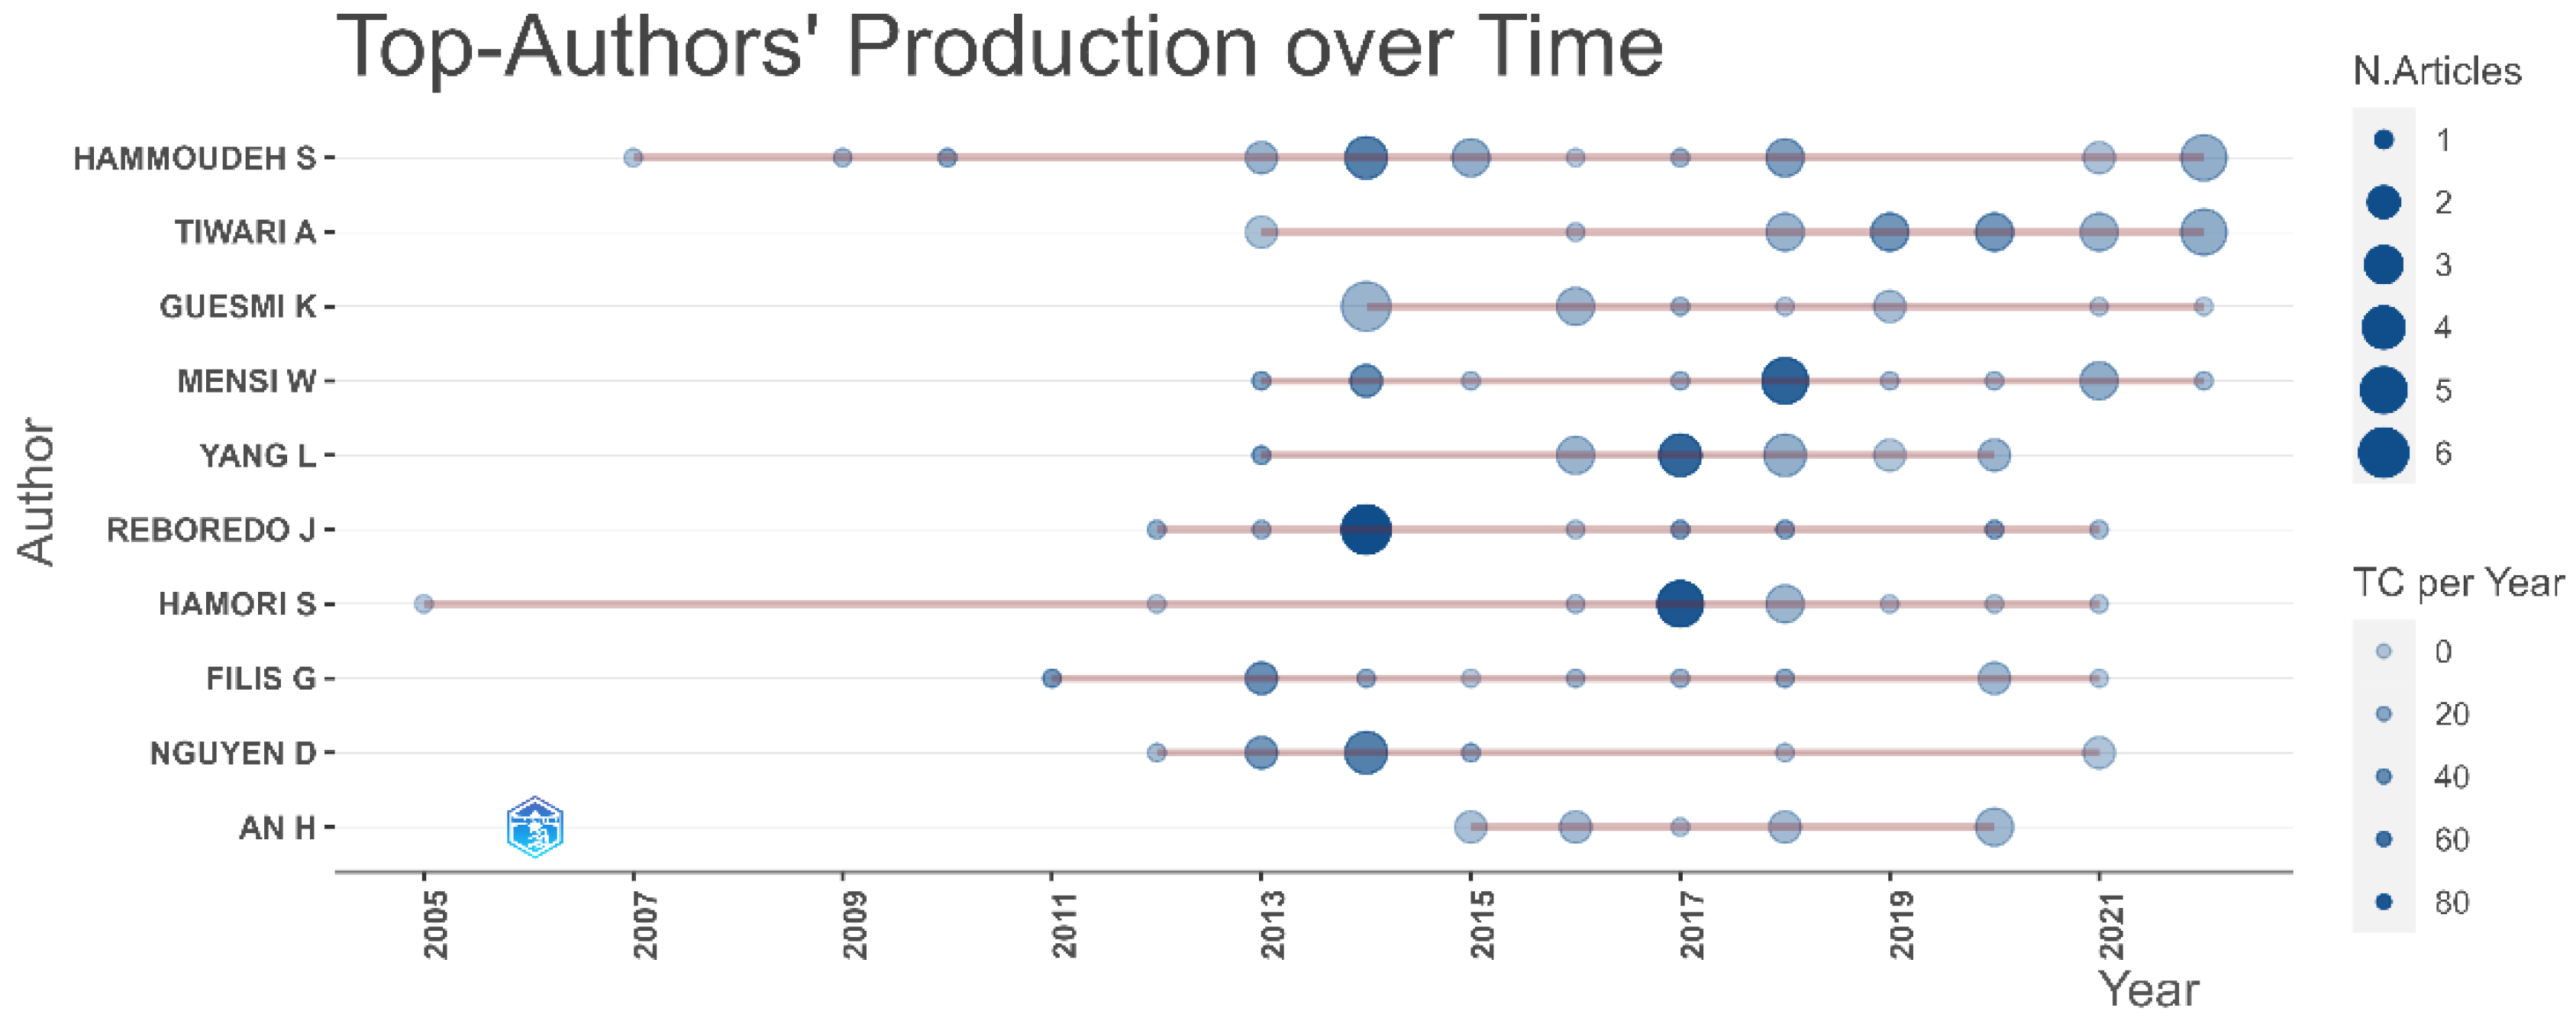
3.2.3. Authors’ Production over Time

The top authors’ documents on dynamic co-movements among oil prices and assets in financial markets analysis over the years are presented in Figure 8. The color intensity in the graph is related to the citation year, and the bubble dimension represents the various authors’ yearly publications. For example, in 2007, Hammoudeh published his first article about this topic. Later, in 2017, four papers were published, and in 2022, five documents were published.

3.2.4. The Leading Countries and Institutions

The world’s leading countries and institutions were analyzed as part of the research. In first place, China appears as the most prolific country in the production of documents on this theme, with a total of 160 publications. In second place is the United States (50), and in third place is France (33). Table 3 presents a list of other top nations. Drexel University in the United States leads the top 10 institutions with the publication of 22 articles. In the following position, there is the Ipag Business School (France) with 15 articles; next are Hunan University (China) and Pusan National University (South Korea) with 12 articles. Other distinguished institutions are shown in Table 4.

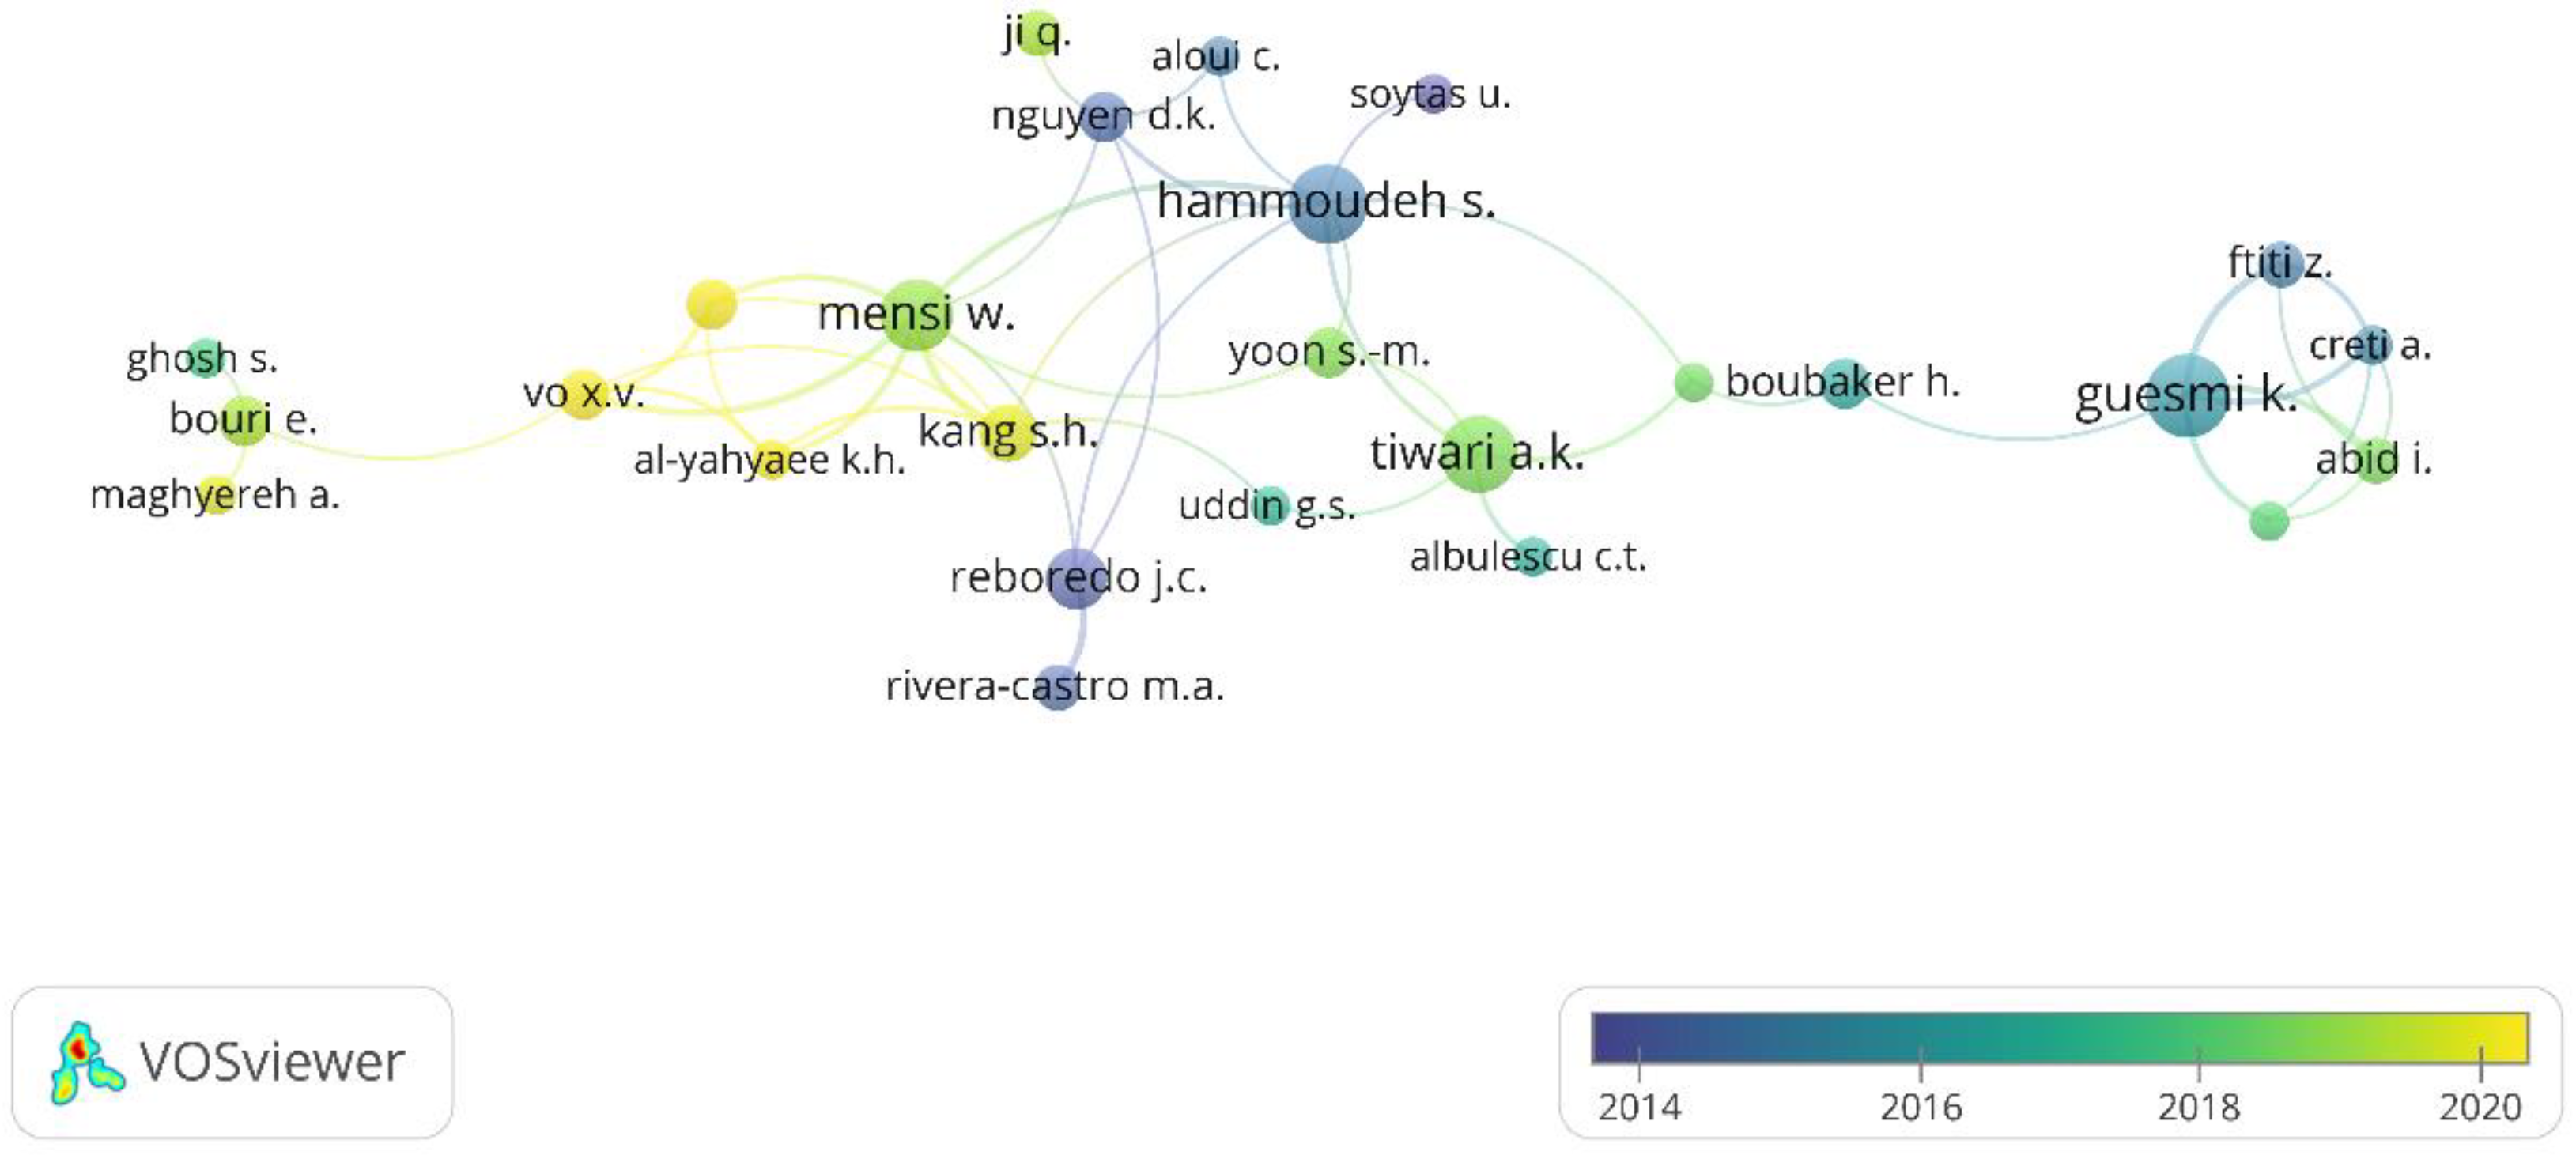
3.2.5. Co-Author Analysis

In the co-author analysis, the number of documents in which two or more researchers are co-authors is an important issue. The map visualization shows the links as colored lines among the items. The weight attributes reveal the importance of the identified network, which is reflected in the item’s size. Finally, the number of lines among the co-authors indicates their relevance within the bibliographic data analysis [22].
Figure 9 presents the connections between researchers according to the conjointly elaborating documents. Thus, this figure allows us to examine the existence and characteristics of collaboration networks and possible established groups of authors that center on studying the dynamic association between assets in financial markets. The network obtained reveals the existence of 966 authors and 56 links that are formed in eight clusters. These clusters are very dispersed, but several research co-authorships can be identified, such as Reboredo and Rivera-Castro, Hammoudeh and Tiwari, Nguyen and Aloui, Guesmi and Chevallier, Bouri and Maghyereh, and Mensi and Kang, among others.

3.3. Analysis of the Documents

3.3.1. The Most Impactful Documents

Table 5 shows the 10 most globally cited documents in the research of dynamic co-movements among oil prices and assets in financial markets, with worldwide citation counts ranging from 246 to 865. Kilian and Park [28]; Sharif, Aloui, and Yarovaya [29]; and Filis, Degiannakis, and Floros [30] have the most citations worldwide, receiving 865, 517, and 403, respectively, and their papers are listed as the top three most referenced publications.
The most cited 10 articles mainly focus their analysis on three aspects: (i) the impact of oil price shocks on the financial markets, (ii) global factors that impact stock markets, and (iii) correlations and volatility spillovers between commodities and stock markets. These three aspects reflect how oil price shocks and other shocks on macroeconomic fundamentals affect the dynamics of commodity and stock markets.
Kilian and Park [28] presented how the U.S. real stock returns reacted to an oil price shock, differing depending on whether the oil price change was driven by demand or supply shocks in the oil market. Sharif, Aloui, and Yarovaya [29] explored the time–frequency relationship between the COVID-19 outbreak, oil price, geopolitical risk, economic uncertainty, and the U.S. stock market using the continuous wavelet transform, the wavelet coherence, and the wavelet-based Granger causality tests. This study shows that the COVID-19 pandemic caused an outcome disruption, a notable increase in U.S. economic policy uncertainty, and an unprecedented response from the stock market.
Filis, Degiannakis, and Floros [30] studied the time-varying correlation between the stock market prices and oil prices for oil-importing and oil-exporting countries using the DCC-GARCH-GJR approach on data from six oil-exporting countries. Their findings of contemporaneous correlation show that although the time-varying correlation does not differ for oil-importing and oil-exporting economies, the correlation increases positively (or negatively) in response to significant aggregate demand-side (precautionary demand) oil price shocks, which are caused due to fluctuations of the global business cycle or world turmoil. Moreover, supply-side oil price shocks do not influence the relationship between the two markets. The lagged correlation results show that oil prices negatively affect all stock markets, regardless of the oil price shock origin.
Three of the top 10 most cited documents were published in the journal Energy Economics, followed by the International Review of Financial Analysis with two documents published, showing that these are two essential sources for the related research.

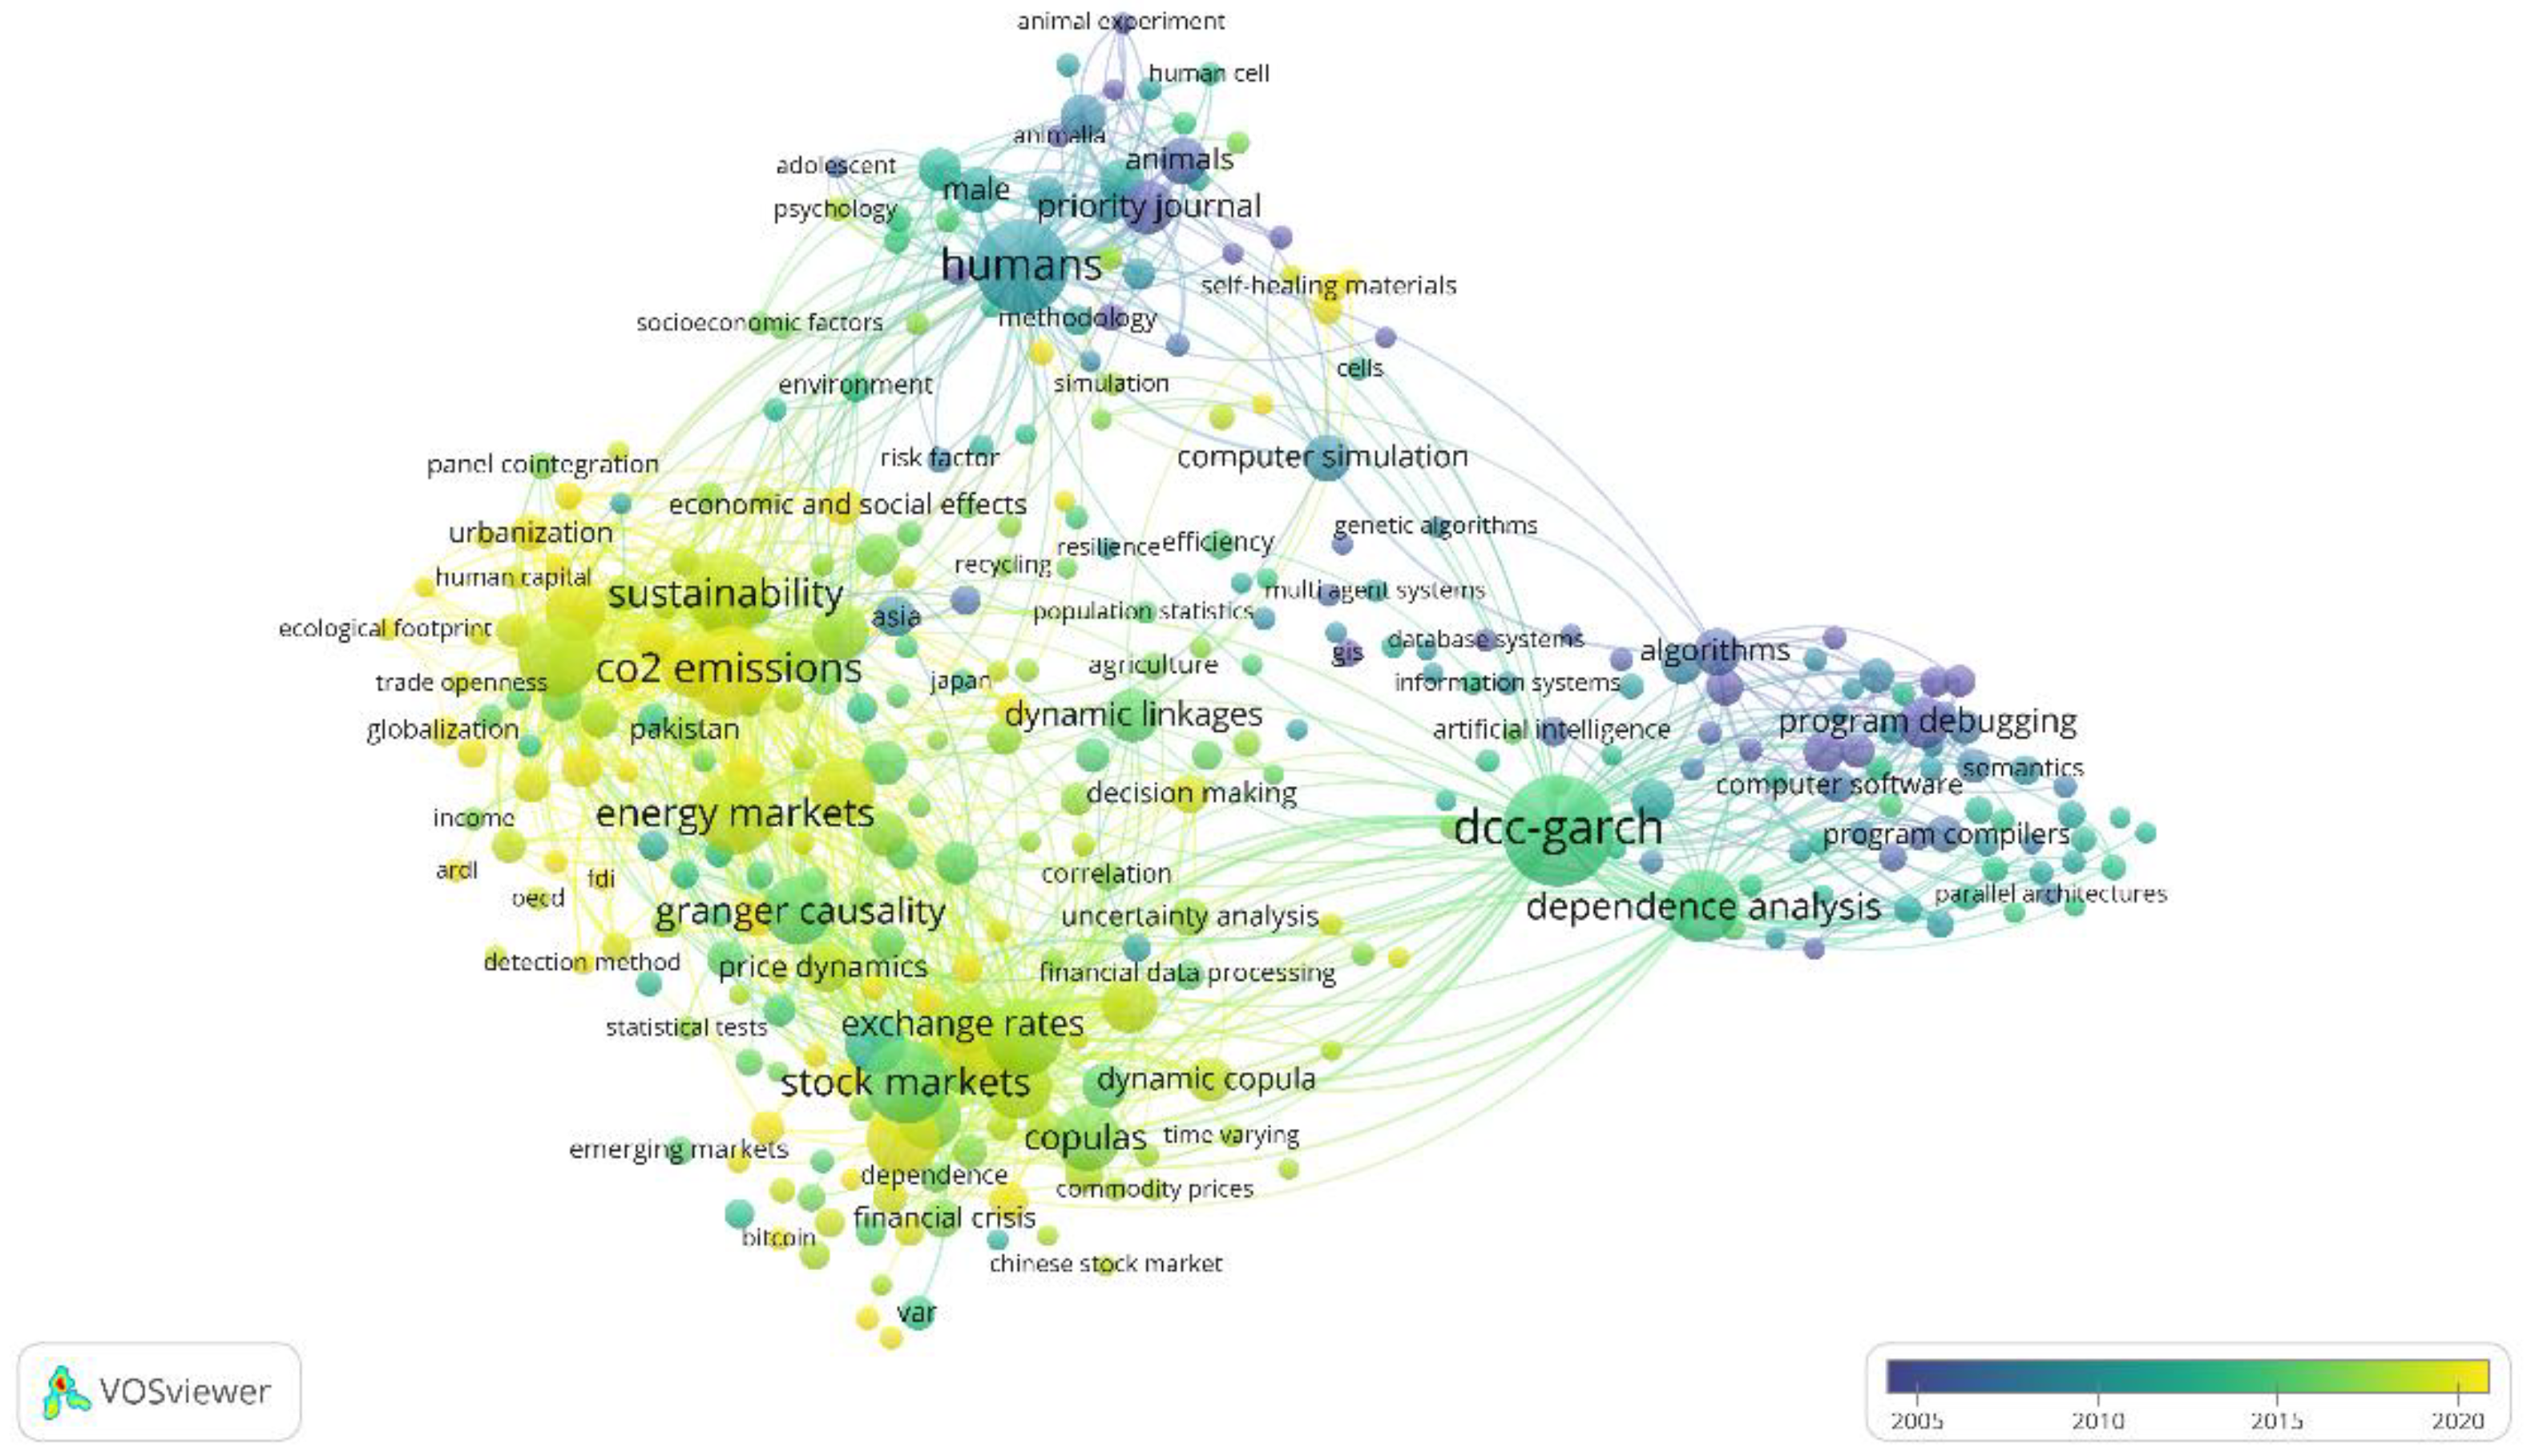
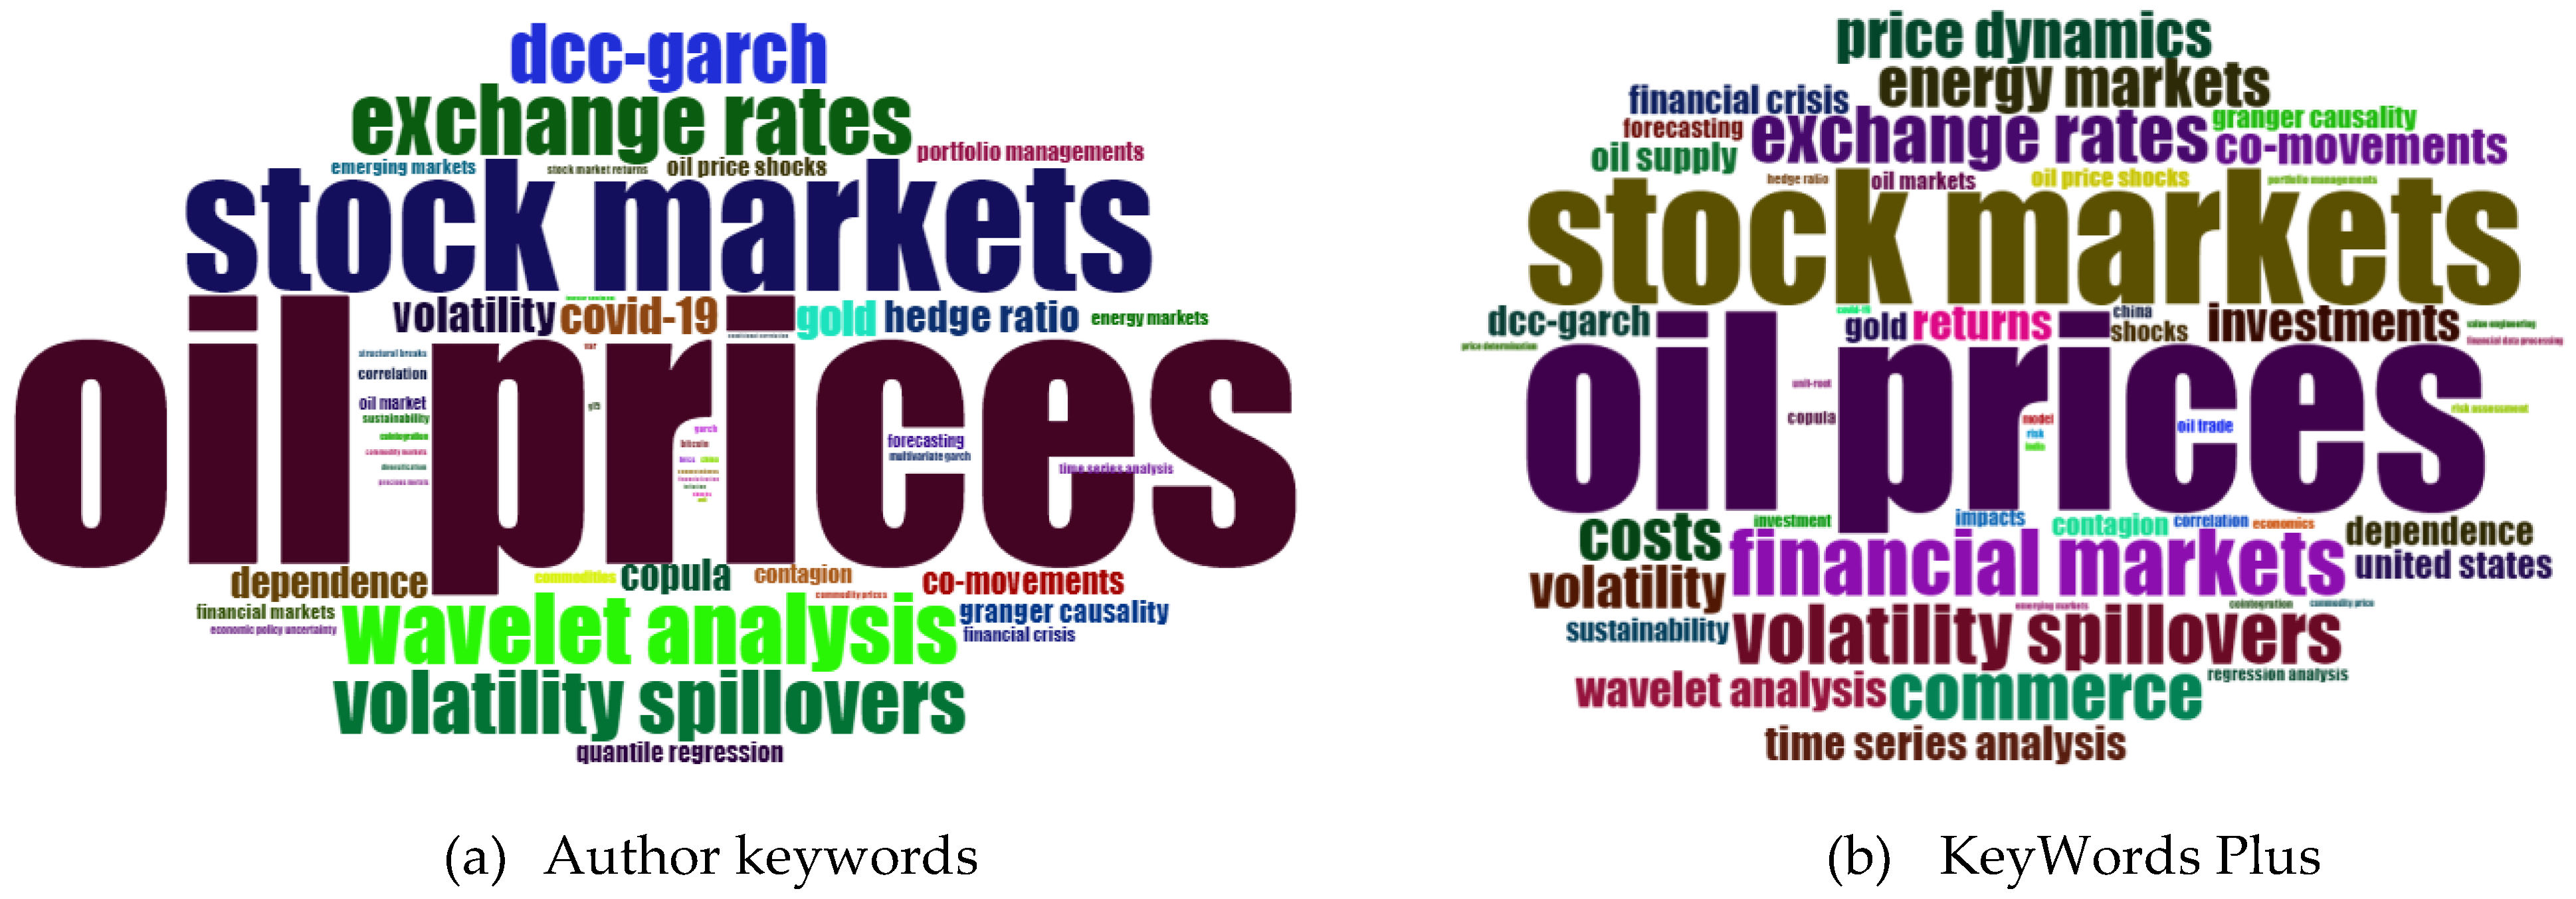
3.3.2. Most Frequent Keywords

The most frequent keywords (author keywords and KeyWords Plus) in the 1982–2022 (September) period are presented in Table 6. Author keyword analysis offers information about research trends under the researchers’ points of view [38]. The KeyWords Plus are terms extracted from titles or abstracts [25]. In the two keyword analyses presented, “oil prices” and “stock markets” are the most common. Meanwhile, “exchange rates”, “volatility spillovers”, and “volatility” were also found in both categories. The author keywords give clues about the main methodologies that have been used to measure the co-movements among the variables analyzed. In this way, wavelet analysis is located in first place, with 84 occurrences, followed by volatility spillover, with 75 occurrences. In third place, there is DCC-GARCH methodology, with 71 occurrences. Finally, in the fourth and fifth places, there are hedge ratios and copula, with 39 and 37 occurrences, respectively. KeyWords Plus covers the basic literature related to oil prices and the link with the variables of financial markets and energy markets. Then, according to these keywords, the main topics that are explored when researching the dynamic co-movements among oil prices and financial assets (including energy markets sustainable finance) are volatility spillovers, price dynamics, and volatility.

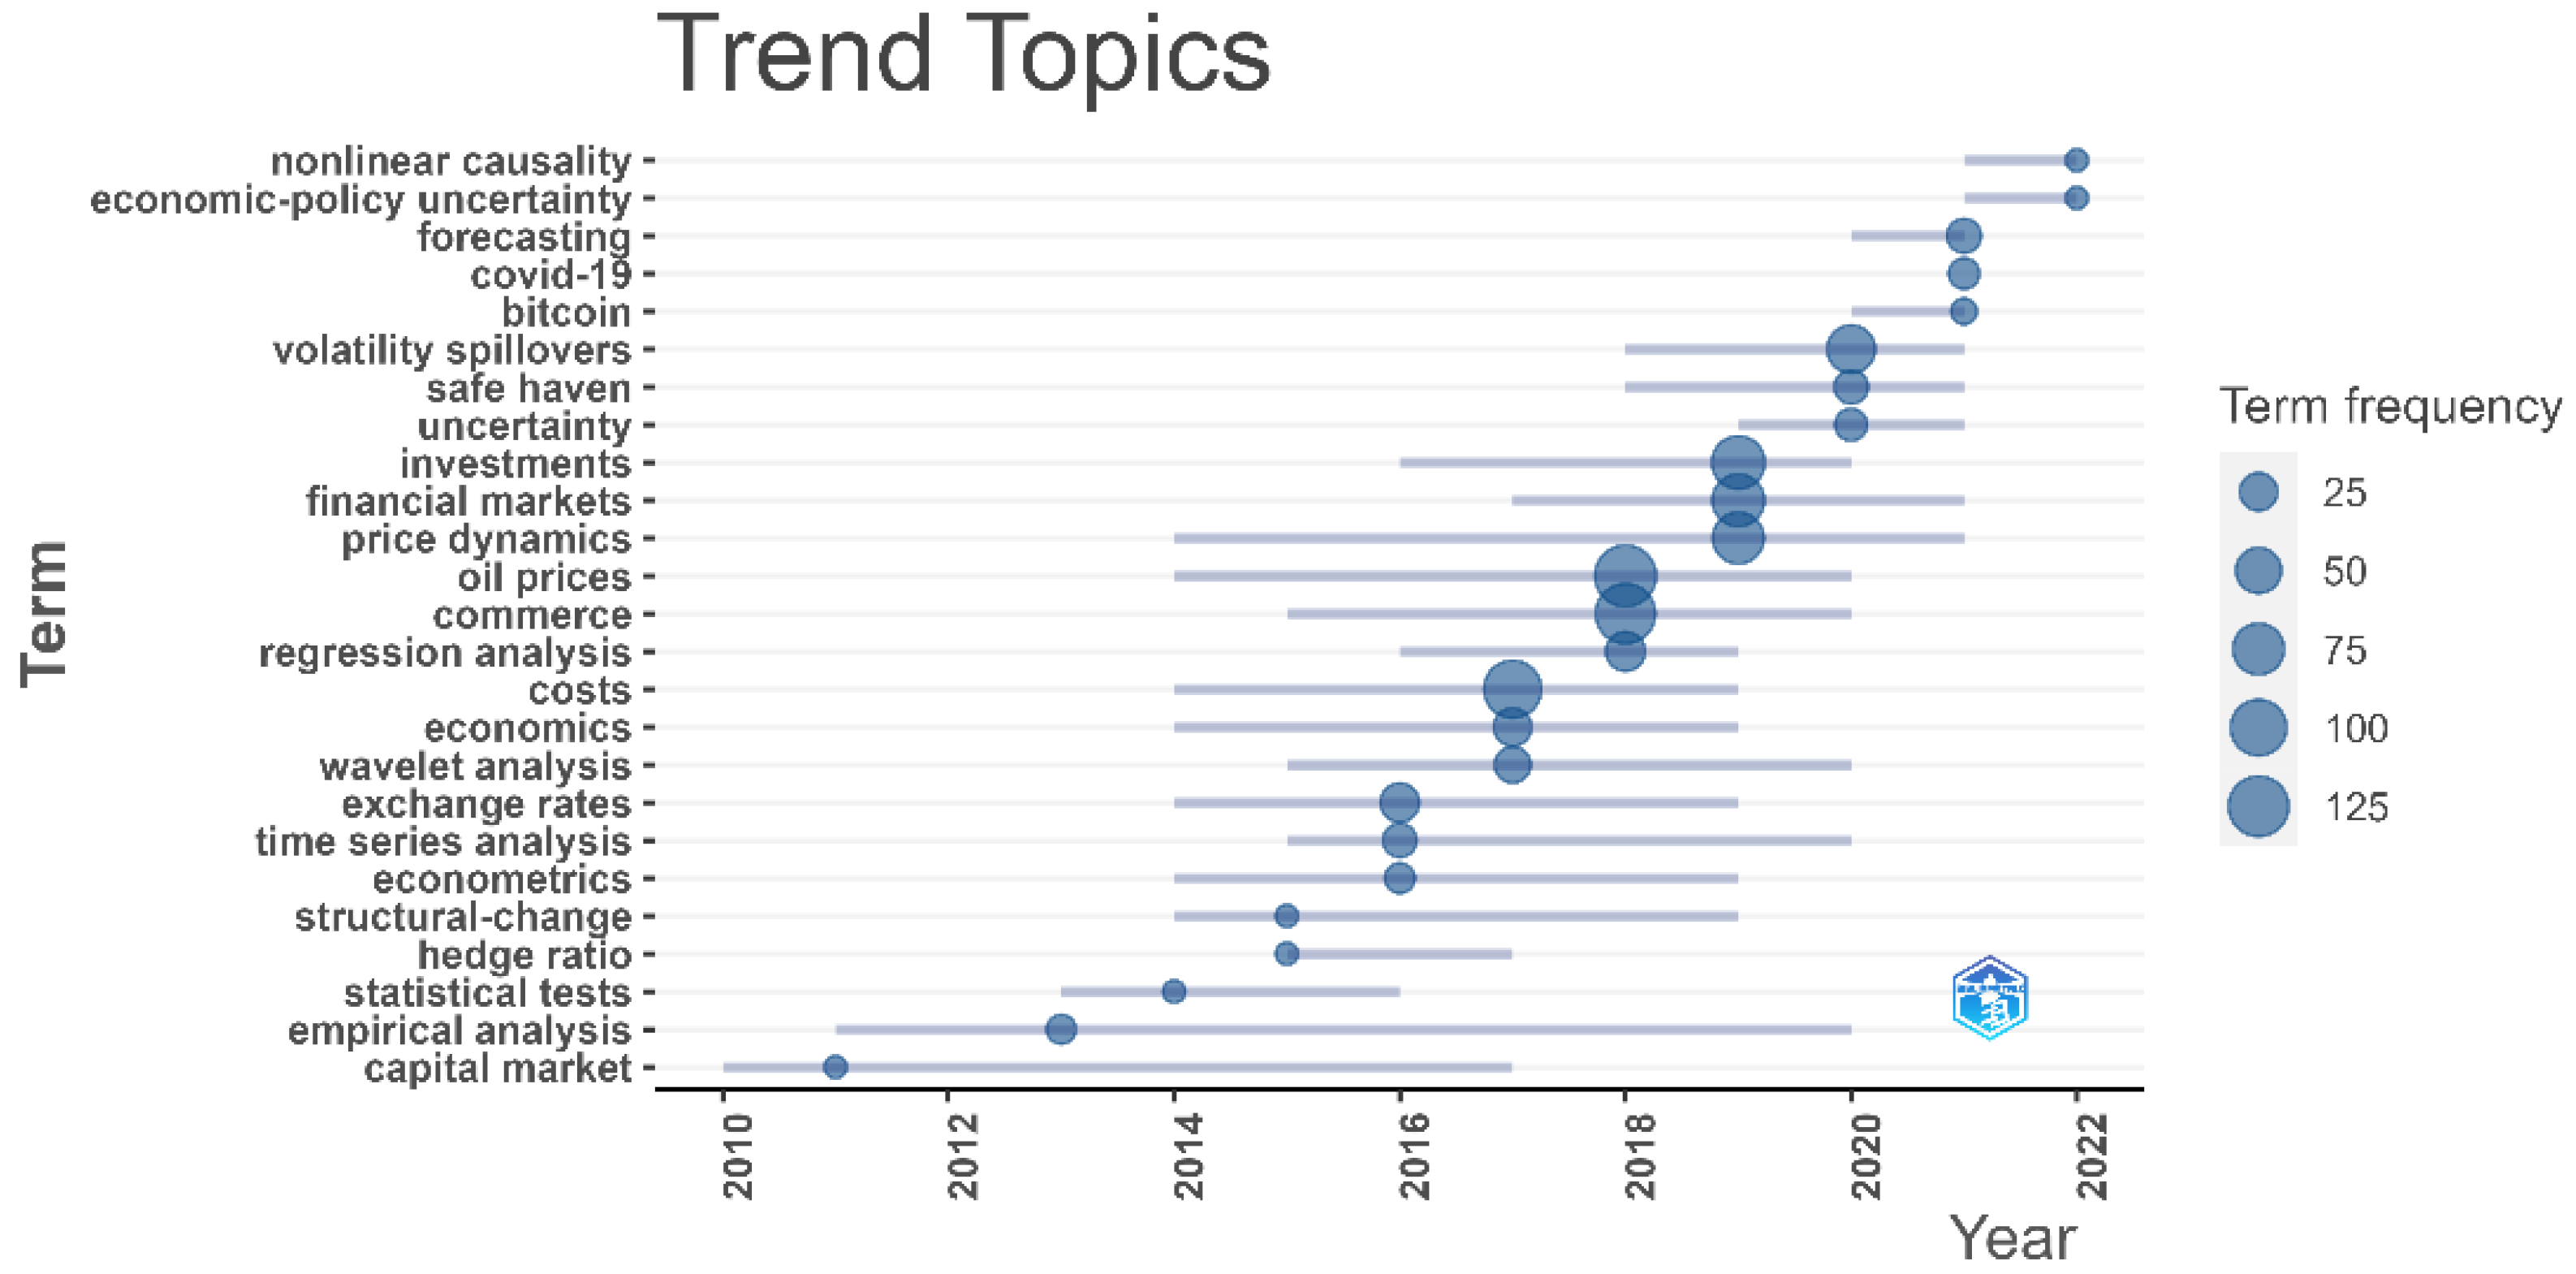
3.3.3. Trend Topics over the Years
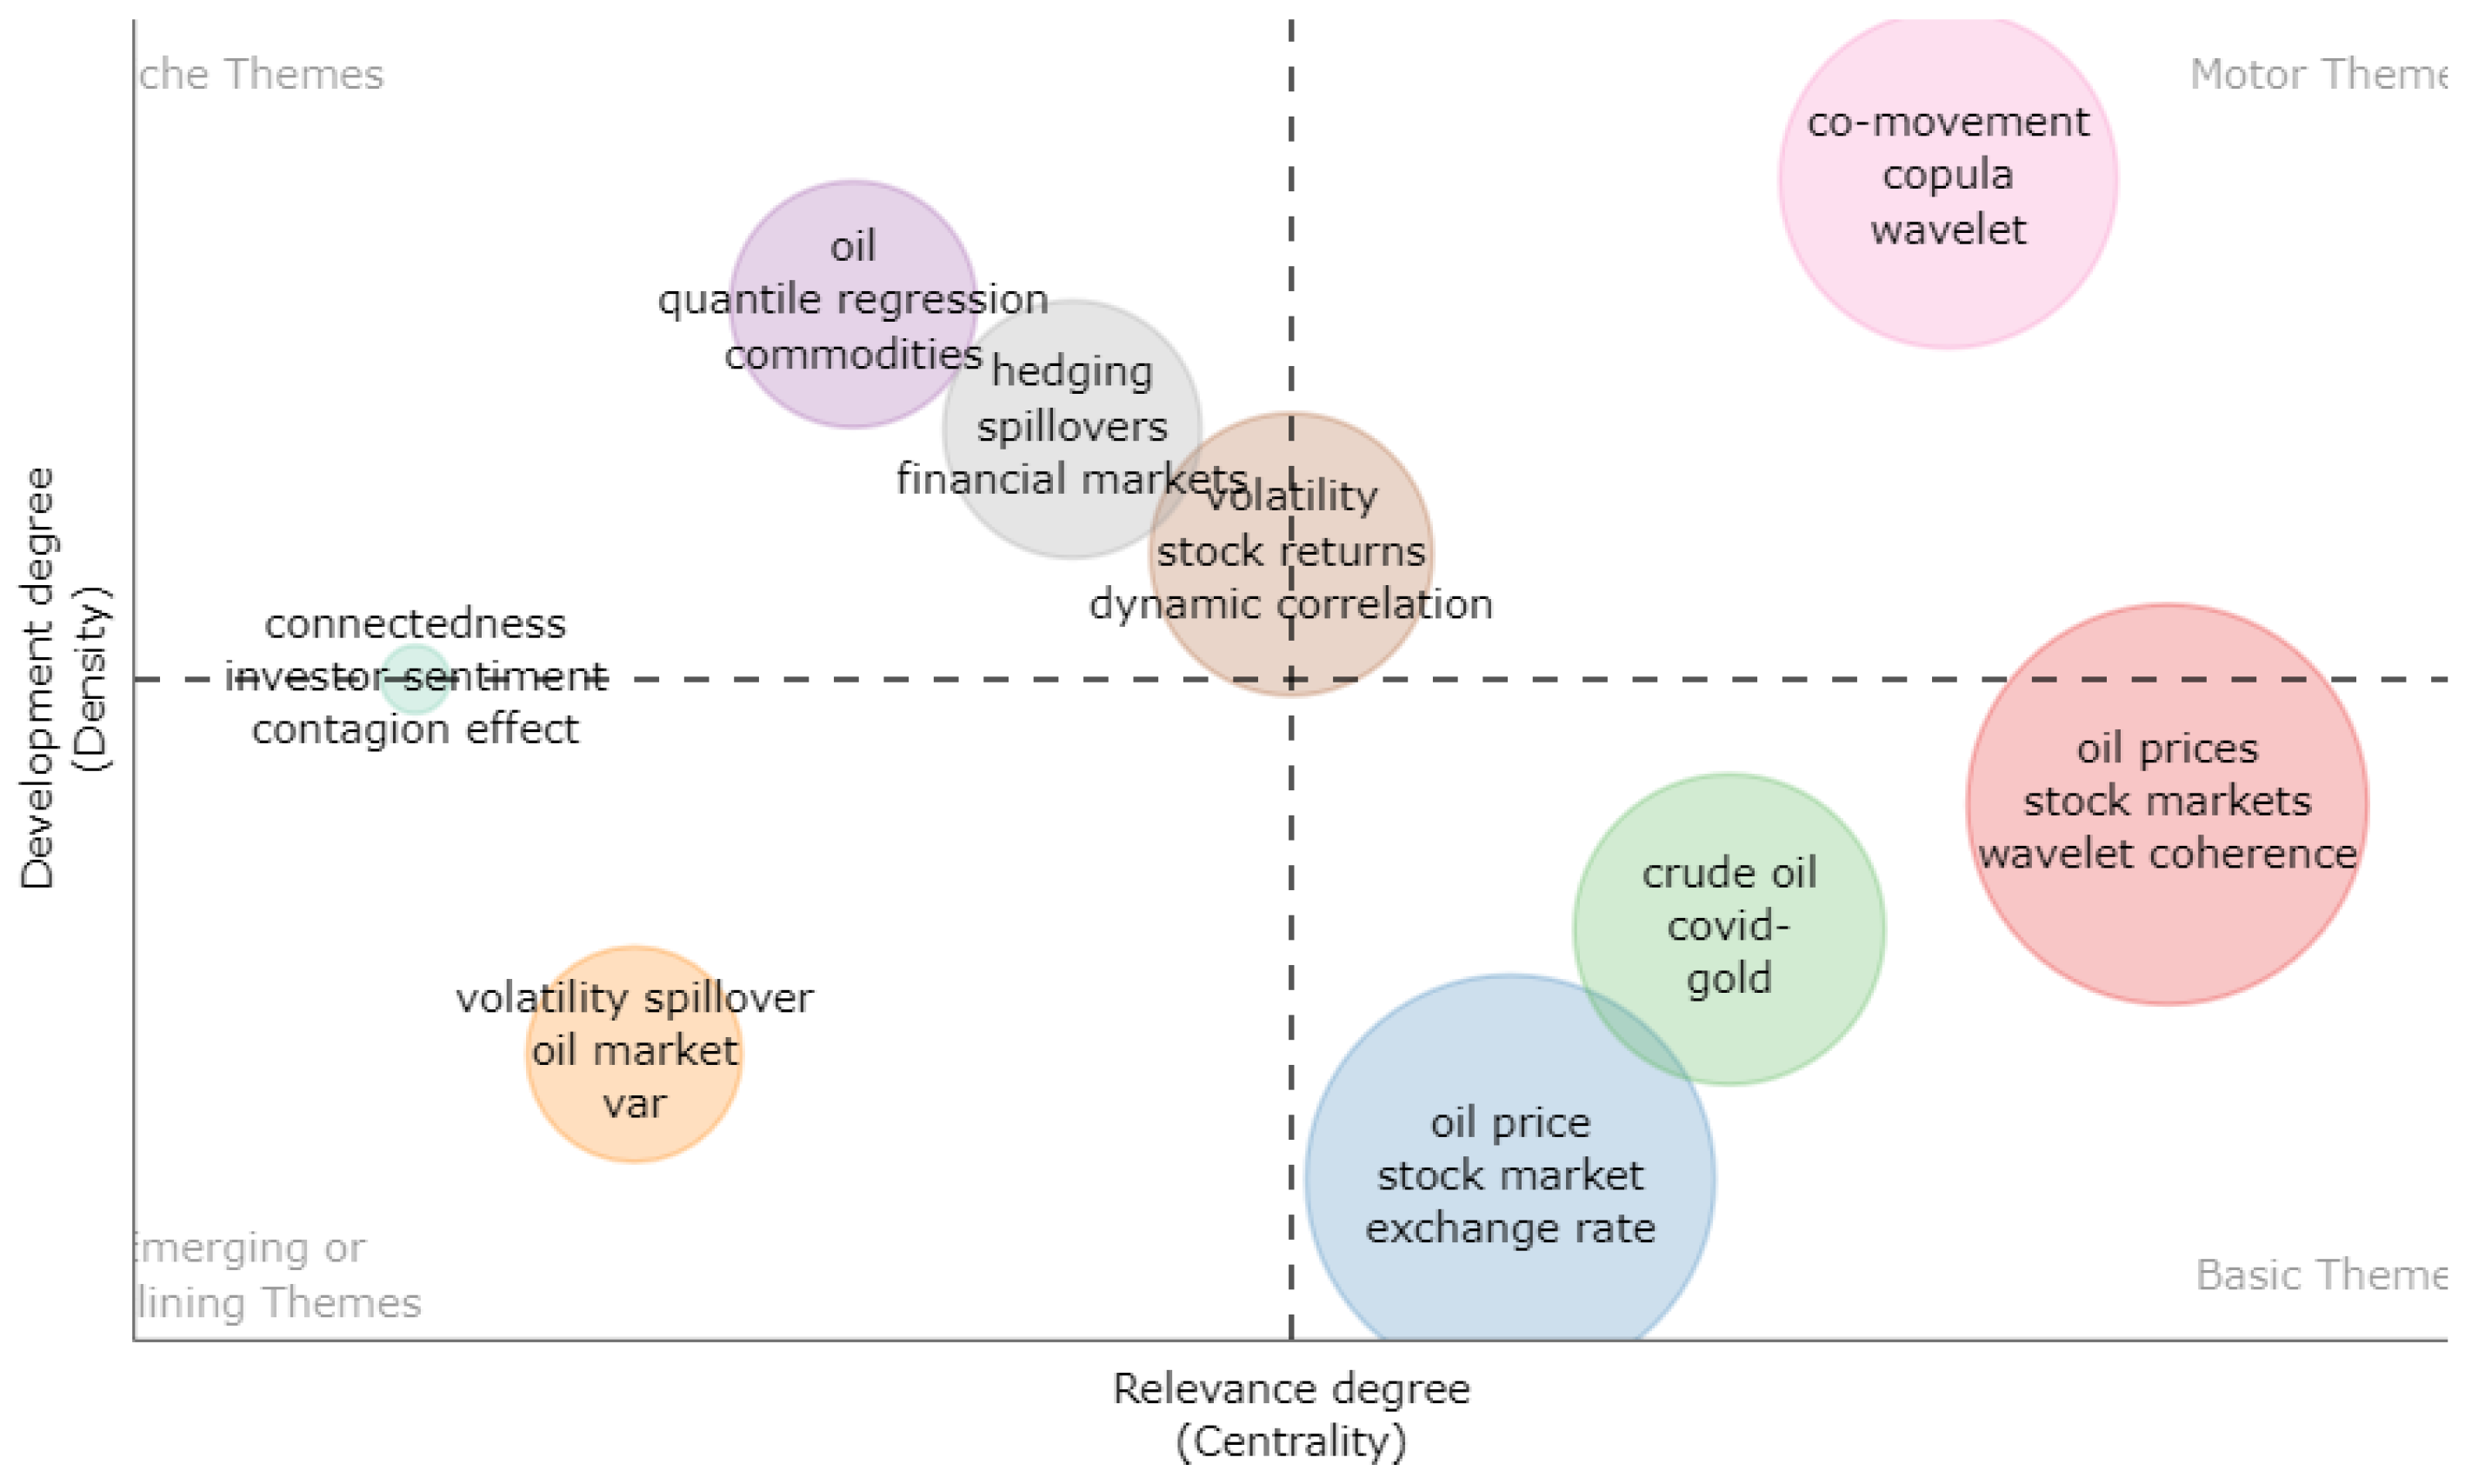
A trending topic analysis is an important mapping tool that helps demonstrate the evolution of literature. Figure 10 depicts the topics that have been identified when examining the author keywords and maintaining a minimum five-word frequency per article three times a year.
In the past few years (2021, 2022), there have been prominent topics, namely nonlinear causality, economic policy uncertainty, forecasting, COVID-19, and bitcoin, which illustrate the new trends in studies searching for nonlinearities in the linkages between variables and uncertainty due to COVID-19 and the recent changes at economic and political levels globally. Between 2019 and 2020, the common topics were volatility spillovers, safe heaven, uncertainty, investments, financial markets, and price dynamics. This reveals the strong interconnection among the world economies and the quest for investment opportunities; thus, the explanation for these keywords was also the global uncertainty. The most frequent quests in the 2016–2018 period were oil prices, commerce, regression analysis, wavelet analysis, exchange rates, and econometrics. During this period, research was focused on the impact of the oil markets on the real economy. In 2015, the popular keywords were structural change and hedge ratio. According to the results, there is a significant research gap in the use of machine learning or deep learning, big data, and artificial intelligence for measuring dynamic co-movements among oil prices and assets in financial markets. The use of these could improve the findings by offering a better understanding of the co-movement among financial and energy markets.
Furthermore, due to the importance of emerging economies in global finance, it is important to extend the existent literature about this kind of analysis involving data from those economies and to analyze the impact of oil shocks on their financial assets, energy markets, and assets related to sustainable finance.

3.3.4. Thematic Map

This analysis presents a thematic map by dividing it into four topic quadrants based on the density and centrality of the issues (Figure 11). The themes in the upper-right quadrant should be examined and studied more profoundly due to their high density and centrality [39]. Nine major keyword clusters were identified.
Figure 11 shows that the first and most promising areas for further research in analyzing dynamic co-movements among oil prices and financial assets are represented by the following keywords: co-movement, copula, and wavelet. Thus, considering the results of Figure 1 and Figure 11, further research will lead to quantifying the co-movements between CO2 emissions, renewable energy instruments, and assets related to sustainable finance or financial markets and oil prices using the copula or wavelet methodologies. Figure 11 also shows the second highest relevance for the keywords oil prices, stock markets, and wavelet coherence; this confirms that an analysis of this type should be included in further research. The third topic with high relevance and density is the use of dynamic correlation and volatility analysis, which are methodologies that could also be applied to data from CO2 emissions and renewable energy instruments or financial markets and oil prices. In the fourth theme, the principal keywords are crude oil, COVID-19, and gold. Then, using the methodologies identified before, an analysis may emerge as further research. The fifth theme is represented by the keywords hedging, spillovers, and financial markets. Finally, the sixth group includes quantile regression and commodities, emerging as further topics than can be analyzed due to the high density of the topics.

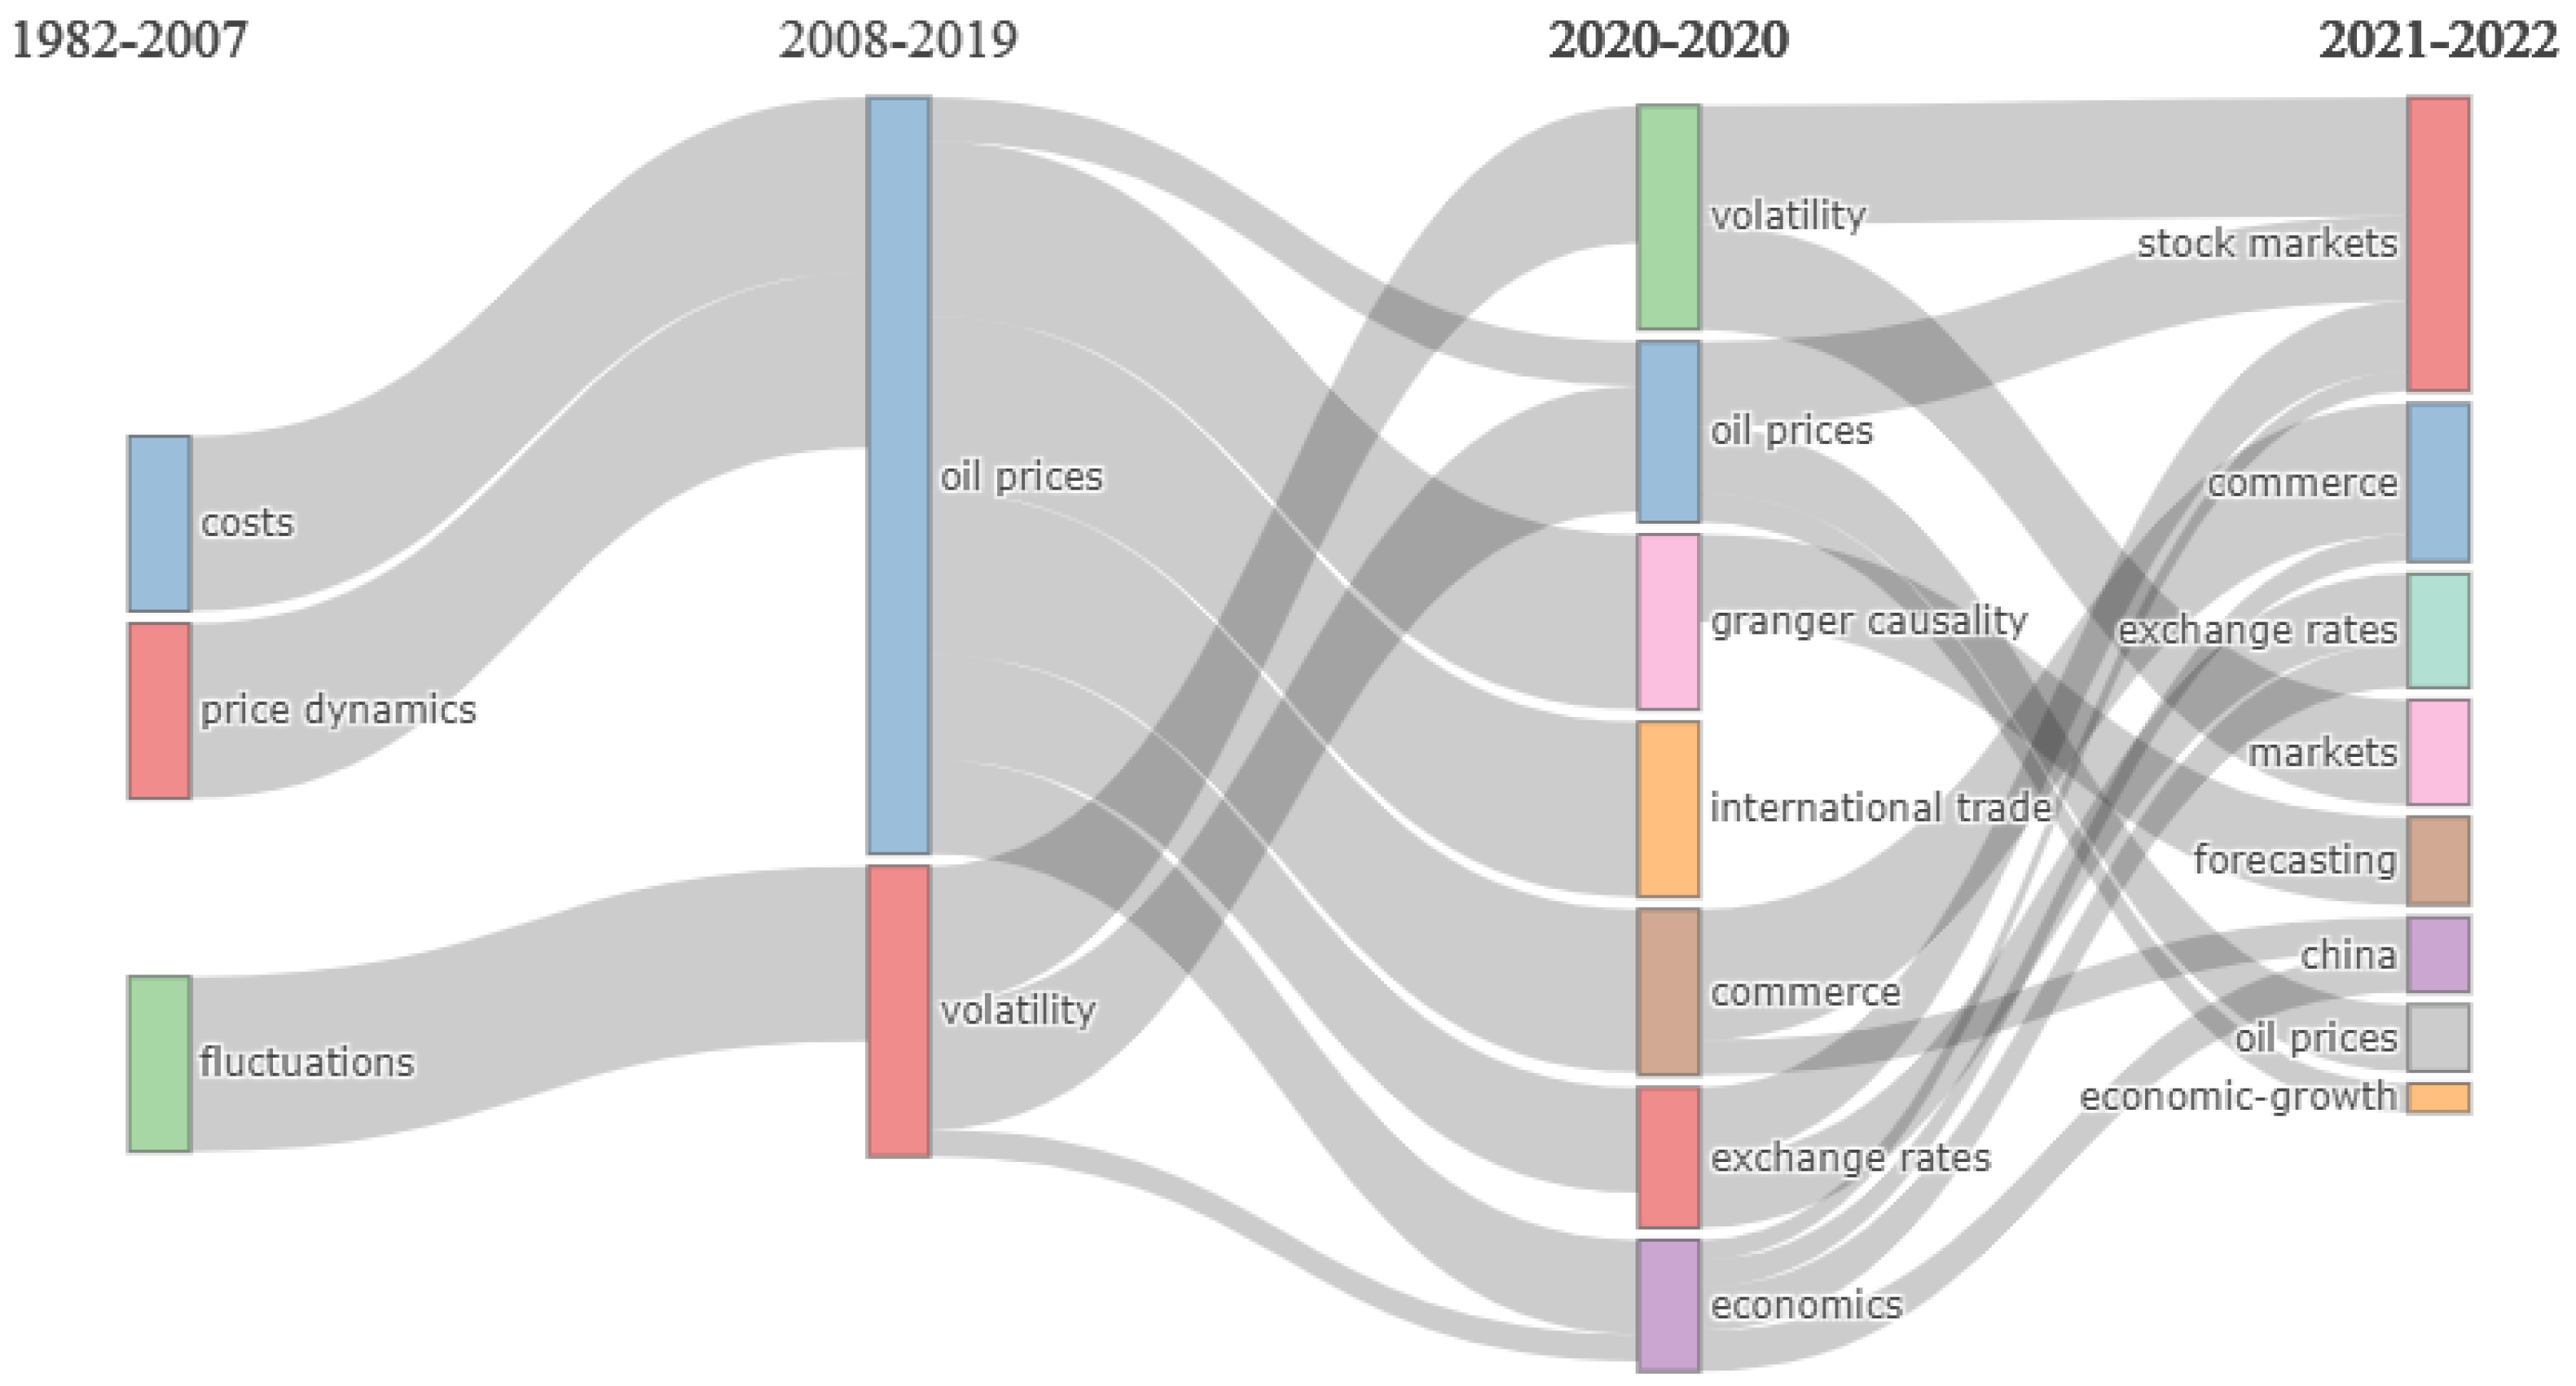
3.3.5. Thematic Evolution

Thematic evolution is a technique in bibliometrics for introducing a historical perspective on research and contributing to a science-based paradigm for directing further research themes [40]. It emphasizes the most significant research themes of evolution across time, presenting insights into the area’s further path [41]. Figure 12 illustrates the progression of the most frequently used terms in studying dynamic co-movements among oil prices and assets in financial markets based on the co-occurrence network from 1982 to 2022. Based on the different events of the sample, three periods were chosen as cut-off points: 2007, 2019, and 2020. These points cover the global crisis of 2008, the global COVID-19 pandemic, and recent times 2021–2022 (September).
Furthermore, KeyWords Plus are utilized to comprehensively understand the keywords corresponding to documents’ contents. The dimensions of the boxes in Figure 12 suggest the frequency of keyword appearance and topics. From 1982–2007, the most popular keywords were cost, price dynamics, and fluctuations. In that period, the explorations were directed toward the macroeconomic impacts caused by changes in oil prices. These three topics were merged into the next time slice (2008–2019) as oil prices and volatility. Thus, these keywords appear as the other two topics of interest in that period. The term volatility is commonly associated with risk, and in the period next to the subprime crisis in 2008, risk (particularly the financial risk) was the main accessed topic. The term “oil prices” is divided into five branches in the next time slice (2020–2020): volatility spillover, oil prices, granger causality, international trade, and exchange rates. Precisely, at the origins and evolution of the COVID-19 pandemic (2020), one of the main concerns, due to the decrease in the world trade occasioned by the total or partial closure of the major economies, was the key theme of the research due to the significant global macroeconomic repercussions.
The keyword “volatility” is divided into three branches: volatility spillovers, markets, and exchange rates. This is because the researchers were more concerned about the impact of the global pandemic on their markets and the exchange rates. Finally, in 2021–2022 (September) “volatility” appears divided into two branches: stock markets and energy markets, due to the singular uncertainty moment provoked by the global inflation and polity tensions experimented in the period. The keyword “oil prices” appears divided into stock markets and oil prices due to the interest in knowing the impact of oil prices on stock markets in developed economies. Finally, China, with its important role in global economic growth, appears as a new topic that is driven by recent research in this area.

3.4. Clusters Analysis

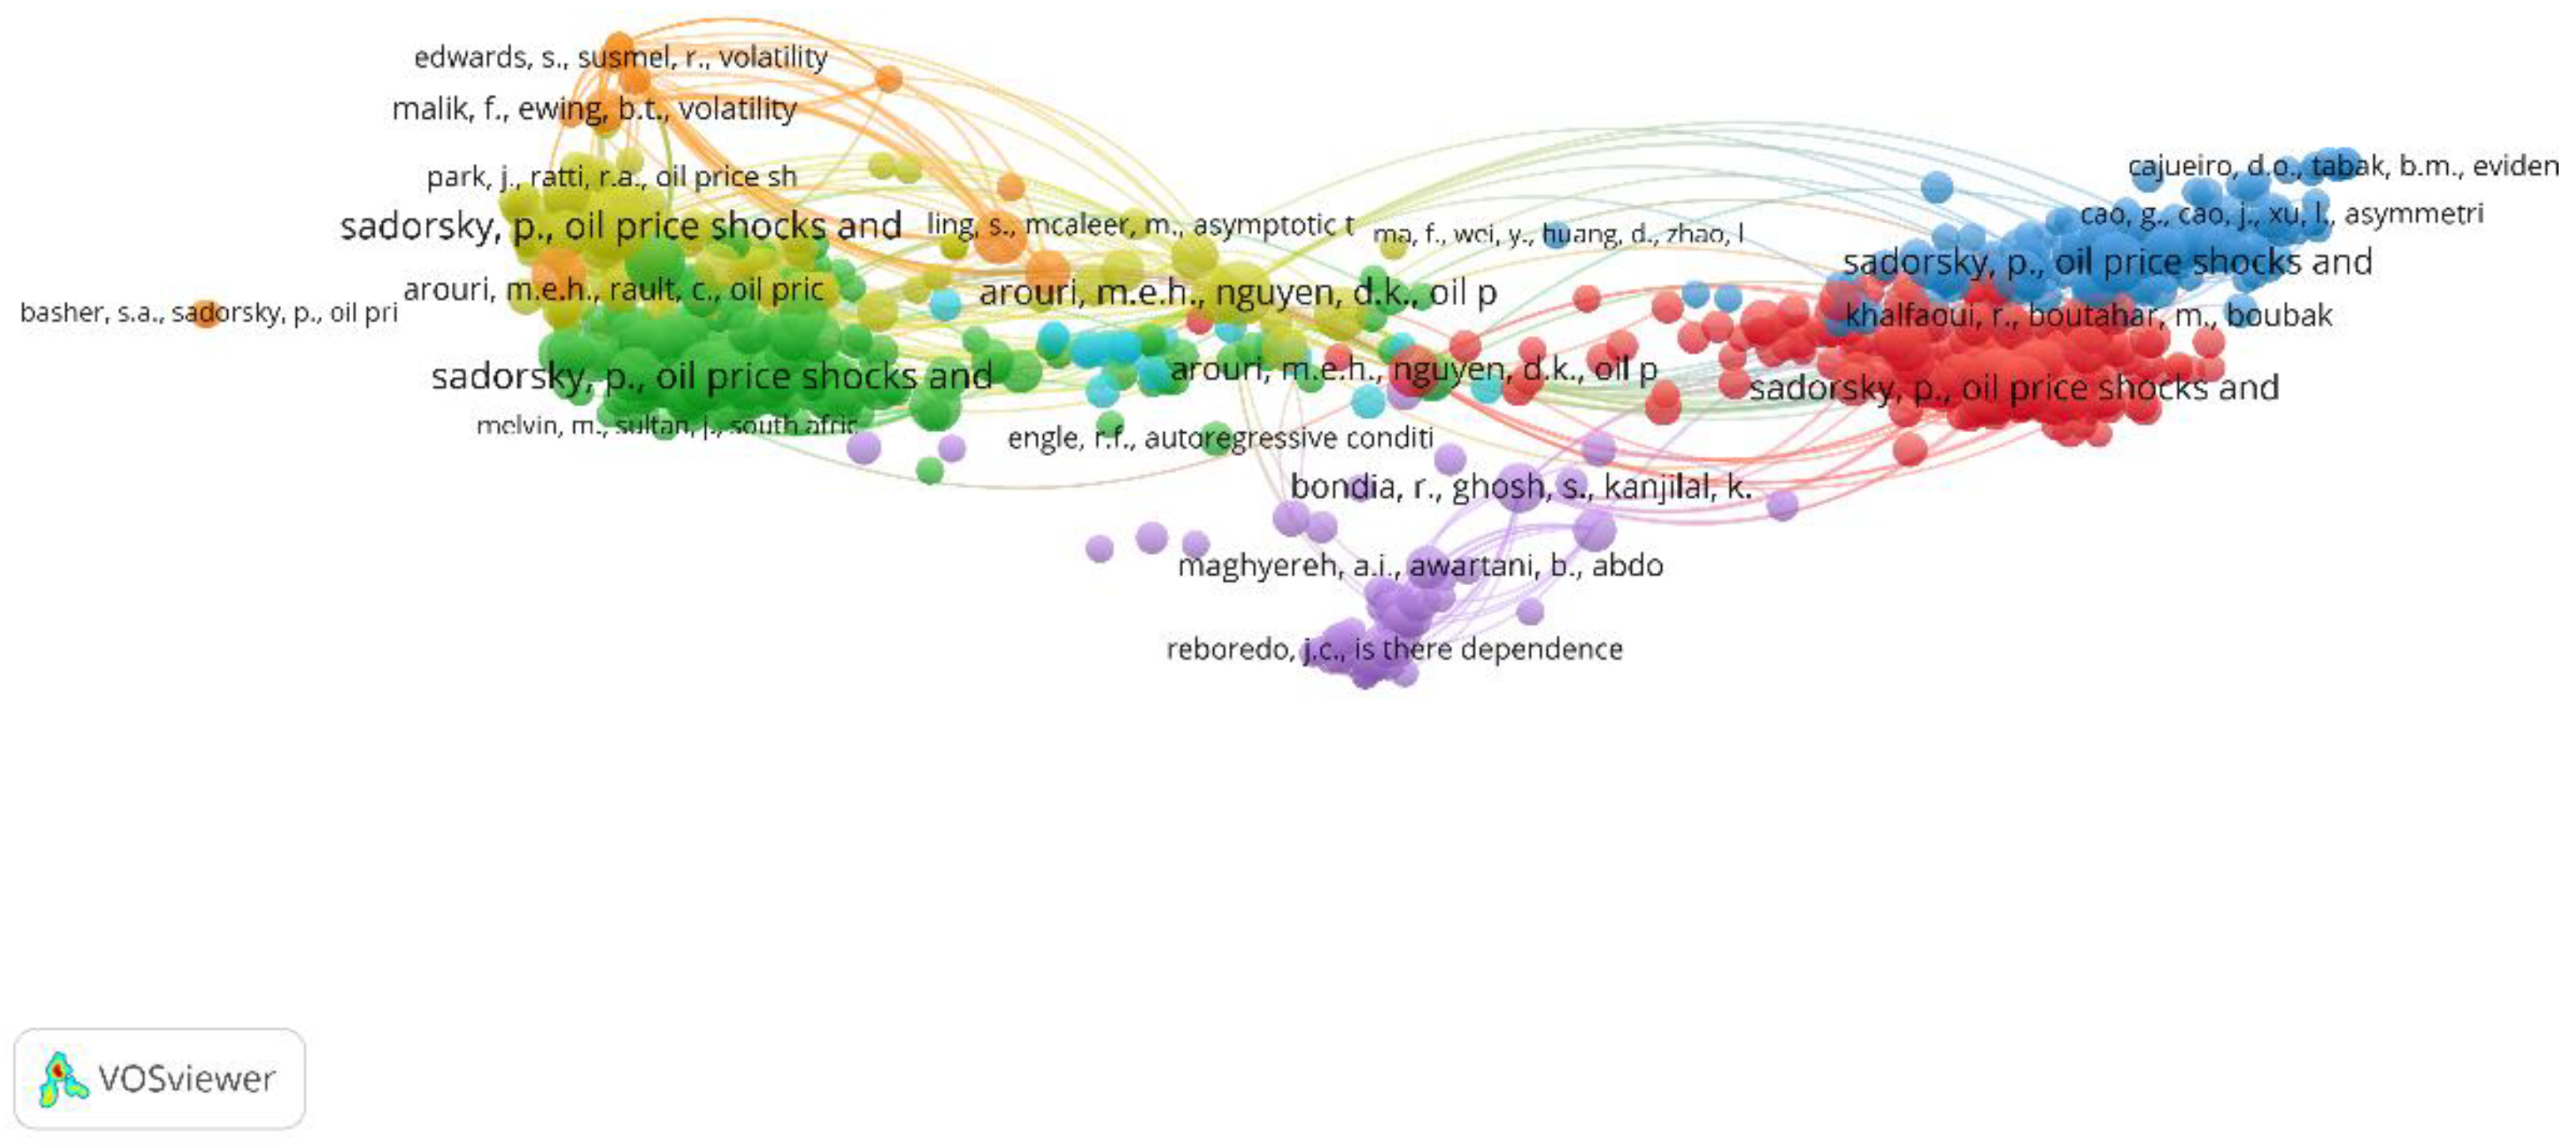
3.4.1. Co-Citation Networks Analyses

The co-citation map presents the structure of a body of literature by the frequency of conjunct mention of two or more documents in a third publication [42]. This study includes 18,868 citations in the quest for dynamic co-movements among oil prices and financial assets. This study includes citations mentioned at least three times, and the co-citation analysis was conducted on 746 articles in the research area of dynamic co-movements among oil prices and assets in financial markets (including energy markets and assets related to sustainable finance). The dimension of its node represents the article’s normalized number of citations, while the thick line shows the co-citation’s interaction strength among the nodes in the network. The box color indicates the article’s cluster; the nodes with the same color are grouped. According to Figure 13, each box is labeled with the document’s first author’s name and year of publication.
As shown in Table 7, the map of co-citations is grouped into five clusters. Each cluster is based on the most included references. A single critical concept connects all five groups in the research of dynamic co-movements among oil prices and assets in financial markets that serve as the theoretical groundwork for this study.
The first cluster (red) shows the concern about the oil price shocks and the volatility spillovers analysis across markets. For example, Diebold and Yilmaz [43] characterize daily volatility spillovers across the U.S. stock, bond, foreign exchange, and commodity markets from January 1999 to January 2010. The authors found important spillovers from the stock market to other markets taking place after the collapse of the Lehman Brothers in September 2008. Jammazi and Reboredo [44] analyzed the dependence structure and portfolio risk management issues for daily Brent oil and stock returns using a flexible wavelet–copula approach. They concluded that wavelet decomposition is decisive in analyzing risk for the different investment horizons. In this first cluster, wavelet analysis methodologies and volatility spillovers predominate in analyzing markets.
In the second cluster (green), the dynamic conditional correlation (DCC-GARCH) and cointegration models emerge as the main elements of financial co-movement analysis. In this way, Chiang, Jeon, and Li [45] applied a DCC-GARCH model to nine Asian daily stock-return data series from 1990 to 2003. The empirical evidence confirms a contagion effect, identifying two phases of the Asian crisis. The first shows an increase in correlation (contagion); the second shows a continued high correlation (herding). Furthermore, Narayan and Narayan [46], using daily data from Vietnamese markets for the period 2000–2008, carried out a cointegration analysis of oil prices, stock prices, and the nominal exchange rate. They found that oil prices and the nominal exchange rates are cointegrated. Additionally, oil prices have a positive and statistically significant impact on stock prices in Vietnam’s markets.
Table 7. Co-citation clusters as theoretical fundamentals. Source: Authors’ own research using the Bibliometrix tool, as well as Scopus and WoS databases.
ClusterRelevant Citations
Cluster 1 (Red)Basher, Haug, and Sadorsky [47]; Diebold and Yilmaz [43,48]; Hamilton [3]; Jammazi and Reboredo [44]; Jammazi [49]; Kilian and Park [28]; Mensi and Hammoudeh [50]; Park and Ratti [51], Reboredo and Rivera-Castro [52]; Sadorsky [8] and Wang, Torrence, and Compo [53]; Wu and Yang [32].
Cluster 2 (Green)Aloui, Hammoudeh and Nguyen [54]; Arouri, Jouini, and Nguyen [55]; Basher, Haug, and Sadorsky [47]; Bollerslev [56]; Chiang, Jeon, and Li [45]; Dutta [57]; Engle [58]; Engle and Granger [59]; Golub [60]; Kang and Ratti [61]; Mensi [62]; Narayan and Narayan [46].
Cluster 3 (Blue)Apergis and Miller [63]; Andrews [64]; Bai and Perron [65]; Basher and Sadorsky [66]; Chen [67]; Engle and Kroner [68]; Jones and Kaul [9]; Kilian and Park [28]; Ma et al. [69]; Park and Ratti [51]; Sadorsky [8].
Cluster 4 (Yellow)Amano and Van Norden [11]; Chen and Roll [70]; Ciner [71]; Cong et al. [72]; Elder and Serletis [73]; Golub [60]; Hamilton [3];
Hammoudeh, Dibooglu and Aleisa [74]; Kilian [75]; Lee, Ni and Ratti [76]; Park and Ratti [51]; Sadorsky [8,77,78].
Cluster 5 (Purple)Apergis and Miller [63]; Hamilton [3,79]; Henriques and Sadorsky [80]; Jones and Kaul [9]; Reboredo and Rivera-Castro [52]; Sadorsky [8,77,78].
The third cluster (blue) discusses the structural models for explaining how oil shocks affect the markets. Apergis and Miller [63] studied how explicit structural shocks that characterize the endogenous character of oil price changes affect stock market returns in a sample of eight countries—Australia, Canada, France, Germany, Italy, Japan, the United Kingdom, and the United States—using a vector error–correction model to decompose oil price changes into three components: oil supply shocks, global aggregate demand shocks, and global oil demand shocks. The authors found that international stock market returns do not respond significantly to oil market shocks. Likewise, in this cluster, some studies analyzed the structural change of time series, such as Bai and Perron [65] and Andrews [64].
Finally, the fourth and fifth clusters (yellow and purple) include (in their analysis of researching dynamic co-movements among oil prices and assets in financial markets) issues such as nonlinearities among variables and the importance of incorporating uncertainty in modeling. For example, Ciner [71], relying on nonlinear causality tests, provides evidence that proves how oil shocks affect stock index returns; it is consistent with the documented influence of oil on economic output. Moreover, Elder and Serletis [73] considered the relationship between oil price and investment, focusing on the role of uncertainty of oil prices. The authors found that volatility in oil prices has had a negative and statistically significant effect on several measurements of investment, durables consumption, and aggregate output.

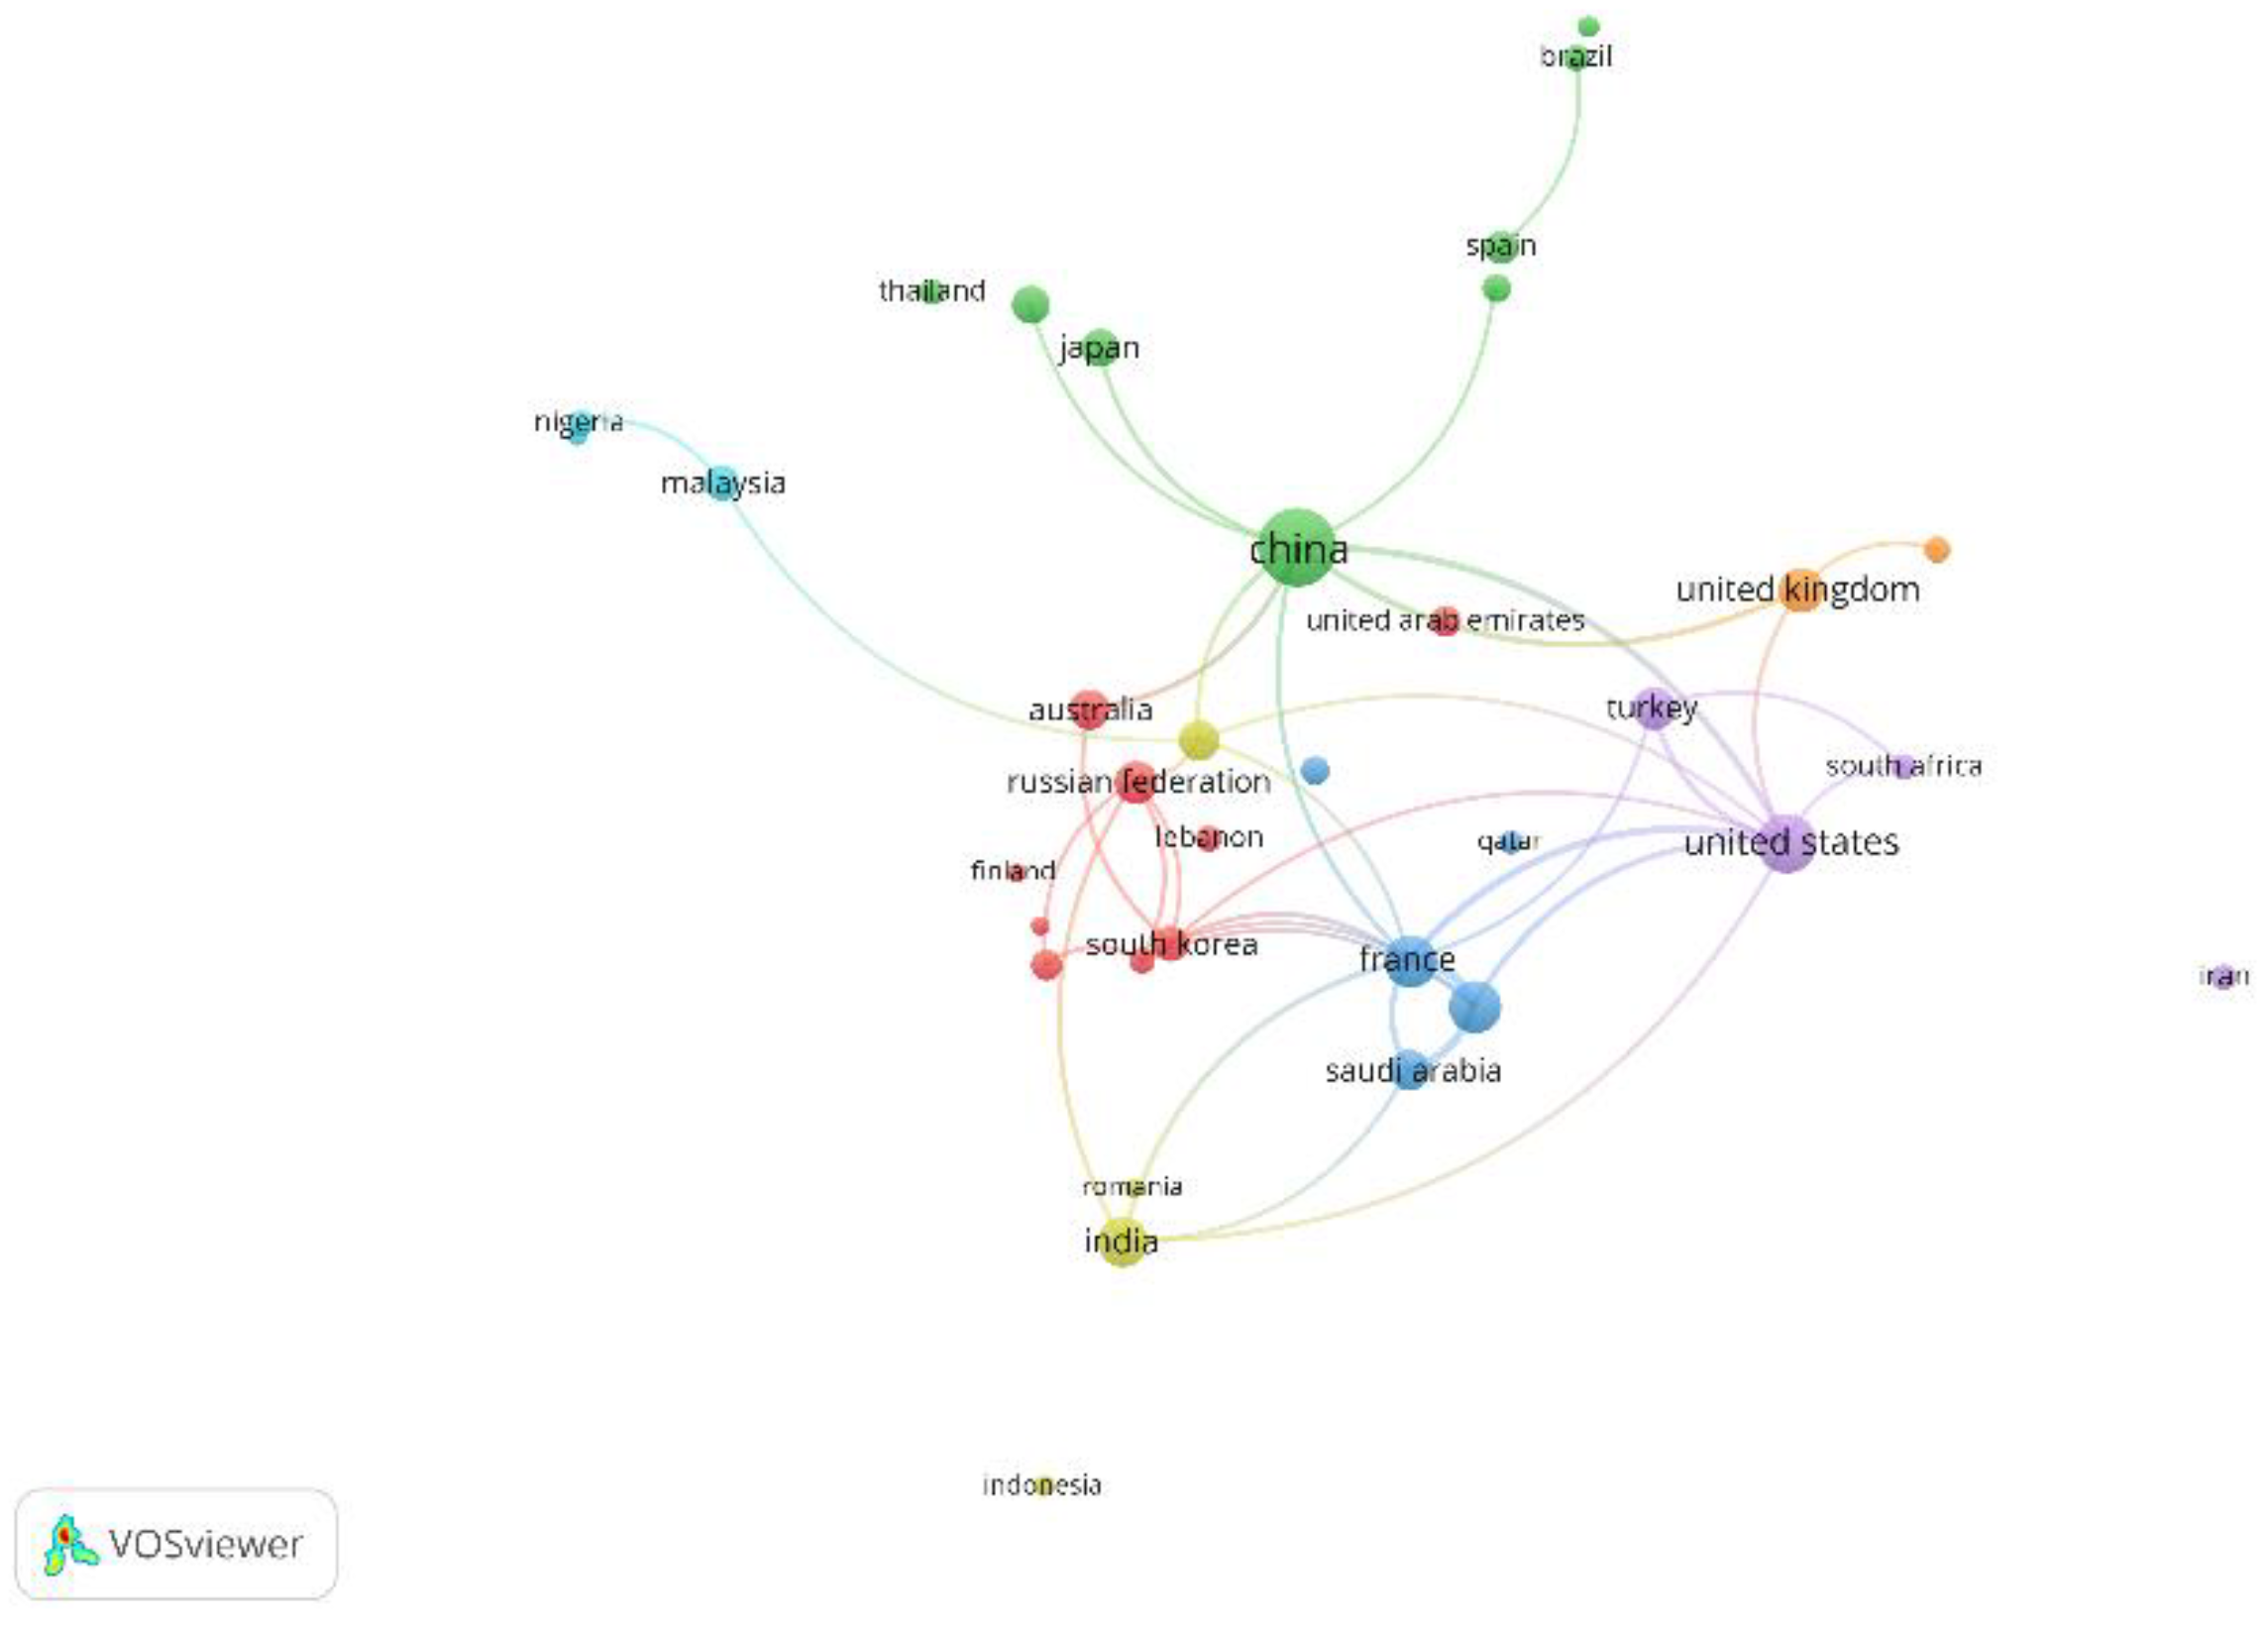
3.4.2. Countries and Regions Network

The analysis of co-authorship can be implemented to identify leading countries’ distribution regarding the production of knowledge and collaboration networks among them in the research field analyzed. The countries and regions’ networks showed a result of 50 items and 47 links. This is shown in Figure 14. The network predominates in clusters highlighted in green, red, and blue. The green cluster includes China, which has many relationships with other countries including Spain, Brazil, Japan, and Thailand, among others. Red, for its part, includes Russia, Australia, Lebanon, Finland, and South Korea. Finally, blue includes France, Canada, Tunisia, Saudi Arabia, and Qatar. These three principal clusters show a relationship between countries and collaboration among authors.

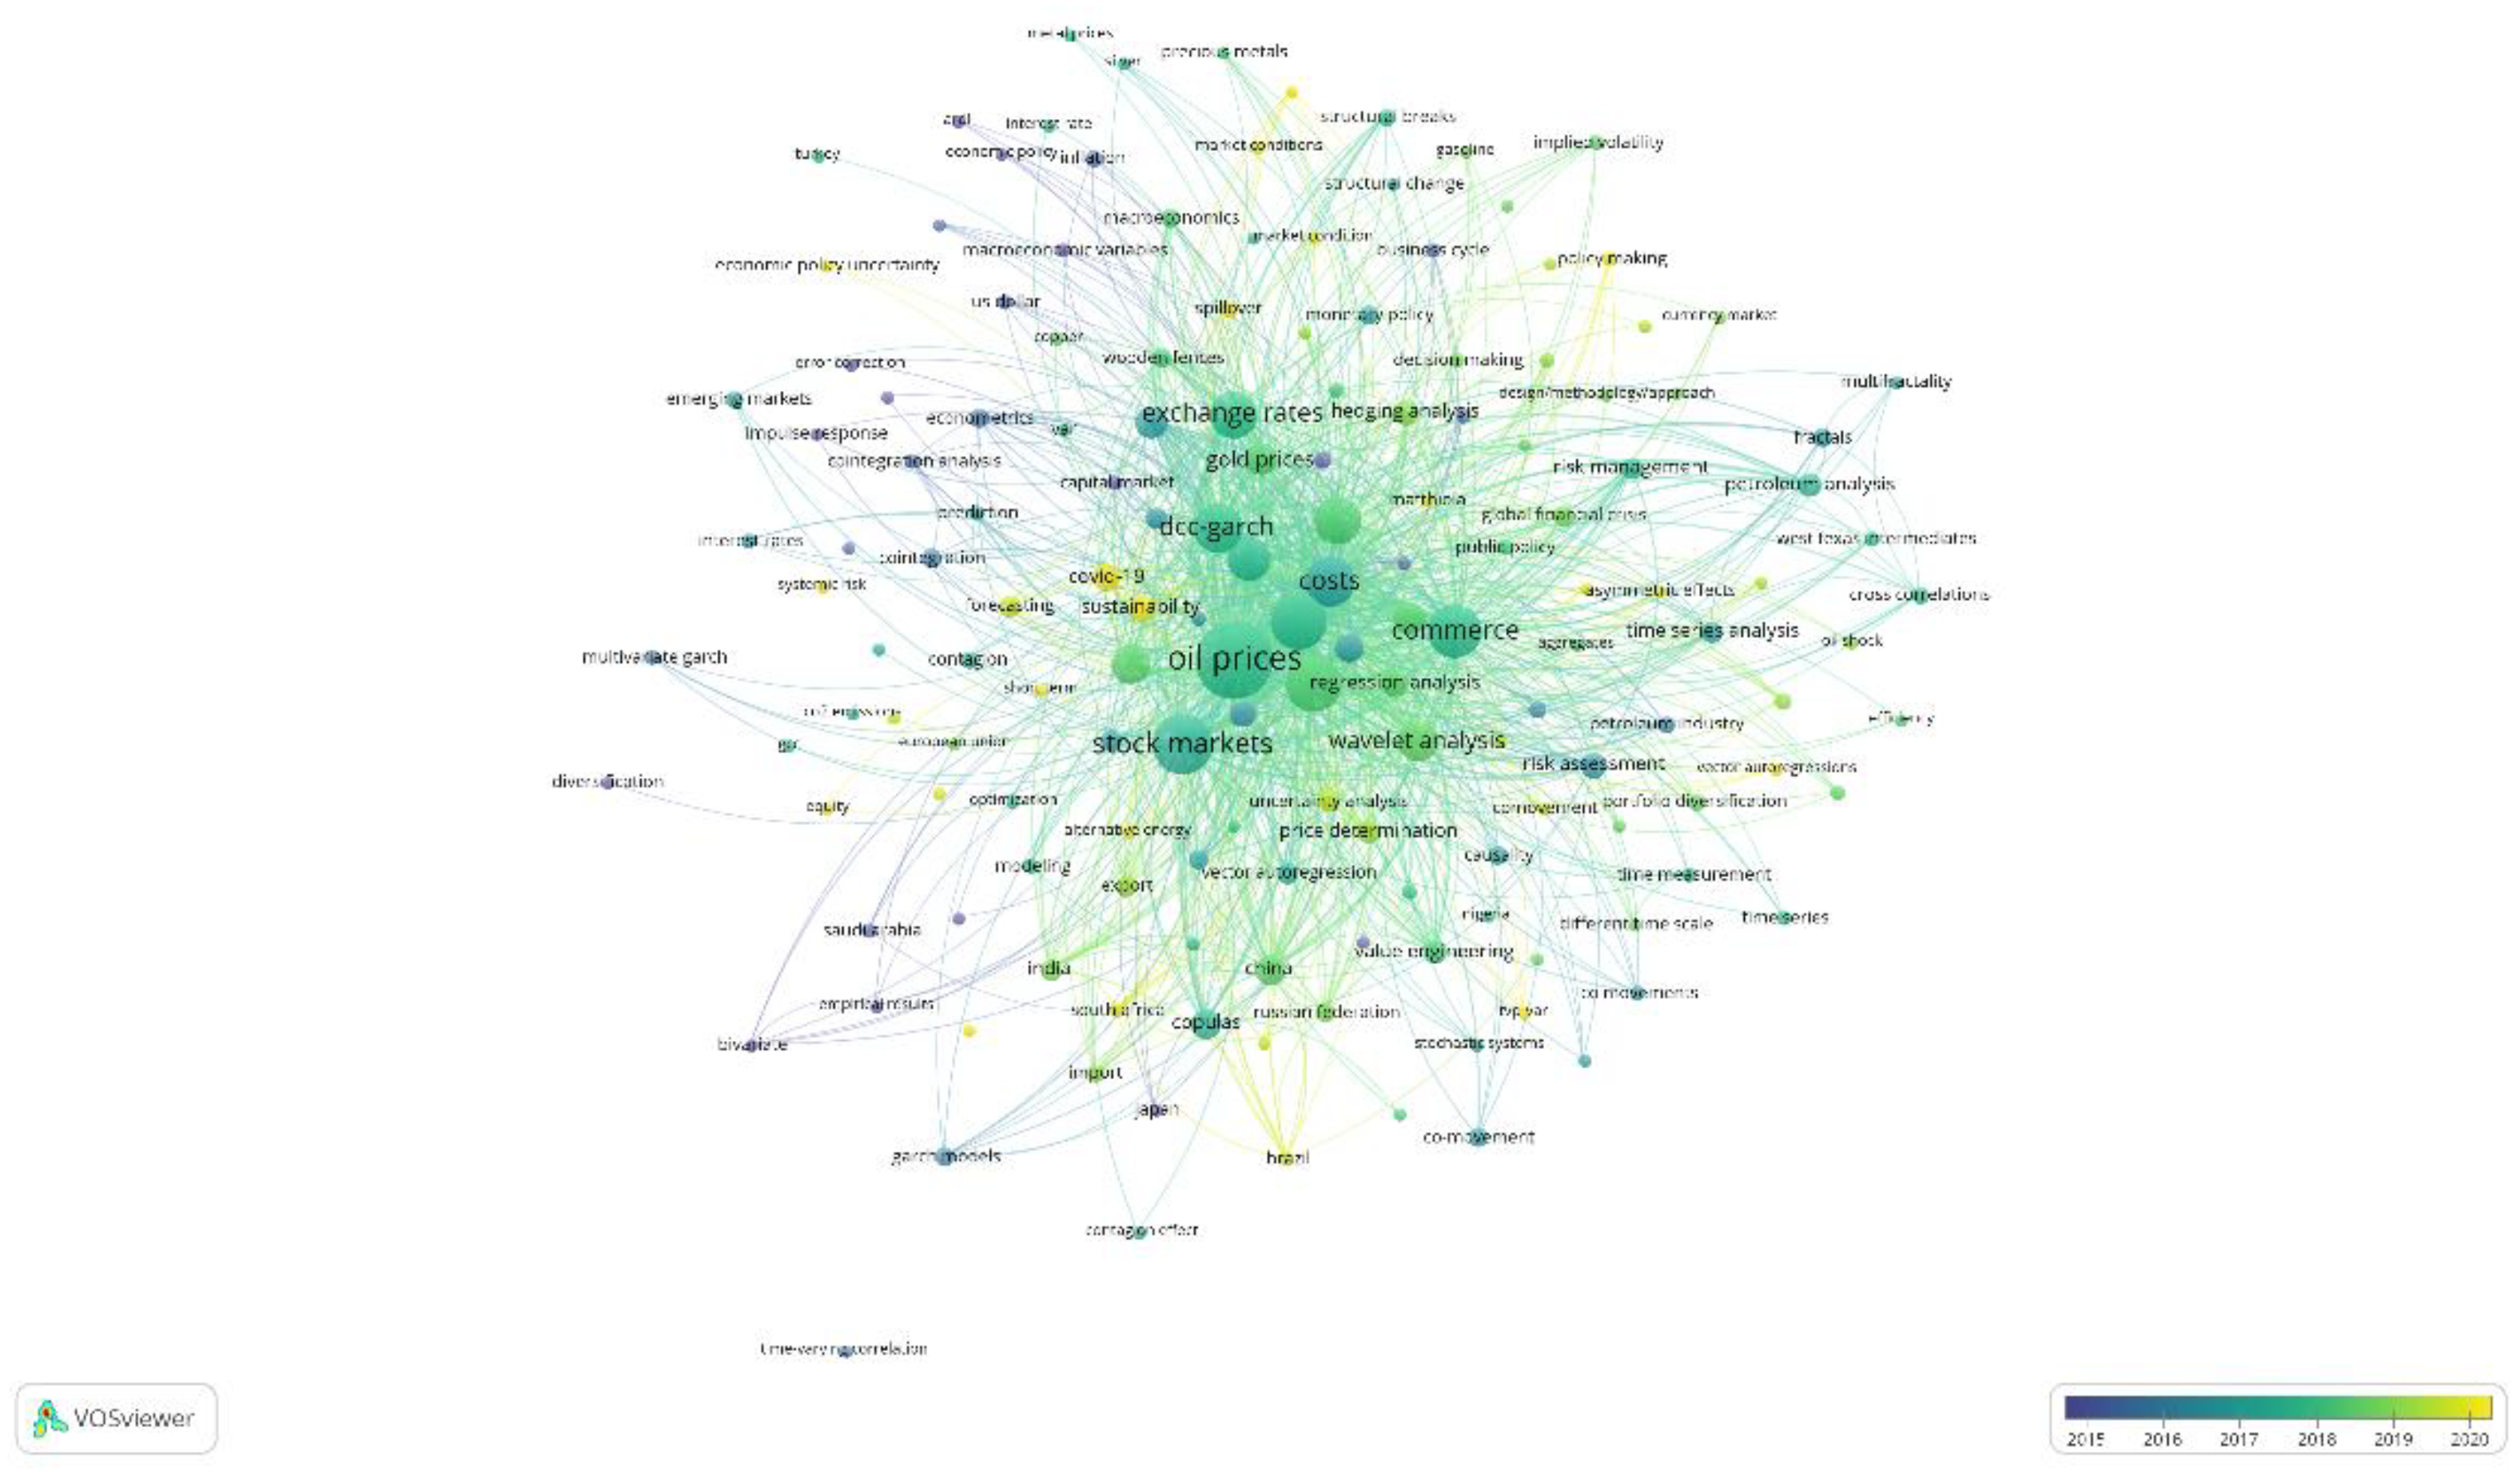
3.4.3. Co-Word Analysis

The co-word or co-occurring keywords analysis identifies the principal keywords in the analyzed bibliographic records. It helps determine which categories of analysis are most relevant in the field of study, where a larger size indicates a higher frequency. (See Figure 15.) This analysis is useful because the research has the possibility of focusing on the most relevant words presented in the research results. In concordance with Ref. [4], oil price and stock markets are the most frequent author keywords in the analyzed documents (Figure 15a). One of the reasons for this is the wide number of documents that study the nexus between these two markets. The author keywords financial markets, volatility spillovers, wavelet analysis, DCC-GARCH, Granger Causality, exchange rates, and co-movements have also led to a strong research contribution in the literature, as their focus is to analyze the most frequently used methodologies to model the co-movement among oil prices and financial markets. In contrast, KeyWords Plus (Figure 15b) show energy markets and sustainability as crucial keywords in the analysis. Furthermore, the methodologies of volatility spillovers, wavelet analysis, DCC-GARCH, Granger Causality, and time series analysis appear as essential keywords.
In addition to identifying research topics, the keyword analysis allows studying their evolution over time. In this sense, Figure 16 shows the overlay visualization of the keyword network. The color corresponds to the average year of publication (avg. pub. year). Older documents have a violet color, and the more recent documents have a color close to yellow. Some of the most recent keywords are “volatility spillovers”, “hedge ratio”, “sustainability”, and “renewable energy”. Then, energy markets and sustainable finance emerge as crucial trends in analyzing dynamic co-movements among oil prices and financial assets.

4. Discussion

4.1. Co-Movements: Contagion or Interdependence?

There are different kinds of co-movements among oil prices and financial assets. This paper focuses on interdependence and contagion. According to Ref. [20], the difference between these two concepts is that interdependence is defined as the relation among asset classes on average over the sample period, and contagion is defined as a change in the transmission mechanism among asset classes in times of crisis. Ref. [20] found that interdependence is most notable across advanced and emerging economies in the case of the equity market, and contagion effects within the stock market are most evident in Latin America and Emerging Asia. The response to shocks differs according to the origin of the disturbance. Then, the methodologies for measuring contagion play important roles because globalization increases the interdependence across the markets in the international context.
According to Refs. [81,82], the terms contagion and interdependence are defined in terms of the frequency domain, that is, low scale (high frequency) and high scale (low frequency). Following Ref. [83], a low scale can be defined as a period of less than one year (short term) and a high scale as a period greater than one year (long term). Therefore, an increase in co-movement on the low scale may be associated with contagion, while an increase in co-movement on the high scale may be associated with interdependence.
Ref. [84] described five definitions for financial contagion: (i) financial contagion is a significant increase in the probability of a crisis in one country, conditioned by a crisis occurring in other countries; (ii) contagion is a transmission that occurs when volatility spills over from the country in crisis to the financial markets of other countries; (iii) contagion is a significant increase in co-movements on prices in different markets, affected by a crisis occurring in one market or group of markets; (iv) contagion occurs when a different channel causes the transmission of a crisis to those that occurred in the other market; and (v) the contagion happens when macroeconomic fundamental causes cannot explain ordinary movements of prices and quantities. Meanwhile, Refs. [85,86] argue that financial contagion can be defined as the transfer of a financial crisis from one country to another as a result of the interdependence present in non-crisis periods, which may be associated with any of the previous definitions, since according to the literature, the high association among the variables of the economies, without taking into account their origin, is what generates a high-dependency relationship between their markets and therefore the spread of the financial crisis. Thus, as mentioned above, supported by Refs. [84,85], financial contagion is defined as an increase in correlations between markets after an economic shock in an individual country or group of countries.
According to Ref. [87], channels of contagion among economies can be commercial, financial, political, regional, and macroeconomic fundamentals. Thus, they argue that there are five possible transmission channels of contagion from one country to another: (i) being subjected to a common shock, such as movements in interest rates by the Federal Reserve in the U.S.; (ii) the similarity among the macroeconomic fundamentals of the economies; (iii) maintaining trade relations since the devaluation in one country would be reflected in the macroeconomic fundamentals of its trading partners; (iv) maintaining political ties among countries, as this may influence the actions of policy makers in both countries, e.g., policies of joint devaluation, which are also known as a channels for regional transmission of contagions; and (v) maintaining financial relations among countries such as having the same lender or maintaining foreign direct investment among countries, as this would be a channel of liquidity that could generate common financial behaviors. These common causes could explain why financial crises usually occur in clusters.
Ref. [88] argued that there are two main channels through which financial series show interdependence with each other. Firstly, there are the macroeconomic benefits, linked to the effective management of the countries’ monetary policies, tending towards low inflation and stability of interest rates and exchange rates, which is why there is a transmission of monetary policies to the financial markets via asset prices. Secondly, due to the management of international portfolios, in the search for better returns with less exposure to risk, there is an increase in the integration of financial markets that gradually aligns international prices, thus reducing the benefits of portfolio diversification in the international context.

4.2. Measuring the Co-Movements: Bibliometric Coupling of Documents

The bibliometric coupling of documents examines prior researchers’ writings on a topic, identifies significant ideas, and illustrates the character of scholarly argument [39]. Figure 17 represents a scientific map that identifies critical documents (impact) and their relationships (centrality) using k-means clustering as an unsupervised learning algorithm to solve clustering problems [39]. The number of local citation scores quantified the document’s effect. Five clusters were created depending on the topic’s significance, each with a distinct color scheme: red, blue, green, blue, purple, and orange.
Among these, the red cluster has a centrality of 0.5405, an impact of 2.177, and 15 documents containing the topics of crude oil, stock markets, and volatility spillovers. The documents in this cluster include Nagayev et al. [89], Antonakakis, Chatziantoniou, and Filis [90], Shahzad et al. [91], Roy and Roy [92], Disli [93], and others. Nagayev et al. [89] explored whether commodities offer potential diversification benefits for Islamic equity index investors. The authors used MGARCH-DCC and wavelet coherence analyses. Their findings reveal that correlations between commodity markets and the Dow Jones Islamic Market World Index were time-varying and highly volatile throughout the January 1999–April 2015 period. A substantial and persistent increase was observed in the return correlations between commodities and Islamic equity at the onset of the 2008 financial crisis. However, recent trends suggest that this association is heading towards its pre-crisis levels, again offering diversification benefits for Islamic equity holders. Disli [93] studied the role of gold, crude oil, and cryptocurrency as a haven for traditional, sustainable, and Islamic investors during the COVID-19 pandemic crisis. The authors use the wavelet coherence analysis and the spillover index methodologies in bivariate and multivariate settings, examining the correlation of these assets for different investment horizons. The findings suggest that gold, oil, and bitcoin exhibited low coherency with each stock index across almost all considered investment horizons until the onset of COVID-19. Conversely, given the pandemic outbreak, the return spillover was more intense across financial assets, and a significant pairwise return connectedness between each equity index and the hedging asset was observed.
The blue cluster with a centrality of 0.576, an impact of 1.516, and 39 documents contains the topics of commerce, energy market, and stock markets. The studies in this cluster include Pal and Mitra [94], Ftiti, Guesmi, and Abid [95], Bouri et al. [96], Maghyereh and Abdoh [97], and others. Pal and Mitra explore the co-movement between oil price and automobile stock return using the Wavelet Coherence for daily price series from 1 August 1996, to 20 June 2017. The results indicate that the co-movement between oil price and automobile stock return was strong from November 2000 to December 2002 and from March 2006 to December 2009. The co-movement is found to be more prominent in the long term, and stock return is sensitive to the higher oil price emanating from the demand shock. Maghyereh and Abdoh [97] examine the extreme co-movements (tail dependence) between the different sources of oil price shocks and stock market returns of major oil-exporter countries (Gulf Cooperation Council (GCC) countries) directly by testing the tail dependence of the joint distribution across frequencies. Their methodology incorporates an oil shock decomposition with a novel quantile cross-spectral dependence approach and the wavelet coherence analysis from 1 June 2006, to 28 February 2020. These two approaches enable the detection of the dependence structure during extreme market conditions (bearish and bullish markets) and/or at different time horizons (frequencies).
The green cluster with a centrality of 0.614, impact of 2.564, and 56 documents contains the topics of stock markets, crude oil, and commerce. The research in this cluster includes studies conducted by leading researchers. Filis, Degiannakis, and Floros [23] studied the time-varying correlation between stock market prices and oil prices for oil-importing and oil-exporting countries using a DCC-GARCH-GJR approach based on data from six oil-exporting (Canada, Mexico, Brazil) and oil-importing (USA, Germany, The Netherlands) countries. The findings suggested that (i) the contemporaneous correlation, although it is a time-varying correlation, does not differ for oil-importing and oil-exporting economies, and (ii) the correlation increases positively (negatively) in response to important aggregate demand-side (precautionary demand) oil price shocks, which are caused by fluctuations of the global business cycle or world turmoil (i.e., wars). Supply-side oil price shocks do not influence the relationship between the two markets. Furthermore, the lagged correlation results show that oil prices negatively affect all stock markets, regardless of the origin of the oil price shock. Boldanov, Degiannakis, and Filis [98] examined the time-varying conditional correlation between oil price and stock market volatility for six major oil-importing and oil-exporting countries using data from January 2000 to December 2014 and a Diag-BEKK model. Their findings report the following regularities. (i) The correlation between the oil and stock market volatilities changes over time, fluctuating at both positive and negative values. (ii) Heterogeneous patterns in the time-varying correlations are evident between the oil-importing and oil-exporting countries. (iii) Correlations are responsive to major economic and geopolitical events, such as the early 2000 recession, the 9/11 terrorist attacks, and the global financial crisis in 2007–2009.
Studies conducted mainly by Belhassine [99], Ali et al. [100], and Ren [95] are included in the purple cluster with a centrality of 0.5108, an impact of 1.266, and 48 documents containing the topics of stock markets, commerce, and costs. Belhassine [99] and Ren [101] employ a bivariate VAR-BEKK-GARCH model to explore the dynamic relationships between oil prices and other assets in the Eurozone. Belhassine’s findings [99] show that both mean and volatility spillovers among the oil market and the different Eurozone sectors are time-varying and heterogeneous. Meanwhile, Ren [101] found stronger shock and volatility contagions from the European stock market to oil and gold markets. For the volatility nexus between oil and gold, weak and moderate evidence of shock and volatility transmission from gold to oil markets is reported by this author.
Finally, studies conducted mainly by Aloui, Aïssa, and Nguyen [102], Feng and Cui [103], and Nautiyal [98] are included in the orange cluster with a centrality of 0.388, an impact of 1.649, and 27 documents. Aloui, Aïssa, and Nguyen [102] and Feng and Cui [103] used a copula–GARCH approach to analyze the conditional dependence structure among crude oil prices and foreign exchange rates. Aloui, Aïssa, and Nguyen [96] found evidence of significant and symmetric dependence for almost all the oil–exchange rate pairs considered. The rise in the price of oil was found to be associated with the depreciation of the dollar. On the other hand, Feng and Cui [103] studied the dual hedge of integrated risks among oil prices and foreign exchange rates. Their results showed that a dual hedge cannot outperform the single hedge in the direct hedging background. However, in the cross-dual hedging setting, a dual hedge performs much better, possibly because the dual hedge brings different levels of advantages and disadvantages in the two different settings, and the superiority of the dual hedge is more evident in the cross-dual hedging setting.

5. Conclusions

This paper presents a scientometric study that, through various analysis such as (i) sources, (ii) authors, (iii) documents, and (iv) cluster analysis, examined the existing frontier of knowledge in the field of dynamic association between oil prices and assets in financial markets, with a special emphasis on the methodologies for measuring the dependence among the variables oil prices, exchange rates, stock prices, energy markets, and assets related to sustainable finance. We identified and analyzed the configuration of the research on this topic between 1982 and 2022 (September). In total, 746 studies from Scopus and Web of Science databases were incorporated and analyzed.
Furthermore, researchers and practicing professionals may use this study’s findings to broaden the central aspects of developing studies about the dynamic association among oil prices and assets in financial markets. Additionally, these findings can be incorporated into further research efforts to better understand the linkages among oil prices and financial variables, energy markets, and assets related to sustainable finance. Based on the results, the co-authorship analysis indicates synergies in the field of study analyzed from collaborative networks among researchers.
The cluster analysis helps determine the key theories and methodologies that are at the frontier of knowledge of the research field about the linkages among oil prices and assets in financial markets, with a special focus on the dependence among the variables oil prices, exchange rates, stock prices, energy markets, and assets related to sustainable finance. Methodologies such as wavelet analysis, copula, DCC-GARCH, and volatility spillover were identified as the most used to perform these analyses. This study provides researchers and practitioners with a comprehensive understanding of the status quo and research trends of ontology research of dynamic association among oil prices and assets in financial markets and promotes further studies in this domain. The identification of these relations provides benefits in risk diversification, hedges, speculation, and inflation targeting.
The current systematic and scientometric review offers a comprehensive analysis of research trends, and also allows us to identify that data science models face a great challenge in acquiring a better understanding of the above-mentioned relationships. In this way, we would like to encourage researchers to broaden the scope of research and provide new methodologies for measuring the dynamic co-movements among oil prices and financial assets, energy markets, and assets related to sustainable finance, and thus boost the scientific contributions. Hence, some key points are acknowledged. First, machine learning, deep learning, big data, and artificial intelligence are used to measure the dynamic co-movements among oil prices, financial assets, energy markets, and assets related to sustainable finance. This analysis can be more robust in the findings and provide more precise estimations and forecasting. Second, the study of the energy markets and assets related to sustainable finance and the nexus between oil prices and renewable energies can offer an overview to investors and policy makers keen to understand the dynamics of conditional correlations among, for example, green bonds, CO2 prices, and oil prices, which can affect diversification strategies and the design of environmental policies. This kind of analysis could be more relevant due to the gradual energy transition proposed by international markets, mainly European and developing markets, and the consequent responses of economies to these types of regulations. Third, this paper intends to encourage researchers to explore implementing this type of analysis using assets from emerging markets, e.g., to analyze how oil prices shocks affect financial markets, especially in emerging economies. Additionally, these kinds of analyses must involve refined techniques that can offer robust results.

Author Contributions

Conceptualization, N.J.M.-R.; methodology, N.J.M.-R. and J.D.G.-R.; validation, J.D.G.-R. and S.B.B.; formal analysis, N.J.M.-R., J.D.G.-R. and S.B.B.; investigation, N.J.M.-R.; data curation, N.J.M.-R.; writing—review and editing, N.J.M.-R. and J.D.G.-R. All authors have read and agreed to the published version of the manuscript.

Funding

This research received no external funding.

Institutional Review Board Statement

Not applicable.

Data Availability Statement

Not applicable.

Acknowledgments

The authors thank the anonymous reviewers for providing constructive comments and suggestions.

Conflicts of Interest

The authors declare no conflict of interest.

References

  1. Burandt, T. Decarbonizing the Global Energy System: Modelling Global and Regional Transformation Pathways with Multi-Sector Energy System Models; Technische Universität Berlin: Berlin, Germany, 2021. [Google Scholar]
  2. Mensi, W.; Rehman, M.U.; Maitra, D.; Al-Yahyaee, K.H.; Vo, X.V. Oil, Natural Gas and BRICS Stock Markets: Evidence of Systemic Risks and Co-Movements in the Time-Frequency Domain. Resour. Policy 2021, 72, 102062. [Google Scholar] [CrossRef]
  3. Hamilton, J.D. Oil and the Macroeconomy since World War II. J. Polit. Econ. 1983, 91, 228–248. [Google Scholar] [CrossRef]
  4. Bashir, M.F. Oil Price Shocks, Stock Market Returns, and Volatility Spillovers: A Bibliometric Analysis and Its Implications. Environ. Sci. Pollut. Res. 2022, 29, 22809–22828. [Google Scholar] [CrossRef] [PubMed]
  5. Bashir, M.F.; Ma, B.; Shahbaz, M.; Jiao, Z. The Nexus between Environmental Tax and Carbon Emissions with the Roles of Environmental Technology and Financial Development. PLoS ONE 2020, 15, e0242412. [Google Scholar] [CrossRef]
  6. Bashir, M.F.; Ma, B.; Shahzad, L.; Liu, B.; Ruan, Q. China’s Quest for Economic Dominance and Energy Consumption: Can Asian Economies Provide Natural Resources for the Success of One Belt One Road? Manag. Decis. Econ. 2021, 42, 570–587. [Google Scholar] [CrossRef]
  7. Huang, R.D.; Masulis, R.W.; Stoll, H.R. Energy Shocks and Financial Markets. J. Futures Mark. 1996, 16, 1–27. [Google Scholar] [CrossRef]
  8. Sadorsky, P. Oil Price Shocks and Stock Market Activity. Energy Econ. 1999, 21, 449–469. [Google Scholar] [CrossRef]
  9. Jones, C.M.; Kaul, G. Oil and the Stock Markets. J. Financ. 1996, 51, 463–491. [Google Scholar] [CrossRef]
  10. Amano, R.A.; van Norden, S. Exchange Rates and Oil Prices. Rev. Int. Econ. 1998, 6, 683–694. [Google Scholar] [CrossRef]
  11. Amano, R.A.; van Norden, S. Oil Prices and the Rise and Fall of the US Real Exchange Rate. J. Int. Money Financ. 1998, 17, 299–316. [Google Scholar] [CrossRef]
  12. Darby, M.R. The Price of Oil and World Inflation and Recession. Am. Econ. Rev. 1982, 72, 738–751. [Google Scholar]
  13. Albulescu, C.T.; Demirer, R.; Raheem, I.D.; Tiwari, A.K. Does the U.S. Economic Policy Uncertainty Connect Financial Markets? Evidence from Oil and Commodity Currencies. Energy Econ. 2019, 83, 375–388. [Google Scholar] [CrossRef]
  14. Chen, Y.-C.; Rogoff, K. Commodity Currencies. J. Int. Econ. 2003, 60, 133–160. [Google Scholar] [CrossRef]
  15. Marín-Rodríguez, N.J.; González-Ruiz, J.D.; Botero, S. Dynamic Relationships among Green Bonds, CO2 Emissions, and Oil Prices. Front. Environ. Sci. 2022, 10, 992726. [Google Scholar] [CrossRef]
  16. Ren, X.; Shao, Q.; Zhong, R. Nexus between Green Finance, Non-Fossil Energy Use, and Carbon Intensity: Empirical Evidence from China Based on a Vector Error Correction Model. J. Clean. Prod. 2020, 277, 122844. [Google Scholar] [CrossRef]
  17. Sahu, P.K.; Solarin, S.A.; Al-mulali, U.; Ozturk, I. Investigating the Asymmetry Effects of Crude Oil Price on Renewable Energy Consumption in the United States. Environ. Sci. Pollut. Res. 2022, 29, 817–827. [Google Scholar] [CrossRef]
  18. Lee, C.-C.; Lee, C.-C.; Li, Y.-Y. Oil Price Shocks, Geopolitical Risks, and Green Bond Market Dynamics. North Am. J. Econ. Financ. 2021, 55, 101309. [Google Scholar] [CrossRef]
  19. Li, H.; Zhou, D.; Hu, J.; Guo, L. Dynamic Linkages among Oil Price, Green Bond, Carbon Market and Low-Carbon Footprint Company Stock Price: Evidence from the TVP-VAR Model. Energy Rep. 2022, 8, 11249–11258. [Google Scholar] [CrossRef]
  20. Beirne, J.; Gieck, J. Interdependence and Contagion in Global Asset Markets. Rev. Int. Econ. 2014, 22, 639–659. [Google Scholar] [CrossRef] [Green Version]
  21. Rasheed, M.Q.; Haseeb, A.; Adebayo, T.S.; Ahmed, Z.; Ahmad, M. The Long-Run Relationship between Energy Consumption, Oil Prices, and Carbon Dioxide Emissions in European Countries. Environ. Sci. Pollut. Res. 2022, 29, 24234–24247. [Google Scholar] [CrossRef]
  22. Lin, B.; Su, T. Mapping the Oil Price-Stock Market Nexus Researches: A Scientometric Review. Int. Rev. Econ. Financ. 2020, 67, 133–147. [Google Scholar] [CrossRef]
  23. Patel, R.; Goodell, J.W.; Oriani, M.E.; Paltrinieri, A.; Yarovaya, L. A Bibliometric Review of Financial Market Integration Literature. Int. Rev. Financ. Anal. 2022, 80, 102035. [Google Scholar] [CrossRef]
  24. Van Eck, N.J.; Waltman, L. Citation-Based Clustering of Publications Using CitNetExplorer and VOSviewer. Scientometrics 2017, 111, 1053–1070. [Google Scholar] [CrossRef] [Green Version]
  25. Aria, M.; Cuccurullo, C. Bibliometrix: An R-Tool for Comprehensive Science Mapping Analysis. J. Informetr. 2017, 11, 959–975. [Google Scholar] [CrossRef]
  26. Bradford, S.C. Sources of Information on Specific Subjects. Engineering 1934, 137, 85–86. [Google Scholar]
  27. Lotka, A.J. The Frequency Distribution of Scientific Productivity. J. Wash. Acad. Sci. 1926, 16, 317–323. [Google Scholar]
  28. Kilian, L.; Park, C. The Impact of Oil Price Shocks on the U.S. Stock Market. Int. Econ. Rev. 2009, 50, 1267–1287. [Google Scholar] [CrossRef]
  29. Sharif, A.; Aloui, C.; Yarovaya, L. COVID-19 Pandemic, Oil Prices, Stock Market, Geopolitical Risk and Policy Uncertainty Nexus in the US Economy: Fresh Evidence from the Wavelet-Based Approach. Int. Rev. Financ. Anal. 2020, 70, 101496. [Google Scholar] [CrossRef]
  30. Filis, G.; Degiannakis, S.; Floros, C. Dynamic Correlation between Stock Market and Oil Prices: The Case of Oil-Importing and Oil-Exporting Countries. Int. Rev. Financ. Anal. 2011, 20, 152–164. [Google Scholar] [CrossRef]
  31. Sari, R.; Hammoudeh, S.; Soytas, U. Dynamics of Oil Price, Precious Metal Prices, and Exchange Rate. Energy Econ. 2010, 32, 351–362. [Google Scholar] [CrossRef]
  32. Wang, Y.; Wu, C.; Yang, L. Oil Price Shocks and Stock Market Activities: Evidence from Oil-Importing and Oil-Exporting Countries. J. Comp. Econ. 2013, 41, 1220–1239. [Google Scholar] [CrossRef]
  33. Antonakakis, N.; Chatziantoniou, I.; Filis, G. Dynamic Co-Movements of Stock Market Returns, Implied Volatility and Policy Uncertainty. Econ. Lett. 2013, 120, 87–92. [Google Scholar] [CrossRef]
  34. Mensi, W.; Beljid, M.; Boubaker, A.; Managi, S. Correlations and Volatility Spillovers across Commodity and Stock Markets: Linking Energies, Food, and Gold. Econ. Model. 2013, 32, 15–22. [Google Scholar] [CrossRef]
  35. Basher, S.A.; Sadorsky, P. Hedging Emerging Market Stock Prices with Oil, Gold, VIX, and Bonds: A Comparison between DCC, ADCC and GO-GARCH. Energy Econ. 2016, 54, 235–247. [Google Scholar] [CrossRef] [Green Version]
  36. Creti, A.; Joëts, M.; Mignon, V. On the Links between Stock and Commodity Markets’ Volatility. Energy Econ. 2013, 37, 16–28. [Google Scholar] [CrossRef] [Green Version]
  37. Mensi, W.; Hammoudeh, S.; Reboredo, J.C.; Nguyen, D.K. Do Global Factors Impact BRICS Stock Markets? A Quantile Regression Approach. Emerg. Mark. Rev. 2014, 19, 1–17. [Google Scholar] [CrossRef]
  38. Garfield, E. Citation Indexing for Studying Science. Nature 1970, 227, 669–671. [Google Scholar] [CrossRef]
  39. Chansanam, W.; Li, C. Scientometrics of Poverty Research for Sustainability Development: Trend Analysis of the 1964–2022 Data through Scopus. Sustainability 2022, 14, 5339. [Google Scholar] [CrossRef]
  40. Moral-Munoz, J.A.; Arroyo-Morales, M.; Herrera-Viedma, E.; Cobo, M.J. An Overview of Thematic Evolution of Physical Therapy Research Area From 1951 to 2013. Front. Res. Metr. Anal. 2018, 3, 13. [Google Scholar] [CrossRef]
  41. Chen, X.; Lun, Y.; Yan, J.; Hao, T.; Weng, H. Discovering Thematic Change and Evolution of Utilizing Social Media for Healthcare Research. BMC Med. Inform. Decis. Mak. 2019, 19, 50. [Google Scholar] [CrossRef]
  42. Mumu, J.R.; Saona, P.; Russell, H.I.; Azad, M.A.K. Corporate Governance and Remuneration: A Bibliometric Analysis. J. Asian Bus. Econ. Stud. 2021, 28, 242–262. [Google Scholar] [CrossRef]
  43. Diebold, F.X.; Yilmaz, K. Better to Give than to Receive: Predictive Directional Measurement of Volatility Spillovers. Int. J. Forecast. 2012, 28, 57–66. [Google Scholar] [CrossRef] [Green Version]
  44. Jammazi, R.; Reboredo, J.C. Dependence and Risk Management in Oil and Stock Markets. A Wavelet-Copula Analysis. Energy 2016, 107, 866–888. [Google Scholar] [CrossRef]
  45. Chiang, T.C.; Jeon, B.N.; Li, H. Dynamic Correlation Analysis of Financial Contagion: Evidence from Asian Markets. J. Int. Money Financ. 2007, 26, 1206–1228. [Google Scholar] [CrossRef]
  46. Narayan, P.K.; Narayan, S. Modelling the Impact of Oil Prices on Vietnam’s Stock Prices. Appl. Energy 2010, 87, 356–361. [Google Scholar] [CrossRef]
  47. Basher, S.A.; Haug, A.A.; Sadorsky, P. Oil Prices, Exchange Rates and Emerging Stock Markets. Energy Econ. 2012, 34, 227–240. [Google Scholar] [CrossRef] [Green Version]
  48. Diebold, F.X.; Yilmaz, K. Measuring Financial Asset Return and Volatility Spillovers, with Application to Global Equity Markets. Econ. J. 2009, 119, 158–171. [Google Scholar] [CrossRef] [Green Version]
  49. Jammazi, R. Cross Dynamics of Oil-Stock Interactions: A Redundant Wavelet Analysis. Energy 2012, 44, 750–777. [Google Scholar] [CrossRef]
  50. Mensi, W.; Hammoudeh, S.; Yoon, S.-M. Structural Breaks, Dynamic Correlations, Asymmetric Volatility Transmission, and Hedging Strategies for Petroleum Prices and USD Exchange Rate. Energy Econ. 2015, 48, 46–60. [Google Scholar] [CrossRef]
  51. Park, J.; Ratti, R.A. Oil Price Shocks and Stock Markets in the U.S. and 13 European Countries. Energy Econ. 2008, 30, 2587–2608. [Google Scholar] [CrossRef]
  52. Reboredo, J.C.; Rivera-Castro, M.A. Wavelet-Based Evidence of the Impact of Oil Prices on Stock Returns. Int. Rev. Econ. Financ. 2014, 29, 145–176. [Google Scholar] [CrossRef]
  53. Torrence, C.; Compo, G.P. A Practical Guide to Wavelet Analysis. Bull. Am. Meteorol. 1998, 79, 61–78. [Google Scholar] [CrossRef]
  54. Aloui, R.; Hammoudeh, S.; Nguyen, D.K. A Time-Varying Copula Approach to Oil and Stock Market Dependence: The Case of Transition Economies. Energy Econ. 2013, 39, 208–221. [Google Scholar] [CrossRef]
  55. Arouri, M.E.H.; Jouini, J.; Nguyen, D.K. On the Impacts of Oil Price Fluctuations on European Equity Markets: Volatility Spillover and Hedging Effectiveness. Energy Econ. 2012, 34, 611–617. [Google Scholar] [CrossRef]
  56. Bollerslev, T. Generalized Autoregressive Conditional Heteroskedasticity. J. Econ. 1986, 31, 307–327. [Google Scholar] [CrossRef] [Green Version]
  57. Dutta, A. Implied Volatility Linkages between the U.S. and Emerging Equity Markets: A Note. Glob. Financ. J. 2018, 35, 138–146. [Google Scholar] [CrossRef]
  58. Engle, R. Dynamic Conditional Correlation: A Simple Class of Multivariate Generalized Autoregressive Conditional Heteroskedasticity Models. J. Bus. Econ. Stat. 2002, 20, 339–350. [Google Scholar] [CrossRef]
  59. Engle, R.F.; Granger, C.W.J. Co-Integration and Error Correction: Representation, Estimation, and Testing. Econometrica 1987, 55, 251. [Google Scholar] [CrossRef]
  60. Golub, S.S. Oil Prices and Exchange Rates. Econ. J. 1983, 93, 576. [Google Scholar] [CrossRef]
  61. Kang, W.; Ratti, R.A. Structural Oil Price Shocks and Policy Uncertainty. Econ. Model. 2013, 35, 314–319. [Google Scholar] [CrossRef] [Green Version]
  62. Mensi, W. Global Financial Crisis and Co-Movements between Oil Prices and Sector Stock Markets in Saudi Arabia: A VaR Based Wavelet. Borsa Istanb. Rev. 2019, 19, 24–38. [Google Scholar] [CrossRef]
  63. Apergis, N.; Miller, S.M. Do Structural Oil-Market Shocks Affect Stock Prices? Energy Econ. 2009, 31, 569–575. [Google Scholar] [CrossRef] [Green Version]
  64. Andrews, D.W.K. Tests for Parameter Instability and Structural Change with Unknown Change Point: A Corrigendum. Econometrica 2003, 71, 395–397. [Google Scholar] [CrossRef]
  65. Bai, J.; Perron, P. Computation and Analysis of Multiple Structural Change Models. J. Appl. Econom. 2003, 18, 1–22. [Google Scholar] [CrossRef] [Green Version]
  66. Basher, S.A.; Sadorsky, P. Oil Price Risk and Emerging Stock Markets. Glob. Financ. J. 2006, 17, 224–251. [Google Scholar] [CrossRef]
  67. Chen, S.-S. Do Higher Oil Prices Push the Stock Market into Bear Territory? Energy Econ. 2010, 32, 490–495. [Google Scholar] [CrossRef]
  68. Engle, R.; Kroner, K. Multivariate Simultaneous Generalized ARCH. Econom. Theory 1995, 11, 122–150. [Google Scholar] [CrossRef]
  69. Ma, F.; Wei, Y.; Huang, D.; Zhao, L. Cross-Correlations between West Texas Intermediate Crude Oil and the Stock Markets of the BRIC. Phys. A: Stat. Mech. Its Appl. 2013, 392, 5356–5368. [Google Scholar] [CrossRef]
  70. Chen, N.-F.; Roll, R.; Ross, S.A. Economic Forces and the Stock Market. J. Bus. 1986, 383–403. [Google Scholar] [CrossRef] [Green Version]
  71. Ciner, C. Energy Shocks and Financial Markets: Nonlinear Linkages. Stud. Nonlinear Dyn. Econom. 2001, 5, 1079. [Google Scholar] [CrossRef]
  72. Cong, R.-G.; Wei, Y.-M.; Jiao, J.-L.; Fan, Y. Relationships between Oil Price Shocks and Stock Market: An Empirical Analysis from China. Energy Policy 2008, 36, 3544–3553. [Google Scholar] [CrossRef]
  73. Elder, J.; Serletis, A. Oil Price Uncertainty. J. Money Credit Bank. 2010, 42, 1137–1159. [Google Scholar] [CrossRef]
  74. Hammoudeh, S.; Dibooglu, S.; Aleisa, E. Relationships among U.S. Oil Prices and Oil Industry Equity Indices. Int. Rev. Econ. Financ. 2004, 13, 427–453. [Google Scholar] [CrossRef]
  75. Kilian, L. Not All Oil Price Shocks Are Alike: Disentangling Demand and Supply Shocks in the Crude Oil Market. Am. Econ. Rev. 2009, 99, 1053–1069. [Google Scholar] [CrossRef] [Green Version]
  76. Lee, K.; Ni, S.; Ratti, R.A. Oil Shocks and the Macroeconomy: The Role of Price Variability. Energy J. 1995, 16, 39–56. [Google Scholar] [CrossRef] [Green Version]
  77. Sadorsky, P. Risk Factors in Stock Returns of Canadian Oil and Gas Companies. Energy Econ. 2001, 23, 17–28. [Google Scholar] [CrossRef]
  78. Sadorsky, P. Modeling Volatility and Correlations between Emerging Market Stock Prices and the Prices of Copper, Oil and Wheat. Energy Econ. 2014, 43, 72–81. [Google Scholar] [CrossRef]
  79. Hamilton, J.D. What Is an Oil Shock? J. Econom. 2003, 113, 363–398. [Google Scholar] [CrossRef]
  80. Henriques, I.; Sadorsky, P. Oil Prices and the Stock Prices of Alternative Energy Companies. Energy Econ. 2008, 30, 998–1010. [Google Scholar] [CrossRef]
  81. Orlov, A.G. A Cospectral Analysis of Exchange Rate Comovements during Asian Financial Crisis. J. Int. Financ. Mark. Inst. Money 2009, 19, 742–758. [Google Scholar] [CrossRef]
  82. Bodart, V.; Candelon, B. Evidence of Interdependence and Contagion Using a Frequency Domain Framework. Emerg. Mark. Rev. 2009, 10, 140–150. [Google Scholar] [CrossRef]
  83. Dewandaru, G.; Rizvi, S.A.R.; Masih, R.; Masih, M.; Alhabshi, S.O. Stock Market Co-Movements: Islamic versus Conventional Equity Indices with Multi-Timescales Analysis. Econ. Syst. 2014, 38, 553–571. [Google Scholar] [CrossRef]
  84. Pericoli, M.; Sbracia, M. A Primer on Financial Contagion. J. Econ. Surv. 2003, 17, 571–608. [Google Scholar] [CrossRef]
  85. Forbes, K.; Rigobon, R. Measuring Contagion: Conceptual and Empirical Issues. In International Financial Contagion; Springer: Berlin/Heidelberg, Germany, 2001; pp. 43–66. [Google Scholar]
  86. Forbes, K.J.; Rigobon, R. No Contagion, Only Interdependence: Measuring Stock Market Comovements. J. Financ. 2002, 57, 2223–2261. [Google Scholar] [CrossRef]
  87. Vayá-Valcarce, E.; Frexedas, O.V. Financial Contagion between Economies: An Exploratory Spatial Analysis. Estud. De Econ. Apl. 2005, 23, 151–166. [Google Scholar]
  88. Mitra, A.; Bhattacharjee, K. Financial Interdependence of International Stock Markets: A Literature Review. Indian J. Financ. 2015, 9, 20–33. [Google Scholar] [CrossRef]
  89. Nagayev, R.; Disli, M.; Inghelbrecht, K.; Ng, A. On the Dynamic Links between Commodities and Islamic Equity. Energy Econ. 2016, 58, 125–140. [Google Scholar] [CrossRef]
  90. Antonakakis, N.; Chatziantoniou, I.; Filis, G. Oil Shocks and Stock Markets: Dynamic Connectedness under the Prism of Recent Geopolitical and Economic Unrest. Int. Rev. Financ. Anal. 2017, 50, 1–26. [Google Scholar] [CrossRef] [Green Version]
  91. Shahzad, S.J.H.; Mensi, W.; Hammoudeh, S.; Rehman, M.U.; Al-Yahyaee, K.H. Extreme Dependence and Risk Spillovers between Oil and Islamic Stock Markets. Emerg. Mark. Rev. 2018, 34, 42–63. [Google Scholar] [CrossRef]
  92. Roy, R.P.; Roy, S.S. Financial Contagion and Volatility Spillover: An Exploration into Indian Commodity Derivative Market. Econ. Model. 2017, 67, 368–380. [Google Scholar] [CrossRef]
  93. Disli, M.; Nagayev, R.; Salim, K.; Rizkiah, S.K.; Aysan, A.F. In Search of Safe Haven Assets during COVID-19 Pandemic: An Empirical Analysis of Different Investor Types. Res. Int. Bus. Financ. 2021, 58, 101461. [Google Scholar] [CrossRef]
  94. Pal, D.; Mitra, S.K. Oil Price and Automobile Stock Return Co-Movement: A Wavelet Coherence Analysis. Econ. Model. 2019, 76, 172–181. [Google Scholar] [CrossRef]
  95. Ftiti, Z.; Guesmi, K.; Abid, I. Oil Price and Stock Market Co-Movement: What Can We Learn from Time-Scale Approaches? Int. Rev. Financ. Anal. 2016, 46, 266–280. [Google Scholar] [CrossRef]
  96. Bouri, E.; Chen, Q.; Lien, D.; Lv, X. Causality between Oil Prices and the Stock Market in China: The Relevance of the Reformed Oil Product Pricing Mechanism. Int. Rev. Econ. Financ. 2017, 48, 34–48. [Google Scholar] [CrossRef]
  97. Maghyereh, A.; Abdoh, H. Extreme Dependence between Structural Oil Shocks and Stock Markets in GCC Countries. Resour. Policy 2022, 76, 102626. [Google Scholar] [CrossRef]
  98. Boldanov, R.; Degiannakis, S.; Filis, G. Time-Varying Correlation between Oil and Stock Market Volatilities: Evidence from Oil-Importing and Oil-Exporting Countries. Int. Rev. Financ. Anal. 2016, 48, 209–220. [Google Scholar] [CrossRef] [Green Version]
  99. Belhassine, O. Volatility Spillovers and Hedging Effectiveness between the Oil Market and Eurozone Sectors: A Tale of Two Crises. Res. Int. Bus. Financ. 2020, 53, 101195. [Google Scholar] [CrossRef]
  100. Ali, S.R.M.; Mensi, W.; Anik, K.I.; Rahman, M.; Kang, S.H. The Impacts of COVID-19 Crisis on Spillovers between the Oil and Stock Markets: Evidence from the Largest Oil Importers and Exporters. Econ. Anal. Policy 2022, 73, 345–372. [Google Scholar] [CrossRef]
  101. Ren, C. Volatility Spillovers and Nexus across Oil, Gold, and Stock European Markets. Am. Bus. Rev. 2022, 25, 52–185. [Google Scholar] [CrossRef]
  102. Aloui, R.; ben Aïssa, M.S.; Nguyen, D.K. Conditional Dependence Structure between Oil Prices and Exchange Rates: A Copula-GARCH Approach. J. Int. Money Financ. 2013, 32, 719–738. [Google Scholar] [CrossRef]
  103. Feng, Y.; Cui, Y. Dual and Single Hedging Strategy: A Novel Comparison from the Direct and Cross Hedging Perspective. China Financ. Rev. Int. 2022, 12, 161–179. [Google Scholar] [CrossRef]
Figure 1. Network of co-occurring keywords for the search “dynamic linkage*” OR “dynamic co-movement*” OR “dynamic dependence*” OR “dynamic interdependence*”. Source: Authors’ own research using VOSviewer, as well as Scopus and WoS databases.
Sustainability 14 12796 g001
Figure 2. Literature search strategy.
Sustainability 14 12796 g002
Figure 3. Publication output. (a) Publication output and (b) average number of citations per year. Source: Authors’ own research using the Bibliometrix tool, as well as Scopus and WoS databases.
Sustainability 14 12796 g003
Figure 4. Distribution of documents across sources. Source: Authors’ own research using the Bibliometrix tool, as well as Scopus and WoS databases.
Sustainability 14 12796 g004
Figure 5. Effect of the sources. (a) Most cited sources and (b) source clustering through Bradford’s Law. Source: Authors’ own research using the Bibliometrix tool, as well as Scopus and WoS databases.
Sustainability 14 12796 g005
Figure 6. Authors’ productivity according to Lotka’s Law production of research about dynamic co-movements between assets in financial markets from 1982 to 2022 (September). Source: Authors’ own research using the Bibliometrix tool as well as Scopus and WoS databases.
Sustainability 14 12796 g006
Figure 7. Effect of the authors. (a) Number of publications by authors and (b) most local cited authors. Source: Authors’ own research using the Bibliometrix tool, as well as Scopus and WoS databases.
Sustainability 14 12796 g007
Figure 8. Top authors’ production over time in researching the dynamic co-movements between assets in financial markets from 1982 to 2022. Source: Authors’ own research using the Bibliometrix tool, as well as Scopus and WoS databases.
Sustainability 14 12796 g008
Figure 9. Co-authorship network. Source: Authors’ own research using VOSviewer, as well as Scopus and WoS databases.
Sustainability 14 12796 g009
Figure 10. Trend topics over the years. Source: Authors’ own research using the Bibliometrix tool, as well as Scopus and WoS databases.
Sustainability 14 12796 g010
Figure 11. Thematic map. Source: Authors’ own research using the Bibliometrix tool, as well as Scopus and WoS databases.
Sustainability 14 12796 g011
Figure 12. Thematic evolution of KeyWords Plus. Source: Authors’ own research using the Bibliometrix tool, as well as Scopus and WoS databases.
Sustainability 14 12796 g012
Figure 13. Co-citation network of references. Source: Authors’ own research using VOSviewer, as well as Scopus and WoS databases.
Sustainability 14 12796 g013
Figure 14. Network of countries. Source: Authors’ own research using VOSviewer, as well as Scopus and WoS databases.
Sustainability 14 12796 g014
Figure 15. Word cloud. (a) Author keywords and (b) KeyWords Plus. Source: Authors’ own research using the Bibliometrix tool, as well as Scopus and WoS databases.
Sustainability 14 12796 g015
Figure 16. Network of co-occurring keywords. Source: Authors’ own research using VOSviewer, as well as Scopus and WoS databases.
Sustainability 14 12796 g016
Figure 17. Bibliometric coupling of documents. Source: Authors’ own research using the Bibliometrix tool, as well as Scopus and WoS databases.
Sustainability 14 12796 g017
Table 1. Summary of the descriptive information. Source: Authors’ own research using the Bibliometrix tool, as well as Scopus and WoS databases.
DescriptionResultsDescriptionResults
MAIN INFORMATIONDOCUMENT TYPES (continued)
Timespan1982:2022Conference review1
Sources (journals, books, etc.)289Erratum2
Documents746Note1
Annual growth rate %11.54Retracted2
Document average age4.37Review8
Average citations per doc26.79DOCUMENT CONTENTS
References27,756 KeyWords Plus (ID)1778
DOCUMENT TYPESAuthor keywords (DE)1792
Article672AUTHORS
Article; book chapter1Authors1358
Article; early access8Authors of single-authored docs91
Article; proceedings paper2AUTHORS COLLABORATION
Book1Single-authored docs112
Book chapter13Co-authors per doc2.71
Conference paper35International co-authorships %14.08
Table 2. Top 20 most relevant authors on dynamic co-movements between assets in financial market outputs. Notes: TC = total citations; NP = number of publications; PY start = publication year start. Source: Authors’ own research using the Bibliometrix tool, as well as Scopus and WoS databases.
ElementH_indexG_indexM_indexTCNPPY_start
1Hammoudeh, S.162211549222007
2Reboredo, J.13131.181680132012
3Mensi, W.12141.21104142013
4Tiwari, A.12181.2478182013
5Yang, L.11141.1783142013
6Hamori, S.10120.56454122005
7Filis, G.9110.751299112011
8Nguyen, D.9110.821101112012
9An, H.891247102015
10Kang, S.8101.14321102016
11Guesmi, K.7140.78359152014
12Wang, Y.780.750892013
13Zhang, Y.78134382017
14Aloui, C.670.5585672012
15Cai, X.660.8635262016
16Huang, S.660.8617072016
17Al-Yahyaee, K.55124252018
18Antonakakis, N.550.563252013
19Ftiti, Z.550.5615752014
20Ghorbel, A.560.4555962012
Table 3. The top 10 corresponding author countries.
CountryNo. of Articles
1China160
2United States50
3France33
4India30
5Turkey30
6Korea25
7United Kingdom22
8Japan21
9Saudi Arabia20
10Tunisia18
Source: Authors’ own research using the Bibliometrix tool, as well as Scopus and WoS databases.
Table 4. The top 10 institutions publishing articles.
AffiliationNo. of Articles
1Drexel University22
2IPAG Business School15
3Hunan University12
4Pusan National University12
5Kobe University10
6Montpellier Business School10
7South Ural State University10
8University of Sfax10
9Chiang Mai University10
10Zhongnan University of Economics and Law9
Source: Authors’ own research using the Bibliometrix tool, as well as Scopus and WoS databases.
Table 5. Top 10 cited documents in the research of dynamic co-movements between assets in financial markets. Source: Authors’ own research using the Bibliometrix tool, as well as Scopus and WoS databases.
#AuthorSourceTotal CitationsTC per YearNormalized TC
1Kilian and Park [28]International Economic Review86561.799.07
2Sharif, Aloui, and Yarovaya [29]International Review of Financial Analysis517172.3330.15
3Filis, Degiannakis, and Floros [30]International Review of Financial Analysis40333.585.74
4Sari, Hammoudeh, and Soytas [31]Energy Economics31524.237.19
5Wang, Wu, and Yang [32]Journal of Comparative Economics31431.402.36
6Antonakakis, Chatziantoniou, and Filis [33]Economics Letters30730.702.31
7Mensi et al. [34]Economic Modelling26426.401.99
8Basher and Sadorsky [35]Energy Economics26337.576.37
9Creti, Joëts, and Mignon [36]Energy Economics25225.201.90
10Mensi et al. [37]Emerging Markets Review24627.334.23
Table 6. Most frequent words (author keywords and KeyWords Plus) found in the research of dynamic co-movements between assets in financial markets. Source: Authors’ own research using the Bibliometrix tool, as well as Scopus and WoS databases.
Author Keywords OccurrencesKeyWords PlusOccurrences
1oil prices314oil prices465
2stock markets156stock markets317
3wavelet analysis84financial markets158
4exchange rates83volatility spillovers143
5volatility spillovers75exchange rates134
6DCC-GARCH71commerce132
7COVID-1943costs119
8volatility42energy markets113
9hedge ratio39price dynamics110
10copula37volatility100
Publisher’s Note: MDPI stays neutral with regard to jurisdictional claims in published maps and institutional affiliations.

