3.1. Glare of A-PVs According to Their Installation Angle at a Single Site
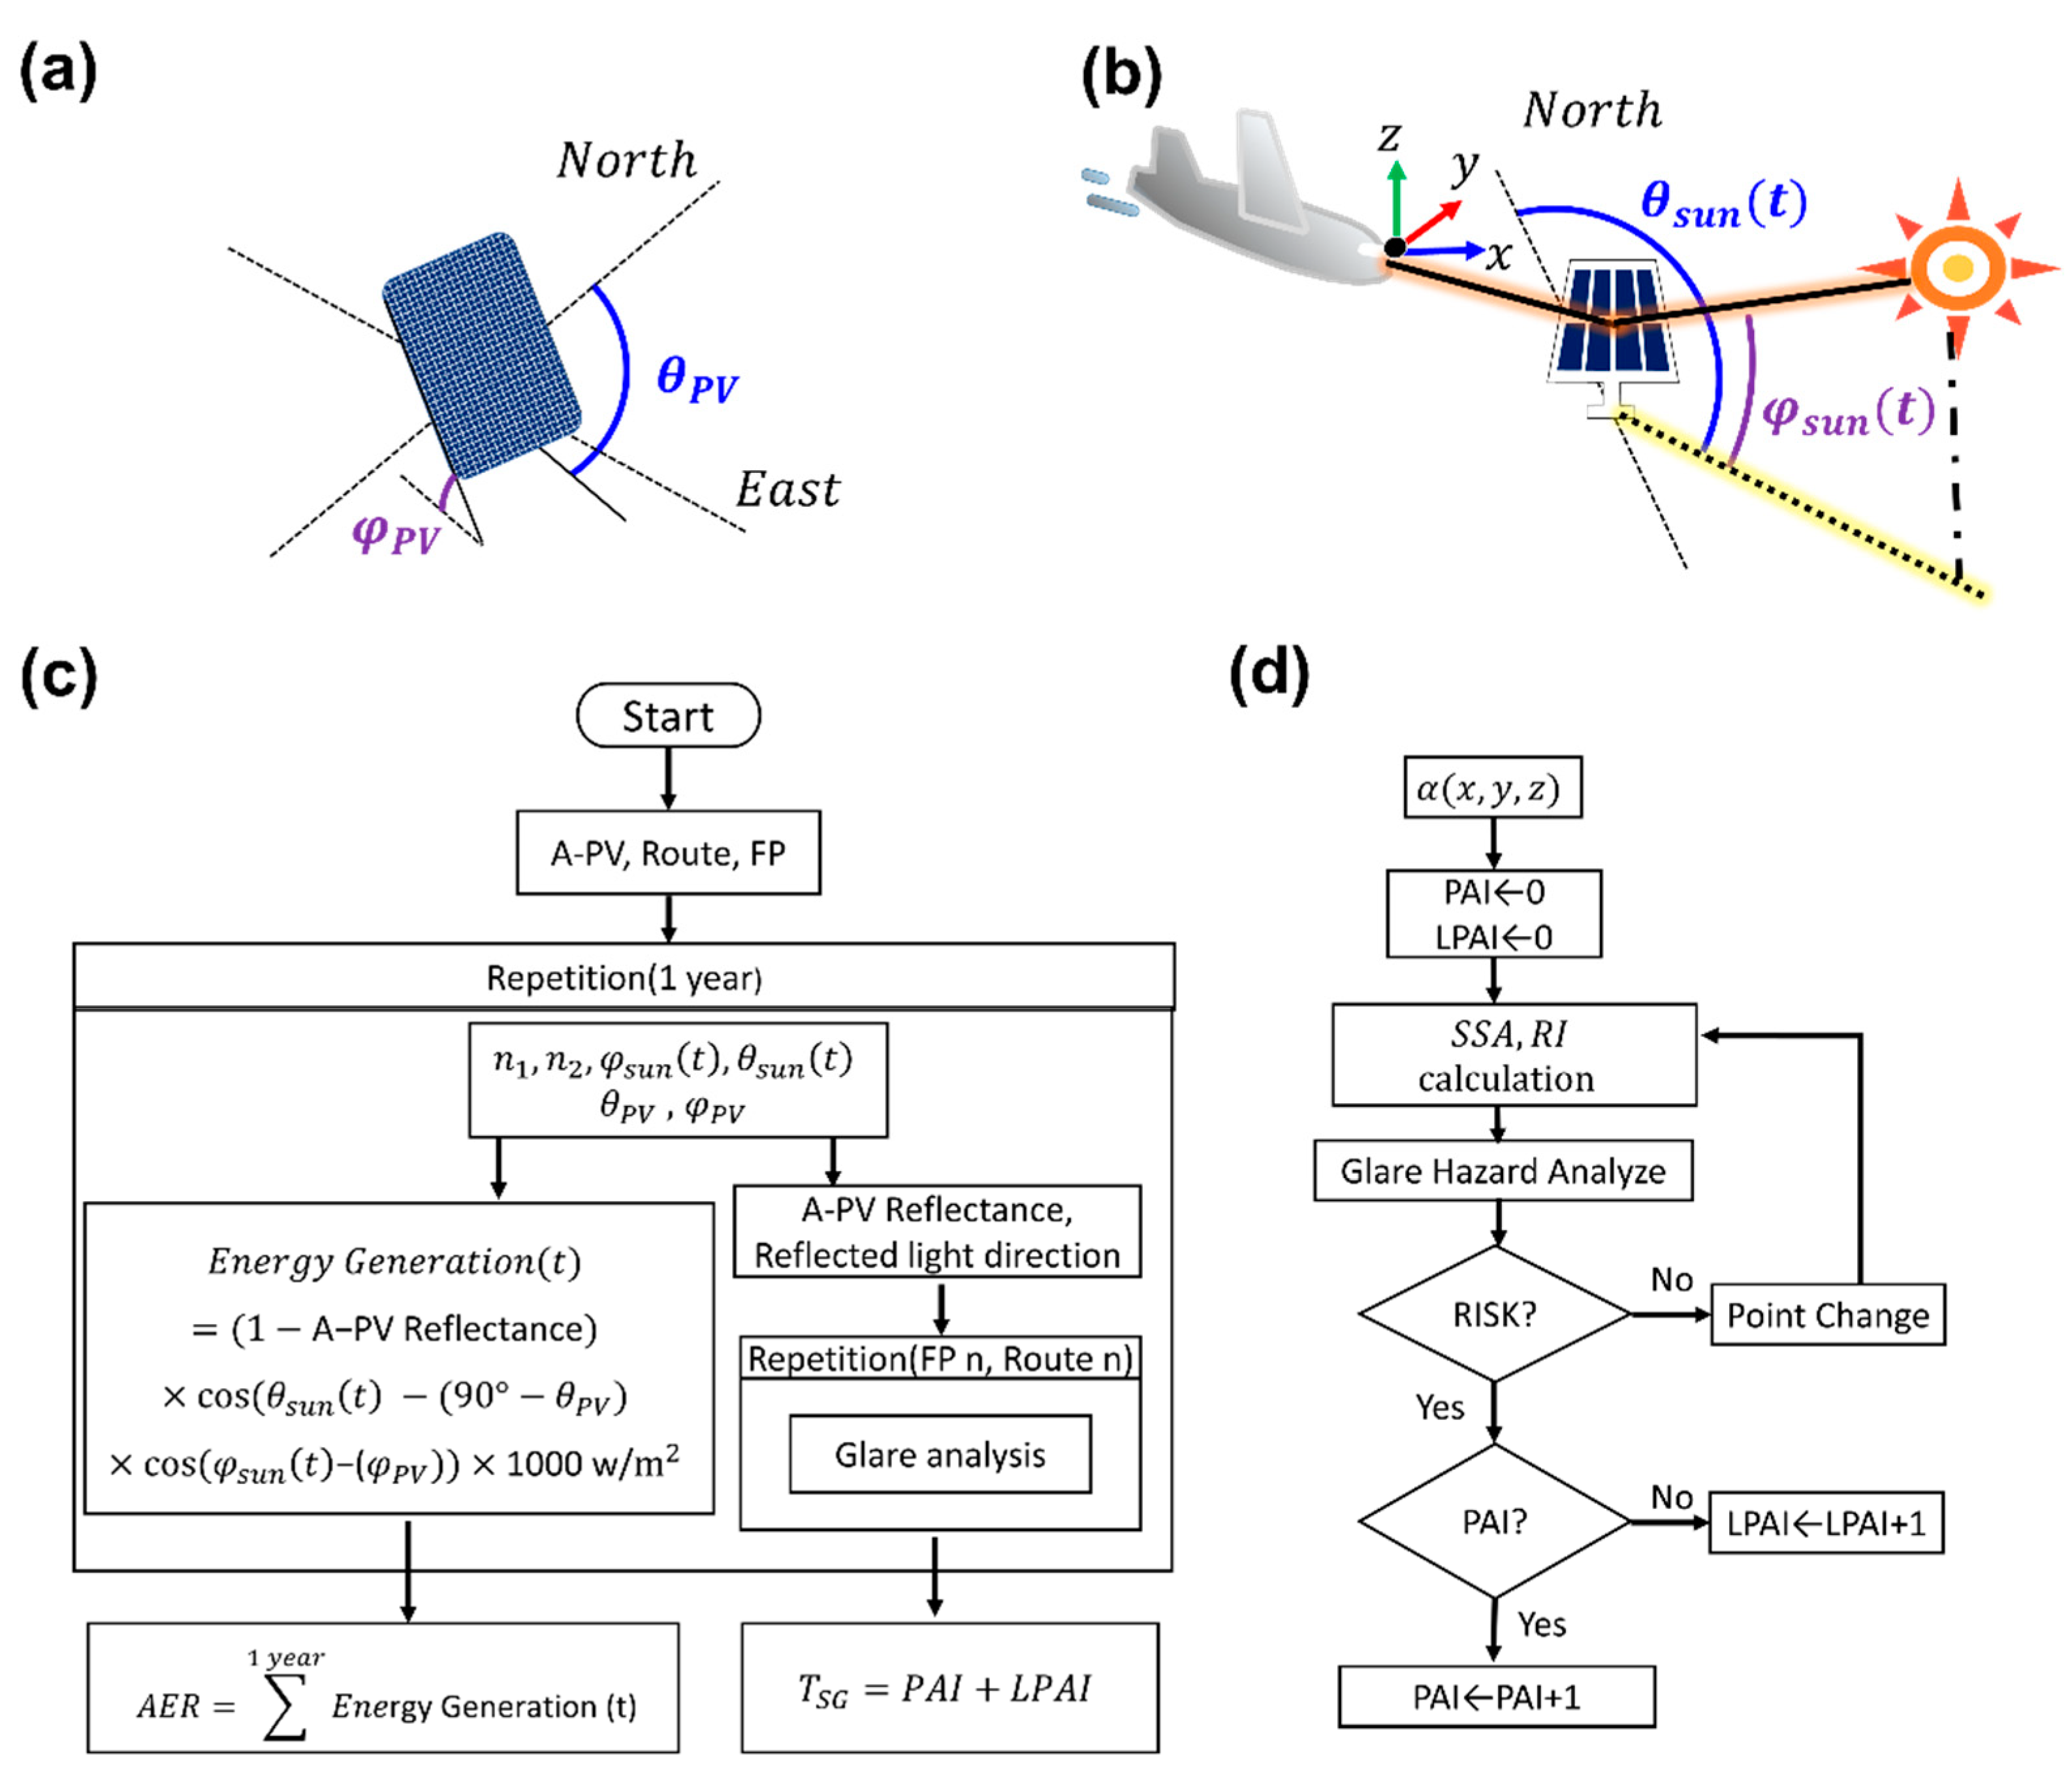
To figure out the general relationship between θ
PV and R
SG, we calculated I
retina and θ
Source of a pilot in the flight path (FP2) caused by a single A-PV (W1) depending on θ
PV, as marked in
Figure 4 and
Figure 5. According to previous studies, the response of the human eye to incident light can be categorized into four sections depending on the I
retina and θ
Source: (i) no effect, (ii) LPAI, (iii) PAI, and (iv) permanent retina damage (PRD) [
9]. Typically, the risk of an accident increases when a person experiences an after-image for a few seconds.
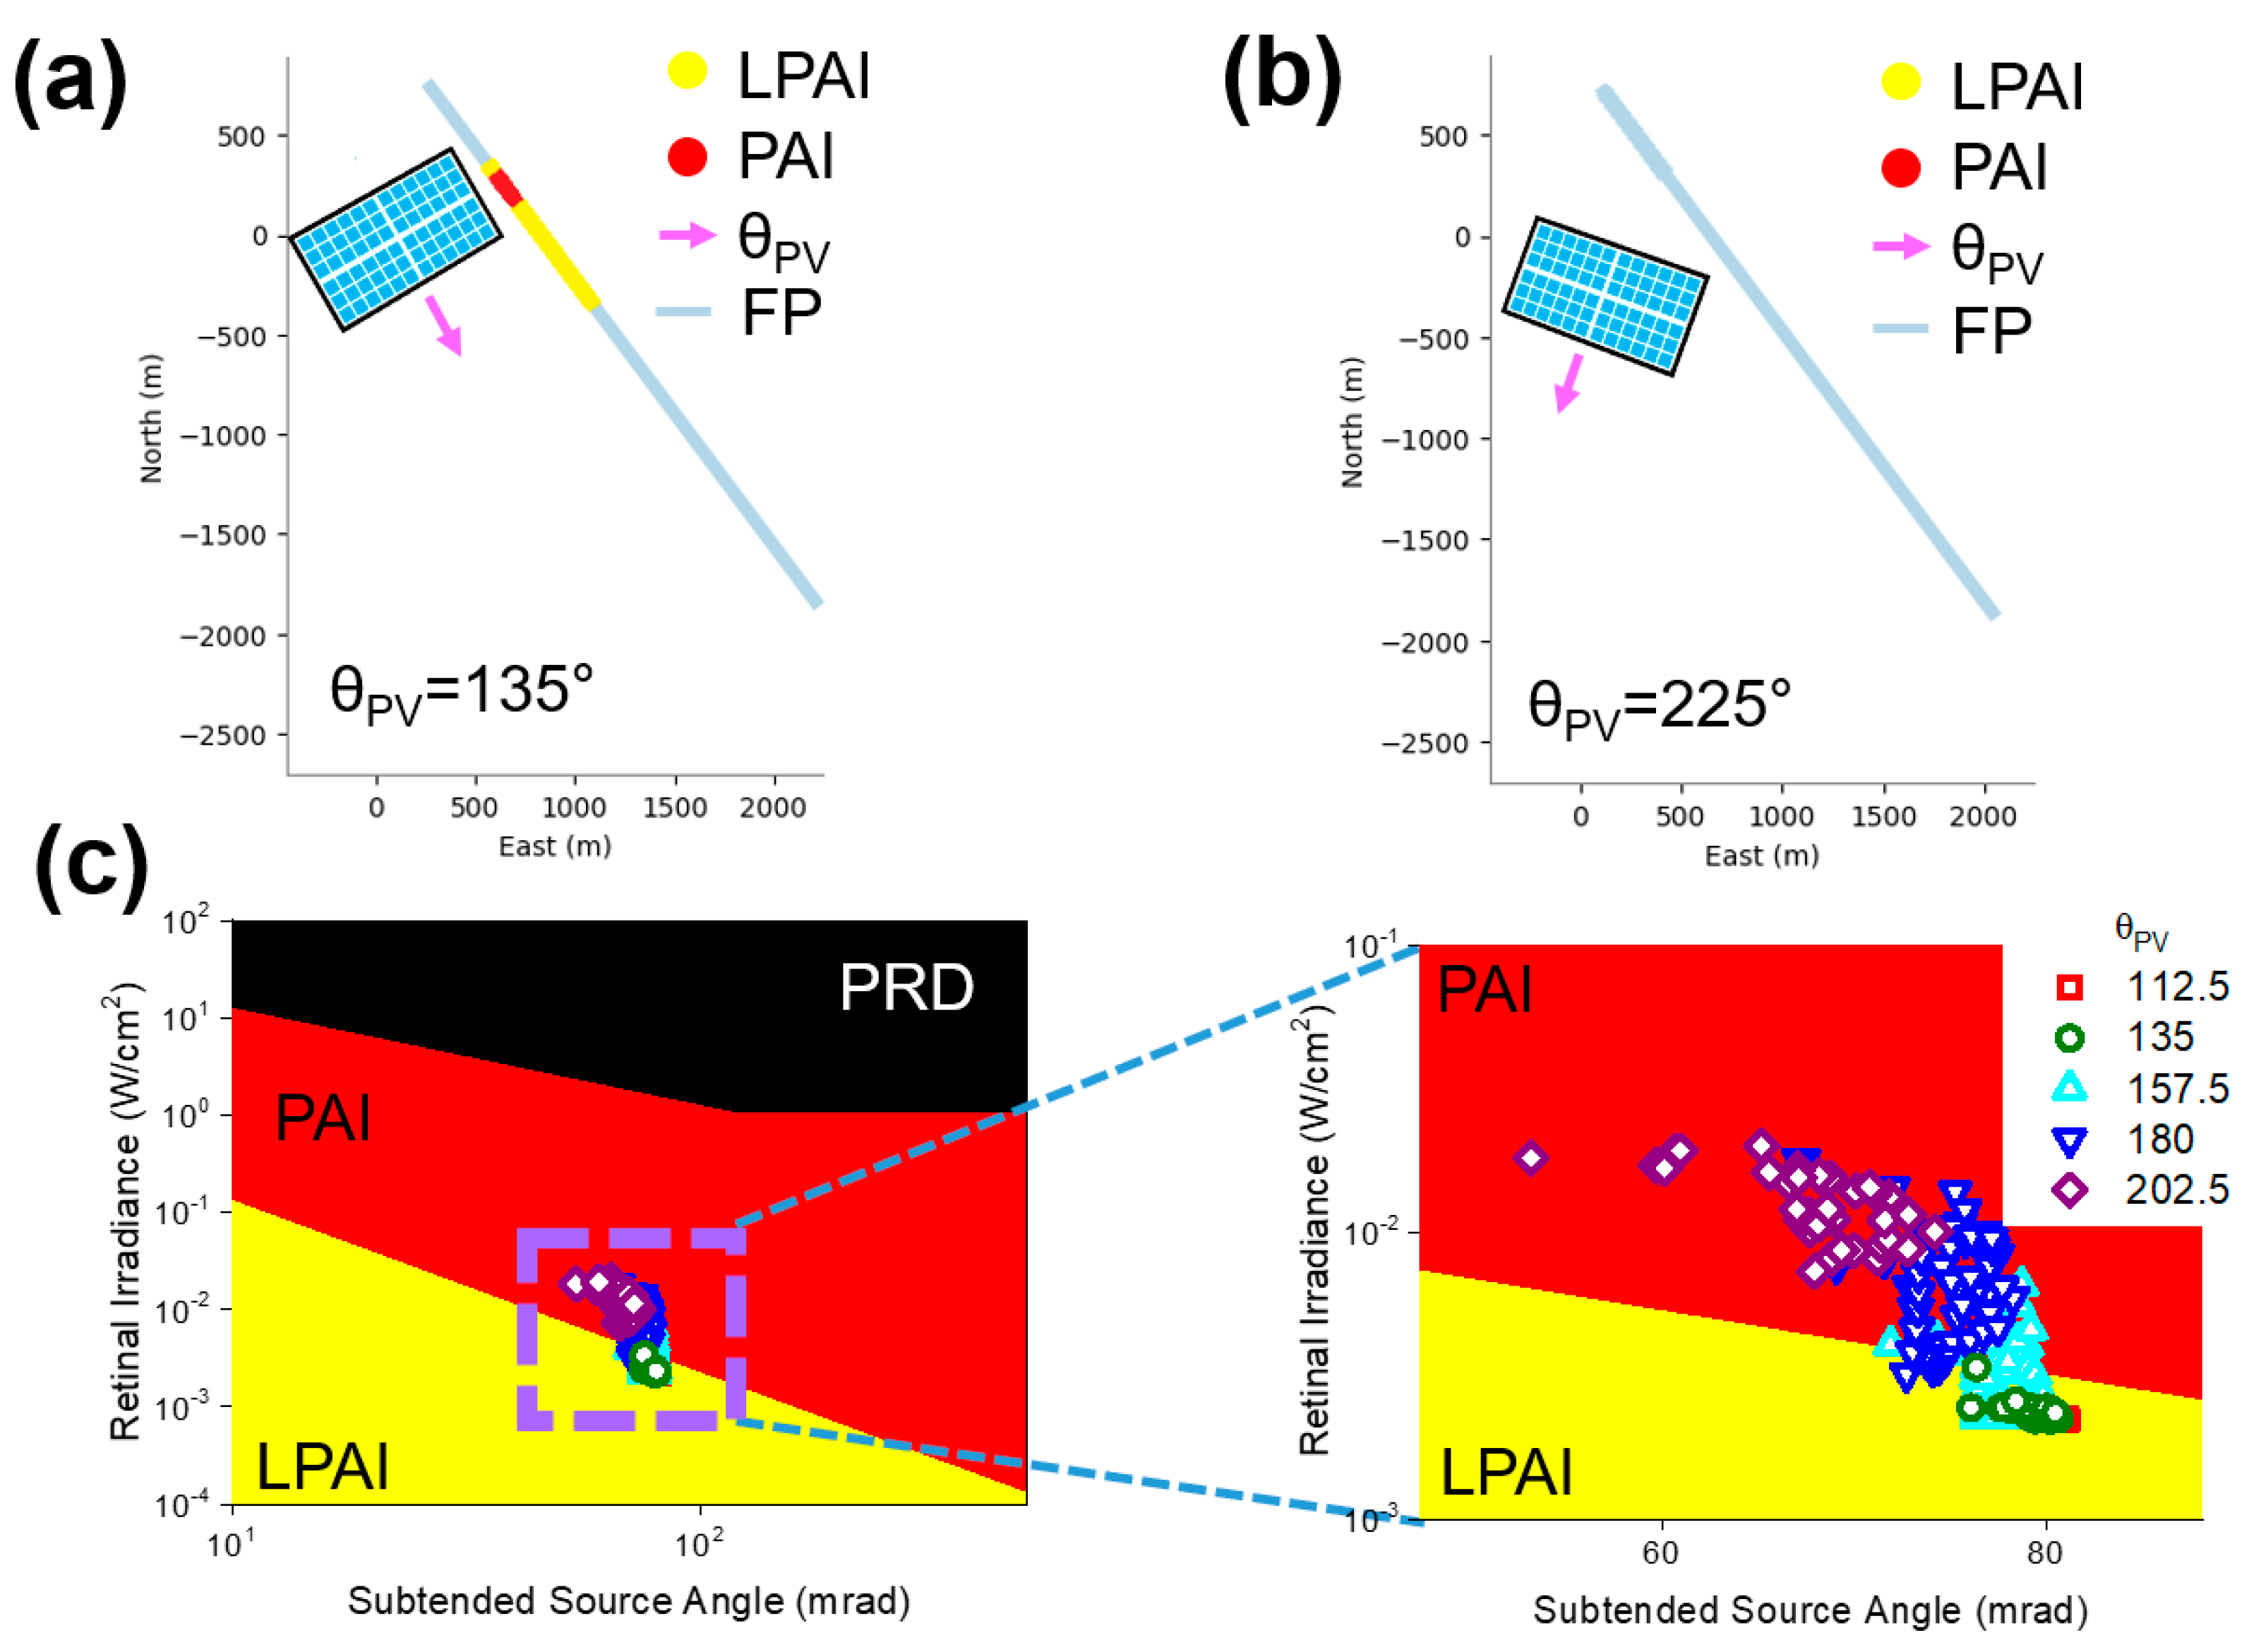
Figure 4c displays the ocular impact of light as a function of θ
Source and I
retina. In cases of weak I
retina and large θ
Source, the risk of an after-image from light is reduced, defined as LPAI. At the PAI stage, the possibility of an after-image increases due to increased I
retina and narrow θ
Source. However, discomfort from limited vision is recovered after 4–12 s without PRD. Under extreme I
retina, the retina can irreversibly burn, causing PRD. As PRD typically occurs in light-concentrating systems, it was not expected in A-PVs.
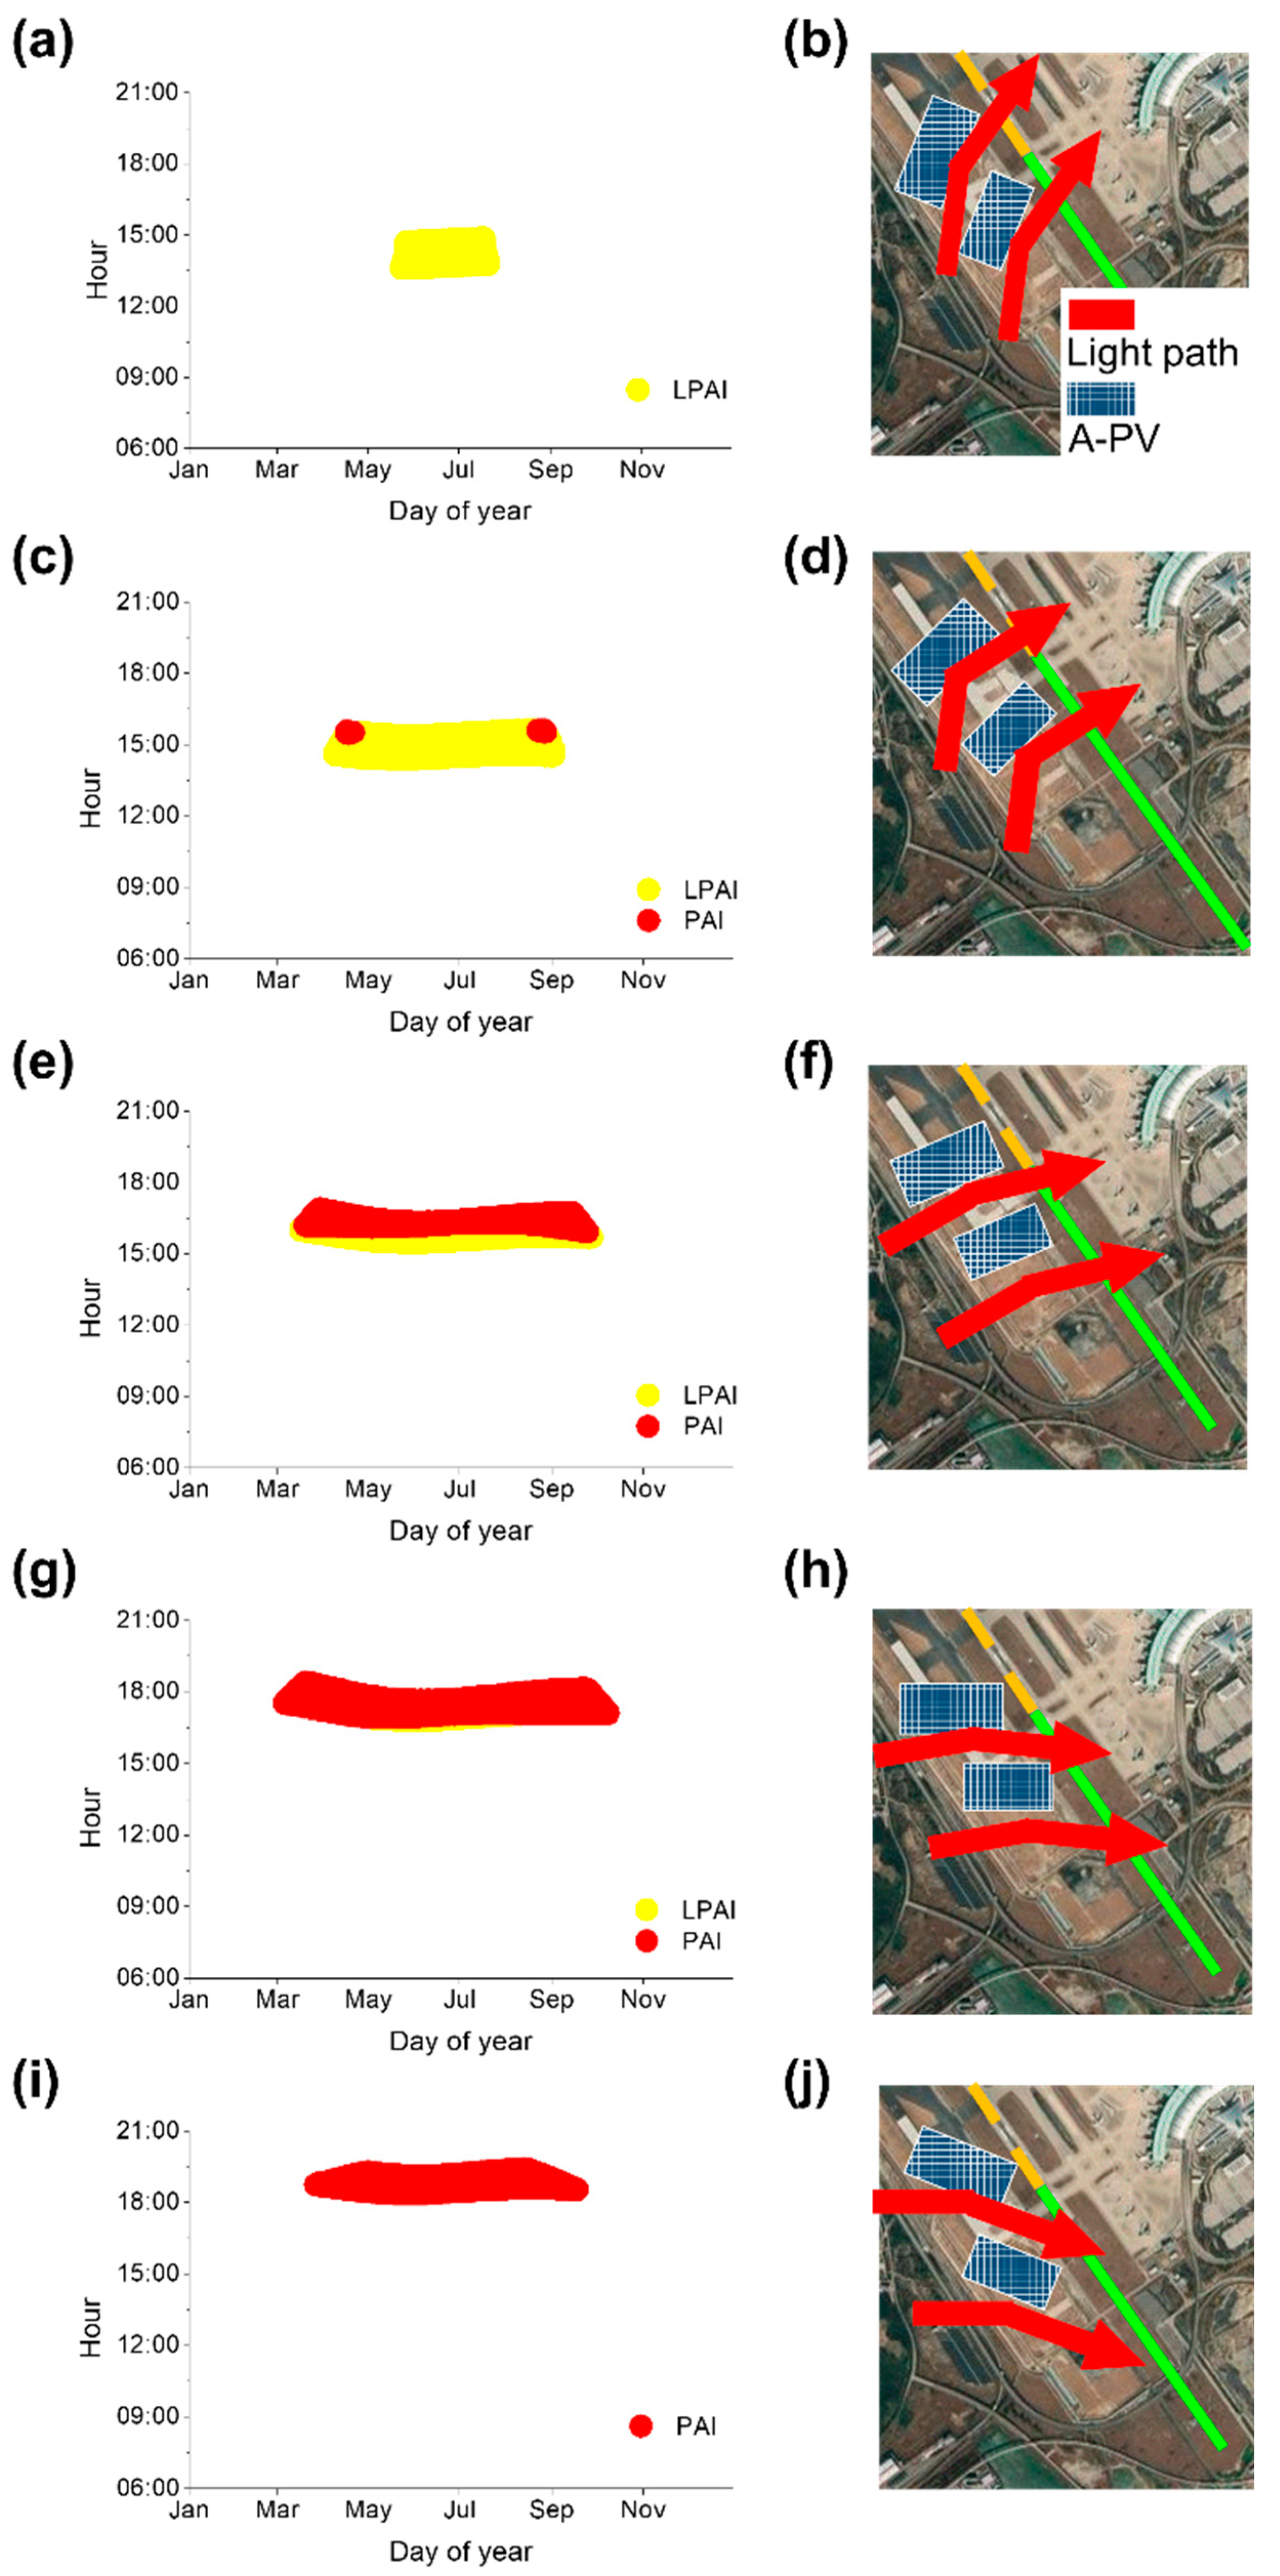
Figure 4a,b show the annual R
SG map in FP2 caused by W1 located on its west. When W1 faces southeast (θ
PV = 135°), W1 bounces off the incident light from the southwest to the pilot in FP2. Remarkably, the reflected light intensity is sufficiently strong to cause LPAI and PAI in pilots. Especially if the pilot is at a low altitude close to W1, they will be exposed to a dangerous situation by a strong reflection of the incident light, marked as LPAI (yellow) and PAI. (red) in
Figure 4a. On the other hand, as W1 is rotated to the southwest (θ
PV = 225°), it does not cause any glare, and thus, the pilot’s vision is not disturbed. Although W1 is rotated at the same angle from the south, generating the same energy, R
SG for each case is totally different. As proven by calculated θ
Source and I
retina in
Figure 4c, they are strongly governed by the θ
PV of W1. As θ
PV increases from 112.5 to 180°, I
retina increases from 10
−3 to 10
−2 W/cm
2. South-facing W1 may reflect light from the west with a large θ
i to FP2 for a longer time, whereas the rear reflector (backsheet) of W1 facing eastward bounces off incident light from the west to the outside airport. As a result, the pilots are more frequently exposed to PAI in the south-facing W1 (θ
PV = 180°) compared with the case of the east-south-east-facing W1 (θ
PV = 112.5°). Moreover, the PAI became more dominant in the south-facing W1. In contrast, as the A-PV turns from south to west (θ
PV = 225–247.5°), I
retina from W1 decreases. When θ
PV is larger than 225°, I
retina is weak enough not to affect the pilot’s vision (not shown in
Figure 4c due to decreased intensity). Hence, the angular dependence of I
retina and θ
Source indicates that the control of θ
PV is a solution for lowering R
SG in A-PVs.
The detailed time and season of PAI and LPAI from W1 are displayed in
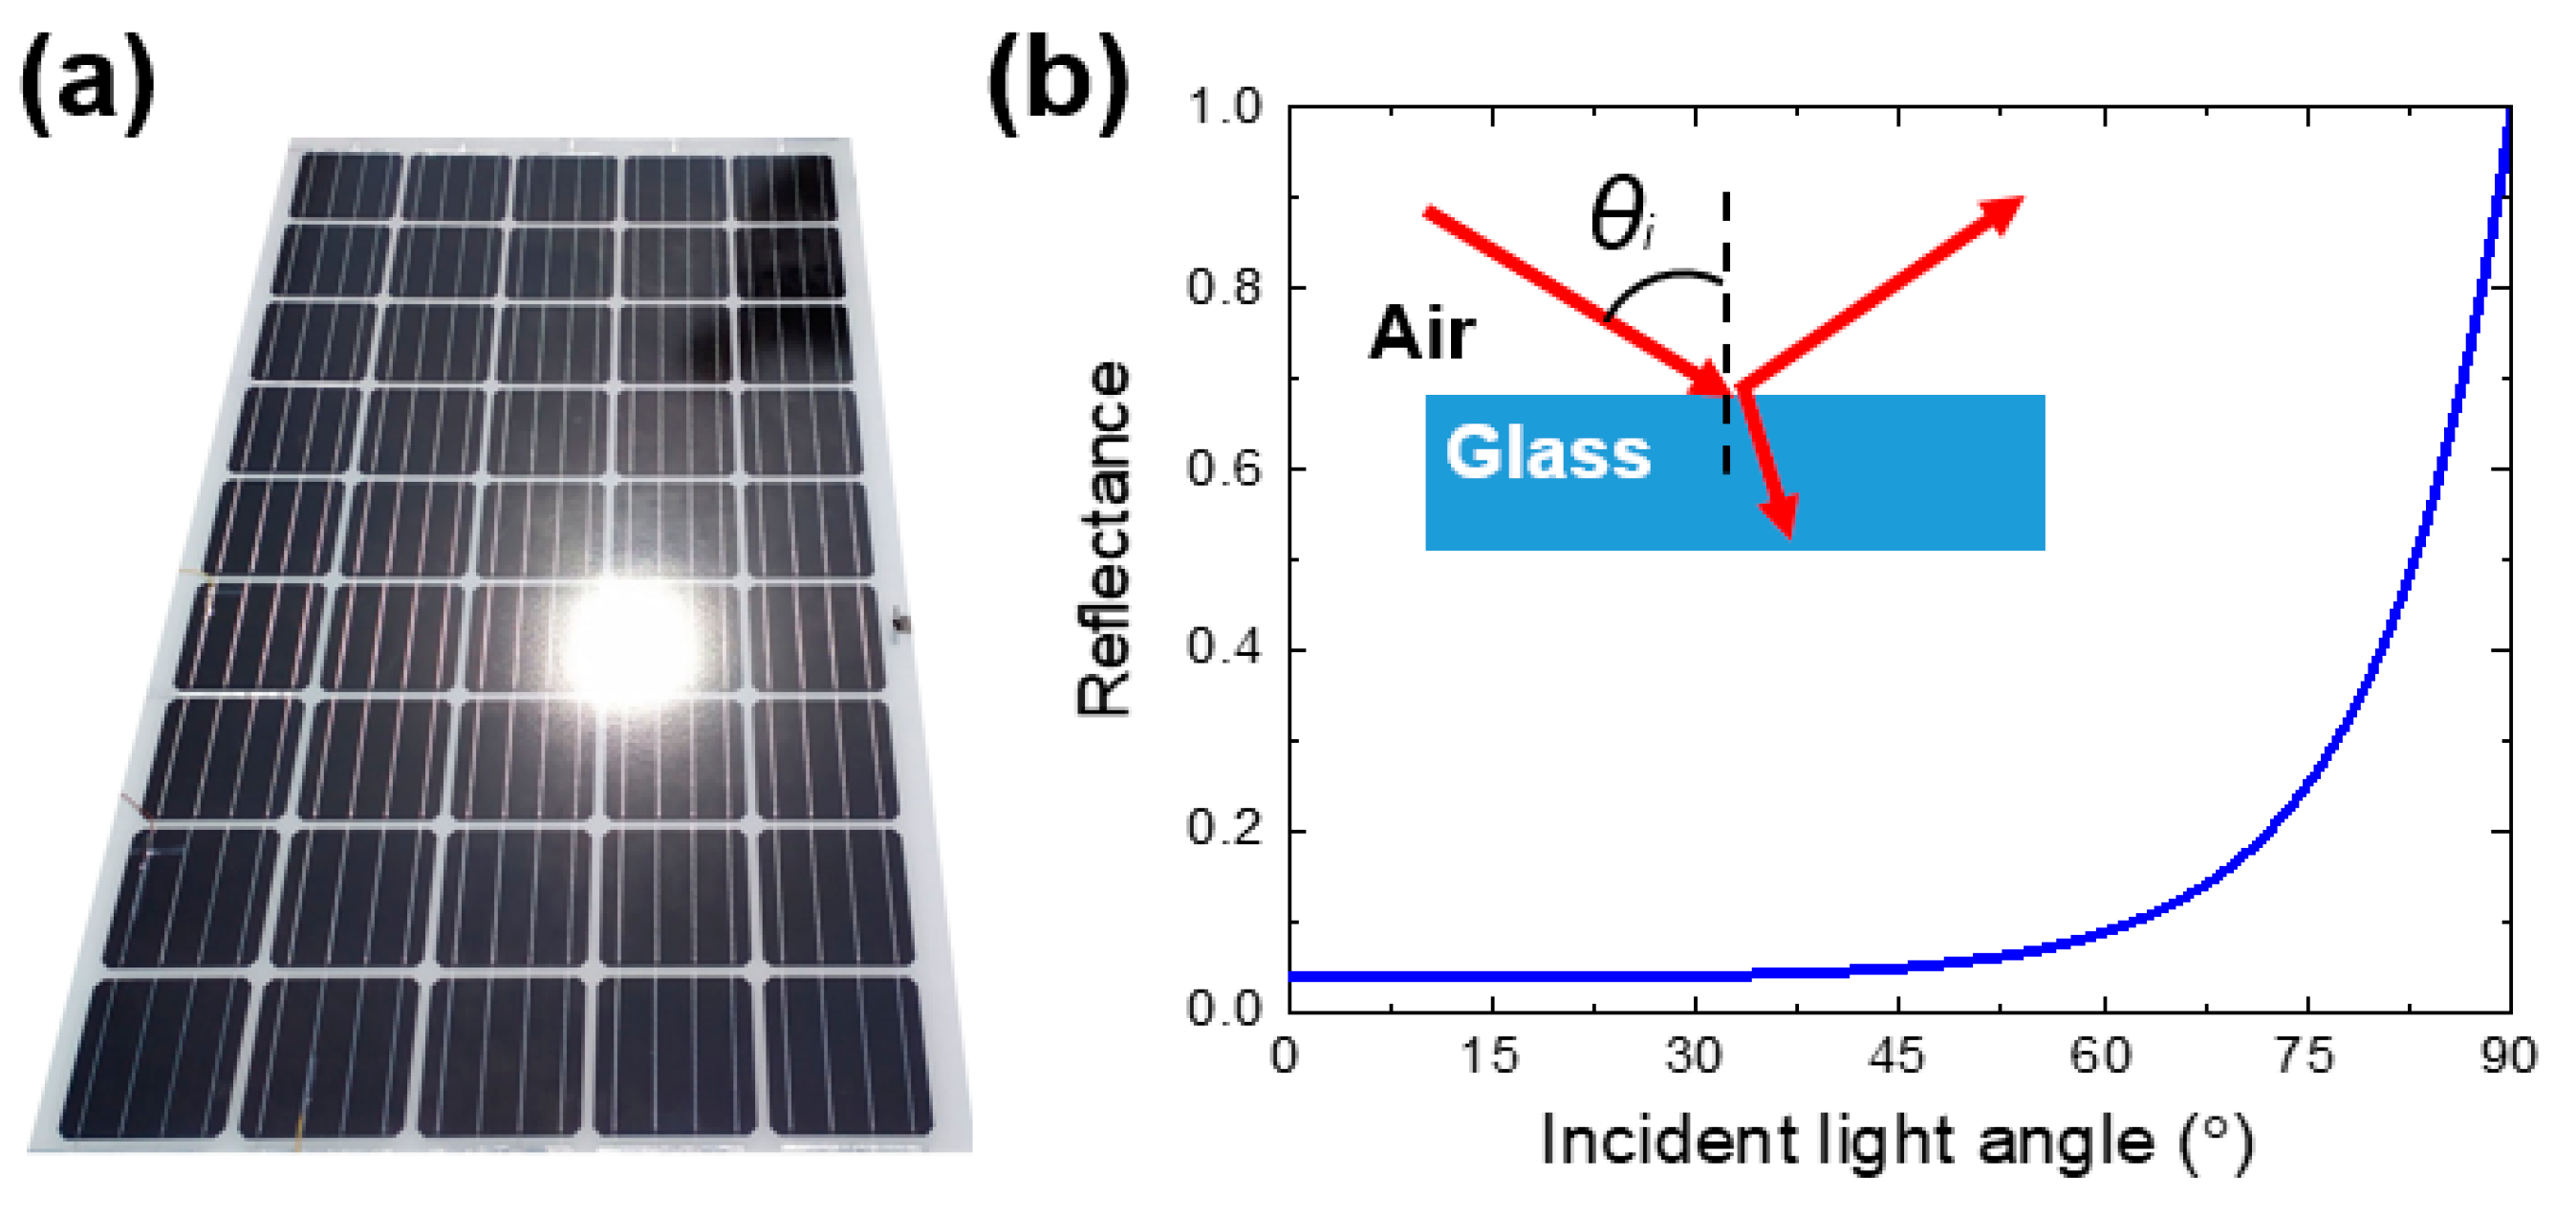
Figure 5. Typically, the reflectance suddenly increases at the interface between the air and glass when θ
i exceeds 60°, as marked in
Figure 1. Here, θ
i is determined by φ
sun(t) and θ
sun(t). Both angles should be lower than 60° to avoid the R
SG. As φ
sun(t) varies less than 90° throughout the year, A-PVs with a fixed φ
PV of 30° are free from the source of SG induced by time-varying φ
sun(t). In contrast, the θ
sun(t) changes by approximately 120° (winter) to 240° (summer) every day, sufficiently large to increase θ
i more than 75° at any time. At the moment, A-PV reflects incident solar light to the opposite side with strong intensity, as marked in
Figure 1b. Thus, the pilots and workers opposite the incident light might be under the influence of SG. For the case of W1, when the A-PV faces east-south-east (θ
PV = 112.5°), LPAI occurs in the afternoon (13:00–15:00) from May to August (please see
Figure 5a). Solar light from the southwest bounces off to FP2, as shown in
Figure 5b. As the φ
sun(t) is more than 60° during glare occurrence (afternoon of summer), the pilots are influenced by the reflected light with a large elevation angle from the bottom of the flight. Thus, the reflected light affects only for a minimal time and limited area. In addition, PAI is not observed in FP2, where the θ
PV of W1 is 112.5°. After 15:00, the solar light irradiates the backsheet of W1 and is reflected outside the airport. In addition, from September to April, no glare occurs because of the low φ
sun(t), owing to the tilt of the Earth’s axis (23.5°). This season, most reflected light passes below the FP2, so the pilots are free from SG.
As W1 rotates southward, the time for SG is shifted to the late afternoon (
Figure 5c–h). In the late afternoon, W1 reflects incident light from the west to the pilot moving through FP2, located on its east side. The reflected light interferes with the pilot’s vision near the ground because of the lowered φ
sun(t). Moreover, the azimuth angle between the south-facing W1 and the incident light from the west increases rapidly, resulting in increased intensity of reflected light. As a result, the south-facing W1 obstructs the pilot’s view for a longer time with increased intensity than the east-south-east-facing counterpart. The time corresponding to the impact of the SG is extended from March to October. Due to increased intensity, pilots are under the influence of PAI during sunset. Although pilots under PAI do not immediately cause accidents, airplanes fly with an increased possibility of collision accidents due to the momentary vision loss of pilots and workers. According to the case of ground vehicle studies conducted in Arizona, USA, drivers under the influence of glare have a 5–10% higher accident probability than others [
33]. Considering the annual number of airline flights worldwide (~40 million), the increased possibility of SG from A-PV is not negligible.
In W1 installed in the south-south-west direction (θ
PV = 202.5°), the T
SG decreases compared with the south-facing case, as shown in
Figure 5i,j. Here, the SG only occurs after 18:00, from April to October. Before 18:00, the W1 with a θ
PV of 202.5° reflects incident light from the west outside the airport. In addition, the reflectance is low due to decreased θ
i, resulting in significantly reduced LPAI and PAI compared with the south-facing case. However, at sunset in the summer, the θ
sun(t) exceeds 270° (westward). Thus, the intense solar light with a θ
sun(t) can be transferred to the pilots moving FP2 and R2 in the early evening from May to August.
If we turn W1 further west, pilots on R2 and FP2 will not be affected by SG (not shown in
Figure 5). When W1 faces southwest and west-south-west (θ
PV = 225 and 247.5°), the backsheet of the A-PV scatters the incident light from the east. Due to the diffusive reflection of the backsheet, the incident solar light disperses in random directions with decreased intensity. The result would be similar in the case of bifacial A-PVs because the A-PVs effectively absorb most of the light coming from the east with small θ
i early in the morning. Additionally, the solar light from the south will bounce off to the northwest side of W1 around noon. As no aviation facilities and flight routes are located on the northwest side of W1, the southwest facing W1 does not affect the pilot’s vision. Furthermore, the solar light from the west is not transferred to the airport owing to the reduced θ
i. Consequently, the result shows that the A-PV facing the possible routes and flight paths causes SG, whereas the A-PV facing opposite to the potential route and flight path mitigates R
SG.
3.2. Glare and AER of A-PVs Located at Various Positions
Rotating A-PV in the opposite direction of FPs and routes effectively reduces RSG and can guarantee pilot safety in the case of W1. To validate this approach at other sites, we calculated the TSG at all possible paths and ground routes from six A-PVs: (i) two installed on the west side of the west runway (W1, W2), (ii) another two on the east side of the east runway (E3, E4), and (iii) the last two located in the middle of the taxiway (C1, C2). Possible ground paths of airplanes surround the C1 and C2 A-PVs, whereas the planes move only on one side of the A-PV in the other cases. For a quantitative comparison at each site, the TSG and the sum of LPAI and PAI from them are simulated under various θPV (112.5–247.5°). As the A-PV is supposed to generate electricity, its AER is also considered at each θPV. Here, AER divides the energy generation of A-PV with a specific angle by that of the south-facing case (θPV = 180°) where power generation is maximized.
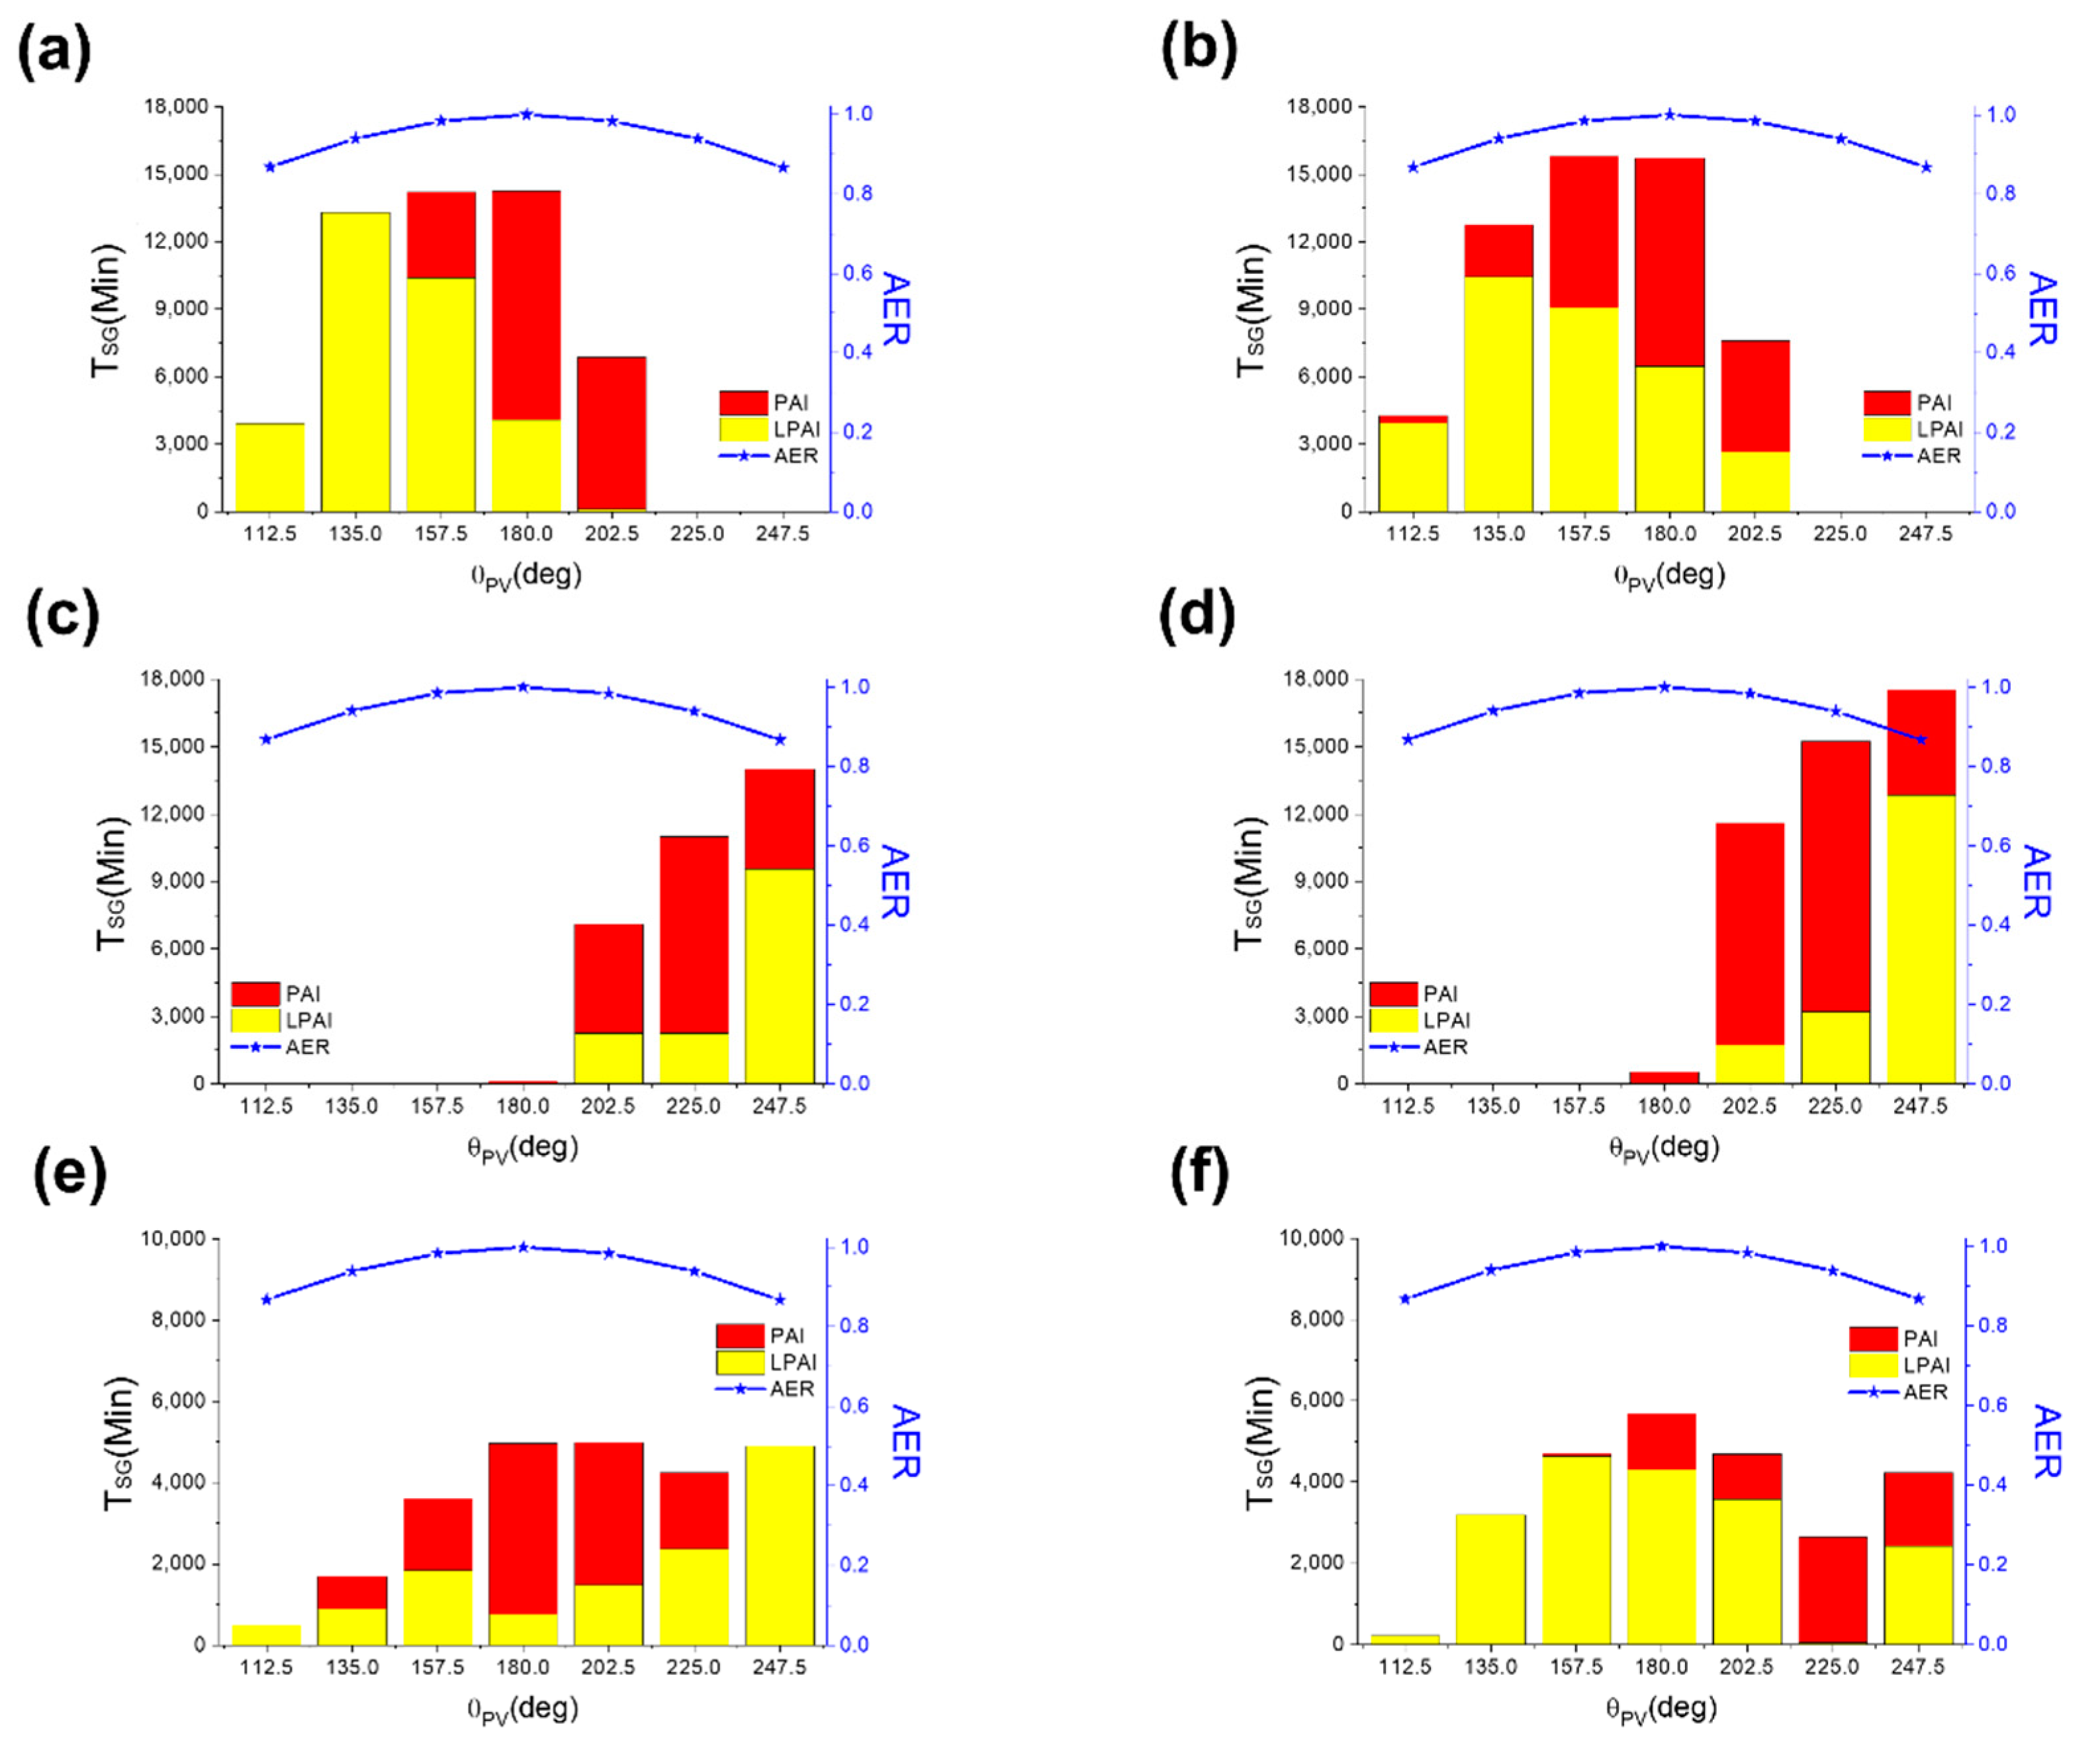
Figure 6 shows the calculated T
SG and AER of A-PVs depending on the θ
PV. The results are summarized in
Table 1. For the case of W1 and W2, their T
SG is extended as θ
PV increases from 112.5° (facing east-south-east) to 180° (south). Solar light from the east is reflected outside the FPs and routes in the morning, whereas the A-PV sends incident solar light from the south and southwest to the FPs and routes with strong intensity in the afternoon. As a result, T
SG increases, and PAI becomes predominant at the A-PV facing south in the afternoon. For example, when θ
PV of W1 and W2 is 112.5°, the T
SG is approximately 4000 min. It gradually increases as W1 and W2 rotate to the south. Finally, the T
SG is over 10,000 min when they face south (θ
PV = 180°). Furthermore, the annual PAI time increases from 0 (θ
PV = 112.5°) to 10,153 min (θ
PV = 180°), consistent with the results for W1 (please see
Figure 6a). Here, the slight difference in T
SG and intensity of glare between the two A-PVs is attributed to the different altitudes of planes at ground routes and FPs. W1 mainly affects pilots in FP2, who are located at a higher altitude than ground routes (R1). On the other hand, the T
SG decreases as W1 and W2 face westward, opposite possible routes. As the southwest-facing W1 and W2 (θ
PV of 225 and 247.5°) mirrors incident light from the south and west to the outside airports, they are glare-free. In the point of AER, increased energy generation of southwest facing W1 and W2 in the afternoon can compensate for their energy loss in the early morning. The AER slightly declines to 0.94 and 0.87 in the cases of θ
PV of 225 and 247.5°, respectively. However, the significantly reduced R
SG of southwest-facing W1 and W2 outweighs the slight energy losses. This result also implies that rearrangement of the A-PV orientation, facing opposite to the possible aircraft routes, leads to reduced R
SG of A-PVs with a small sacrifice of energy generation.
The proposed method is also valid for A-PVs located east of airports. Similar to W1 and W2, E3 and E4, facing opposite routes and FPs, are glare-free (
Figure 6c,d). Their glare becomes negligible as the θ
PV of E3 and E4 turns east from the south. Light from the south and southwest with large θ
i is transferred outside the airport at the southeast-facing E3 and E4. Moreover, light from the west is not a source of SG because the backsheet of A-PV scatters incident light. Thus, it is possible to demonstrate glare-free E3 and E4 with a small sacrifice of energy loss (only 2%) when θ
PV is 157.5°. In contrast, the southwest-facing E3 and E4 creates glare for pilots by bouncing off the incident light from the south and southeast to the routes and FPs in the morning. In the worst case, where θ
PV is 247.5°, the T
SG exceeds 15,000 min. Here, the angles of R1 and R2 are slightly different; thus, the trends of A-PV located east (E1, E2) and west (W1, W2) are not exactly symmetric. Despite a minor change in T
SG in E1 and E2, the result indicates that modifying the θ
PV of A-PV to opposite possible aircraft routes is a practical approach to reducing the R
SG in both cases.
Meanwhile, it is recommended not to install A-PVs inside possible taxiways. Regardless of θ
PV, C1 and C2 trigger glare in either direction, as shown in
Figure 6e,f. When C1 and C2 face westward, they reflect the incident solar light from east to the R1 in the morning. Conversely, when C1 and C2 face eastward, they also cause SG and affect the pilots moving at FP3, FP4, and R2 located on the east side in the afternoon. This implies that A-PVs installed inside the taxiway reflects incident light in its facing direction and causes SG because it always faces flight paths and routes, independent of its θ
PV. Moreover, installing an A-PV on the roof of a concourse is not recommended because it is usually located in the middle of taxiways.
3.4. Glare and AER of A-PVs with Optimized θPV in the ICN
All candidate sites studied in
Section 3.3 would not be recommended for installation of A-PVs due to the glare when θ
PV is 180° (which maximizes energy generation). However, optimizing θ
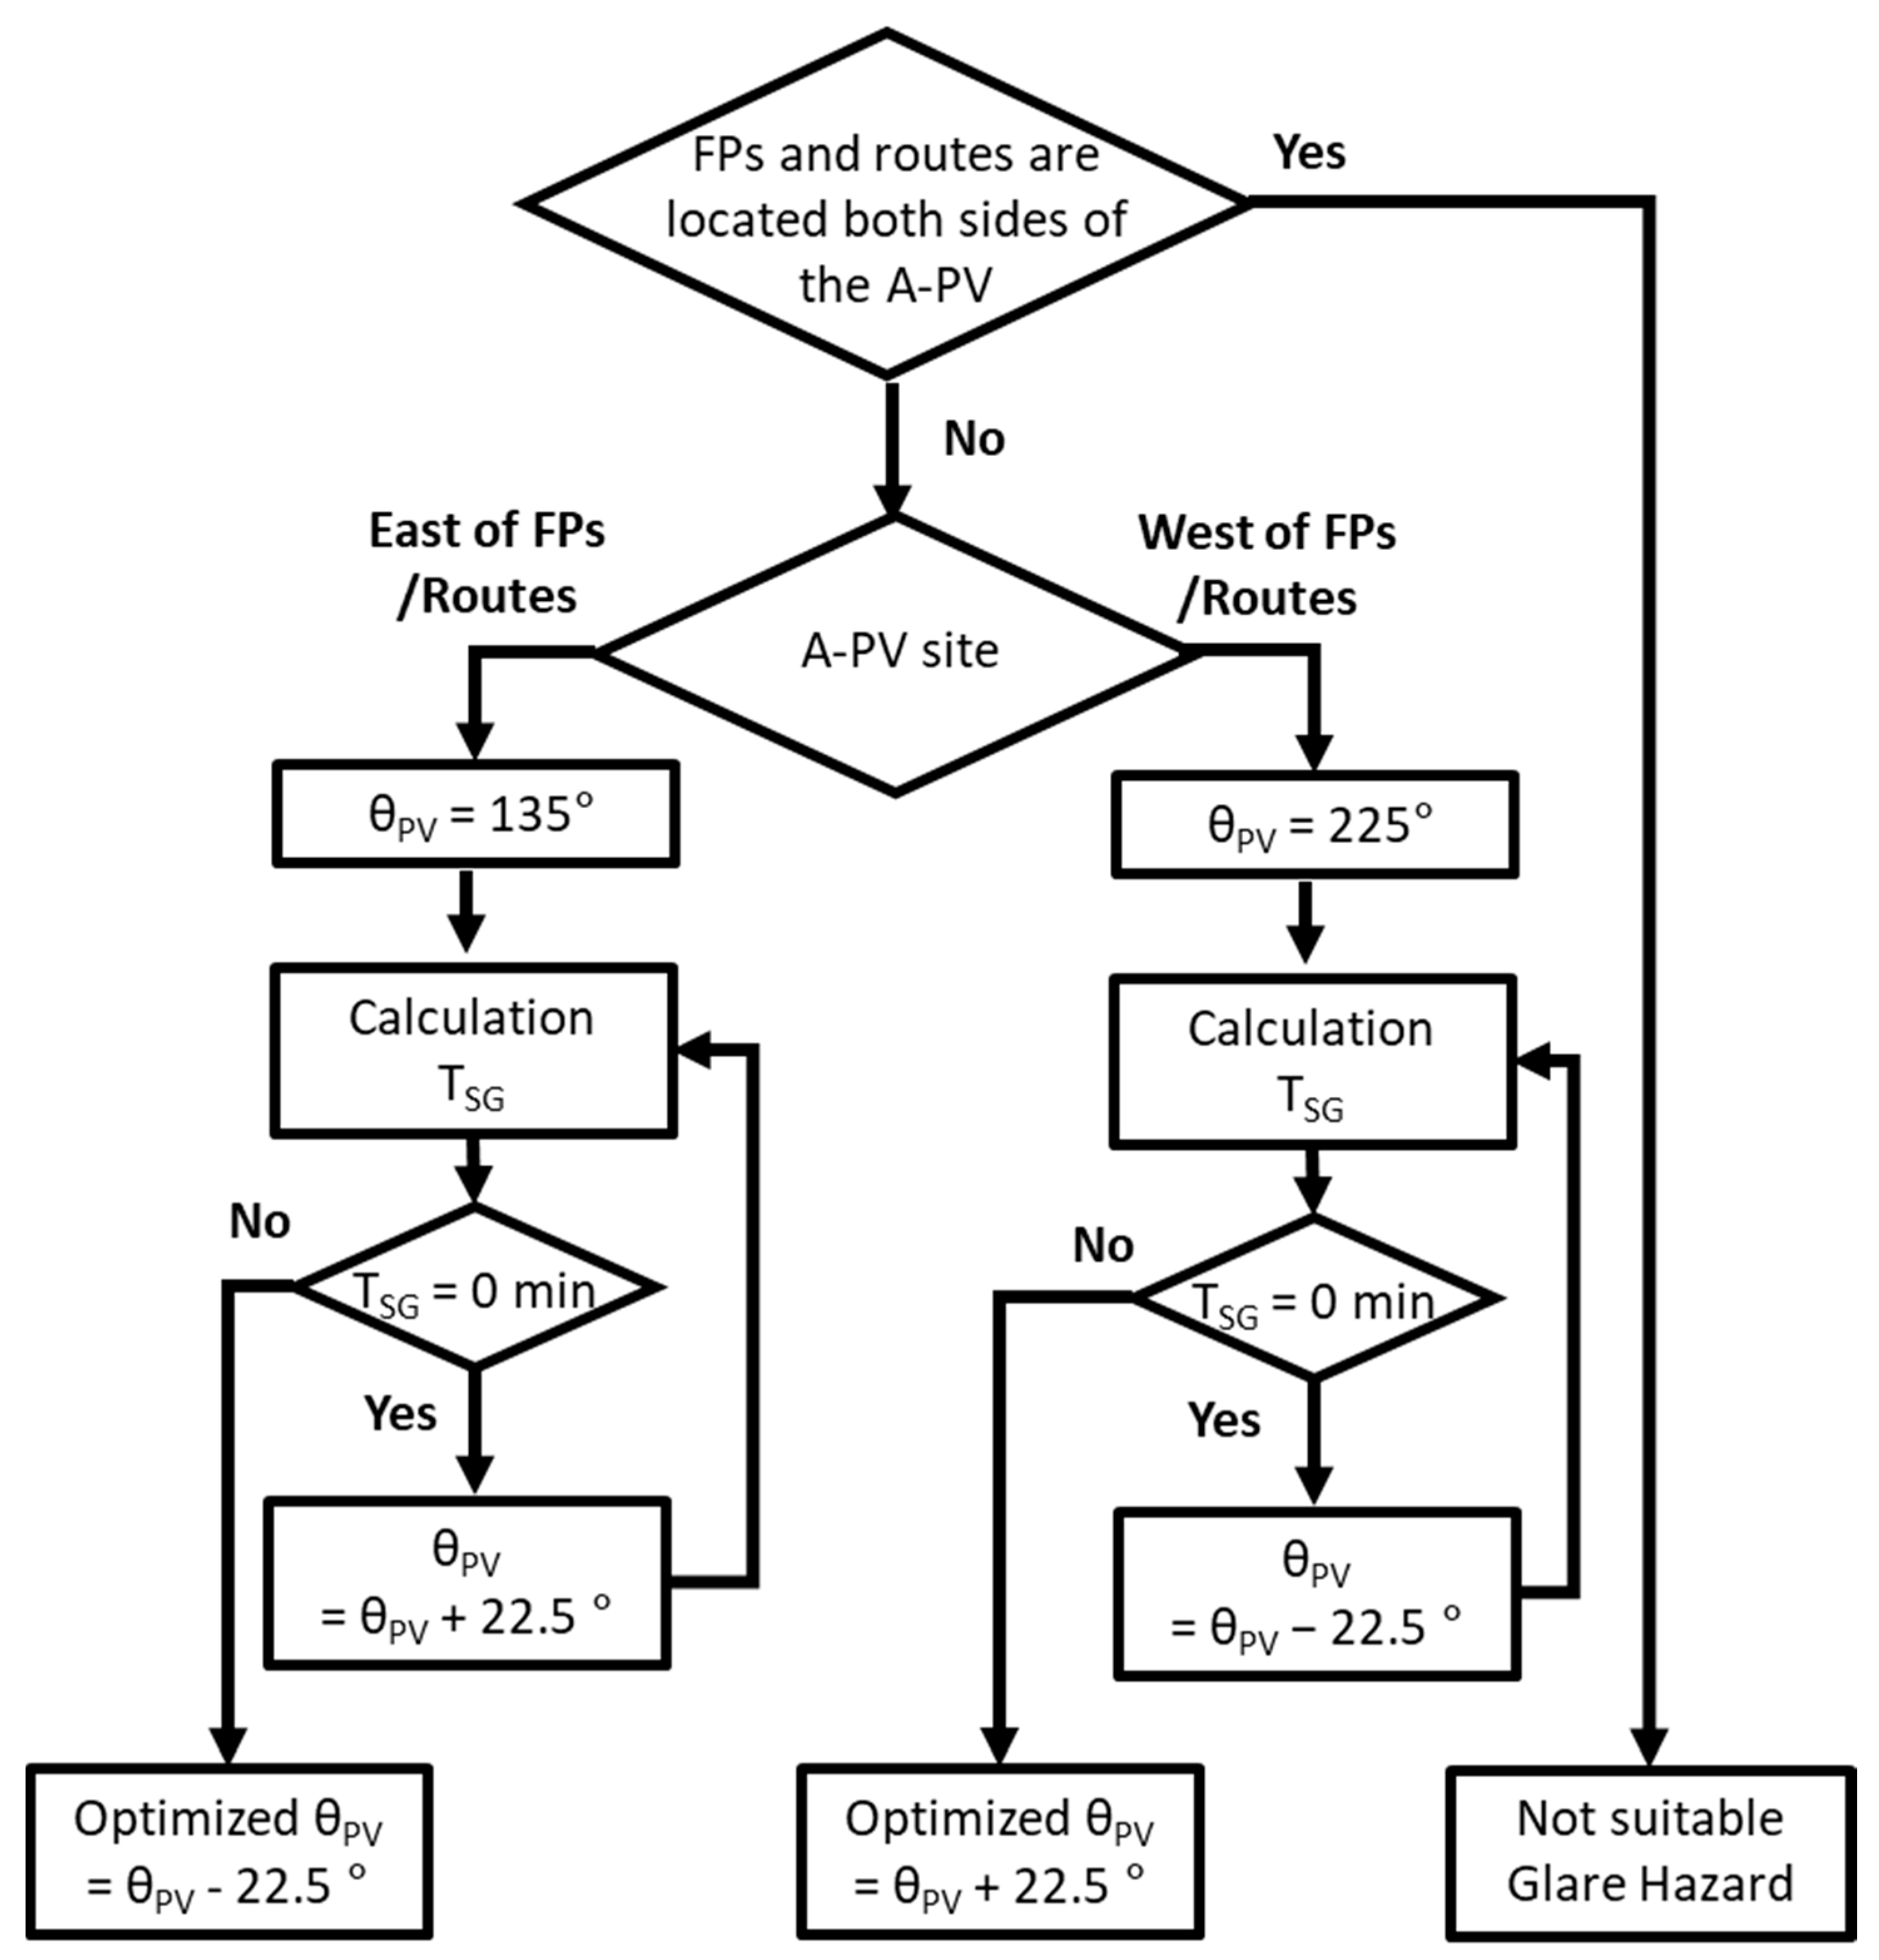
PV enables us to increase the number of possible sites for A-PV. According to the proposed method for optimizing the θ
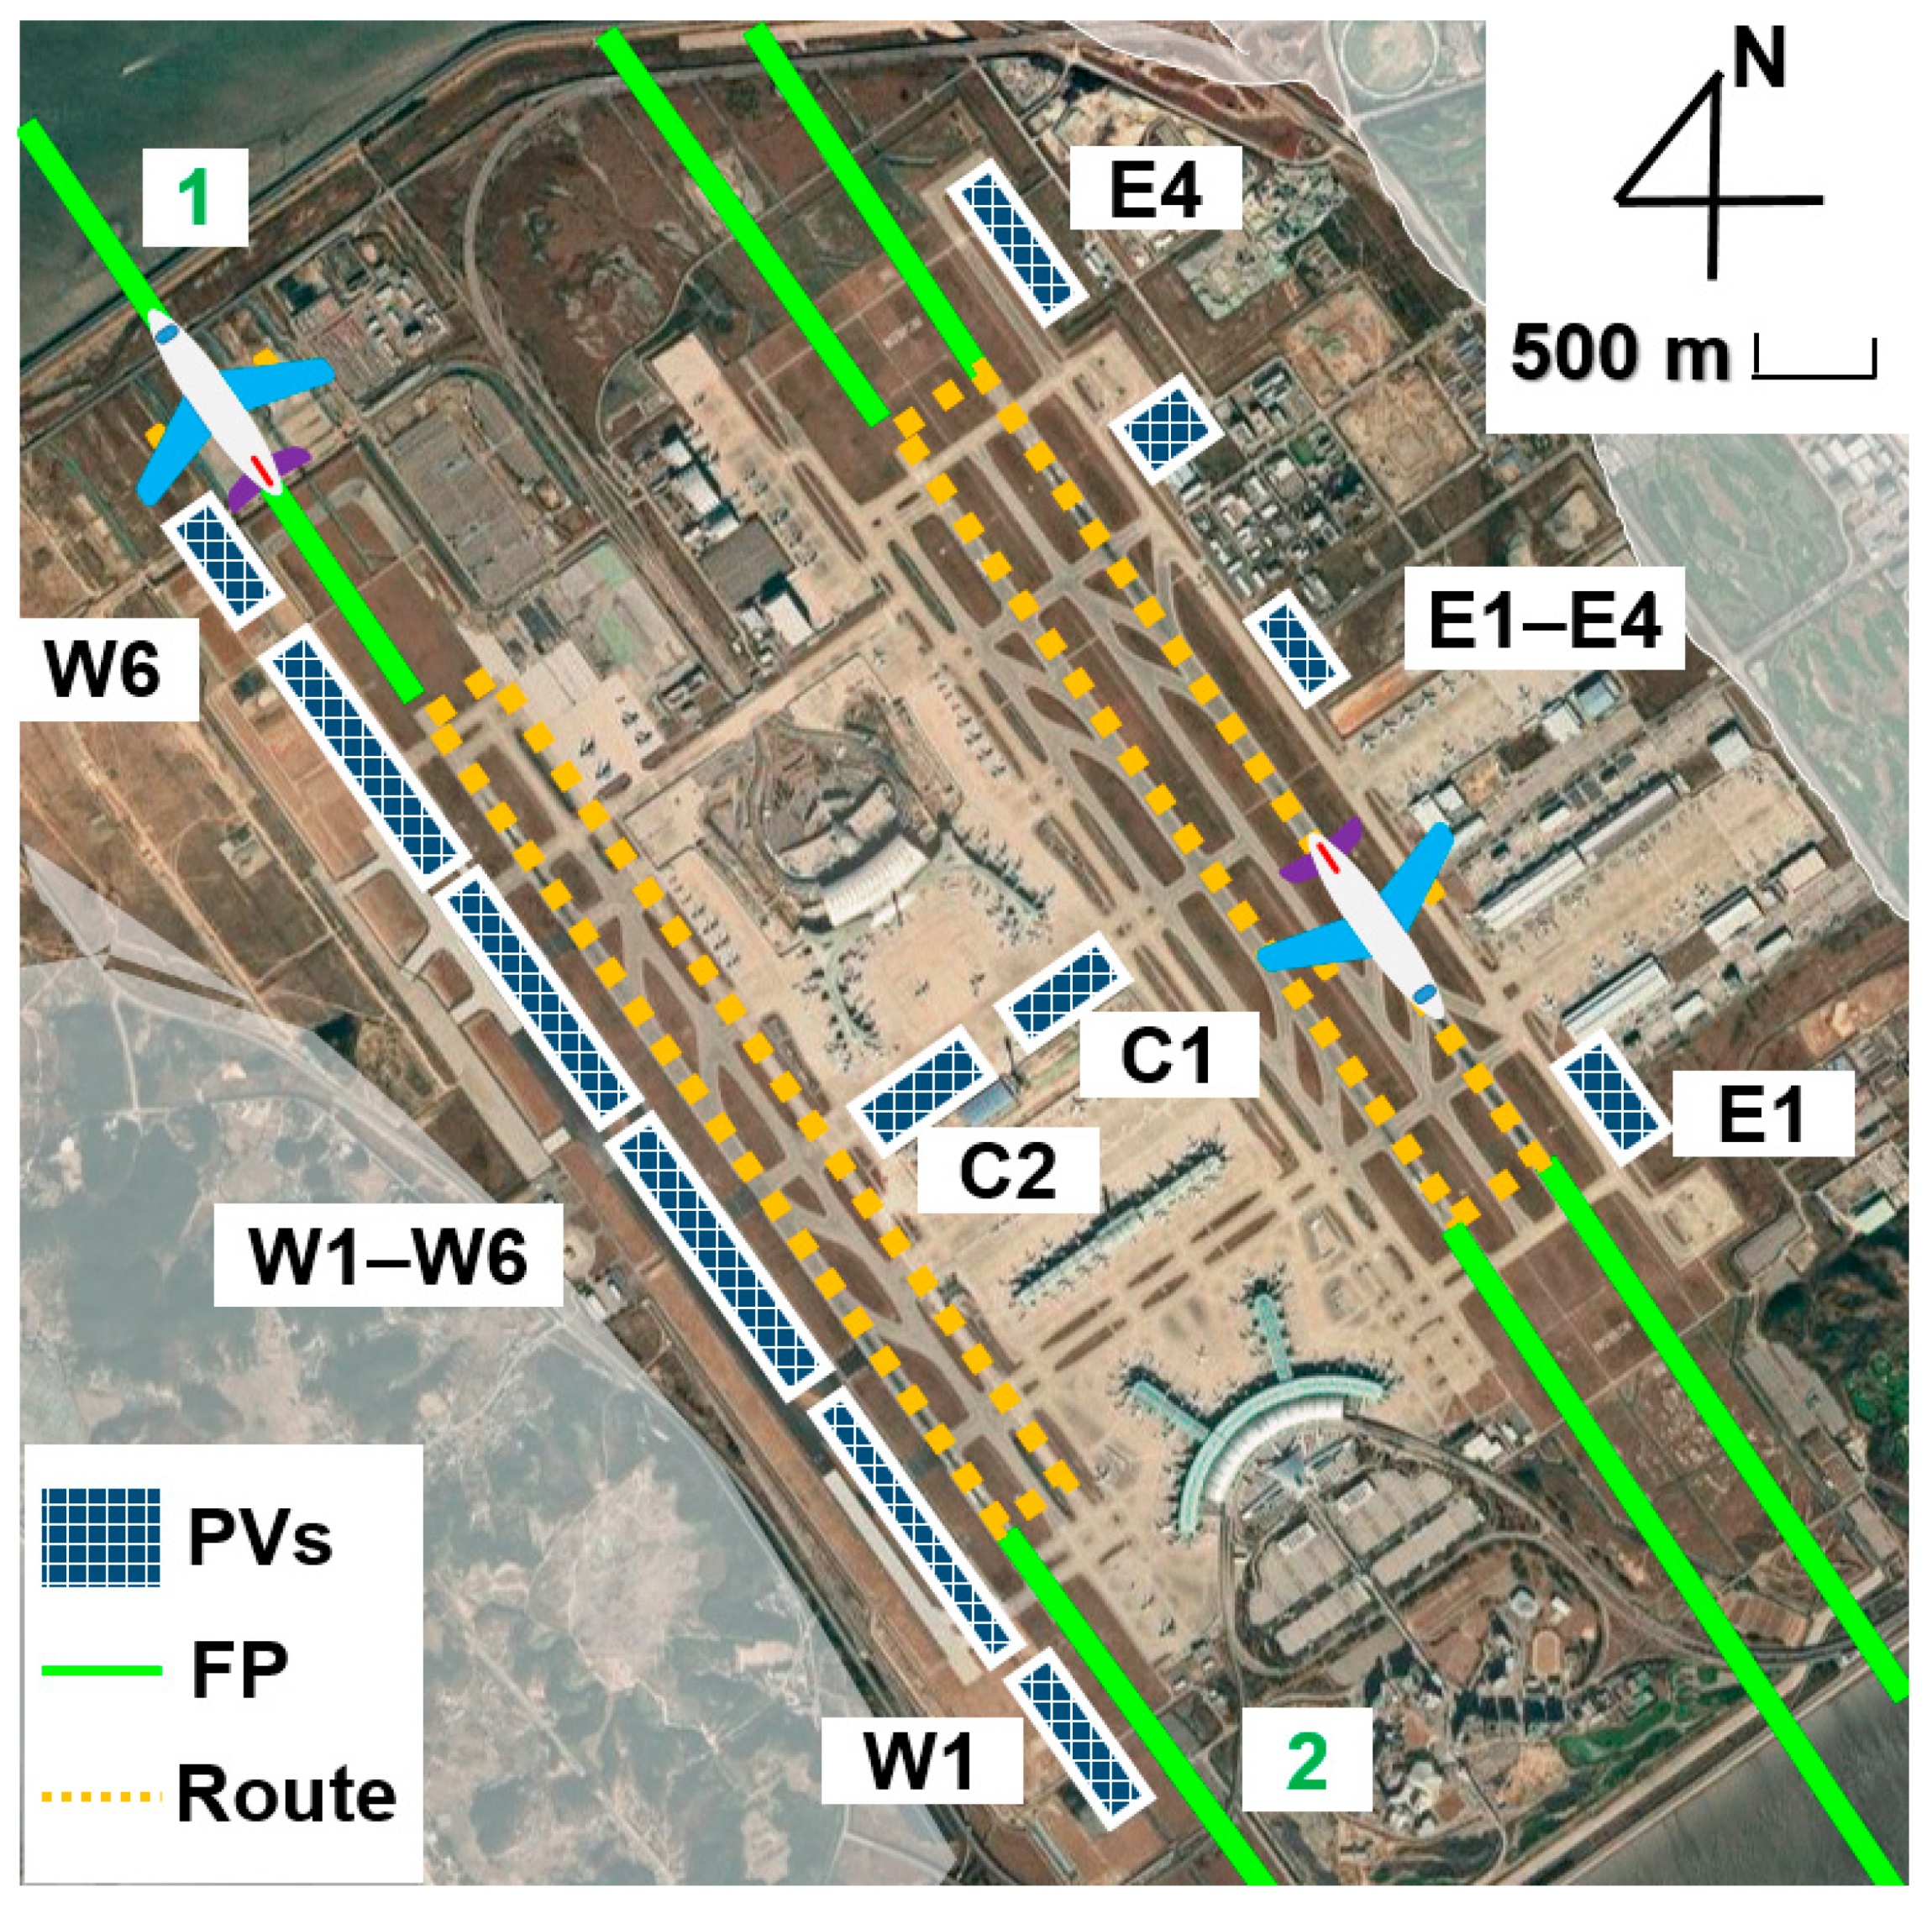
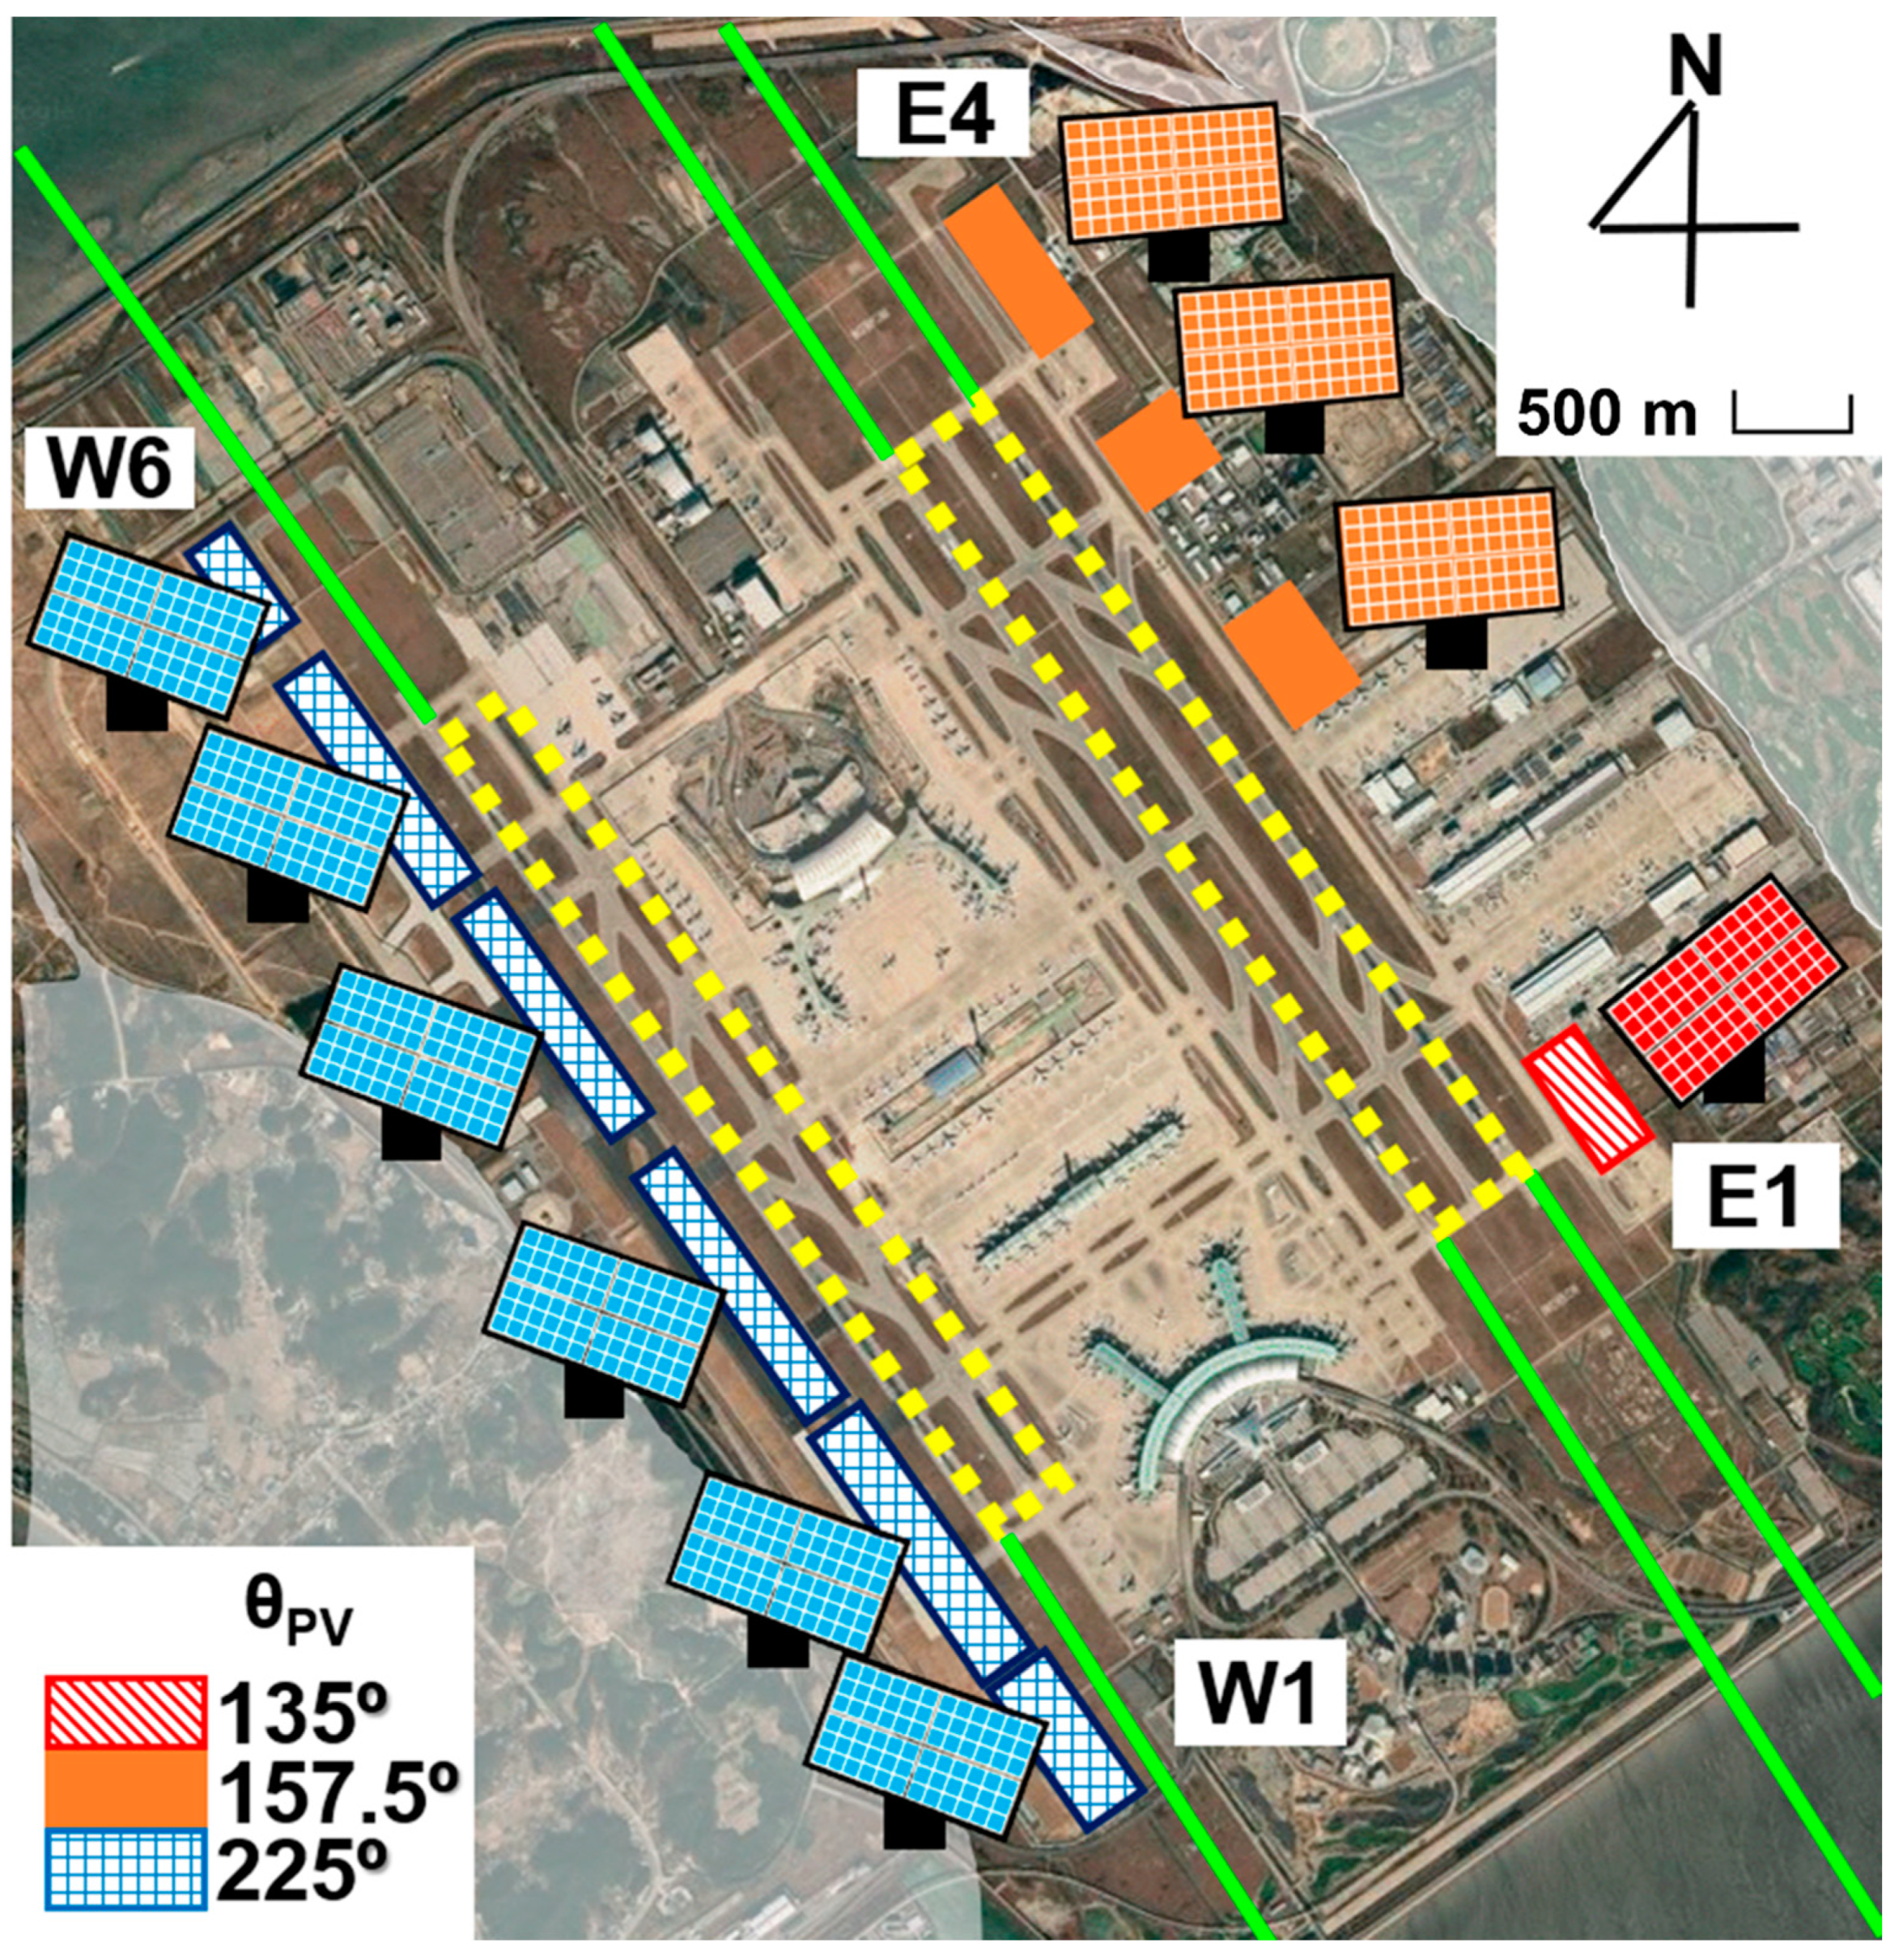
PV, we designed A-PVs for ICN, as shown in
Figure 8. Then, we calculated the minimum required steps to optimize θ
PV using our proposed method and for methods starting with A-PVs facing south, respectively. In the cases of W1–W6, located on the west side of FP1,2 and route 1, the optimized θ
PV was 225°. Similarly, all A-PVs located rightmost of the east route (E1–E4) did not cause any SG when their θ
PV were 135–157.5°. A-PVs situated in the middle of the taxiway (C1, C2) were excluded because they experienced SGs regardless of θ
PV. Our suggested procedure for optimizing θ
PV could save time and effort compared with the current method of starting from the south-facing A-PV, as summarized in
Table 2. For example, in the cases of W1–W6, we only needed to simulate twice (θ
PV of 225 and 202.5°) following the suggested method. On the other hand, an additional calculation (θ
PV of 180, 202.5, and 225°) would be required if someone started the analysis at θ
PV of 180°. Similarly, the proposed model allows us to decrease the steps for deriving the optimized θ
PV in the case of E1, compared with starting the calculation from the south-facing A-PV. Moreover, this method would be more effective in the cases of C1 and C2 by eliminating useless calculations of their T
SG and AER. As a result, it is possible to save steps in optimizing θ
PV from 41 to 23. The effect of the proposed model to reduce the number of steps will become more significant, as more sites are considered for A-PVs.
To comprehensively evaluate energy sacrifice for realizing glare-free conditions at ICN, we compared AER and T
SG of possible A-PVs with optimized θ
PV (GF) with south-facing cases for maximizing energy generation (E
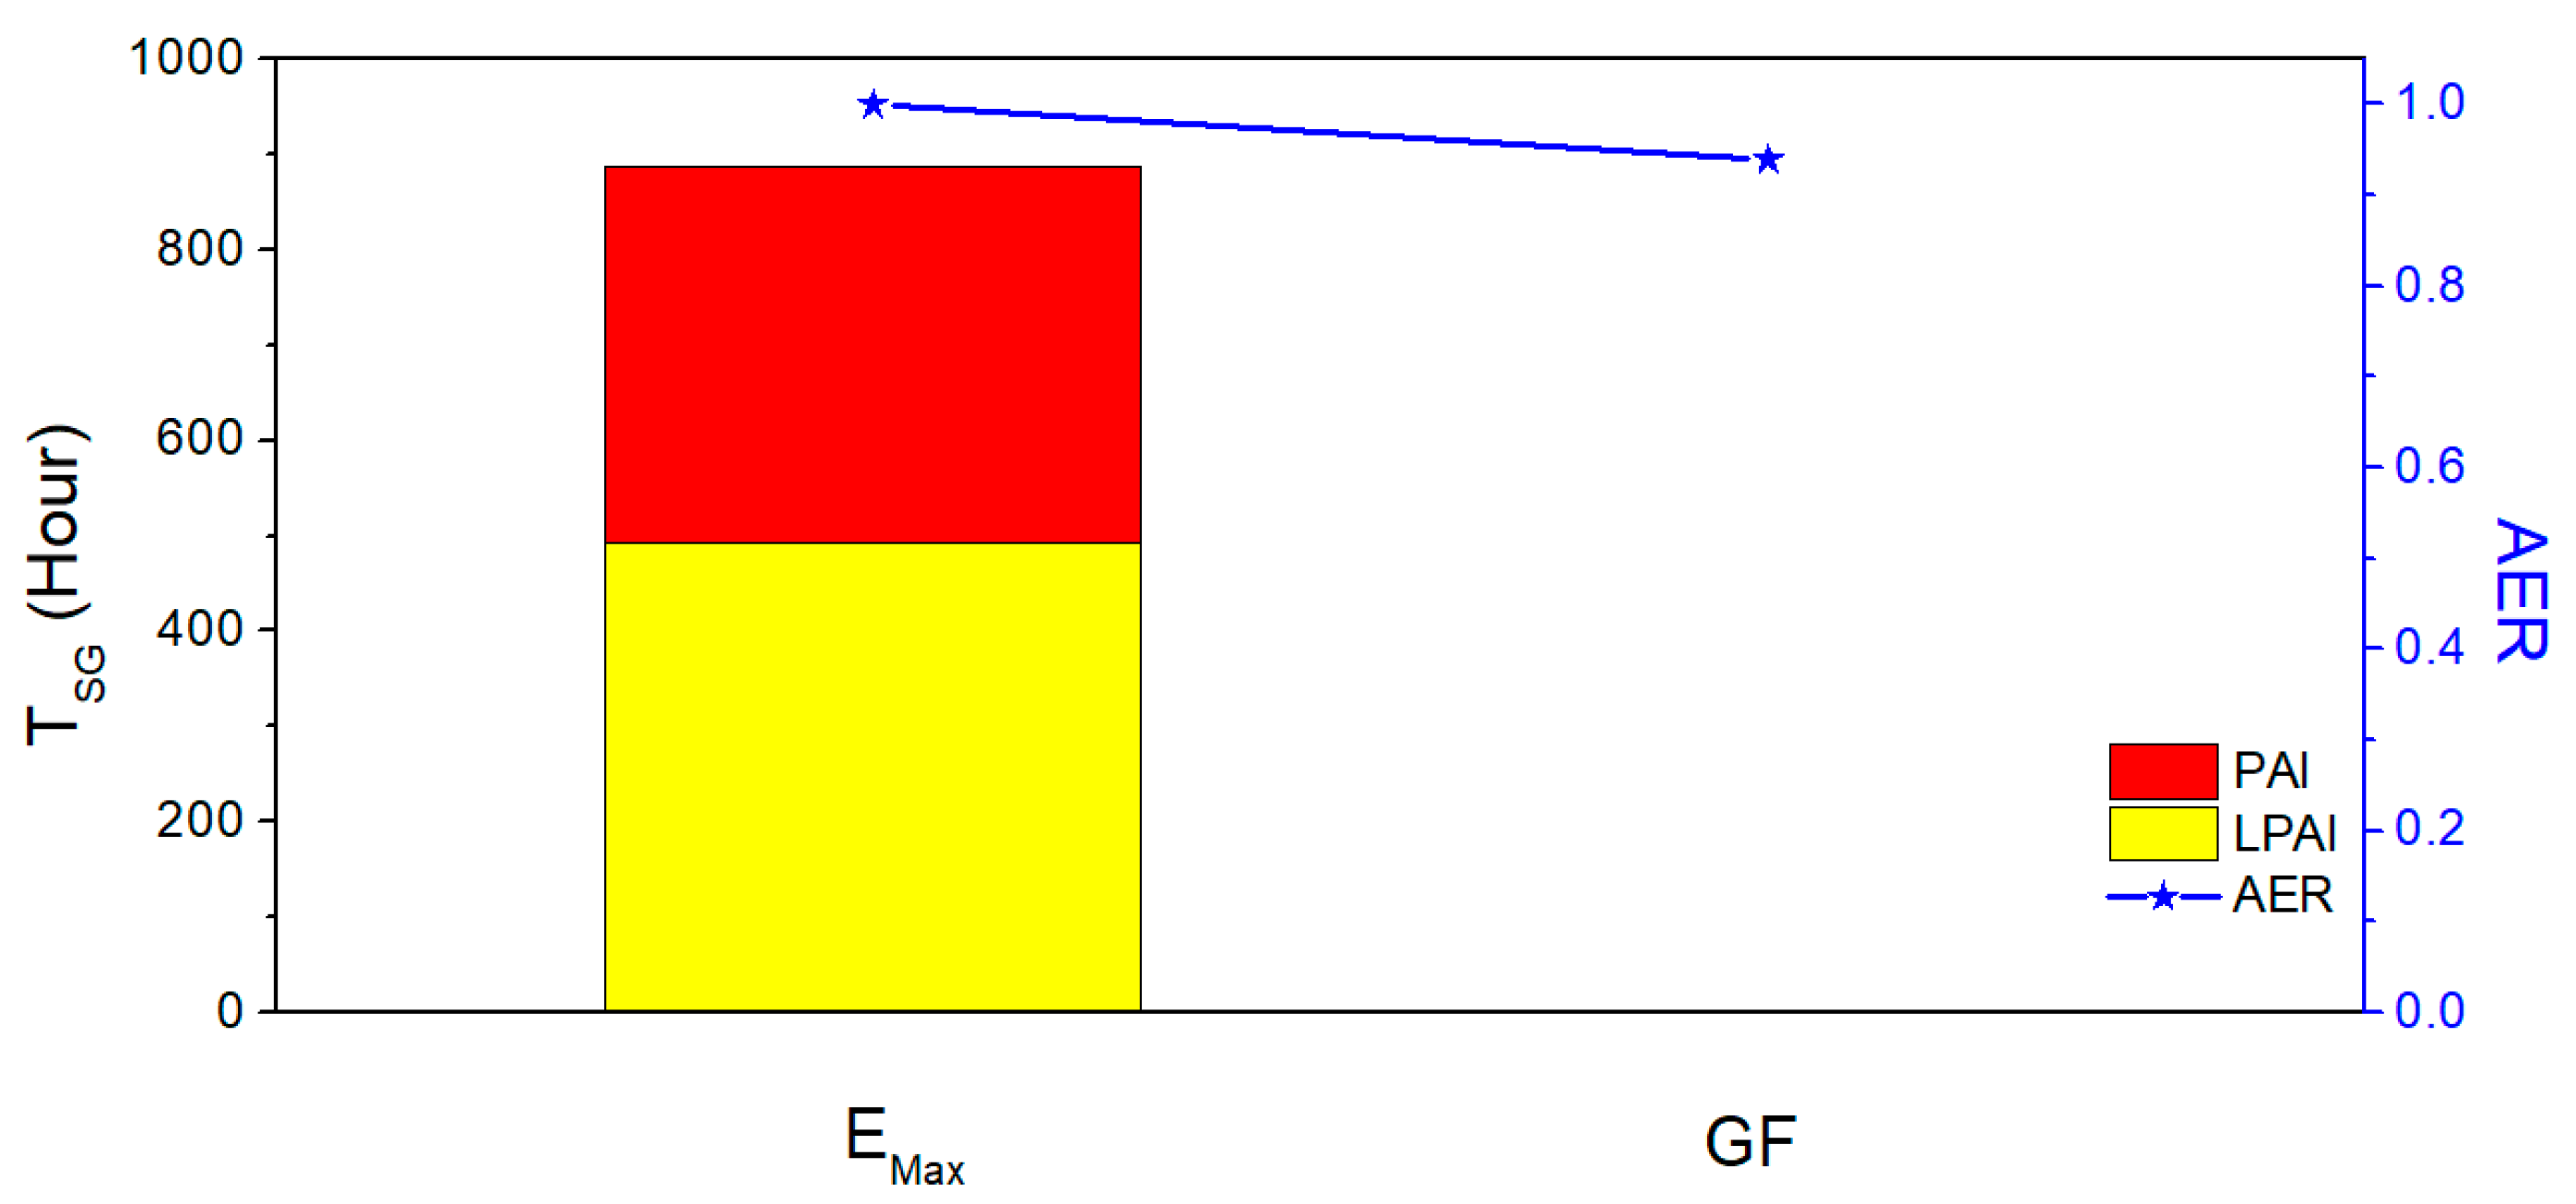
Max). As glare from C1 and C2 was unavoidable independent of their angle, they were excluded from AER calculations. With only 4.8% of AER sacrifice, the optimized A-PVs successfully generated electricity (
Figure 9). Energy loss was mainly attributed to the decreased energy generation of GF cases at noon when the intensity of the incident light is maximized. However, the safety advantage of optimized A-PVs is huge enough to compensate for their energy loss. T
SG from all A-PVs declined from 886 (E
Max) to 0 h (GF). Despite unavoidable energy losses for the GF, the modification of the θ
PV allows us to utilize solar energy safely in the case of ICN.
3.5. Verification of Proposed A-PV Azimuth Angle Optimization Method
We verified the proposed method for optimizing θ
PV of A-PV at four other airports: Gimpo (GMP, Seoul, Korea), Gwangju (KWJ, Gwangju, Korea), Beijing capital (PEK, Beijing, China), and Narita (NRT, Chiba, Japan). These four airports are situated in the northern hemisphere with a latitude of 35–40 degrees.
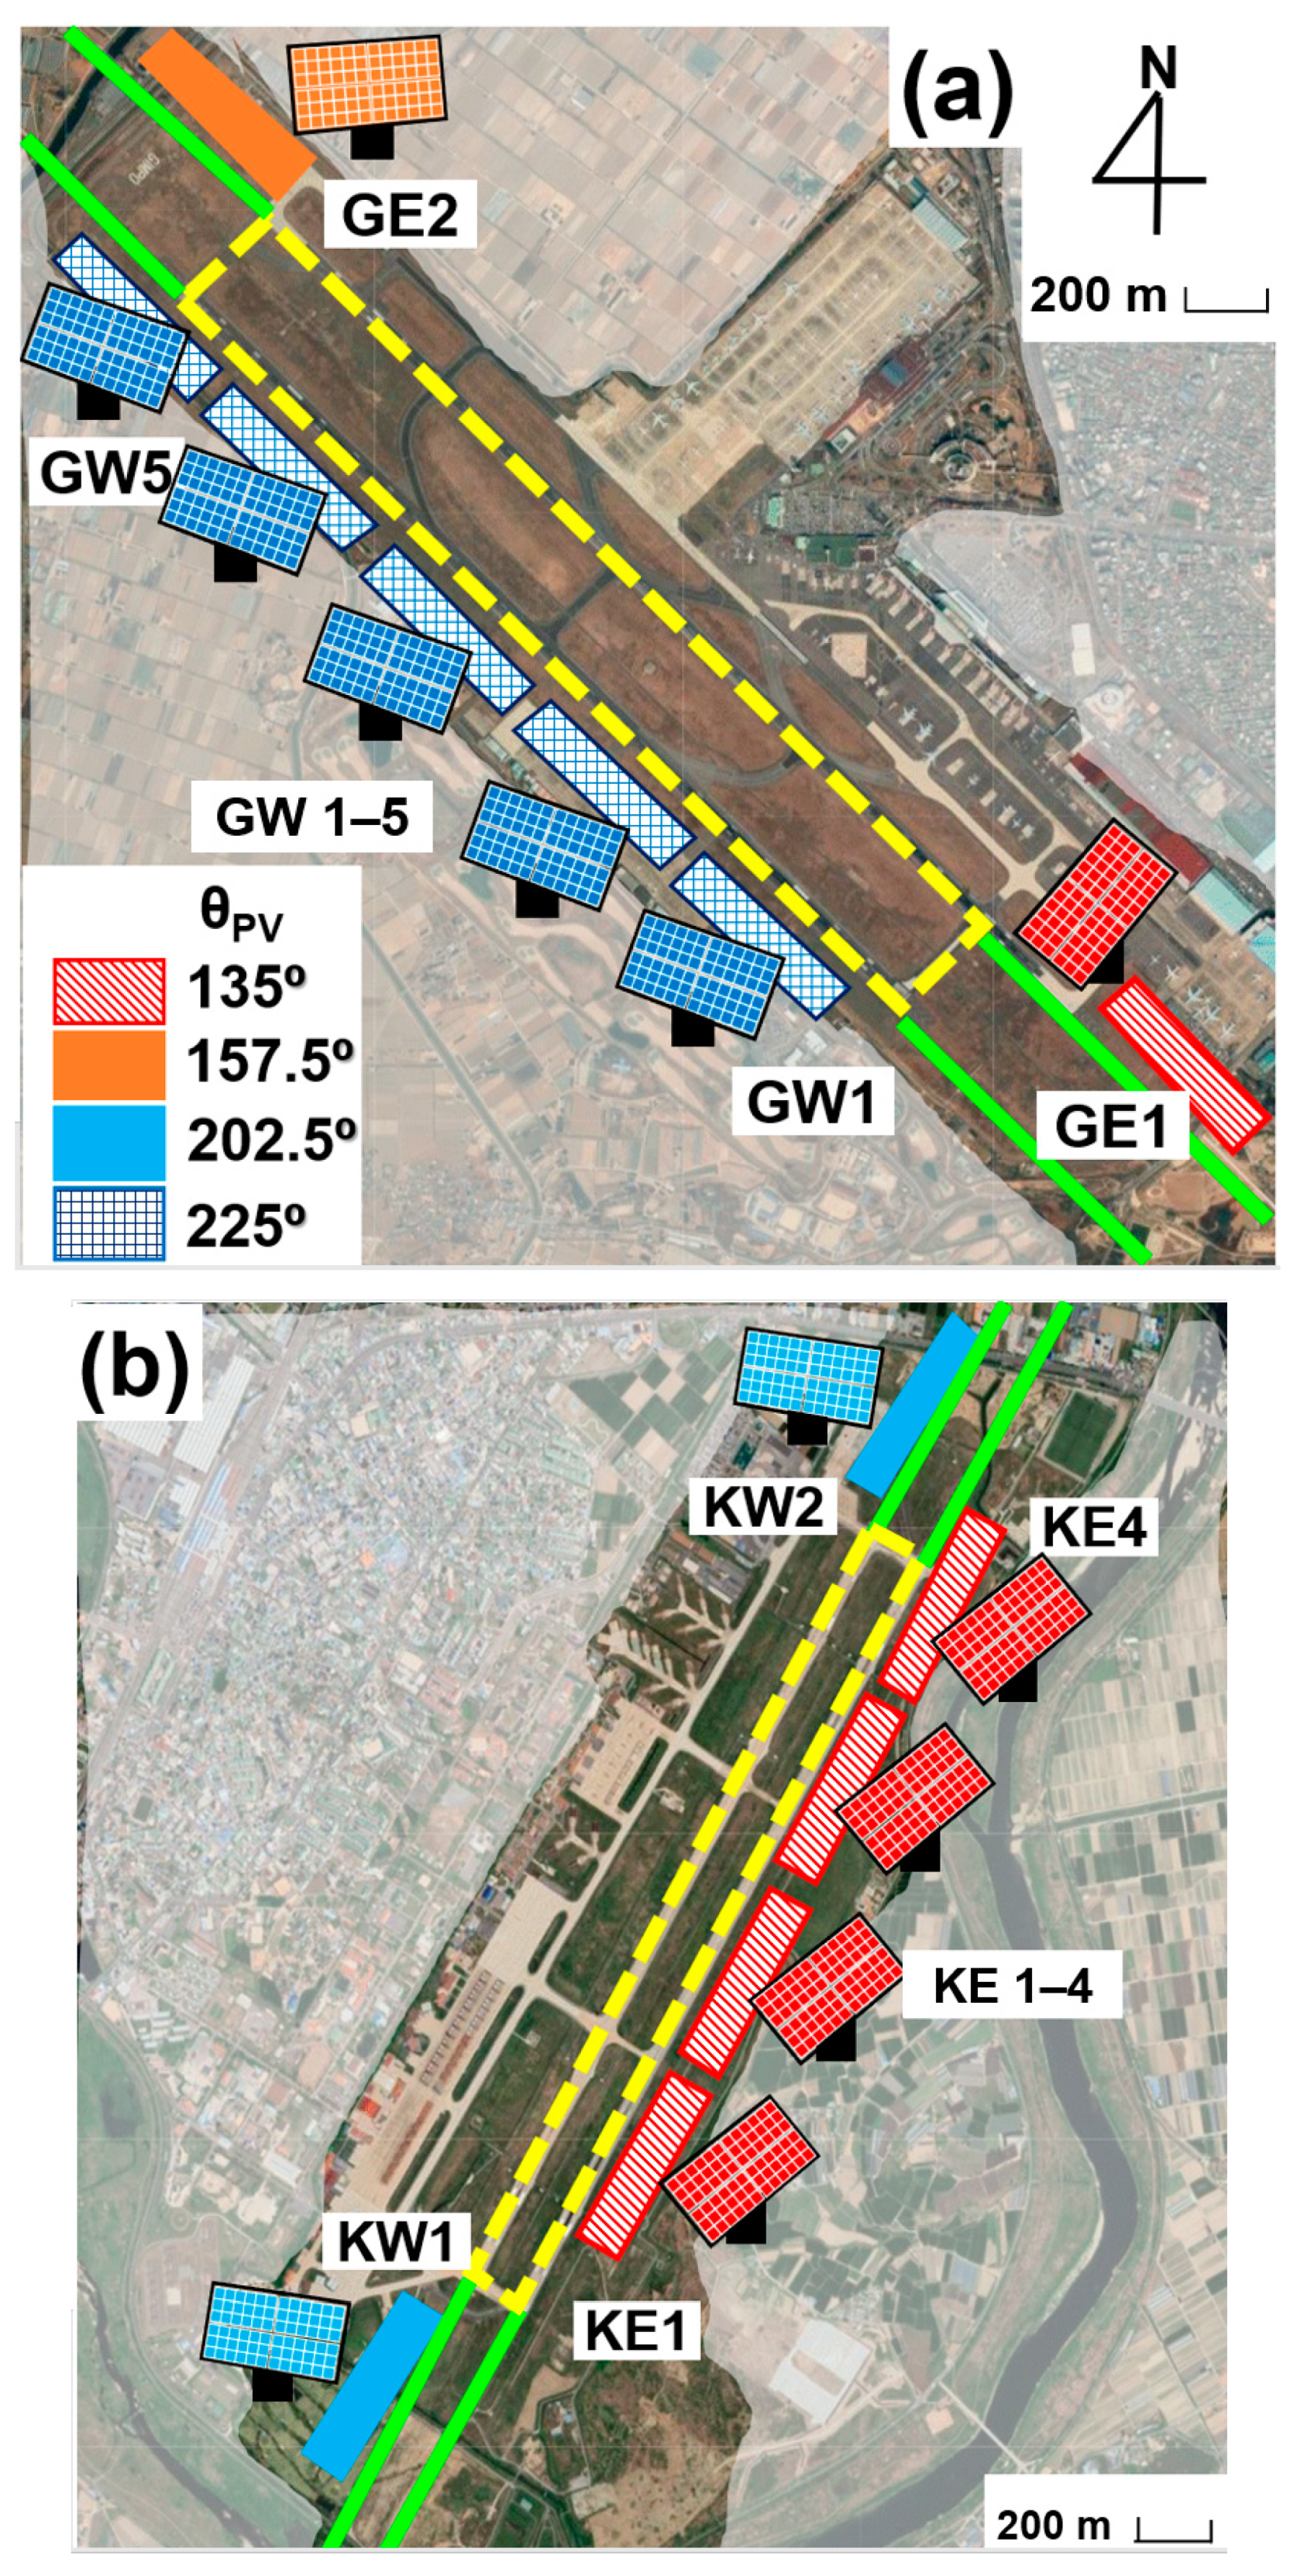
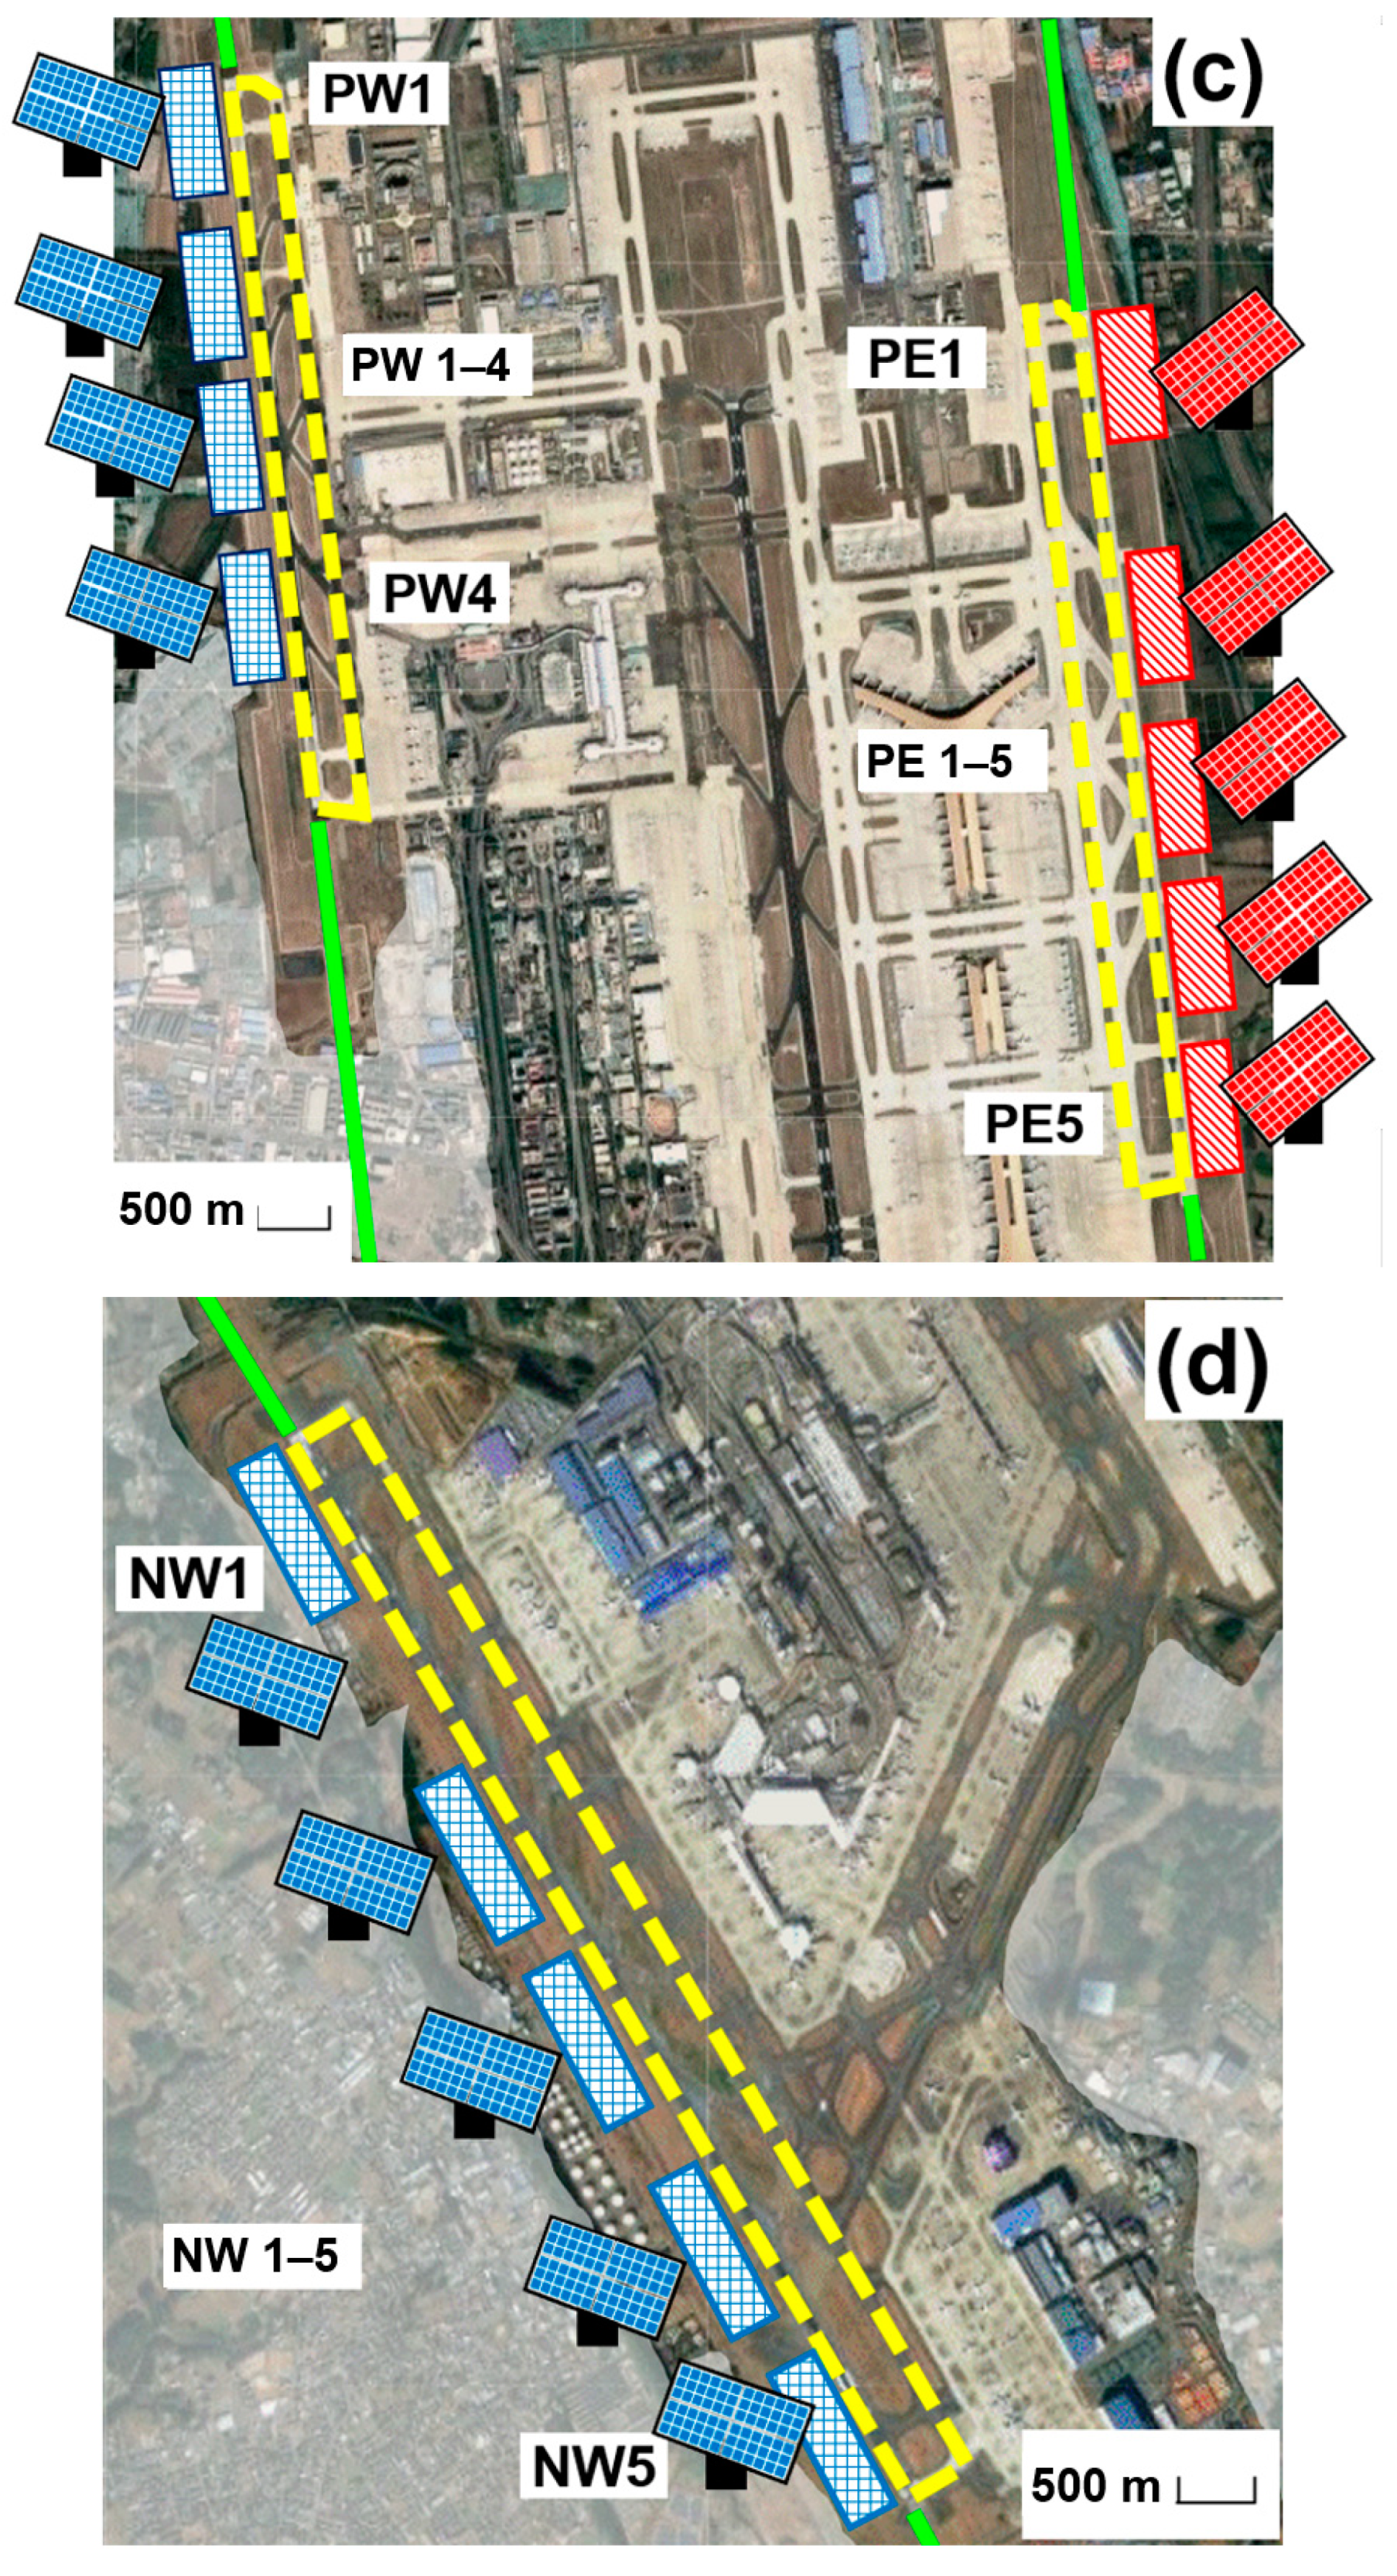
Figure 10 is a satellite map with optimized A-PV for the four airports. For the simulation, we assumed that A-PVs were deployed in the west and east of their possible flight paths. Here, the simulation conditions for the four cases, including tilt of A-PV, weather, flight speed, and position during landing and take-off, are precisely the same as those of ICN. All sites were not suitable for A-PVs with θ
PV of 180°. Throughout the suggested procedure for optimizing θ
PV, it was possible to extend installation sites for A-PV without glare issues. The AER and T
SG of A-PVs with optimized glare-free conditions (GF) are compared with those of A-PVs facing the true south (E
Max), as shown in
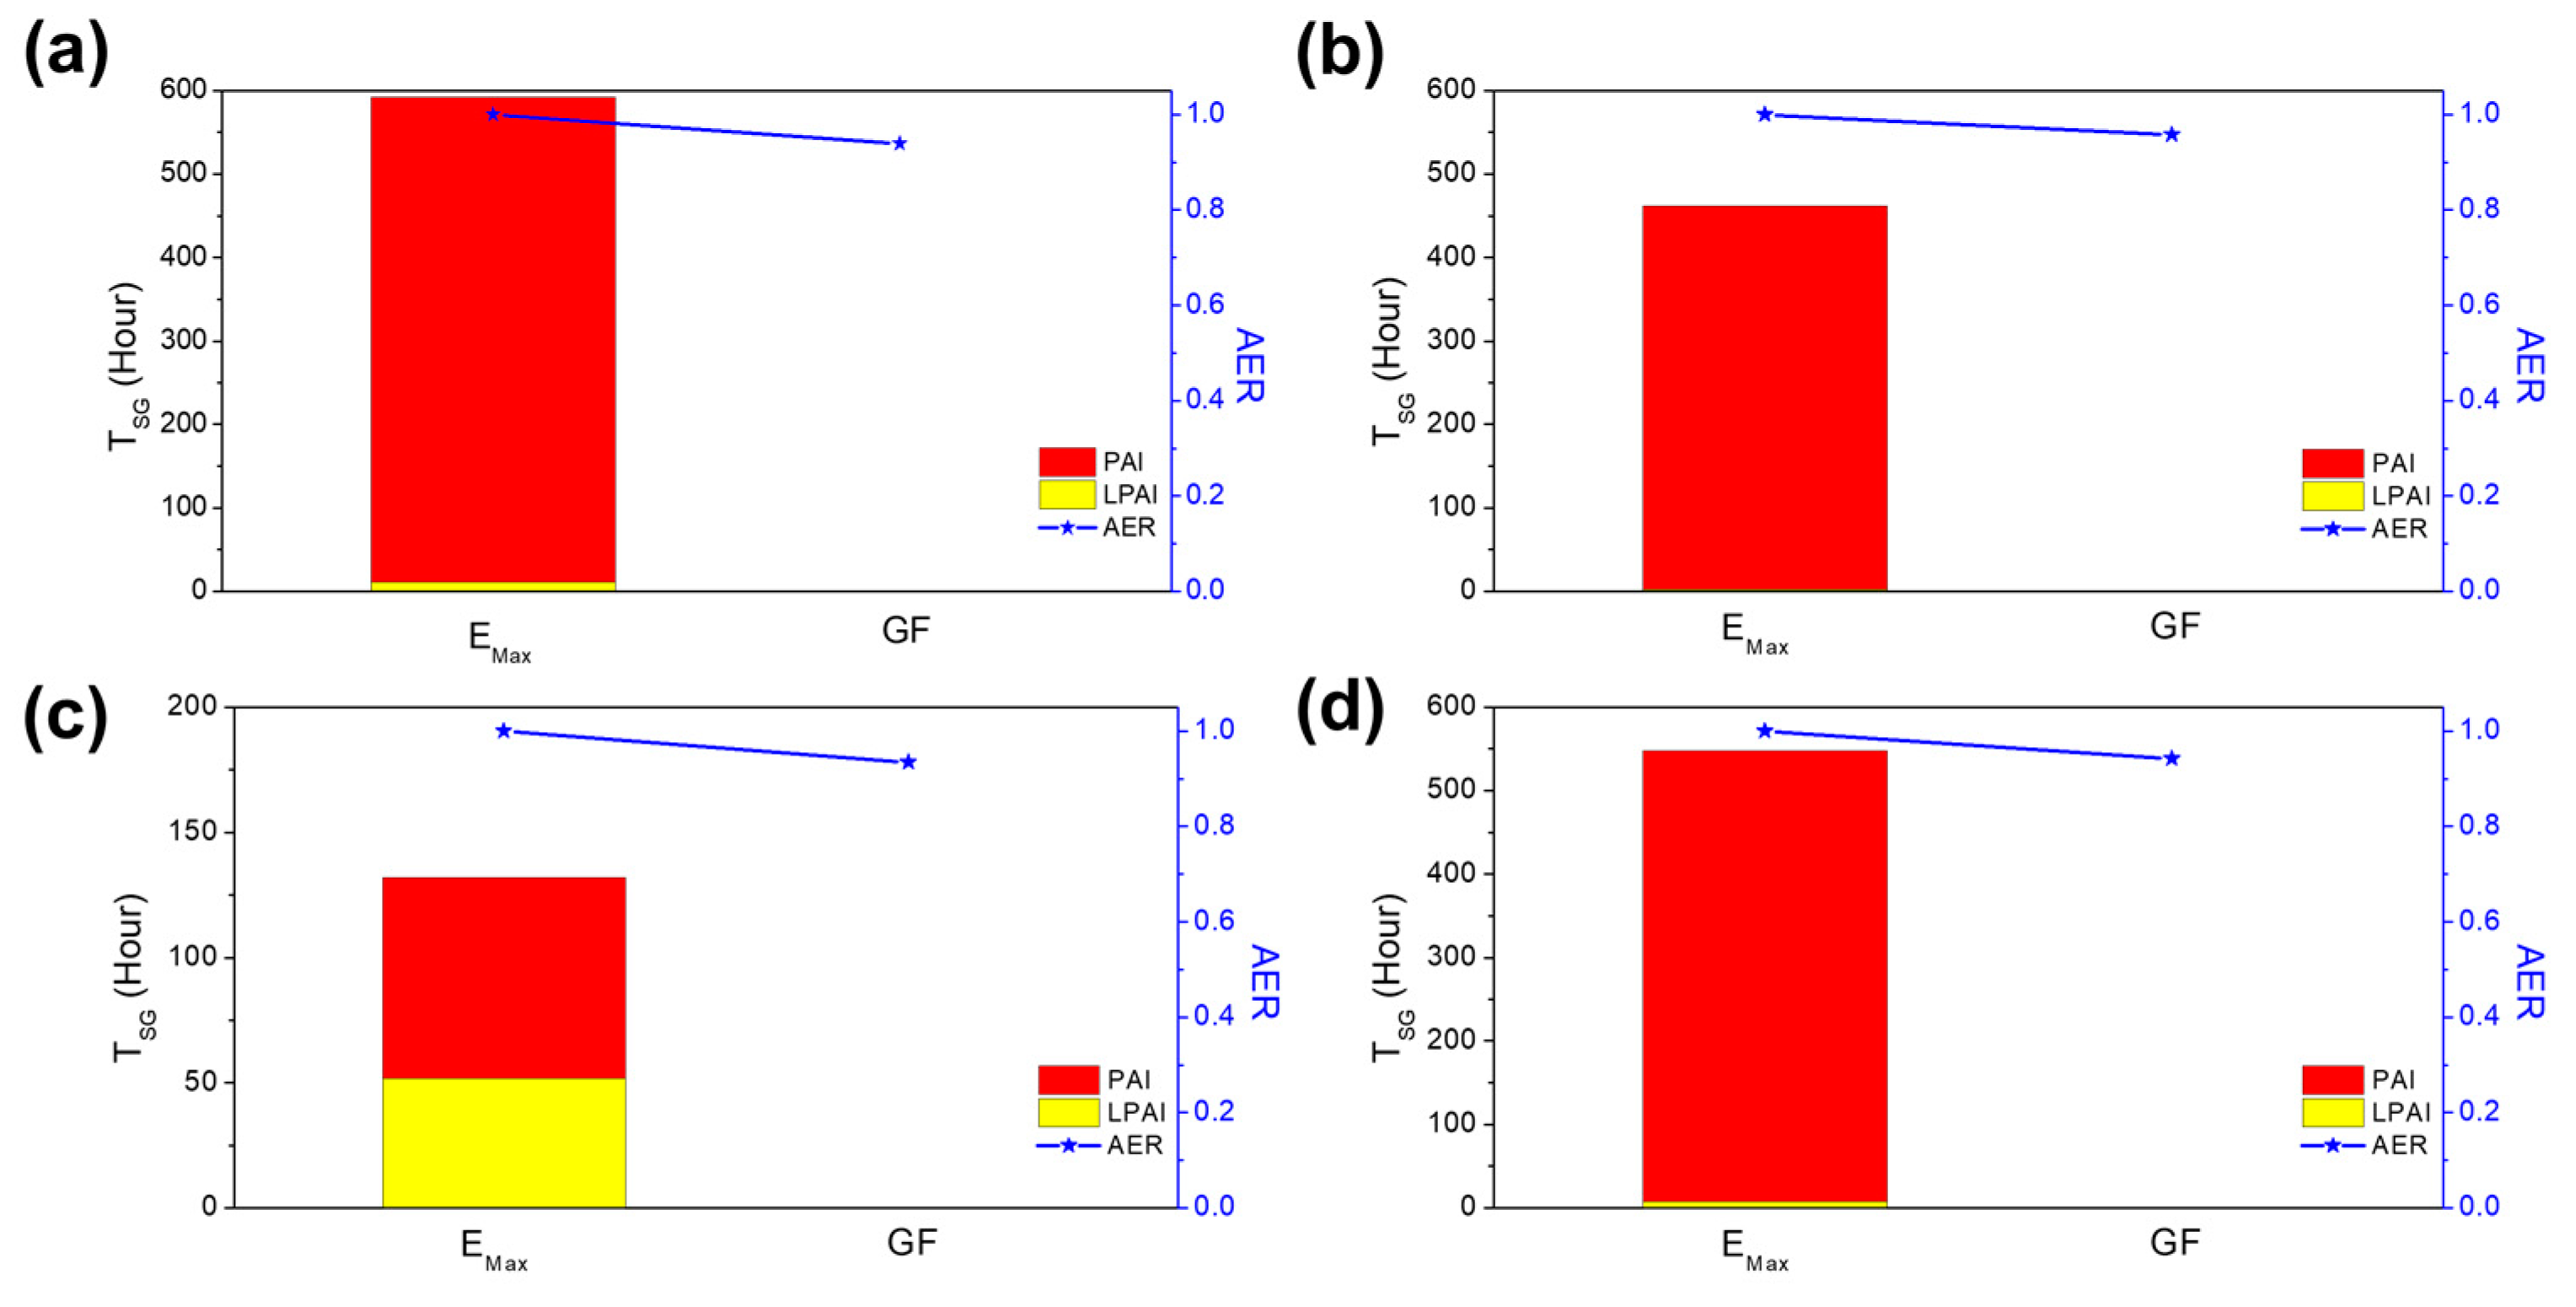
Figure 11 and summarized in
Table 3.
There were seven possible A-PV sites at GMP, with a runway angle of 140°. Two potential locations for A-PVs (GE1 and GE2) were on the runway’s east side, whereas the other five sites, GW1–5, were on its west side. Detailed T
SG induced by A-PVs with various θ
PV is shown in
Figure S1. Consistent with the ICN case, E1 and E2 exhibited reduced T
SG when they turned east (θ
PV = 112.5–135°) by absorbing most of the incident sunlight from the east early in the morning. However, if they faced the south and southwest, solar light with a large θ
i would affect pilots on the routes and flight paths. In contrast, GW1–GW5 with θ
PV of 225° did not disturb the pilots’ vision at GMP. Thus, the optimized θ
PV of GW1–GW5 was 225°, whereas that of GE1 and GE2 were 135 and 157.5°, respectively. The differences in optimized θ
PV between GE1 and GE2 originated from different altitudes of flights near GE1 and GE2. Despite reduced R
SG, the attainable energy under GF was 94.6% of A-PVs facing the true south. Moreover, the time for optimizing θ
PV for each site could be reduced by adopting our suggested procedure. To find the optimized point, south-facing GW1–GW5 must be rotated twice by 22.5 degrees; thus, three sets of calculations (at θ
PV of 135, 157.5, and 180°) are required. However, our suggested method only requires a two-step calculation (at θ
PV of 135 and 157.5°).
The proposed method was also valid for the KWJ, whose runways and flight paths are almost symmetrical to the GMP. The runway of KWJ lies at 220°; six different sites were selected for A-PV installation, as shown in
Figure 10. KW1–2 was on the west side of the runways, whereas the others were east of the airport (KE1–4). Despite the maximized energy generation in E
Max, the sum of T
SG from each A-PV exceeded 460 h per year. Due to the reduced angular difference between the route and θ
PV of A-PV under E
Max conditions, most of them were PAI. Detailed T
SG induced by south-facing A-PVs is displayed in
Figure S2. However, if the A-PVs were rotated to 135° and 202.5° for KE1–2 and KW1–4, respectively, the T
SG decreased to zero. In addition, the AER under GF is 0.96, which is only 4% lower than that of E
Max. Hence, our proposed method is applicable to design A-PVs for several airports with north-south runways.
We could successfully optimize θ
PV of A-PVs using the suggested method at PEK and NRT, whose FPs and routes were 170 and 140°, respectively. Due to the limited open area in PEK, potential sites for A-PVs were close to routes. As a result, the T
SG from A-PVs was smaller than in other cases. Meanwhile, the potential sites for A-PVs were only on the west of FPs and routes due to existing mountains, buildings, and another route in the east of them. For both cases, the optimized angle for A-PV located on the west side of FPs and routes was 225°. The detailed calculations of T
SG and AER are shown in
Figure S3. All south-facing A-PVs introduced glare issues to pilots and ground workers at both airports. However, rotating the A-PVs to the southwest made them safe from reflected light. The A-PVs on the east side of the route minimized T
SG and maximized AER when their θ
PV were 135°. The AERs for optimized A-PVs were 0.94 in both cases. This result again indicates that rotating θ
PV following the suggested procedure contributes to a more sustainable airport without any additional risk.
It should be noted that careful consideration is required for A-PVs installed at airports with east-west runways. In east-west runways, the light reflected by the A-PV facing opposite runways may strongly affect the pilots at sunset and sunrise during the summer because the solar light irradiates from the backside of the A-PVs. The azimuth angle of the solar light is less than 90° (sunrise) and exceeds 270° (sunset). In such cases, the reflected light penetrates the A-PVs backward, where the possible flight path and runway are located. However, the A-PV facing opposite them still exhibits a decreased TSG without significant AER reduction.
