1. Introduction
In Japan, where the birthrate continues to decline, it is important to develop a road traffic environment that ensures the safety and security of children, who represent the next generation, and to promote traffic safety education. In recent years, for example, emergency safety inspections have been carried out on routes along which children travel in groups on a daily basis.
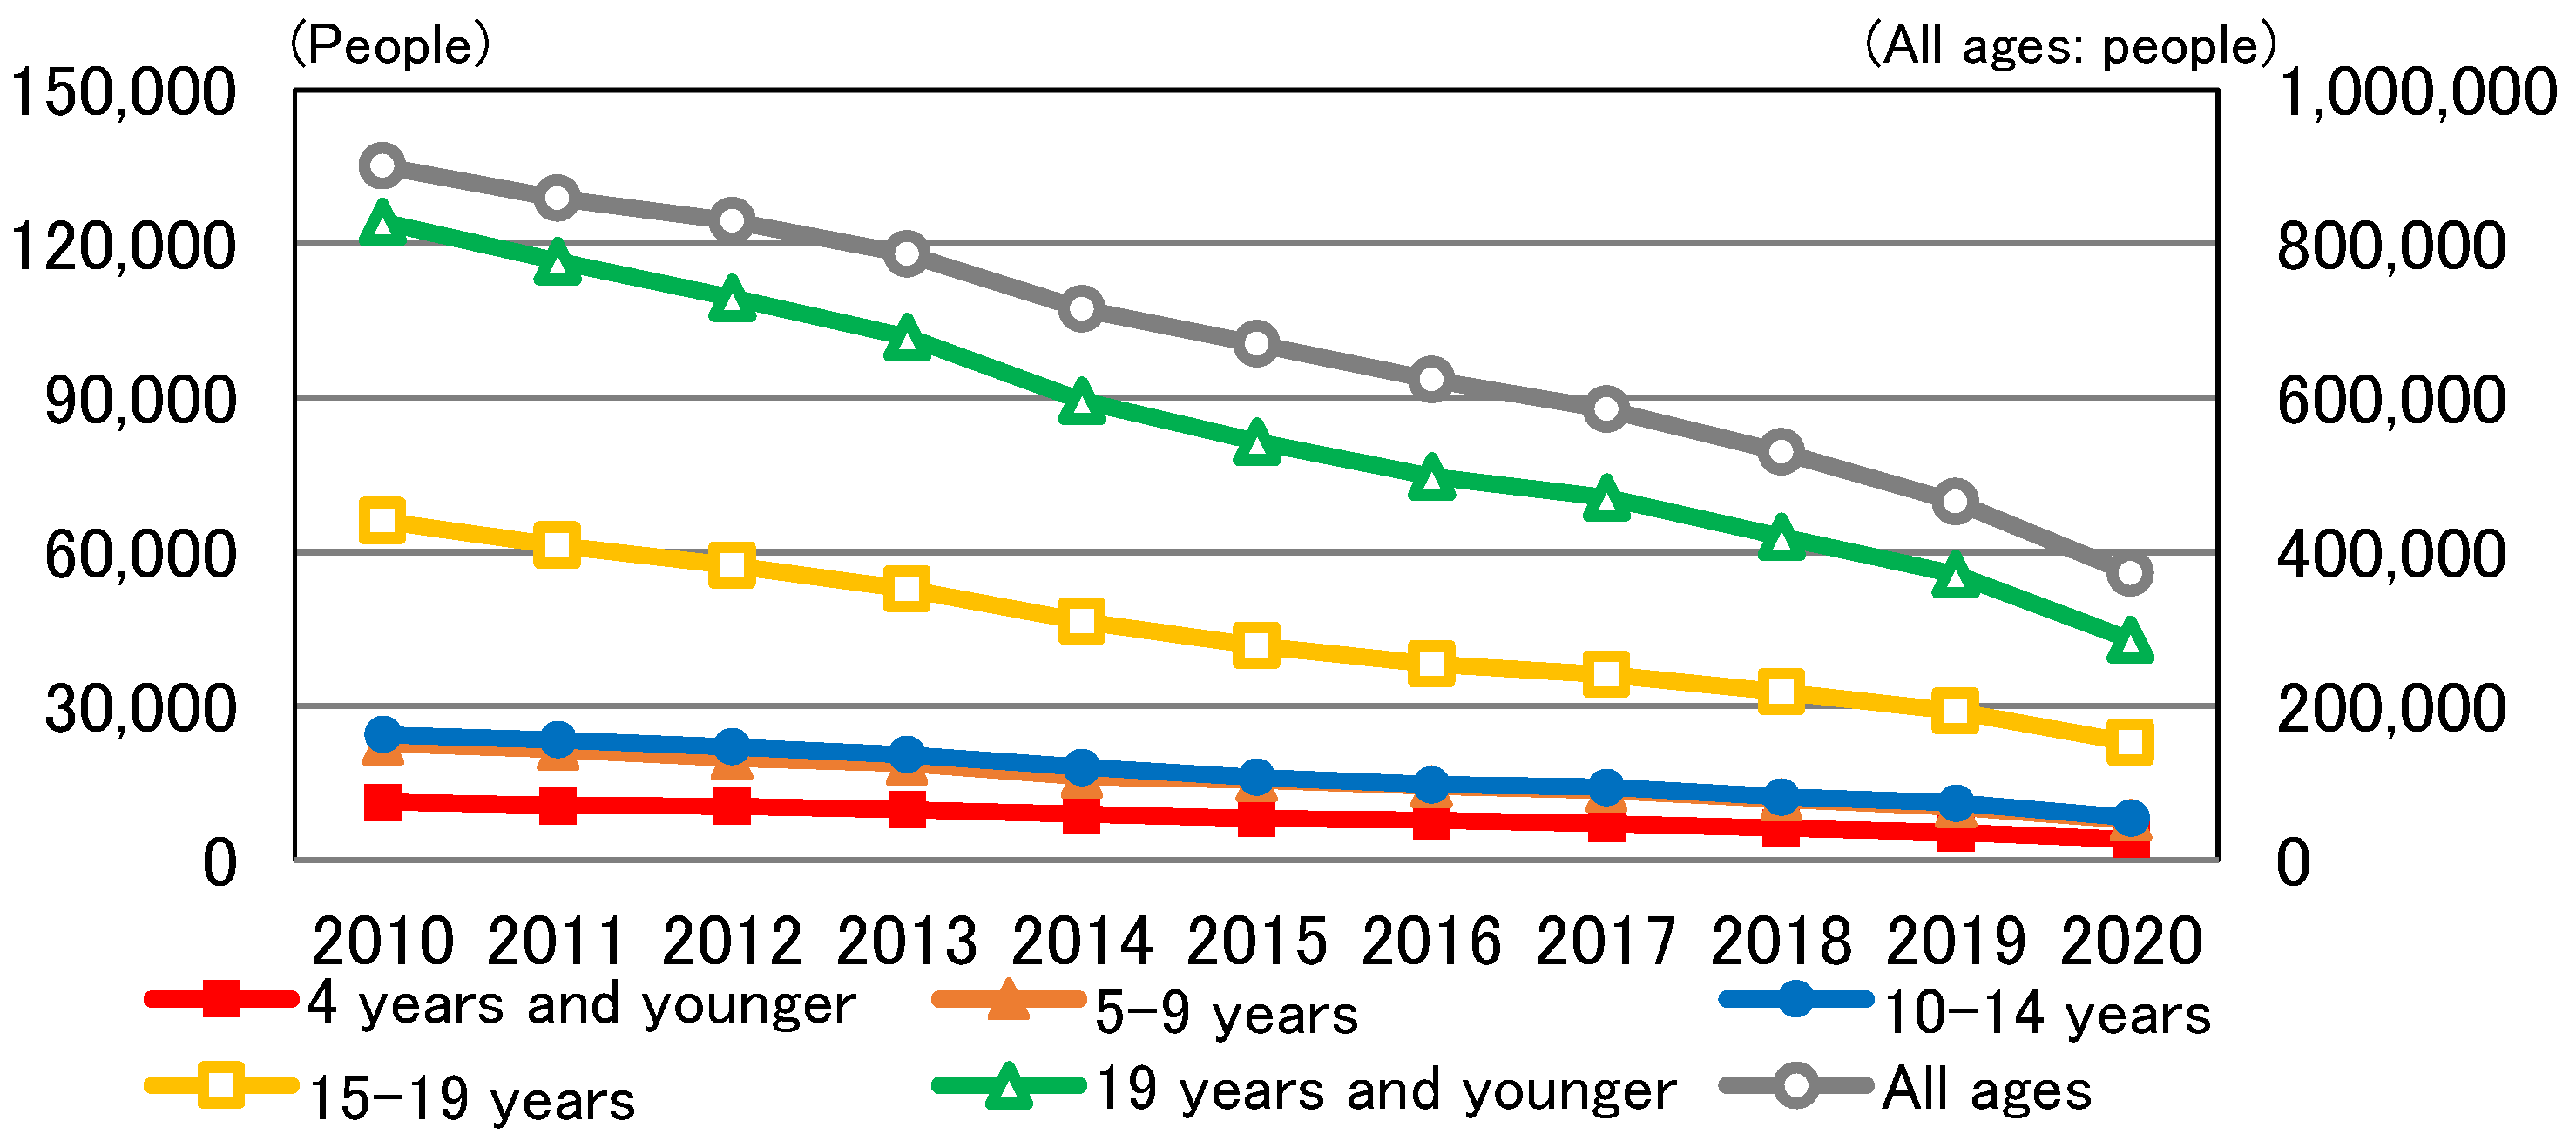
Measures are underway to develop safe pedestrian spaces and ensure traffic safety on residential streets in Japan. An example is the Zone 30 Plus initiative, which is a measure to promote the development of safe and secure traffic spaces that prioritize people on residential streets by appropriately combining 30 km/h speed limit zones with physical measures—including speed bumps, rising bollards, and smooth pedestrian crossings—to slow traffic and protect pedestrians. As a result of these traffic safety efforts, the number of traffic accidents per year involving children has declined in recent years, as shown in
Figure 1 [
1]. On the other hand, as
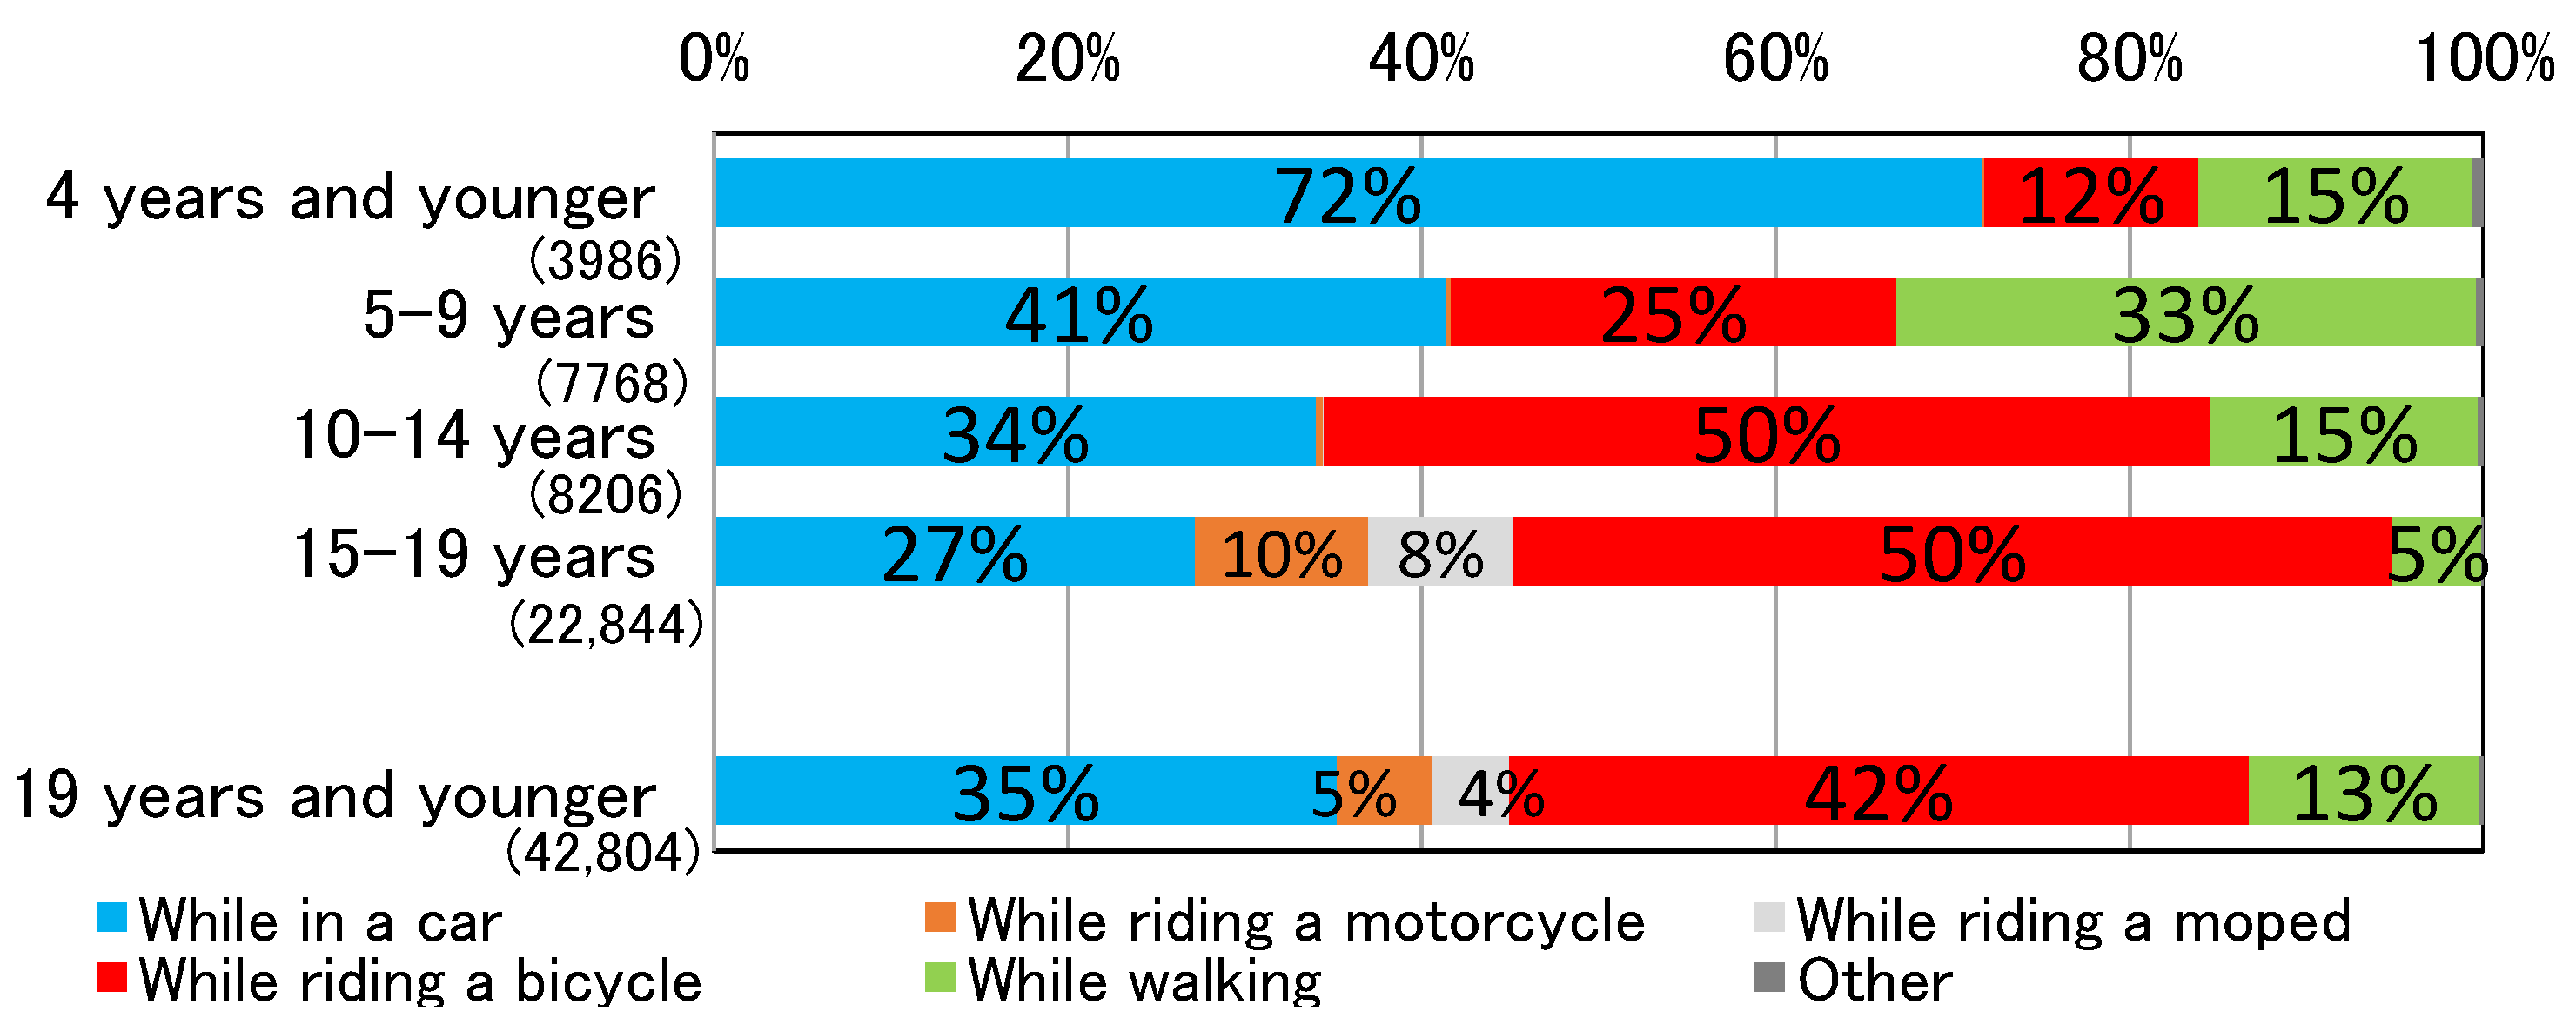
Figure 2 shows, in 2020, 42,804 people under the age of 19 were killed or injured in traffic accidents. “Riding a bicycle” was the most common circumstance for these accidents, accounting for approximately 42% of the cases (17,889 persons) [
1].
Although the number of fatalities resulting from bicycle-riding accidents is decreasing in Japan [
2], the rate of decrease is smaller than that for overall traffic accident fatalities [
2]. Furthermore, although the number of traffic fatalities per 100,000 of the population in Japan is the smallest among the G7 countries for those in cars, it is the second highest, after the United States, for those walking or riding a bicycle [
3].
Given these circumstances, the 11th Basic Plan for Traffic Safety, formulated by the Central Traffic Safety Council of the Cabinet Office in March 2021 [
4], cites “ensuring the safety of elderly people and children” and “ensuring the safety of pedestrians and cyclists and raising awareness of compliance” as priorities when considering future road traffic safety measures and states that more traffic safety measures are needed to reduce the frequency of traffic accidents.
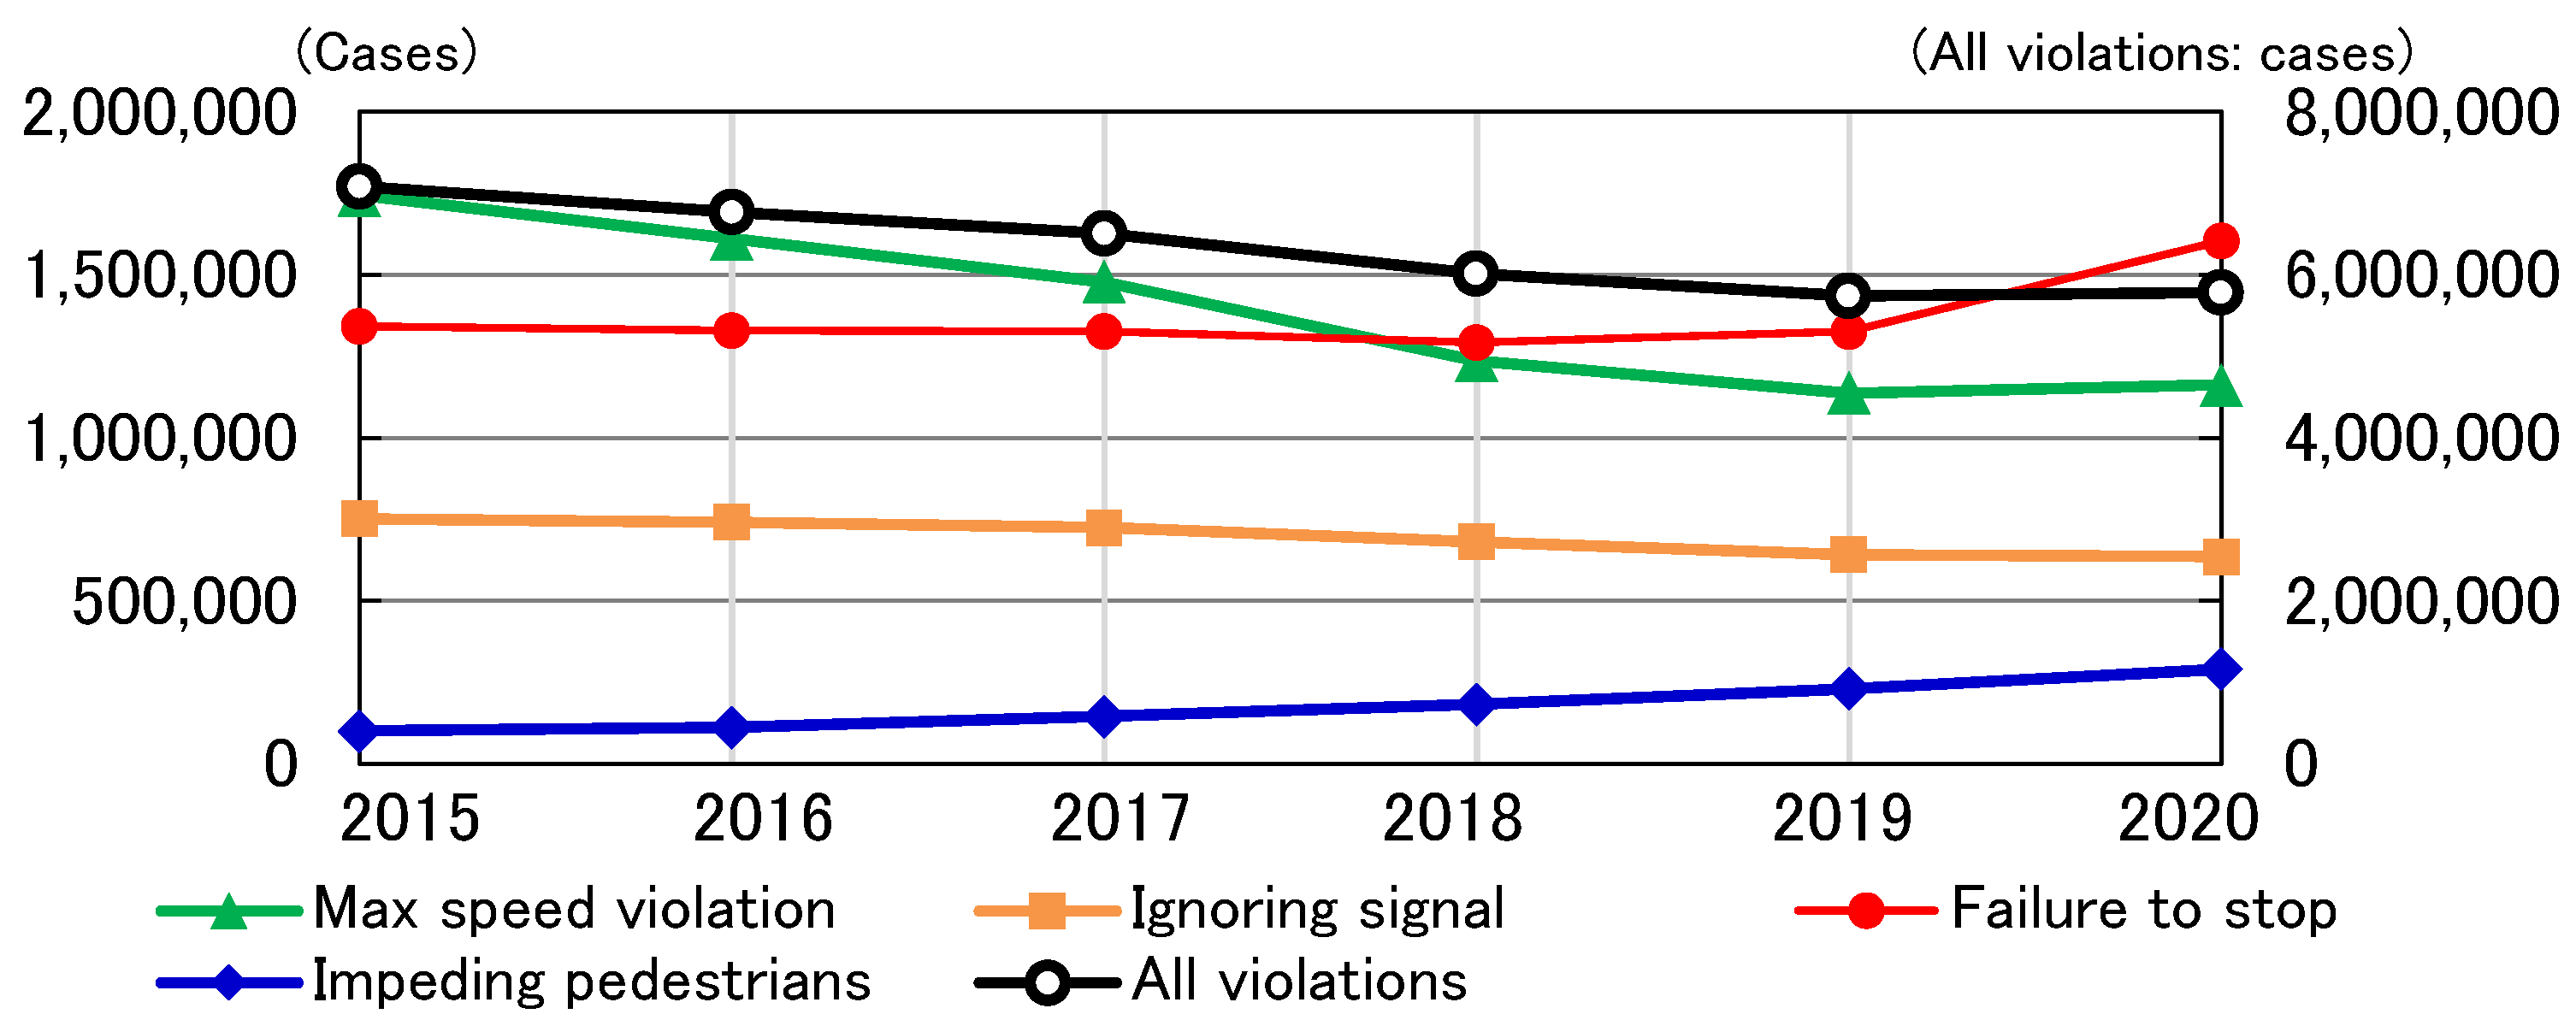
To ensure the safety of children and cyclists, it is important to reduce the frequency of traffic accidents involving children riding bicycles. To do this, it is necessary to clarify when, where, with whom, why, and how children riding bicycles are involved in traffic accidents. Of these, “why” can be deduced to some extent from the types of traffic accident violations. For example,
Figure 3 shows a plot of the enforcement of the main types of traffic violations in Japan over time. It is evident that the overall number of violations of laws and ordinances is on a downward trend, although the numbers of incidents of a failure to stop and impeding pedestrians are increasing. This suggests that there are many vehicles that enter intersections with poor visibility without stopping or that do not pay enough attention to pedestrians crossing the road.
The purpose of this study was to clarify the causes (the “why”) of traffic accidents involving children riding bicycles, utilizing traffic accident statistics maintained by the Ishikawa Prefectural Police Headquarters to analyze the relationship between the ages of the children involved in such accidents and the violations of laws and ordinances.
2. Previous Research
This section reviews previous research relevant to the subject of this study on the topics of traffic safety for children and traffic safety for cyclists.
2.1. Research on Traffic Safety for Children
Miyazaki and Morimoto [
5] performed a comparative analysis of traffic accidents involving children on and off school routes in Utsunomiya City and found that most accidents on the school route occurred at low speeds. Fukawa et al. [
6] conducted an experimental study of parents’ recognition of their children’s ability to make street-crossing judgments and found that parents had insufficient appreciation of the fact that their children’s misjudgment rate increased in the presence of high-speed vehicles. Inagaki et al. [
7,
8,
9,
10], who focused on pedestrian accidents involving children that occurred when they were crossing the street, conducted experiments to determine the effects of differences in vehicle distance and speed on the ability of elementary school children to make street-crossing judgments, as well as the timing of vehicle perception on children’s street-crossing judgments. Their results showed that, compared to adults, elementary school children have more difficulty judging vehicle speed and that a shorter perceived distance induces misjudgments. In addition, they conducted a questionnaire survey on the impact of providing information to parents about their children’s street-crossing judgment characteristics that had been revealed in previous studies and were able to demonstrate a positive change in attitudes toward speed control when driving a car and guidance to children. They also conducted experiments on guidance for street-crossing judgments on residential streets, focusing on parents, and summarized issues that should be considered in the future development of guidance to parents about their children’s street-crossing judgments. Ohtani [
11], taking traffic safety education for children as an example, described the methods and key points for understanding the effects of education initiatives and summarized the factors that should be considered in the evaluation of traffic safety education initiatives.
These previous studies have described the characteristics of accidents involving children on their way to school, which occur frequently. In addition, they have highlighted the ability of children to make street-crossing judgments, parental awareness of children’s abilities to make such judgments, and key points in assessing the effectiveness of traffic safety education for children with respect to accidents that occur while children are walking.
2.2. Research on Traffic Safety for Cyclists
Motoda and Usami [
12] reviewed the relevant Japanese and international academic literature to compare the safety of bicyclists on sidewalks versus roadways and concluded that sidewalks are not safer than roadways. Harada et al. [
13] performed an analysis of near-miss accidents related to two-way bicycle traffic on sidewalks using driving recorder data and showed that the characteristics of the types of near-misses tended to differ depending on the direction of the bicycle traffic. Ogawa [
14] compared the probability of a bicyclist being involved in a traffic accident with respect to the direction of bicycle traffic, taking into account the number of times a bicycle crosses a roadway between the origin and the destination, and showed that the probability of being involved in an accident varied depending on the road network characteristics and trip distance. Yokozeki et al. [
15] conducted a survey of the number of bicycles in the Tokatsu area of Chiba Prefecture and compared accident rates with respect to bicycle traffic position and direction, combining their survey results with traffic accident statistical data. Their results demonstrated that the danger of riding a bicycle on the right side of the roadway or sidewalk is higher than that of riding on the left side. To ascertain the distribution of bicycle-related accidents at intersections, Hagita et al. [
16] analyzed the frequency of accidents by traffic direction of the parties involved and showed that the presence or absence of a traffic signal resulted in different types of accidents involving bicycles and automobiles. Hagita and Yokozeki [
17,
18] compared the incidence of bicycle-related accidents by traffic direction with bicycle traffic volumes surveyed in previous studies and showed that the rate of bicycle accidents on single-road sidewalks was higher on the right side of the road. They also compared the bicycle traffic volumes for bicycle accidents in Shizuoka Prefecture with the bicycle traffic volume which was surveyed in previous studies, focusing on the traffic location, and found that the number of accidents involving bicycles not passing on the left side of the roadway was higher among young people who were not yet eligible for a driver’s license and among those who did not have a driver’s license.
Kosaka et al. [
19] analyzed the accident frequency before and after the construction of bicycle lanes in three sections of Tokyo with considerable automobile traffic. They highlighted the characteristics of the types of accidents that increased after the installation of bicycle lanes and stressed the need for improvement measures. Yamanaka et al. [
20] used the results of video observations at narrow street intersections in Kanazawa to compare bicyclist behavior at intersections with and without bicycle riding guidance zones and found that the proportion of bicycles entering the intersection from the reverse direction decreased with the establishment of the guidance zone. Yamanaka et al. [
21] investigated a group of cyclists’ sense of safety and their awareness of the factors that contribute to it and found that the installation of bicycle lanes and the securing of traffic widths resulted in the improvement of a sense of safety. Zou et al. [
22] proposed a vehicle acceleration prediction model based on machine learning methods and driving behavior analysis. The prediction results show that the proposed method in this study can significantly improve the prediction accuracy of vehicle acceleration. Ye et al. [
23] analyzed the factors affecting the LOS (level of service) of non-motorized vehicles crossing the signalized intersection, aiming at the mixed non-motorized traffic flow of electric vehicles and bicycles in the Chinese metropolis. Liu et al. [
24] analyzed the complex coupling relationships among accident factors contributing to the automobile and two-wheeler traffic accidents. The result shows that the Bayesian network (BN) models could reflect the real relationships among the influential factors of the two types of traffic accidents. Wang et al. [
25] designed an e-bike rider behavior questionnaire; safety attitude was found to be significantly associated with risky riding behaviors.
Furthermore, these studies have conducted safety and near-miss analyses of bicyclist behavior on sidewalks and have analyzed accident rates based on the number of bicyclists crossing roadways, bicycle traffic volumes by location and direction of traffic, the number and types of accidents associated with the installation of bicycle lanes, and the factors that contribute to cyclists’ sense of safety.
2.3. Research on Traffic Safety for Children and Cyclists
Nakamura et al. [
26] investigated bicycle traffic safety education for elementary school students by measuring the effects of different teaching materials on children’s awareness and behavioral changes in bicycle traffic behavior. They showed that the workshop environment was the teaching tool that best enabled active and independent participation. As part of their research on reducing injuries caused by bicycle accidents involving children, Toda and Ogura [
27] conducted crash tests of head-on collisions and discussed the importance of head protection in terms of differences in bicycle rider behaviors and head injury severity, depending on the impact site. Kotake et al. [
28] conducted a questionnaire survey of students and teachers from elementary school to high school in Hyogo Prefecture, focusing on bicycle use, and observed that a lack of education, especially among junior and senior high school students, resulted in a low interest in traffic safety and low awareness of violations. Yano and Mori [
29] analyzed the number of young people, from first graders in elementary school through to third graders in high school, killed or injured in traffic accidents while walking or riding bicycles and categorized the numbers in terms of commuting to or from school, private use, and gender, focusing on changes after entering school.
To summarize, these studies have identified effective teaching resources for bicycle traffic safety education for elementary school students, the behavior of bicycle riders in head-on collisions depending on the collision site, and the number of bicyclists killed or injured in accidents, depending on the purpose of travel and gender, with a focus on changes that occur in traffic safety awareness from elementary school to high school and after entering school.
It is clear from this review that many studies have been conducted on road safety for children and for bicyclists and on road safety education for children who ride bicycles. However, these studies have failed to analyze the relationship between the ages of the bicycle-riding children involved in traffic accidents and the occurrence of violations of laws and ordinances in those accidents, with the aim of clarifying the causes of traffic accidents involving children riding bicycles. Therefore, this was the purpose of this study.
3. Research Method
3.1. Traffic Accident Data Used
In this study, we used traffic accident statistics maintained by the Ishikawa Prefectural Police Headquarters. Traffic accidents recorded in official traffic accident statistics are defined as accidents involving the death or injury of persons caused by vehicular traffic, streetcars, or trains on roads, as specified in Article 2, Paragraph 1, Item 1 of the Road Traffic Act [
30]. For each traffic accident, one record is kept of the details of the traffic accident and the parties involved. We examined the records of traffic accidents that occurred in Ishikawa Prefecture between 2009 and 2019 and involved a bicyclist as the first or second party (N = 6364). We considered the following entries in the traffic accident statistical data: participant type (car, bicycle, pedestrian, etc.), ages of the parties, violations of laws and ordinances (first and second parties), and road type (intersection, near intersection, non-intersection (road sections of uninterrupted flow, etc.). Out of approximately 90 violations of laws and ordinances involved in the accidents reviewed, we identified the ten most common violations for use in the analysis, along with the category “no violation”. We grouped the rest of the violations under the category “other violations”. With respect to the “reduced speed location” violation, Article 42 of the Road Traffic Act stipulates that drivers should slow down when driving at the following locations:
On roads with reduced-speed zones indicated by road signs;
Through intersections where lateral visibility is poor, except when traffic control is in effect and when traveling on a priority road (i.e., a road with a higher driving priority at an intersection where no signal is provided);
At a bend in a road, near the summit of an uphill, or on a steep descent.
3.2. Analysis Method
We analyzed the statistical data on traffic accidents in Ishikawa Prefecture from two perspectives: the age of the bicyclists involved in accidents and the ages of both the bicyclists and vehicle drivers in accidents between bicycles and cars that involve violations of traffic laws or ordinances.
3.2.1. Relationship between Bicycle Riding Accidents and Age
With respect to the relationship between bicyclist age and accidents resulting in death or injury, research by Nakanishi [
31] and others has shown that the likelihood of being involved in such accidents is highest in the age group of high school students. To assess the patterns with respect to age and accidents involving bicyclists in Ishikawa Prefecture, we collected and analyzed the available data by age in one-year increments for the age range of 4 to 98 years. In cases in which both the first and second parties were bicyclists, the ages of the first and second parties were counted in the totals.
3.2.2. Relationship between Age and Violations of Laws and Ordinances in Bicycle vs. Car Accidents
With respect to the relationship between bicycle riding accidents and violations of laws and ordinances (first and second parties), according to the National Police Agency’s traffic accident statistics, safe driving violations were the most common violations. In terms of age, the accidents fall into two age categories: those involving the “elderly” (65 years old or older) and those involving the “non-elderly”. Because the purpose of this study was to analyze the relationship between the ages of the children involved in accidents and violations of laws and ordinances, we split the “non-elderly” category into six categories: preschoolers (age 6 or younger), lower-grade elementary school students (ages 7 to 9), upper-grade elementary school students (ages 10 to 12), junior high school students (ages 13 to 15), high school students (ages 16 to 18), and adults (ages 19 to 64). These six categories were added to “elderly (65 years old or older)” for a total of seven age categories. As shown in
Figure 4, in the majority of bicycle riding accidents the other party was an automobile. We therefore aggregated the violations of laws and ordinances in bicycle vs. car accidents and analyzed them by age.
4. Relationship between Bicycle Riding Accidents and Age
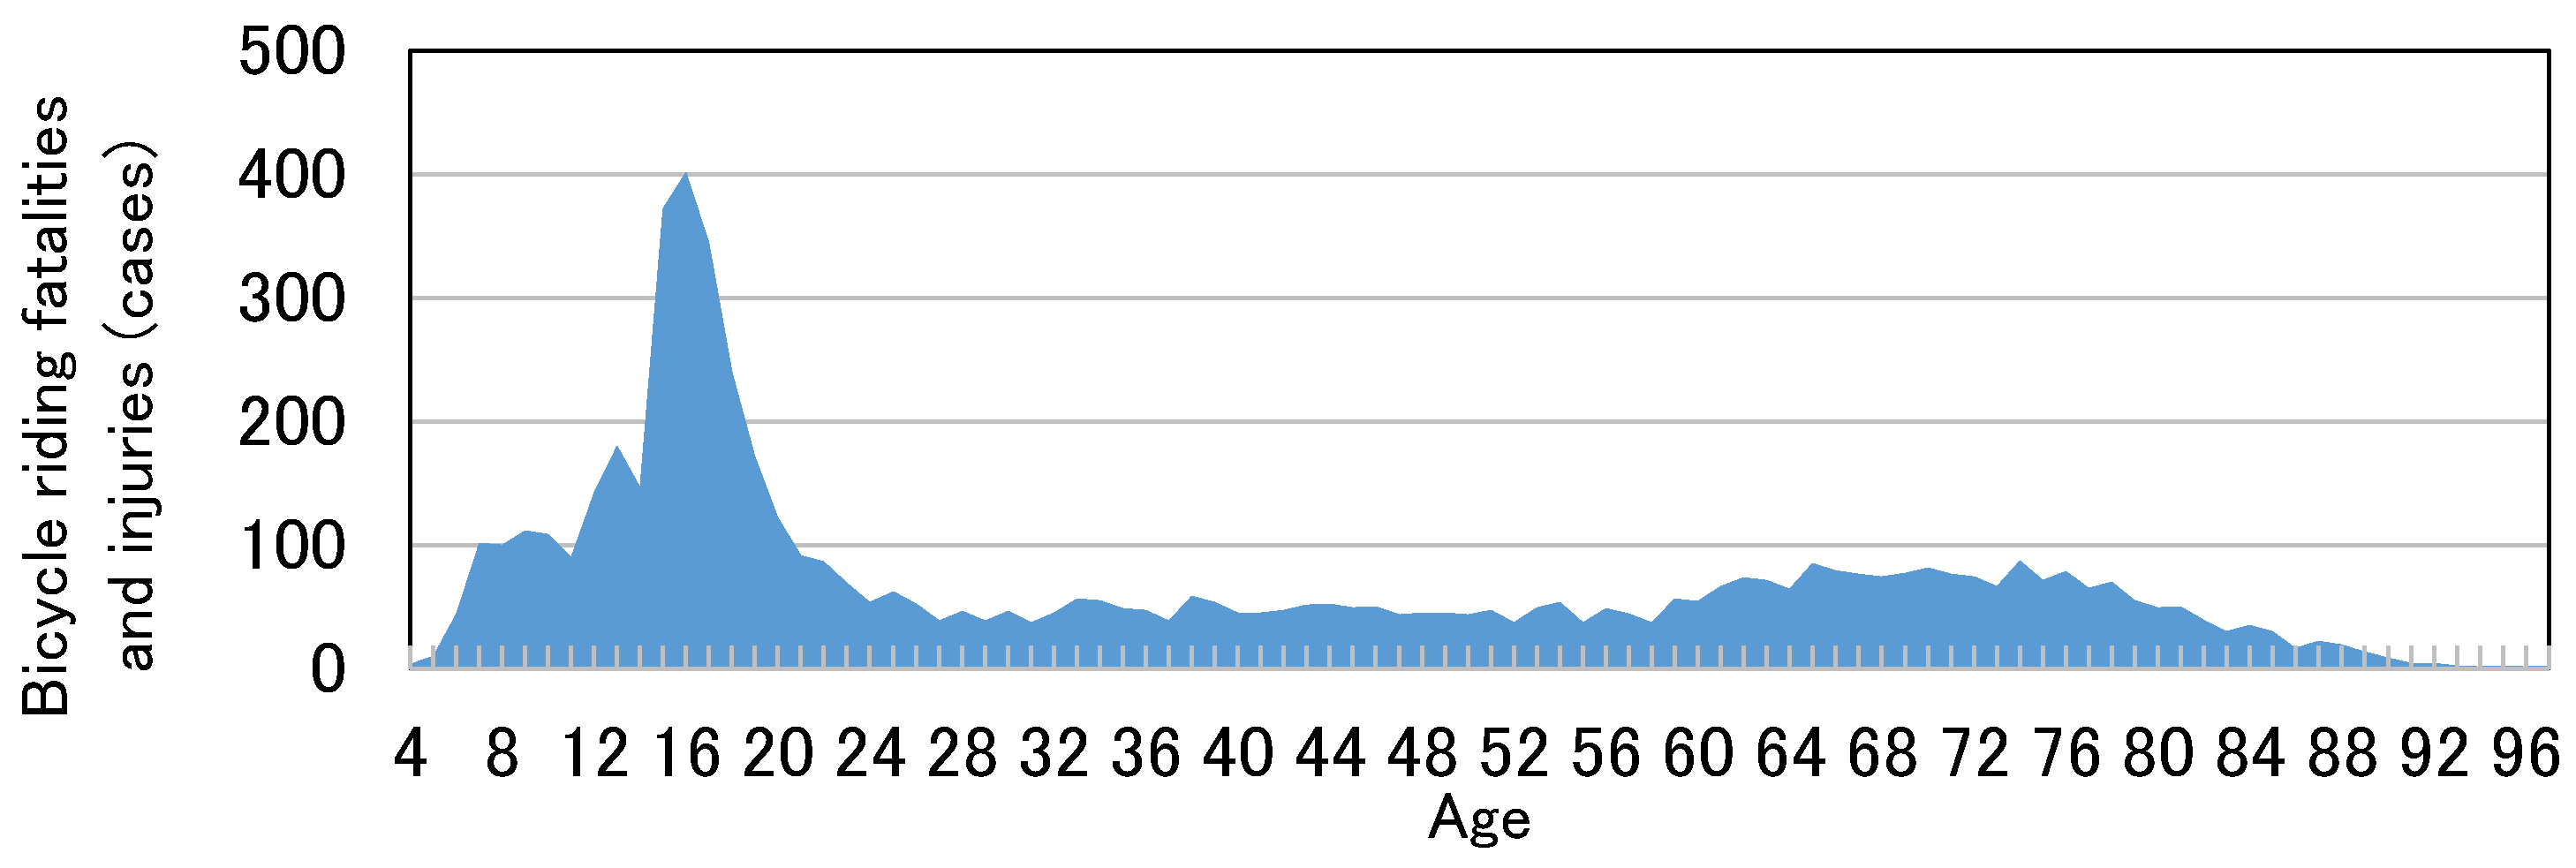
Figure 5 shows the number of bicycle fatalities and injuries by age that occurred in Ishikawa Prefecture between 2009 and 2019. The graph shows that 16-year-olds had the highest number of fatalities and injuries while riding bicycles in Ishikawa Prefecture, with 401 cases. Injuries and deaths of persons under 18 years of age (2392 accidents) accounted for approximately 37% of all bicycle riding accidents. This confirms that the pattern in Ishikawa Prefecture is similar to that observed in previous research, i.e., that bicycle-riding high school students are most likely to be involved in accidents. The graph also shows that students aged 15 years were approximately 2.5 times more likely to be involved in bicycle riding accidents than students aged 14 years (372 versus 146 accidents). Although 15 is typically the age of third-year junior high school students, many first-year high school students are also aged 15. Hence, an increase in the time and distance of bicycle use for commuting to school upon entering high school is presumed to be a factor in the higher frequency of accidents for students aged 15. For those aged 20 or more, the number of accidents falls below 100 and remains low compared to the numbers for children. This is presumably the result of adults having a higher level of knowledge and understanding of the traffic rules related to bicycles than children and the fact that many have by age 20 obtained driver’s licenses and switched their main means of transportation to driving cars.
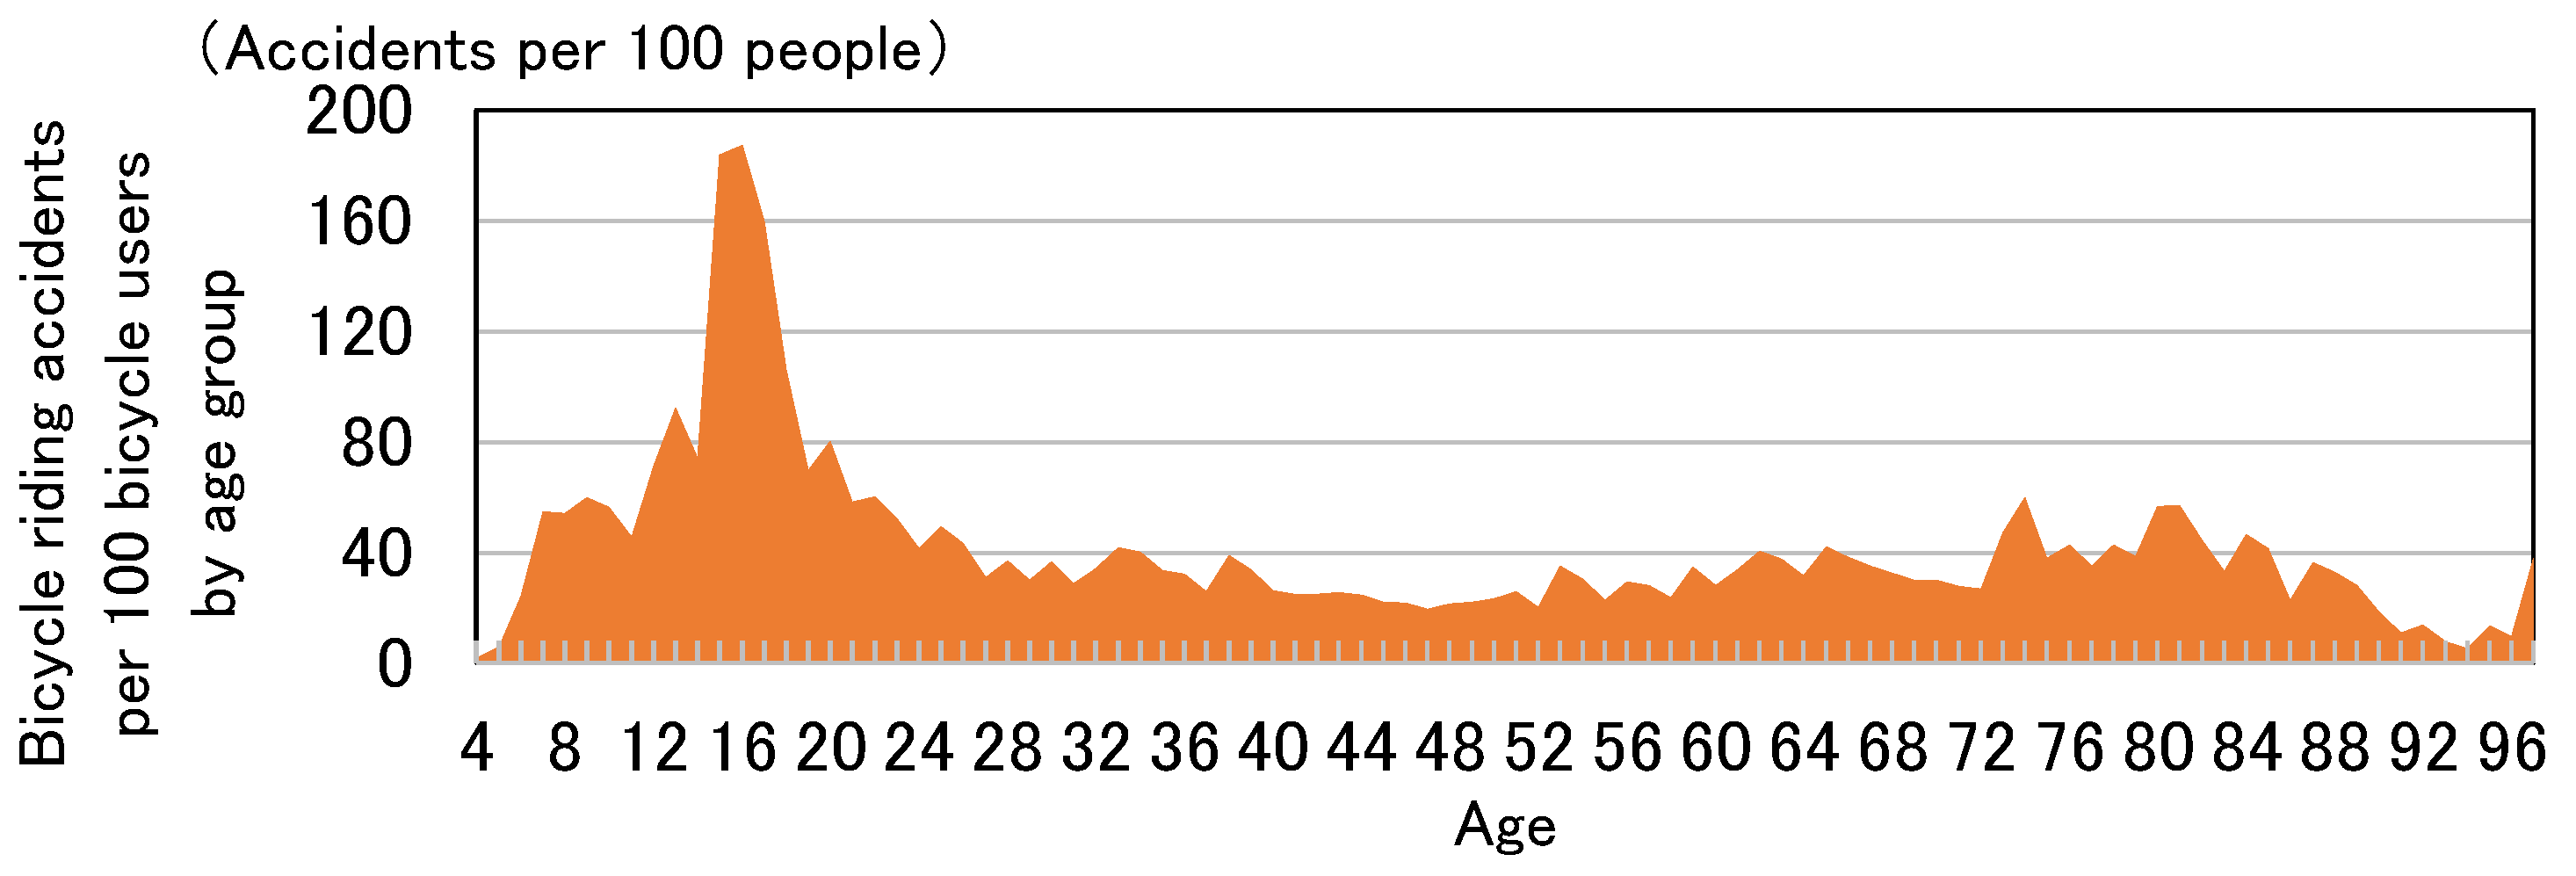
Figure 6 shows the number of bicycle riding accidents per 100 bicycle users, aggregated by age and calculated using the estimated population of Ishikawa Prefecture by age [
32] and the bicycle ridership rate by gender and age group (nationwide, weekdays) [
33]. The bicycle ridership rate used in the calculation is the proportion of bicycle trips to the number of trips of all modes of transportation. The graph shows that injuries and deaths of persons under 18 years of age (approximately 1177 accidents for every 100 people) accounted for approximately 31% of all bicycle riding accidents, with a peak of approximately 187 accidents for every 100 people for those who are 16 years old. These results are similar to those in
Figure 5.
5. Relationship between Age and Violations of Laws and Ordinances in Bicycle vs. Car Accidents
5.1. Distribution of Violations of Laws and Ordinances across All Ages
Before presenting the distribution of violations of laws and ordinances for each age category, this section presents the distribution of the types of violations of laws and ordinances across all ages.
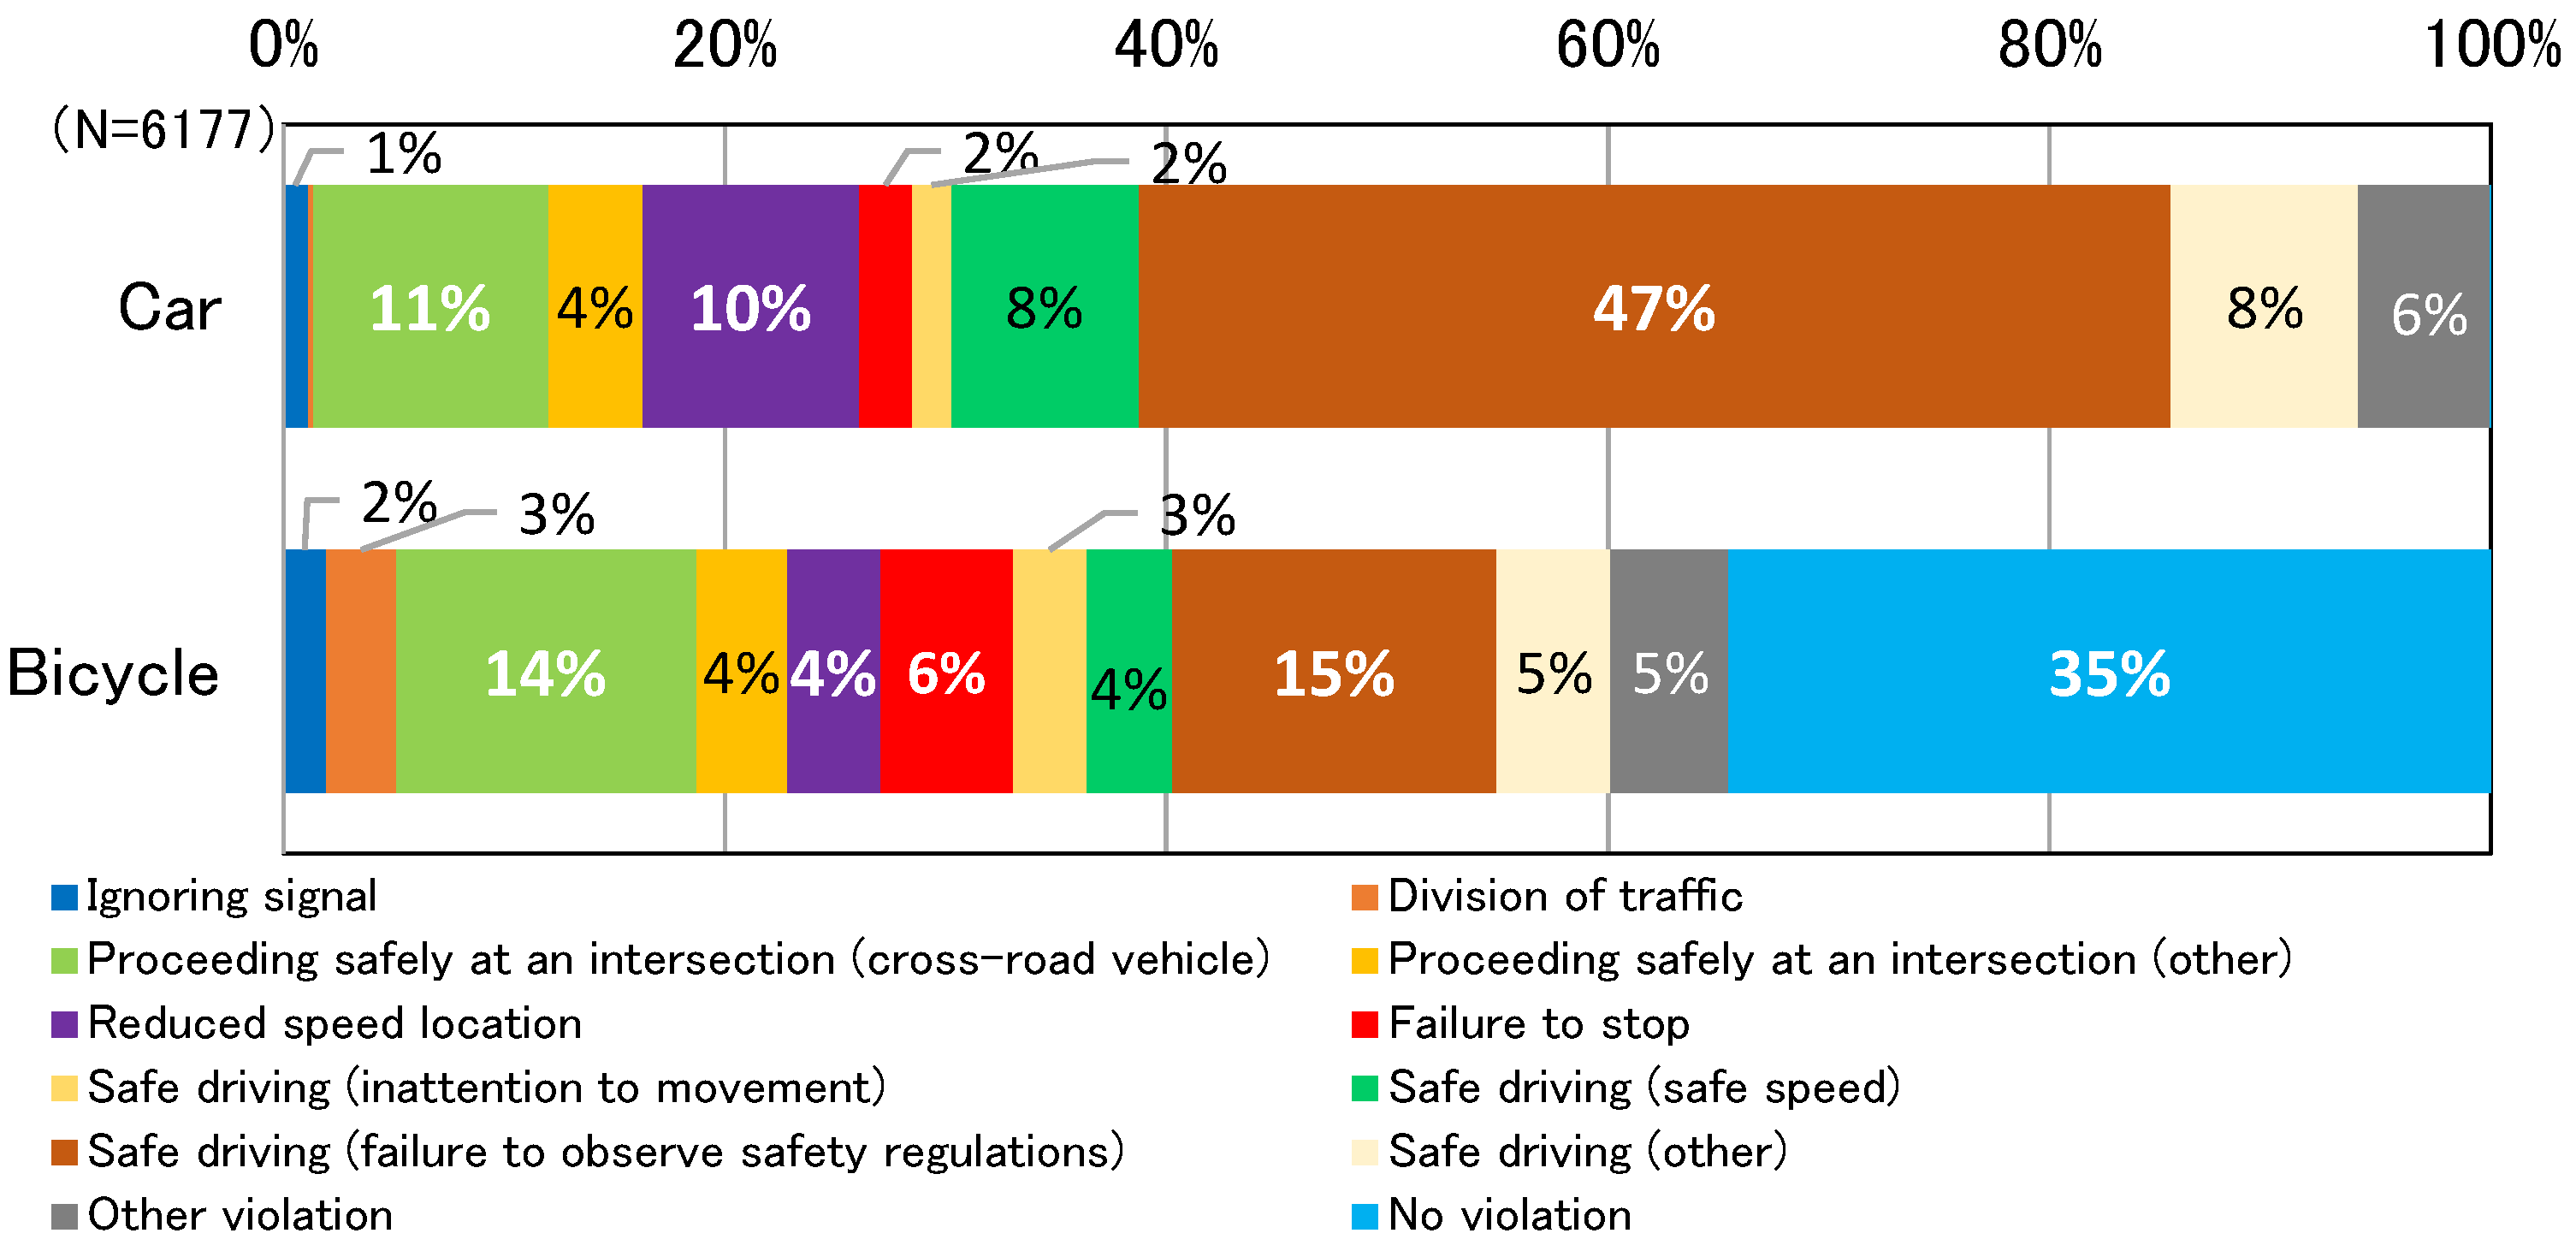
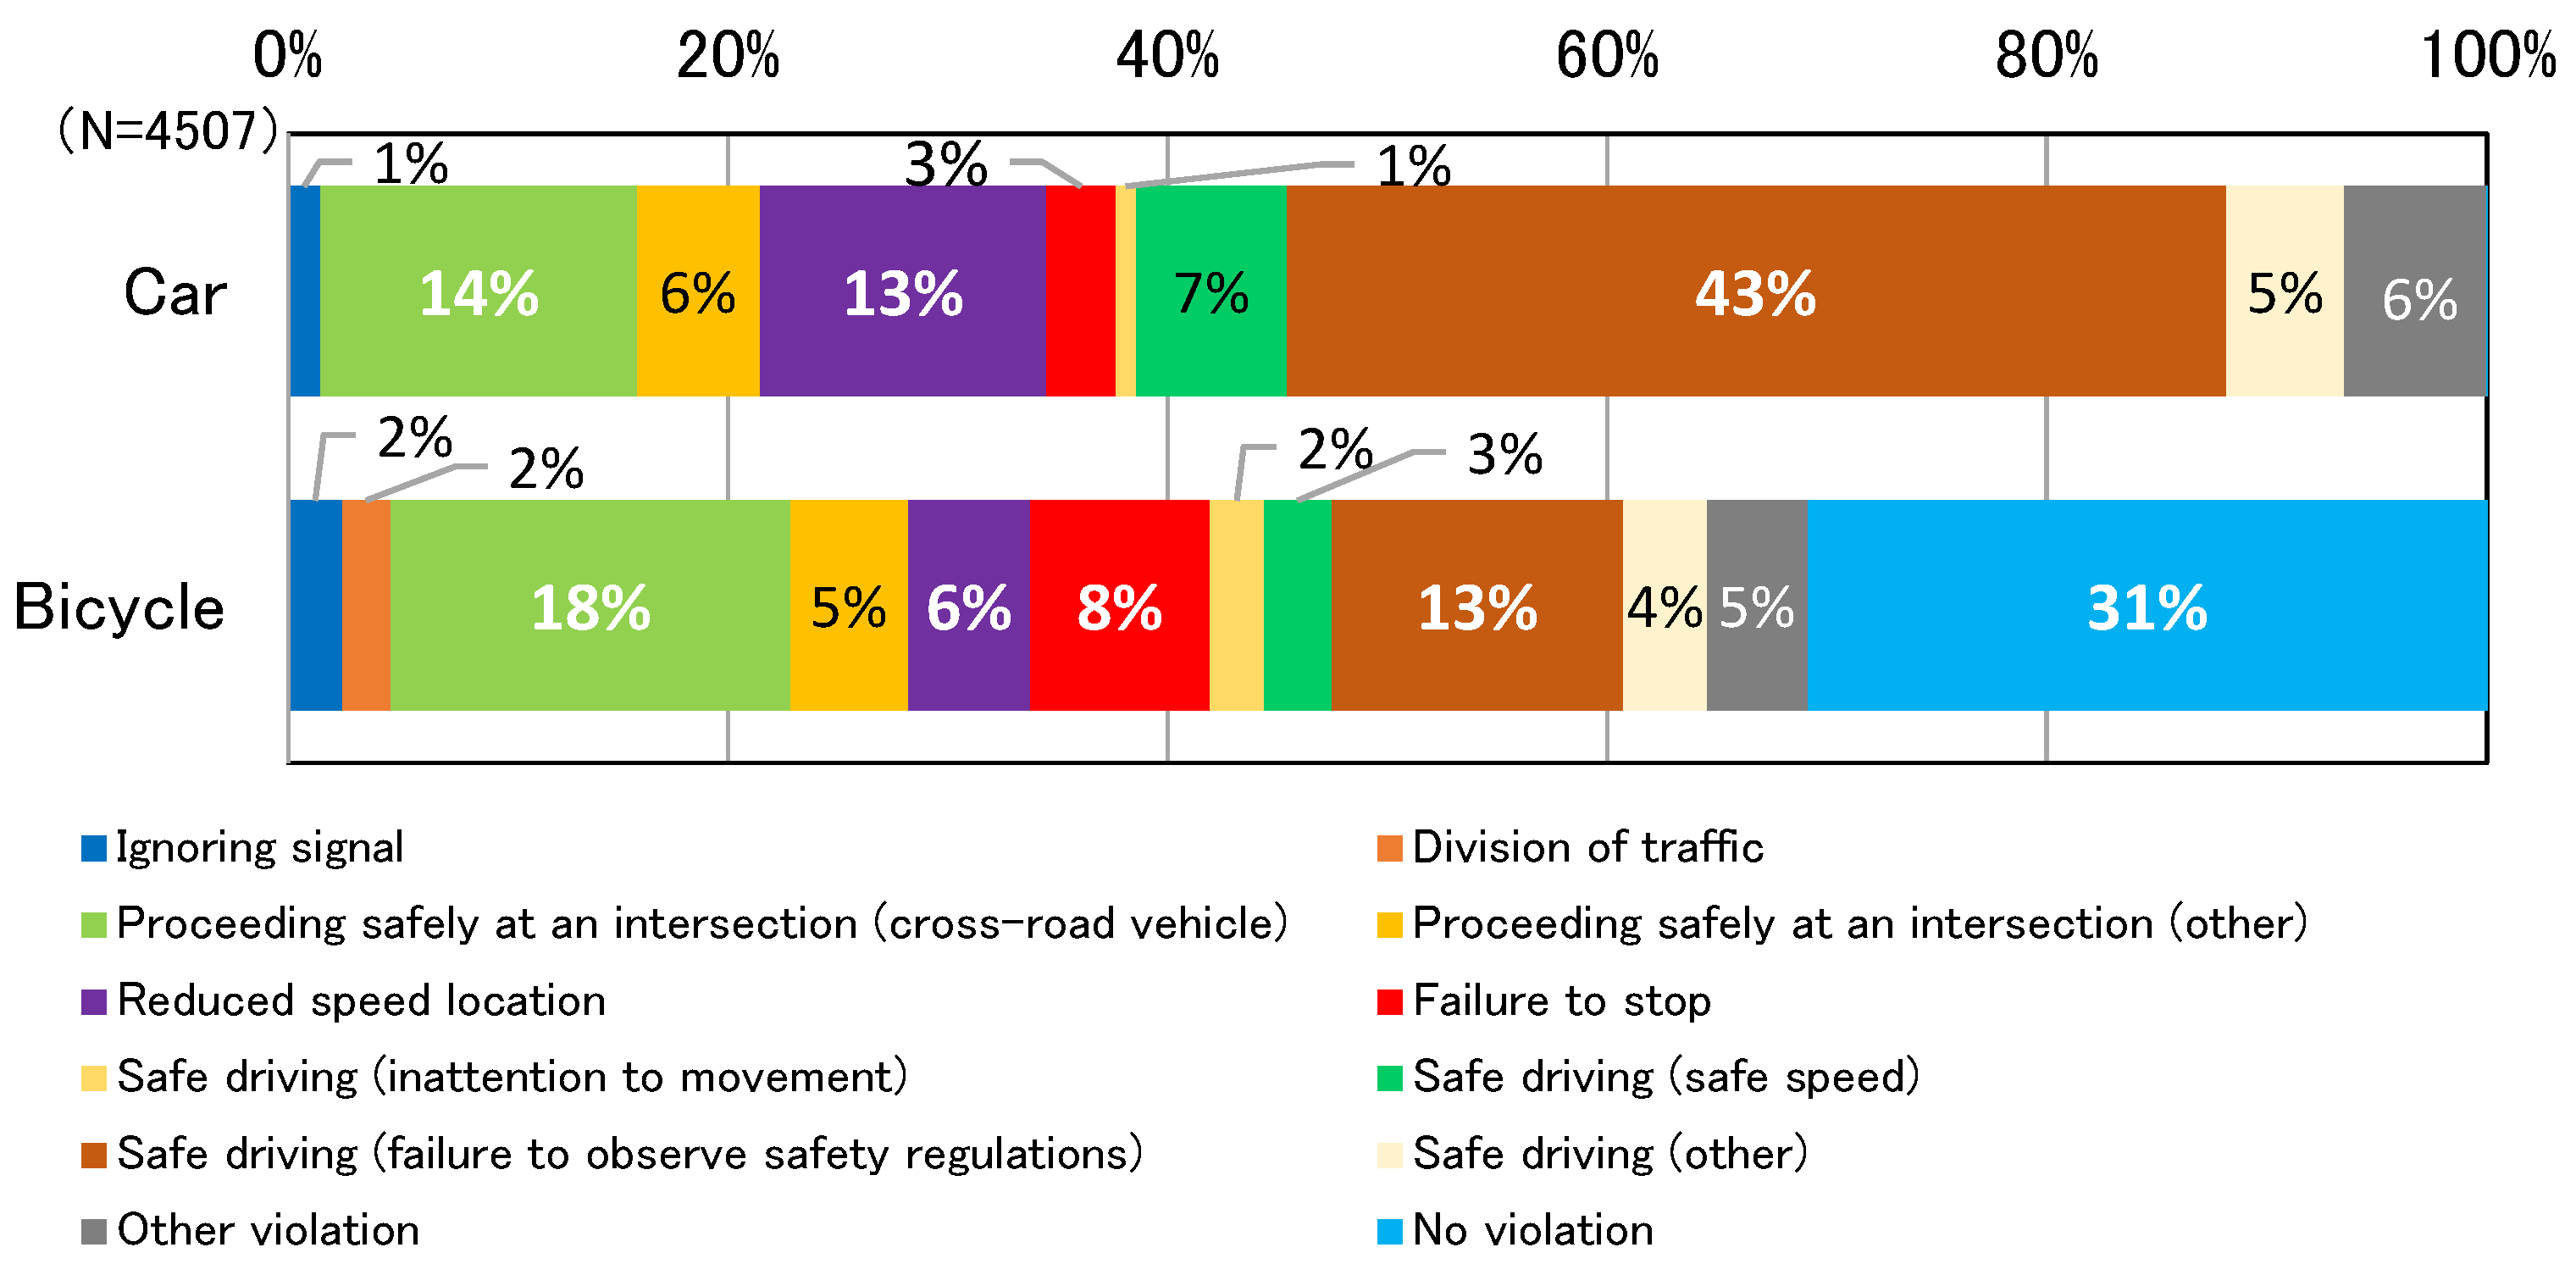
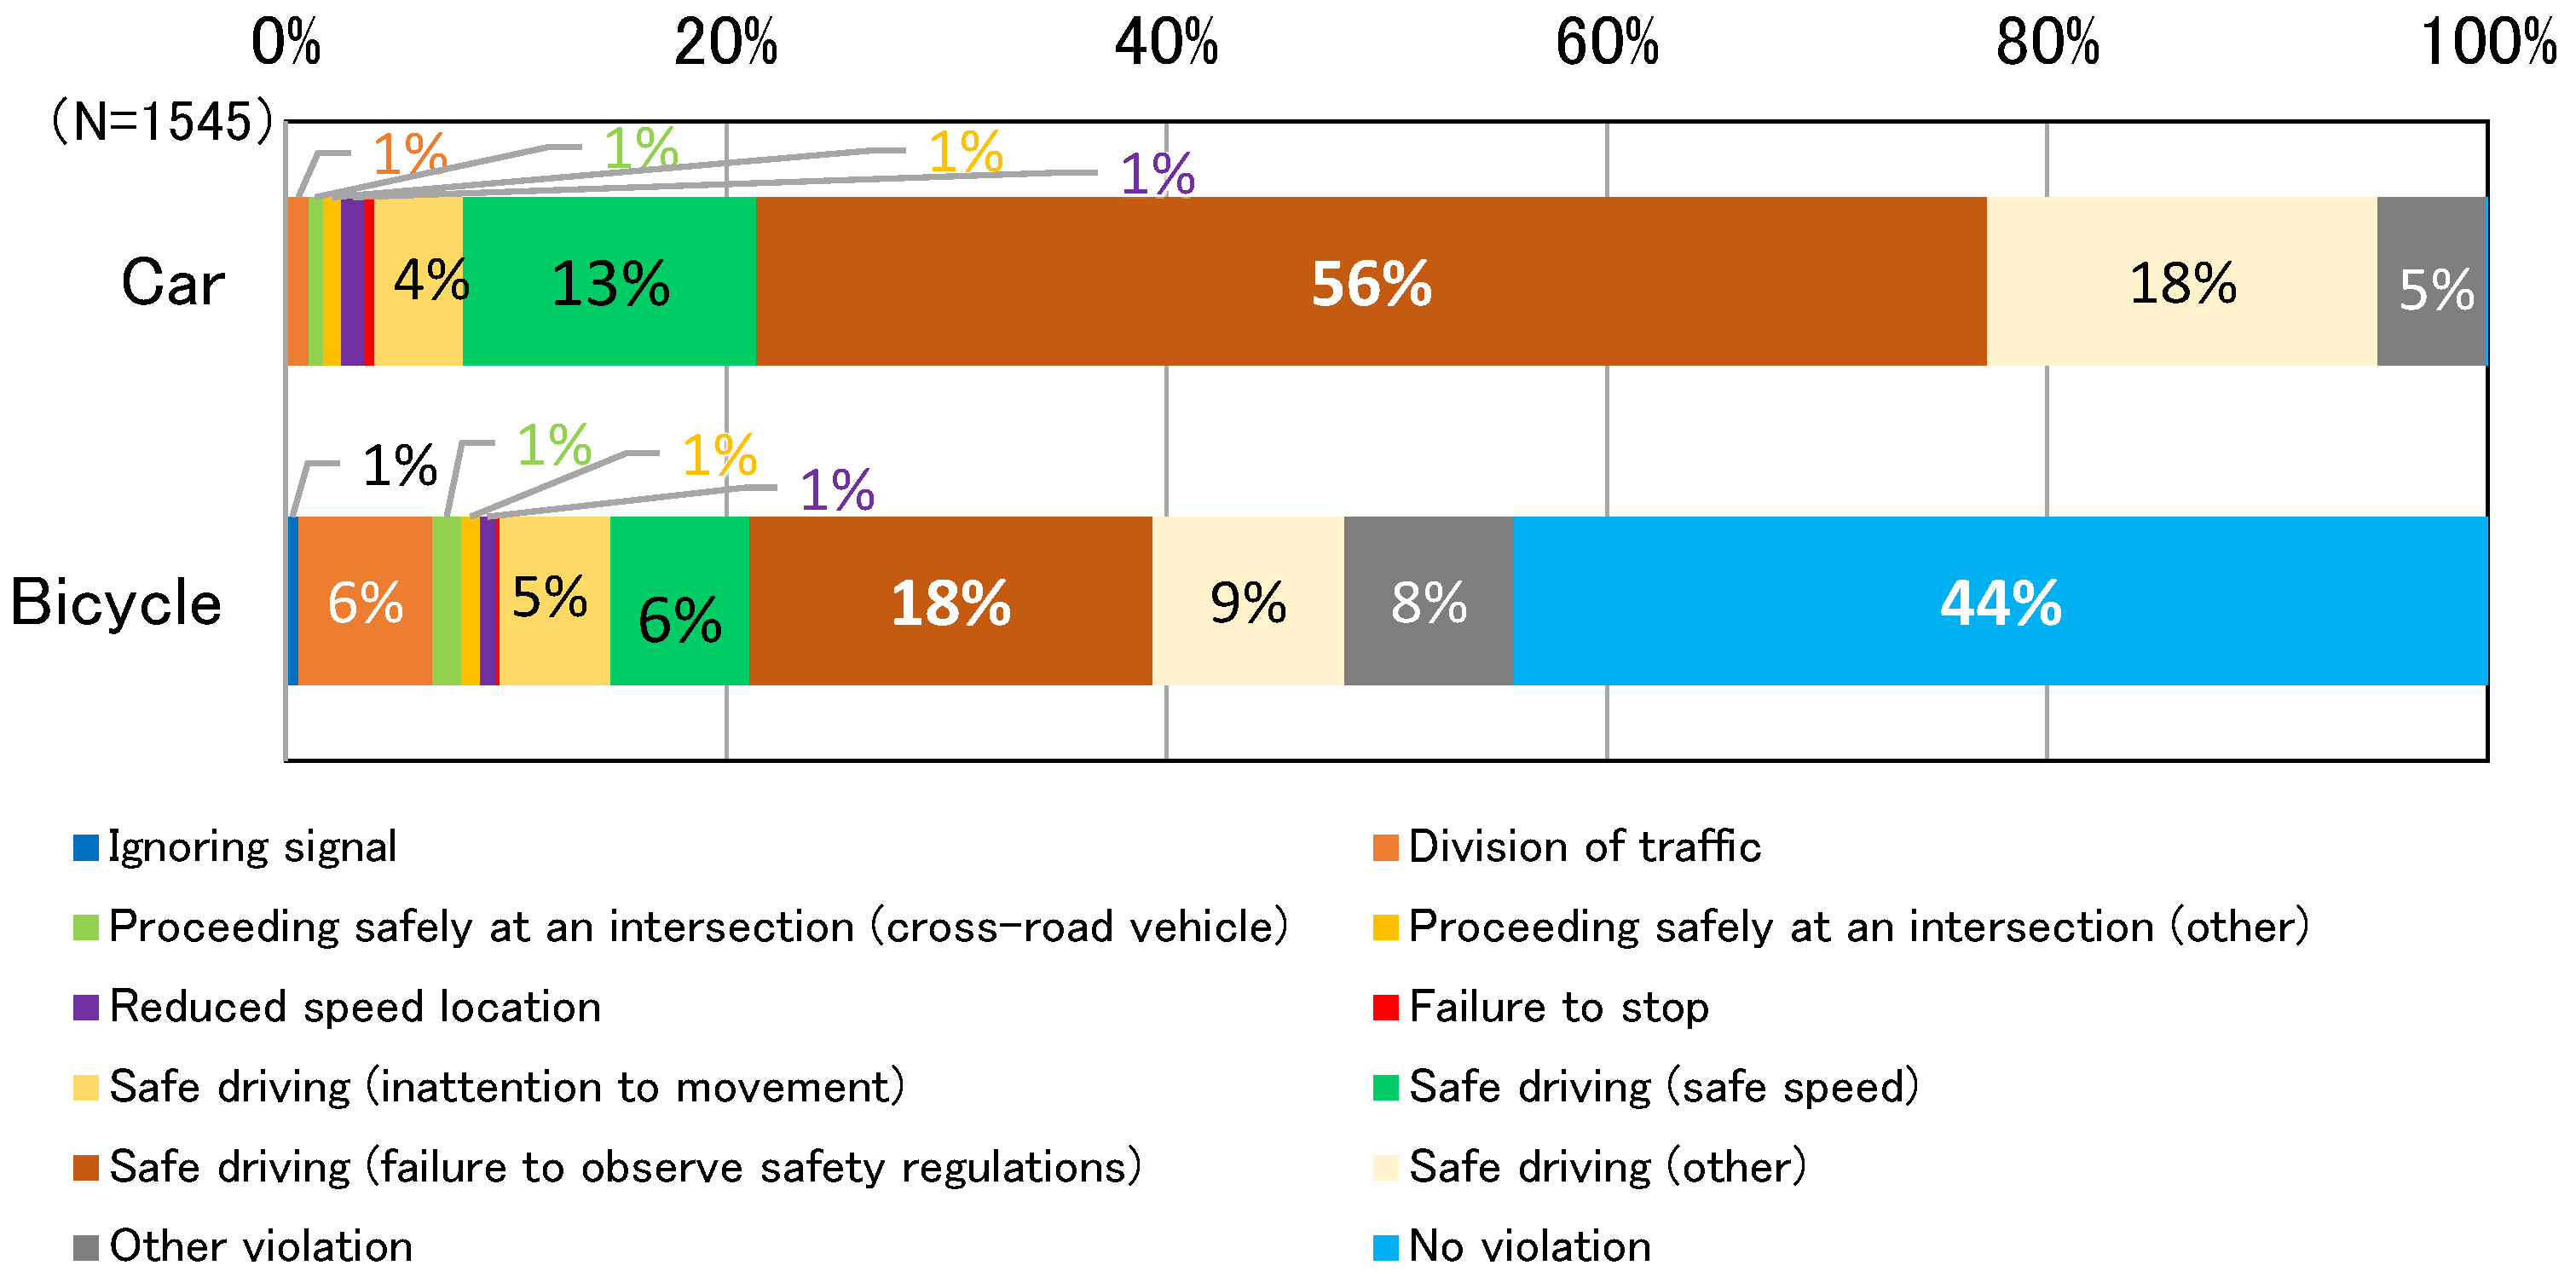
Figure 7,
Figure 8 and
Figure 9 show the distributions of the percentages of violations of laws and ordinances in bicycle vs. car accidents that occurred in Ishikawa Prefecture between 2009 and 2019 for each party (bicyclists and car drivers).
Figure 7 shows the results for all locations.
Figure 8 shows the results at intersections and
Figure 9 shows the results near intersections and at road sections of uninterrupted flow, referred to collectively hereinafter as “non-intersections”. For bicycles, “accident without violation” was the most common type of accident, regardless of location, although the rate was higher at non-intersections than at intersections. For accidents in which violations of laws or ordinances were recorded, safe driving violations (failure to observe safety regulations) were the most common. At all locations (
Figure 7) and at intersections (
Figure 8), violations regarding “proceeding safely at an intersection (cross-road vehicle)” were also common. For automobiles, accidents involving “safe driving violations (failure to observe safety regulations)” were the most common type of accident, regardless of location.
Figure 7 and
Figure 8 also show that more than 70% of bicycle vs. car accidents occurred at intersections. Comparing the two graphs, we see a generally consistent pattern, with the most common violations of laws and ordinances for bicyclists being “unsafe driving (failure to observe safety regulations)” and “proceeding safely at an intersection (cross-road vehicles)”, while for motorists, the most common violation of laws and ordinances is “unsafe driving (failure to observe safety regulations)”. In the following sections, violations of laws and ordinances at intersections and non-intersections are tabulated and analyzed by age group.
5.2. Distribution of Violations of Laws and Ordinances by Age Group
5.2.1. At Intersections
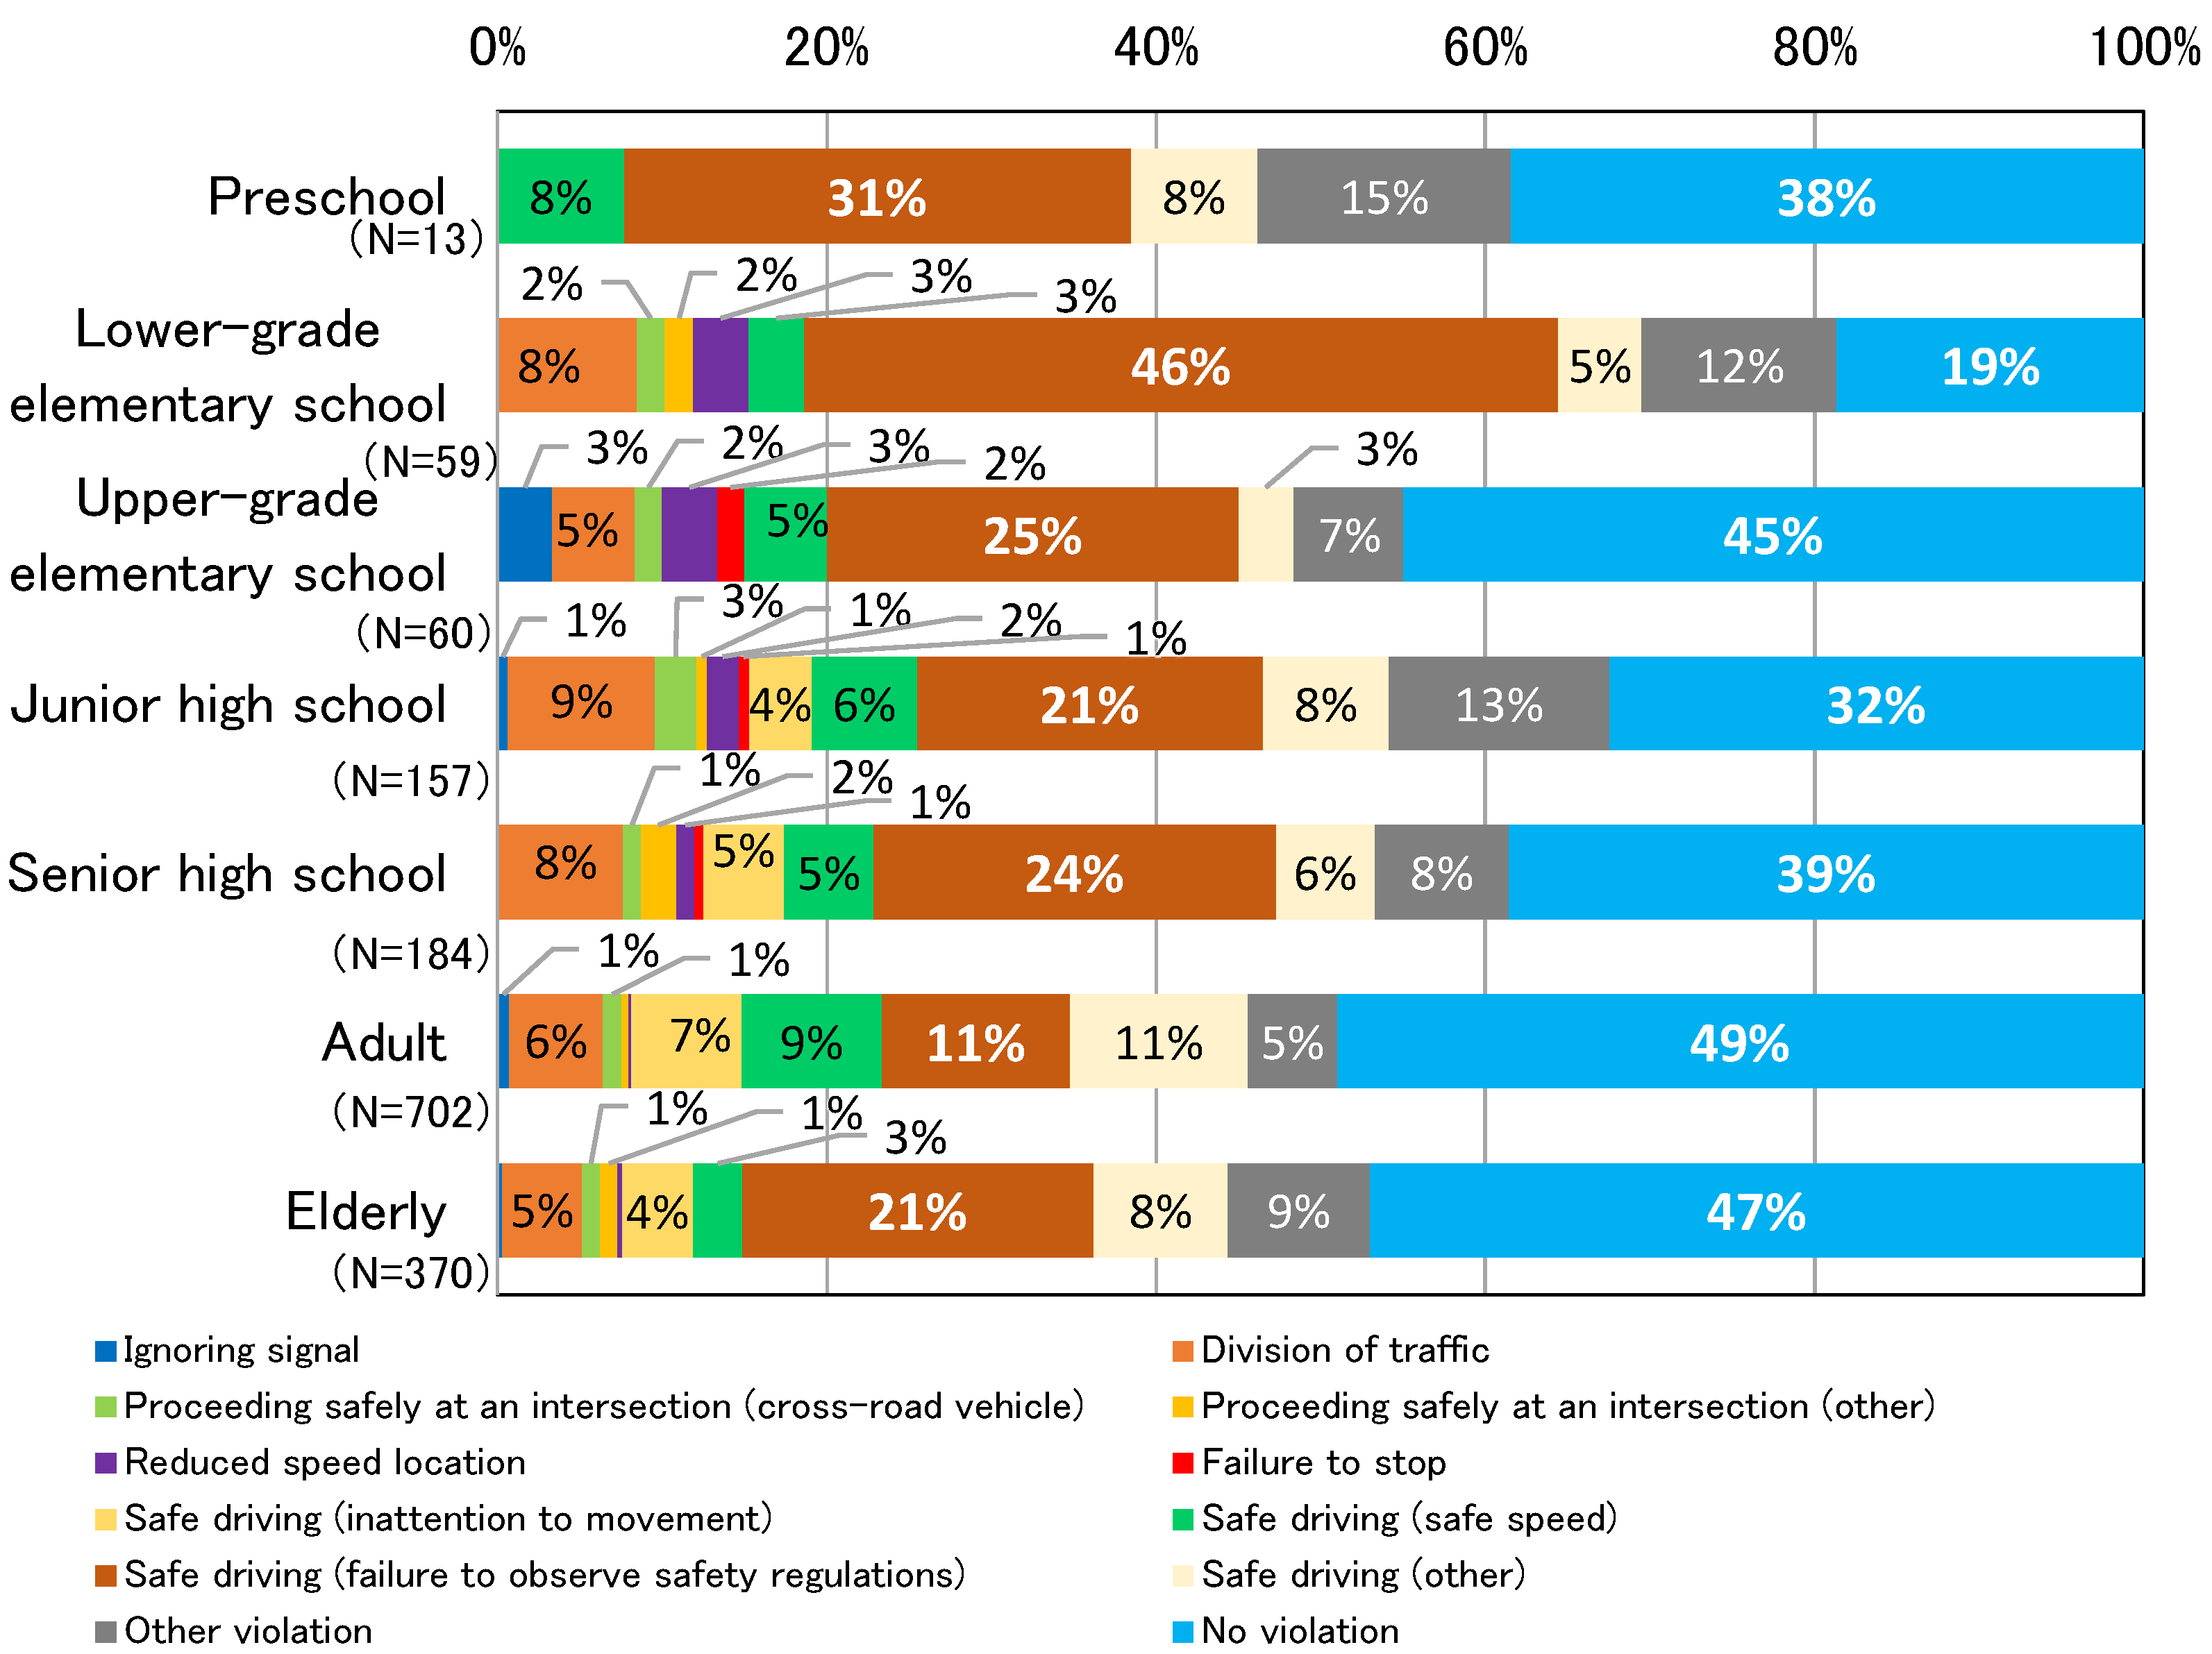
Figure 10 presents the distribution of the violations of laws and ordinances by age of bicyclist in bicycle vs. car accidents that occurred at intersections in Ishikawa Prefecture between 2009 and 2019. For adults and the elderly, the results show similar trends, although the percentages of unsafe-driving violations vary. The results for bicycles exhibit approximately the same pattern as the distribution of violations of laws and ordinances shown in
Figure 8.
For preschoolers, there were less number of traffic accidents than other age divisions and was a result in
Figure 5 with a little number of accidents resulting from riding bicycles in those of six years or younger. When the elementary school students use a bicycle, as for this, it is guessed that there was many situations that a protector accompanies them. Additionally, the results were similar to those for all ages of adults and the elderly, with the most common violations being “unsafe driving (failure to observe safety regulations)” and “not proceeding safely at an intersection (cross-road vehicle)”. The number of speed violations in reduced-speed zones was approximately 8% higher than for all age groups. This may be because preschool children have not yet received traffic safety education and are not aware of where they should slow down. The result tends to drop along with an increase in age when we paid attention to a ratio of the “reduced speed location” violation. It is guessed that the risk prediction ability to foresee the future of the bicycle driver improves with an increase in age.
For elementary school students, the rates of accidents that did not involve any violation on the part of the bicyclist were the lowest rates among all age categories, with approximately 20% for the lower grades and approximately 19% for the upper grades. Since elementary school students are generally considered to have received traffic safety education at least once while in school, it is possible that knowledge of traffic rules learned through this education is not retained or that their understanding of the rules is insufficient. Therefore, it is important that we create the opportunity for parents to educate their children on road safety alongside the education provided by a school and the area. For accidents in which violations of laws and ordinances occurred, the rates of failure-to-stop violations were higher among elementary school students than among the other age groups, i.e., approximately 21% for the lower grades and approximately 19% for the upper grades. It is guessed at the stage of the elementary school students that we cannot recognize a possible danger phenomenon enough at intersections. Therefore, we think that it is important that we plan the improvement of the risk prediction ability to foresee the future by letting you understand the necessity of stopping at intersections.
For junior and senior high school students, the rates of accidents in which there was no violation on the part of the bicyclist were higher for both junior and senior high school students than for elementary school students. For accidents in which violations of laws and ordinances occurred, “not proceeding safely at an intersection (cross-road vehicle)” was the most common violation, with a rate of approximately 18% for junior high school students and approximately 15% for senior high school students. For senior high school students, the rate of “unsafe driving violations (failure to observe safety regulations)” was also 15%. These results are generally consistent with the patterns observed across all ages. On the other hand, for junior and senior high school students, the rates involving the “reduced speed location” and “failure to stop” violations were higher than for adults and the elderly, but lower than for elementary school students and those who were younger. This may be because junior high school students and those who are older have more opportunities to use bicycles for commuting to school and for personal use and, as they do, the distance they travel by bicycle increases. Hence, they may have acquired a greater knowledge and understanding of traffic rules than elementary school students.
5.2.2. At Non-Intersections
Figure 11 presents the distribution of the violations of laws and ordinances by the age of a bicyclist on a bicycle vs. car accidents that occurred at non-intersections in Ishikawa Prefecture between 2009 and 2019. The data for preschoolers are very sparse, corresponding to only 13 individuals, but are shown for reference. The results for adults and the elderly were similar, although the percentages of accidents involving unsafe driving violations vary.
For junior and senior high school students, the results exhibit a similar trend for adults and the elderly, although the rates of accidents in which there is no violation on the part of the bicyclist were low compared to those for all ages.
For elementary school students involved in accidents in which there was no violation on the part of the bicyclist, elementary school students in the lower grades had the lowest rate among all age categories, at approximately 19%, whereas the figure was approximately 45% for those in the upper grades. For accidents in which violations of laws or ordinances occurred, the results were similar to those for the other age groups, with “unsafe driving violations (failure to observe safety regulations)” being the most common type of accident, particularly for the lower grades, for which the figure was approximately 46%. These results suggest that bicycle traffic safety education is important, beginning early with students in the lower grades of elementary school or at home, to make young bicycle riders understand the importance of observing safety regulations.
6. Summary and Future Issues
The purpose of this study was to identify the causes of traffic accidents among children riding bicycles. Utilizing traffic accident statistics maintained by the Ishikawa Prefectural Police Headquarters, we analyzed the relationships between the ages of children riding bicycles and violations of traffic laws and ordinances.
Among the age groups considered, elementary school students had the lowest rate of accidents without violations at intersections. Since elementary school students are generally considered to have received traffic safety education at least once while in school, it is possible that their knowledge of traffic rules learned through this education is not retained or that their understanding of the rules is insufficient. Therefore, it is important that we create the education opportunity for parents to teach their children as well as receive road safety education by a school and the area. For accidents in which violations occurred, while “failure to stop” violations were the most common type for accidents involving elementary school students. It is guessed at the stage of the elementary school students, that we cannot recognize, is a possible danger phenomenon at intersections. Therefore, we think that it is important that we plan the improvement of the risk prediction ability to foresee the future by letting you understand the necessity of stopping at intersections.
Among all the age categories, lower-grade elementary school students had the lowest rates of accidents at non-intersection locations in which there was no violation on the part of the bicyclist. Involvement in accidents associated with unsafe driving violations (failure to observe safety regulations) was particularly common among lower-grade elementary school students compared to other age groups. These results suggest that it is important to conduct bicycle traffic safety education early on—in the lower grades of elementary school or the home—to make young riders understand the importance of observing safety regulations.
In this study, we conducted a macroscopic analysis of the relationships between the ages of bicyclists involved in traffic accidents and the occurrence of violations of traffic laws and ordinances. However, it is reasonable to expect that children and adults will tend to ride bicycles in different road traffic environments with different levels of bicycle traffic. Therefore, in the future, it will be necessary to analyze the relationship between age and the violations of laws and ordinances in bicycle accidents that occur in more limited road traffic environments (e.g., narrow street intersections with no signal control) and to further clarify the traffic violations that are most common in accidents involving children who ride bicycles.
We found that more than 20% of the accidents involving bicycle-riding children did not involve any traffic violations. As the reduction in these types of traffic accidents is important, a detailed analysis is needed to understand the specific violations of laws and ordinances committed by other parties in such accidents and to ascertain the most common locations of accidents in which there is no violation on the part of the bicyclist. This study provided the suggestion that a difference in the violation rate was seen in accordance to age groups. However, we have a problem because there are a few samples who were 18 years or younger because we subdivided an age group. We secure the number of the samples by performing a continuous data collection, and it will be necessary to clarify the statistical grounds, such as the characteristics of the violation age group, by a statistical test in the future.
Author Contributions
Conceptualization, M.F., H.O., Y.M. and J.T.; methodology, H.O. and Y.M.; software, H.O. and Y.M.; validation, H.O. and YM.; formal analysis, H.O.; investigation, M.F., H.O., Y.M. and J.T.; resources, M.F.; data curation, M.F., H.O., Y.M. and J.T.; writing—original draft preparation, H.O.; writing—review and editing, M.F., H.O., Y.M. and J.T.; visualization, M.F., H.O., Y.M. and J.T.; supervision, M.F.; project administration, M.F. and J.T.; funding acquisition, M.F. and J.T. All authors have read and agreed to the published version of the manuscript.
Funding
This research received no external funding.
Institutional Review Board Statement
Not applicable.
Informed Consent Statement
Not applicable.
Data Availability Statement
Not applicable.
Conflicts of Interest
The authors declare no conflict of interest.
References
- National Police Agency Traffic Bureau. Traffic Accidents in the Year 2020; National Police Agency Traffic Bureau: Tokyo, Japan, 2021.
- Ministry of Land, Infrastructure, Transport and Tourism. Current Status of Bicycle Utilization. In Proceedings of the 1st Expert Meeting in 2020 for the Promotion of Bicycle Utilisation, 2020; p. 6, Document 2. [Google Scholar]
- Ministry of Land, Infrastructure, Transport and Tourism. How to Proceed with Road Traffic Safety Measures Based on the 11th Basic Plan for Traffic Safety (2021–2025). In Proceedings of the 75th Meeting of the Basic Policy Group of the Roads Subcommittee of the Council for Social Infrastructure Development, 2021; p. 23, Document 4. [Google Scholar]
- Cabinet Office. 11th Basic Plan for Traffic Safety. In White Paper on Traffic Safety in Japan 2021; Cabinet Office: London, UK, 2021. [Google Scholar]
- Miyazaki, M.; Morimoto, A. Empirical study on traffic accidents involving children on school routes. J. City Plan Inst. Jpn. 2016, 51, 649–654. [Google Scholar] [CrossRef]
- Fukawa, A.; Inagaki, T.; Kobayakawa, S.; Terauchi, S. An experimental study on parents’ recognition of practical safety issues of children for traffic safety education about road-crossing judgment. JSTE J. Traffic Eng. 2018, 4, A_30–A_37. [Google Scholar]
- Inagaki, T.; Terauchi, Y.; Ohkura, M. An experimental study on road-crossing judgment characteristics of children on a residential street. J. Jpn. Soc. Civ. Eng. Ser. D3 (Infrastruct. Plan Mgmt) 2015, 71, I_665–I_671. [Google Scholar]
- Inagaki, T.; Kobayakawa, S.; Terauchi, Y.; Wada, D. A study on road-crossing judgment characteristics of children focused on vehicle cognition condition. J. Traffic Eng. 2017, 3, A_215–A_222. [Google Scholar]
- Inagaki, T.; Kobayakawa, S.; Terauchi, Y.; Aoyama, E. A study of effect upon parents of information provision about children’s road-crossing judgments. J. Jpn. Soc. Civ. Eng. Ser. D3 (Infrastruct. Plan Mgmt) 2016, 72, I_985–I_992. [Google Scholar]
- Inagaki, T.; Kobayakawa, S.; Fukawa, A.; Terauchi, Y. An experimental study on possibilities and challenges about parents’ guidance of children’s judgments about crossing a residential street. J. Jpn. Soc. Civ. Eng. Ser. D3 (Infrastruct. Plan Mgmt) 2018, 74, I_1349–I_1359. [Google Scholar]
- Ohtani, A. Effectiveness evaluation of traffic safety education for accident reduction: Using traffic education for children as an example. J. Occup. Saf. Health 2017, 10, 127–131. [Google Scholar]
- Motoda, Y.; Usami, S. A literature survey on the safety of bicycles on sidewalks. Civ. Eng. Plan Res. Lect. Abstr. 2014, 49. [Google Scholar]
- Harada, N.; Inagaki, T.; Kobayakawa, S.; Yamanaka, H. An analysis of near-miss accidents related to two-way bicycle traffic on sidewalk: Conflict evaluation using taxis’ driving recorder data. J. Traffic Eng. 2018, 4, A_23–A_29. [Google Scholar]
- Ogawa, K. A comparative analysis of the traffic accident probability of bicycles between origin and destination for bicycle users considering the number of road crossings. J. Jpn. Soc. Civ. Eng. Ser. D3 (Infrastruct. Plan Mgmt) 2016, 72, 288–303. [Google Scholar]
- Yokozeki, T.; Hagita, K.; Yano, N.; Mori, K. The risk of traffic accident by bicycle’s traffic pattern: In the straight road with sidewalk. J. Jpn. Soc. Civ. Eng. Ser. D3 (Infrastruct. Plan Mgmt) 2016, 72, I_1095–I_1104. [Google Scholar]
- Hagita, K.; Mori, K.; Yokozeki, T.; Yano, N. An analysis of intersection bicycle accidents focusing on the travel direction of bicycles. J. Jpn. Soc. Civ. Eng. Ser. D3 (Infrastruct. Plan Mgmt) 2014, 70, I_1023–I_1030. [Google Scholar]
- Hagita, K.; Yokozeki, T. Comparison of traffic volume and accident characteristics by bicycle direction in a cycling space. J. Jpn. Soc. Civ. Eng. Ser. D3 (Infrastruct. Plan Mgmt) 2019, 75, I_493–I_506. [Google Scholar]
- Hagita, K.; Yokozeki, T. Comparison of accidents involving road bicycles in Shizuoka Prefecture by traffic direction. J. Jpn. Soc. Civ. Eng. Ser. D3 (Infrastruct. Plan Mgmt) 2019, 75, I_989–I_998. [Google Scholar]
- Kohsaka, A.; Miyamoto, K.; Maekawa, H. Analysis of traffic accidents on carriageways where bicycle lanes are installed in Tokyo. J. Traffic Eng. 2017, 3, 21–28. [Google Scholar]
- Yamanaka, H.; Hamaguchi, K.; Mikuni, S.; Kojima, T. Analysis of effects of bicycle lanes on residential streets from the perspective of bicycle behavior at intersections. J. Traffic Eng. 2018, 4, A_34–A_39. [Google Scholar]
- Yamanaka, H.; Harasawa, T.; Nishimoto, N. Evaluation of cyclists’ sense of safety on various in-road bicycle traffic spaces. J. Traffic Eng. 2017, 3, A_15–A_21. [Google Scholar]
- Zou, Y.; Ding, L.; Zhang, H.; Zhu, T.; Wu, L. Vehicle acceleration prediction based on machine learning models and driving behavior analysis. Appl. Sci. 2022, 12, 5259. [Google Scholar] [CrossRef]
- Ye, X.; Zhu, Y.; Wang, T.; Yan, X.; Chen, J.; Ran, B. Level of Service Model of the Non-Motorized Vehicle Crossing the Signalized Intersection Based on Riders’ Perception Data. Int. J. Environ. Res. Public Health 2022, 19, 4534. [Google Scholar] [CrossRef]
- Liu, L.; Ye, X.; Wang, T.; Yan, X.; Chen, J.; Ran, B. Key Factors Analysis of Severity of Automobile to Two-Wheeler Traffic Accidents Based on Bayesian Network. Appl. Sci. 2022, 19, 6013. [Google Scholar] [CrossRef]
- Wang, T.; Xie, S.; Ye, X.; Yan, X.; Chen, J.; Li, W. Analyzing E-Bikers’ Risky Riding Behaviors, Safety Attitudes, Risk Perception, and Riding Confidence with the Structural Equation Model. Appl. Sci. 2020, 17, 4763. [Google Scholar] [CrossRef] [PubMed]
- Nakamura, A.; Ohmori, N.; Harata, N. Education of bicycle traffic safety in an elementary school. J. Urban Plan. 2006, 583–588. [Google Scholar]
- Toda, H.; Ogura, T. Impact of head injury collision site in child bicycle accidents. J. Jpn. Soc. Commun. Sci. 2019, 18, 28–34. [Google Scholar]
- Kotake, Y.; Hino, Y.; Yoshida, N. Studies on issues of bicycle awareness and traffic safety education for children and students. J. Jpn. Soc. Civ. Eng. Ser. D3 (Infrastruct. Plan Mgmt) 2012, 68, I_1185–I_1191. [Google Scholar]
- Yano, N.; Mori, K. The relationship between children’s and students’ grades and the number of traffic fatalities and injuries while walking and bicycling: Focusing on changes after entering school. J. Traffic Psychol. 2019, 35, 10–25. [Google Scholar]
- National Police Agency. Road Traffic Act; National Police Agency: Budapest, Hungary, 1960.
- Nakanishi, M. Education for cyclists. IATSS Rev. 2016, 41, 127–135. [Google Scholar]
- Estimated Population of Ishikawa Prefecture by Age Group. Available online: http://toukei.pref.ishikawa.jp/search/min.asp?sc_id=119 (accessed on 3 June 2021). (In Japanese).
- Bicycle Traffic. Available online: https://www.mlit.go.jp/common/001085121.pdf (accessed on 3 June 2021). (In Japanese).
| Publisher’s Note: MDPI stays neutral with regard to jurisdictional claims in published maps and institutional affiliations. |
© 2022 by the authors. Licensee MDPI, Basel, Switzerland. This article is an open access article distributed under the terms and conditions of the Creative Commons Attribution (CC BY) license (https://creativecommons.org/licenses/by/4.0/).


