Article

Smart Traffic Data for the Analysis of Sustainable Travel Modes

by
Zoi Christoforou
1,2,
Christos Gioldasis
1,*,
Yeltsin Valero
2 and
Grigoris Vasileiou-Voudouris
1
1
Department of Civil Engineering, University of Patras, Panepistimioupoli Patron, 265 04 Patras, Greece
2
COSYS-GRETTIA, University Gustave Eiffel, IFSTTAR, F-77447 Marne-la-Vallée, France
*
Author to whom correspondence should be addressed.
Sustainability 2022, 14(18), 11150; https://doi.org/10.3390/su141811150
Submission received: 28 July 2022 / Revised: 28 August 2022 / Accepted: 30 August 2022 / Published: 6 September 2022

Abstract

:
We present and validate the image analysis algorithm μ-scope to capture personal mobility devices’ (PMDs) movement characteristics and extract their movement dynamics even when they interact with each other and with pedestrians. Experimental data were used for validation of the proposed algorithm. Data were collected through a large-scale, semicontrolled, real-track experiment at the University of Patras campus. Participants (N = 112) included pedestrians, cyclists, and e-scooter drivers. The experiment was video recorded, and μ-scope was used for trajectory extraction. Some of the participants had installed, beforehand, the Phyphox application in their smartphones. Phyphox accurately measures x-y-z acceleration rates and was used, in our case, as the baseline measurement (i.e., “ground truth”). Statistical comparison between Phyphox and camera-based measurements shows very low difference in most cases. High pedestrian densities were the only case where relatively high root mean square errors were registered. The proposed algorithm can be thus considered capable of producing reliable speed and acceleration estimates. Low-quality conventional smartphone cameras were used in this experiment. As a result, the proposed method can be easily applied to all urban contexts under normal traffic conditions, but eventually not in the case of special or emergency events generating very high pedestrian densities.

1. Introduction

Personal mobility devices (PMDs) are an alternative and sustainable urban mobility mode which enjoy increasing popularity. As the number of PMD users increases, urban transportation systems become more complex and safety concerns arise [1]. E-scooters are among the most popular PMDs [2]. The growing popularity of e-scooters has attracted significant research interest. The focal topics include mode displacement [3,4] and general mobility patterns [5,6,7], health and environmental impact [6,8], and safety [9]. The analysis of spatiotemporal usage data and surveys among users are the main methods used by researchers. The spatiotemporal data are obtained through the integrated Global Positioning System (GPS) devices which are typically installed on shared e-scooter vehicles [10,11,12,13,14,15,16,17,18,19,20,21], geofence [22] or social media posts [23]. Most of these studies, which were mainly conducted in the United States [10,11,12,13,14,15,16,17,18,19,23], but also in Europe [20,21,22], found that e-scooters are mostly used on the weekends and in afternoons. Surveys have also been frequently used to identify the users’ attitudes and perceptions. Mobility behavior [24,25,26,27,28,29,30,31], risk-taking activities while riding [32] and use of infrastructure by riders [33] are topics which were studied with surveys, revealing that e-scooters are popular among young, male users, who are more inclined to risk-taking.
Despite the recent research focus on e-scooters, several knowledge gaps remain to be addressed [34]. In particular, the microscopic traffic characteristics and general PMD movement dynamics are not sufficiently explored. The Social Force Model (SFM) was proposed to model the dynamic behavior of Segways and their interactions with pedestrians [35]. Valero et al. (2020) also calibrated SFM parameters for the case of e-scooters based on a database obtained through image processing [36]. However, the SFM is not scalable to larger contexts while several typical traffic parameters, such as intervehicular distance, time gap, time-to-collision etc., remain unknown. Those parameters are yet important for the integration of e-scooters in traffic models, socioeconomic evaluation of new micromobility infrastructure and risk assessment, among others. Furthermore, e-scooter traffic is not homogeneous, as PMDs may share road space with cars, motorcycles, bicycles, or even pedestrians. The analysis of e-scooter interaction with other road users in various types of infrastructure is of particular importance, as the willingness to use an e-scooter is found to depend on the type of infrastructure [37]. Infrastructure was found to be a major deterrent for the use of e-scooters among nonusers [38]. The coexistence of pedestrians and cyclists in shared spaces has been found to be not harmonious, due to their different traffic characteristics such as speed and maneuverability [39].
A major barrier to microscopic e-scooter analysis is the absence of relevant data and tools as car detection devices (cameras, radars, etc.) and data treatment software tools are not suitable for PMD detection and analysis. As a result, researchers often turn to experiments and ad hoc measurement devices. For example, virtual reality enabled pedestrian-e-scooter interaction (face-to-face interaction and overtaking) at different speed regimes in [40]. The highest speed regime was considered to be the most unsafe by all participants, regardless of the role which was assigned to them (i.e., pedestrian or e-scooter rider). Another experiment revealed the sensitivity of the pedestrians to being face-to-face with a PMD through the conduction of a controlled experiment [41]. The trajectory dataset allowed the calibration of a social force-based model, which estimates a safety index. With a field eye tracker experiment in Poland, it was found that e-scooter riders observe the road ahead more as compared to pedestrians, who, on the other hand, look more frequently at the sides [42]. Unmanned Aerial Vehicles have also been used to capture the interactions of pedestrians and PMDs users. The results indicate that the use of nonbicycle PMDs increases the likelihood for a PMD user to be involved in a near-miss collision [43]. Lidar, Inertial Measurement Unit and potentiometers have been used in field trials to measure braking and steering performance indicators [44].
This paper presents and assesses a novel software tool for image analysis, μ-scope, that only requires regular low-quality camera recordings (e.g., smartphone camera), but is capable of detecting and analyzing e-scooter movement. The validation of the μ-scope algorithm is achieved through a real-track, semicontrolled experimental set and comparison of data to a well-established accelerometer smartphone application, i.e., Phyphox, that is considered as the ground-truth measurement. The experiment took place in the University of Patras campus, Greece, and involved over 100 participants acting either as cyclists, pedestrians or e-scooter riders. The accuracy of the algorithm was challenged at different contexts: varying traffic densities, infrastructure (cycling paths or lanes, etc.) and user behaviors (distraction, etc.). Accuracy was measured using the standard deviation of the residuals, known as Root Mean Squared Error (RMSE). The results are promising and show the field of relevance of μ-scope and indicate future research directions for further improvement. The added value of this research is thus twofold. First and foremost, it lays the groundwork for low-cost and reliable sensing of PMDs in urban contexts empowering public authorities with important data and paving the way for future microscopic traffic and safety analyses. Second, trajectory and acceleration data obtained through the experiment allow one to gain new insights into e-scooter dynamics and interactions with other road users.
The remainder of this paper is organized as follows: Section 2 presents the experimental set-up, the image analysis algorithm μ-scope, Phyphox application and the validation methodology. Section 3 presents validation results for various scenarios. Section 4 presents the discussion and conclusions as well as suggestions for future work.

2. Materials and Methods

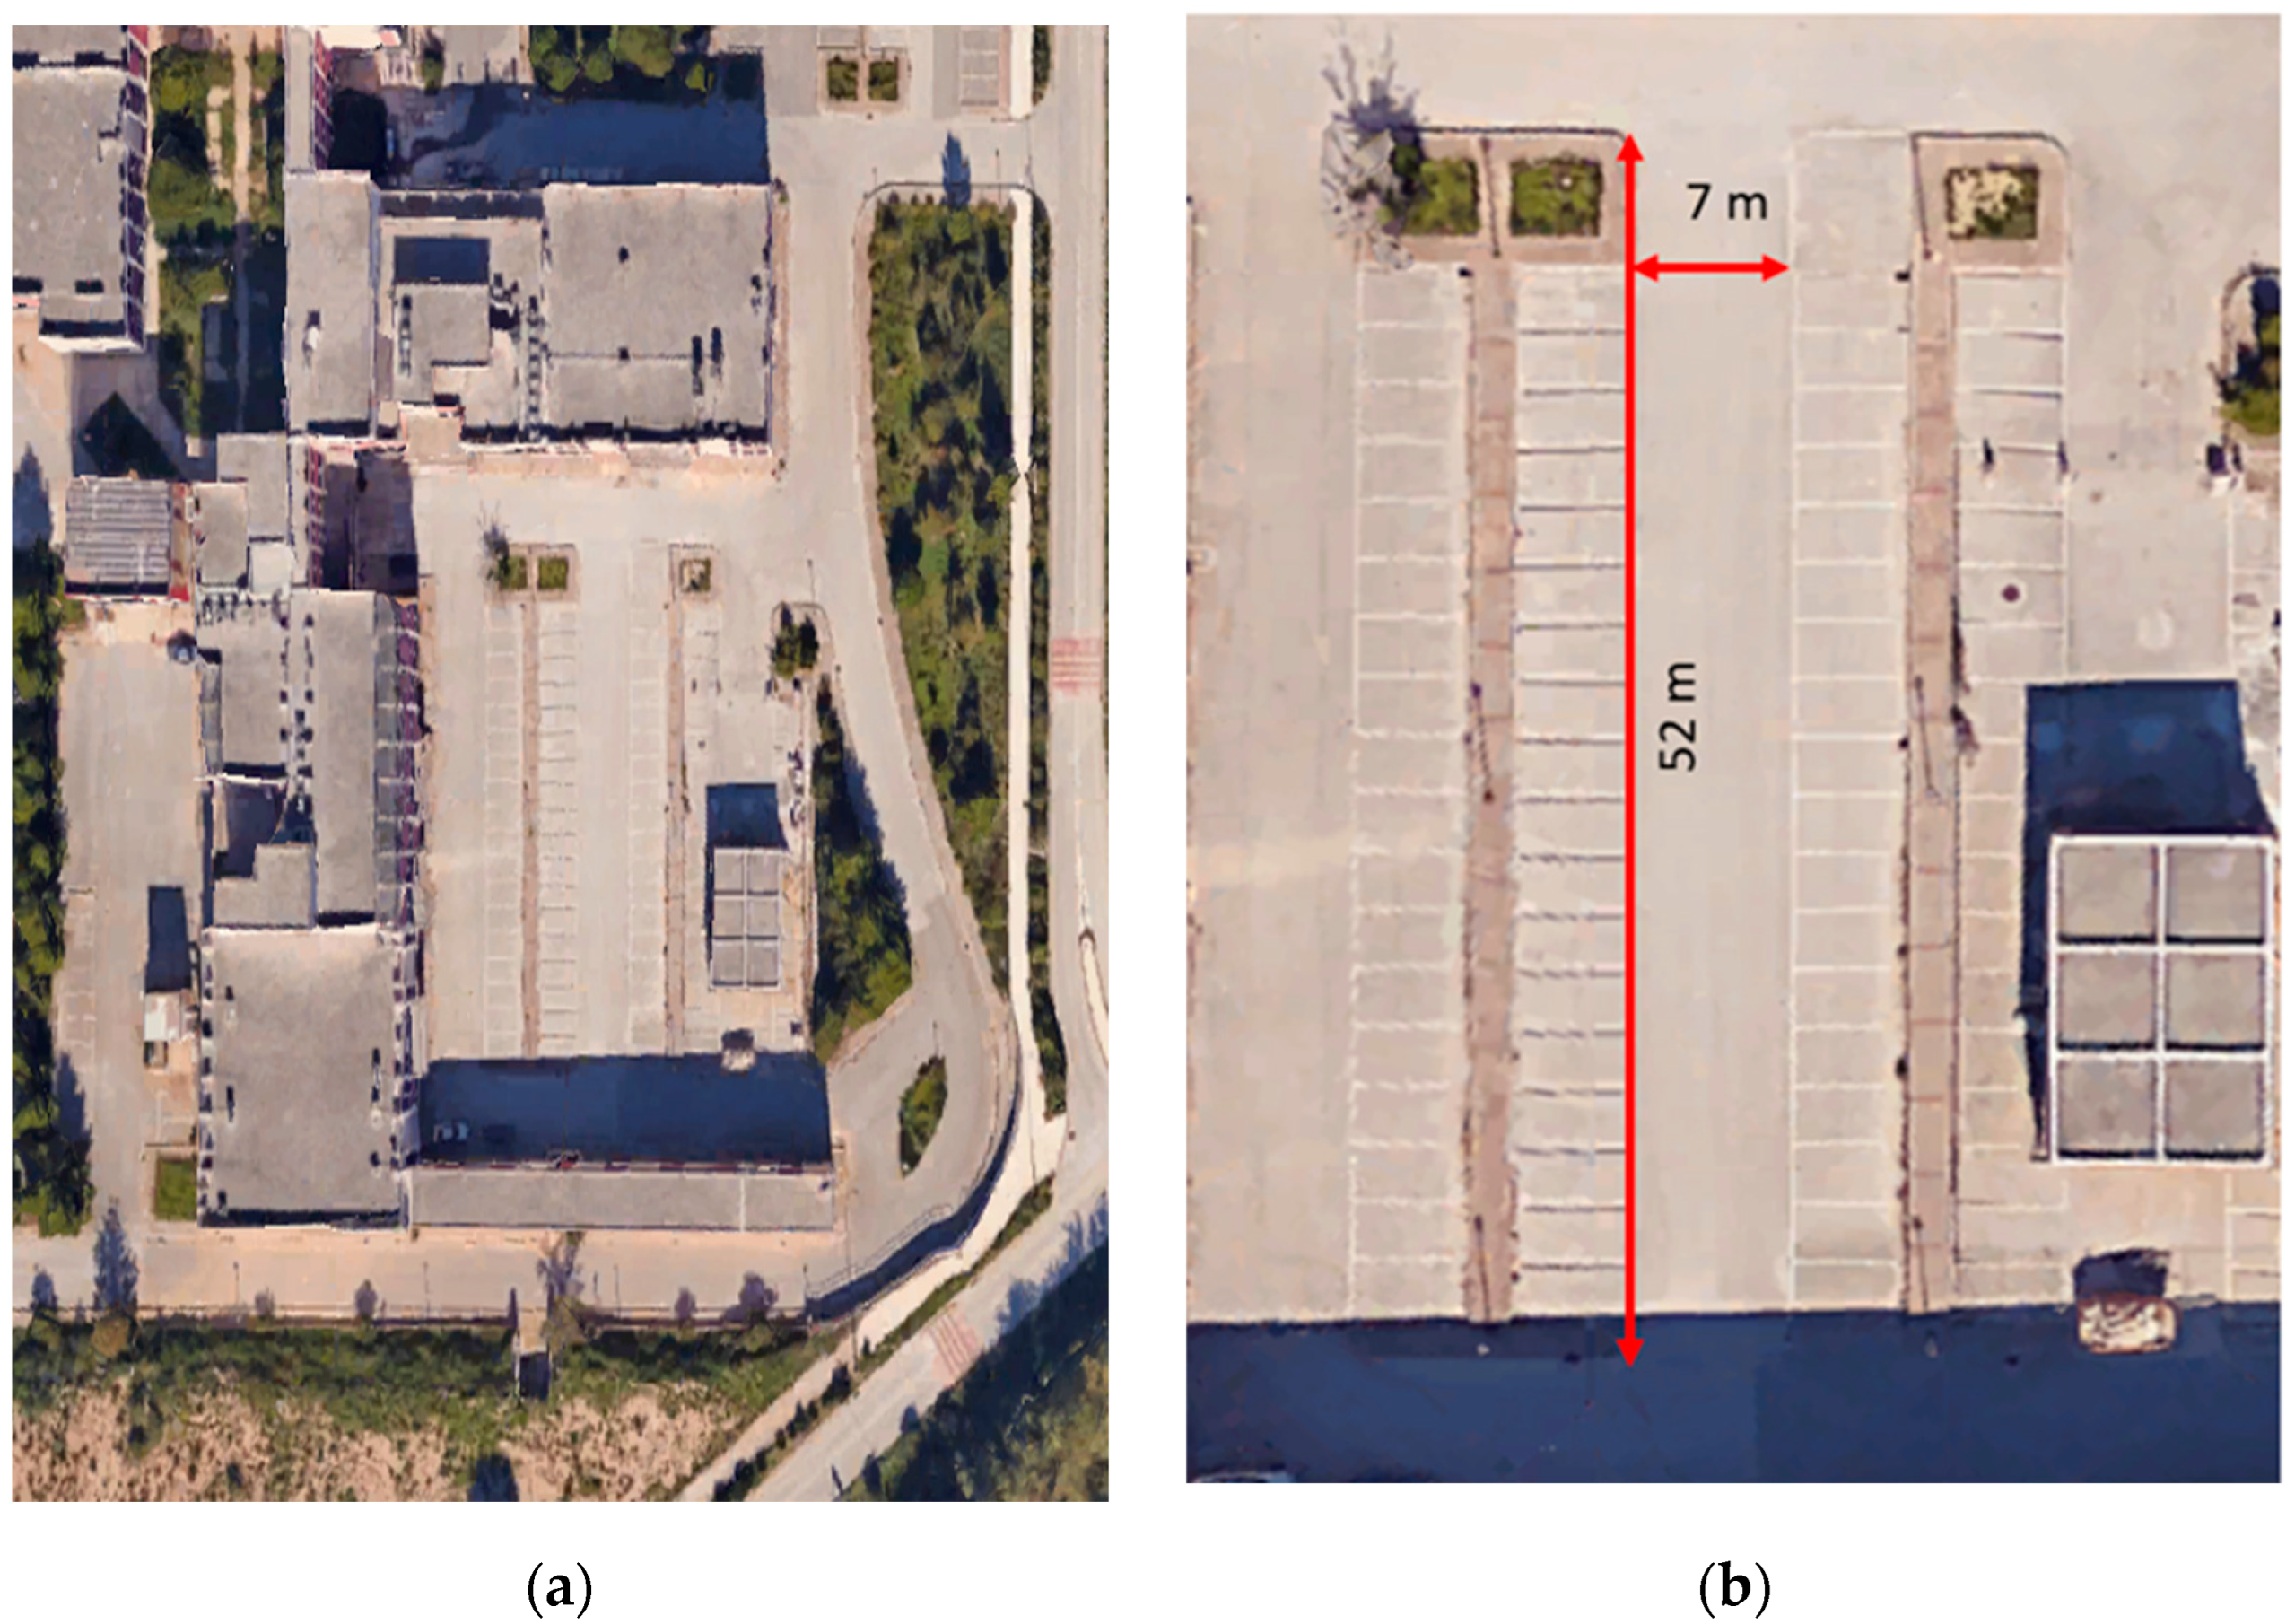
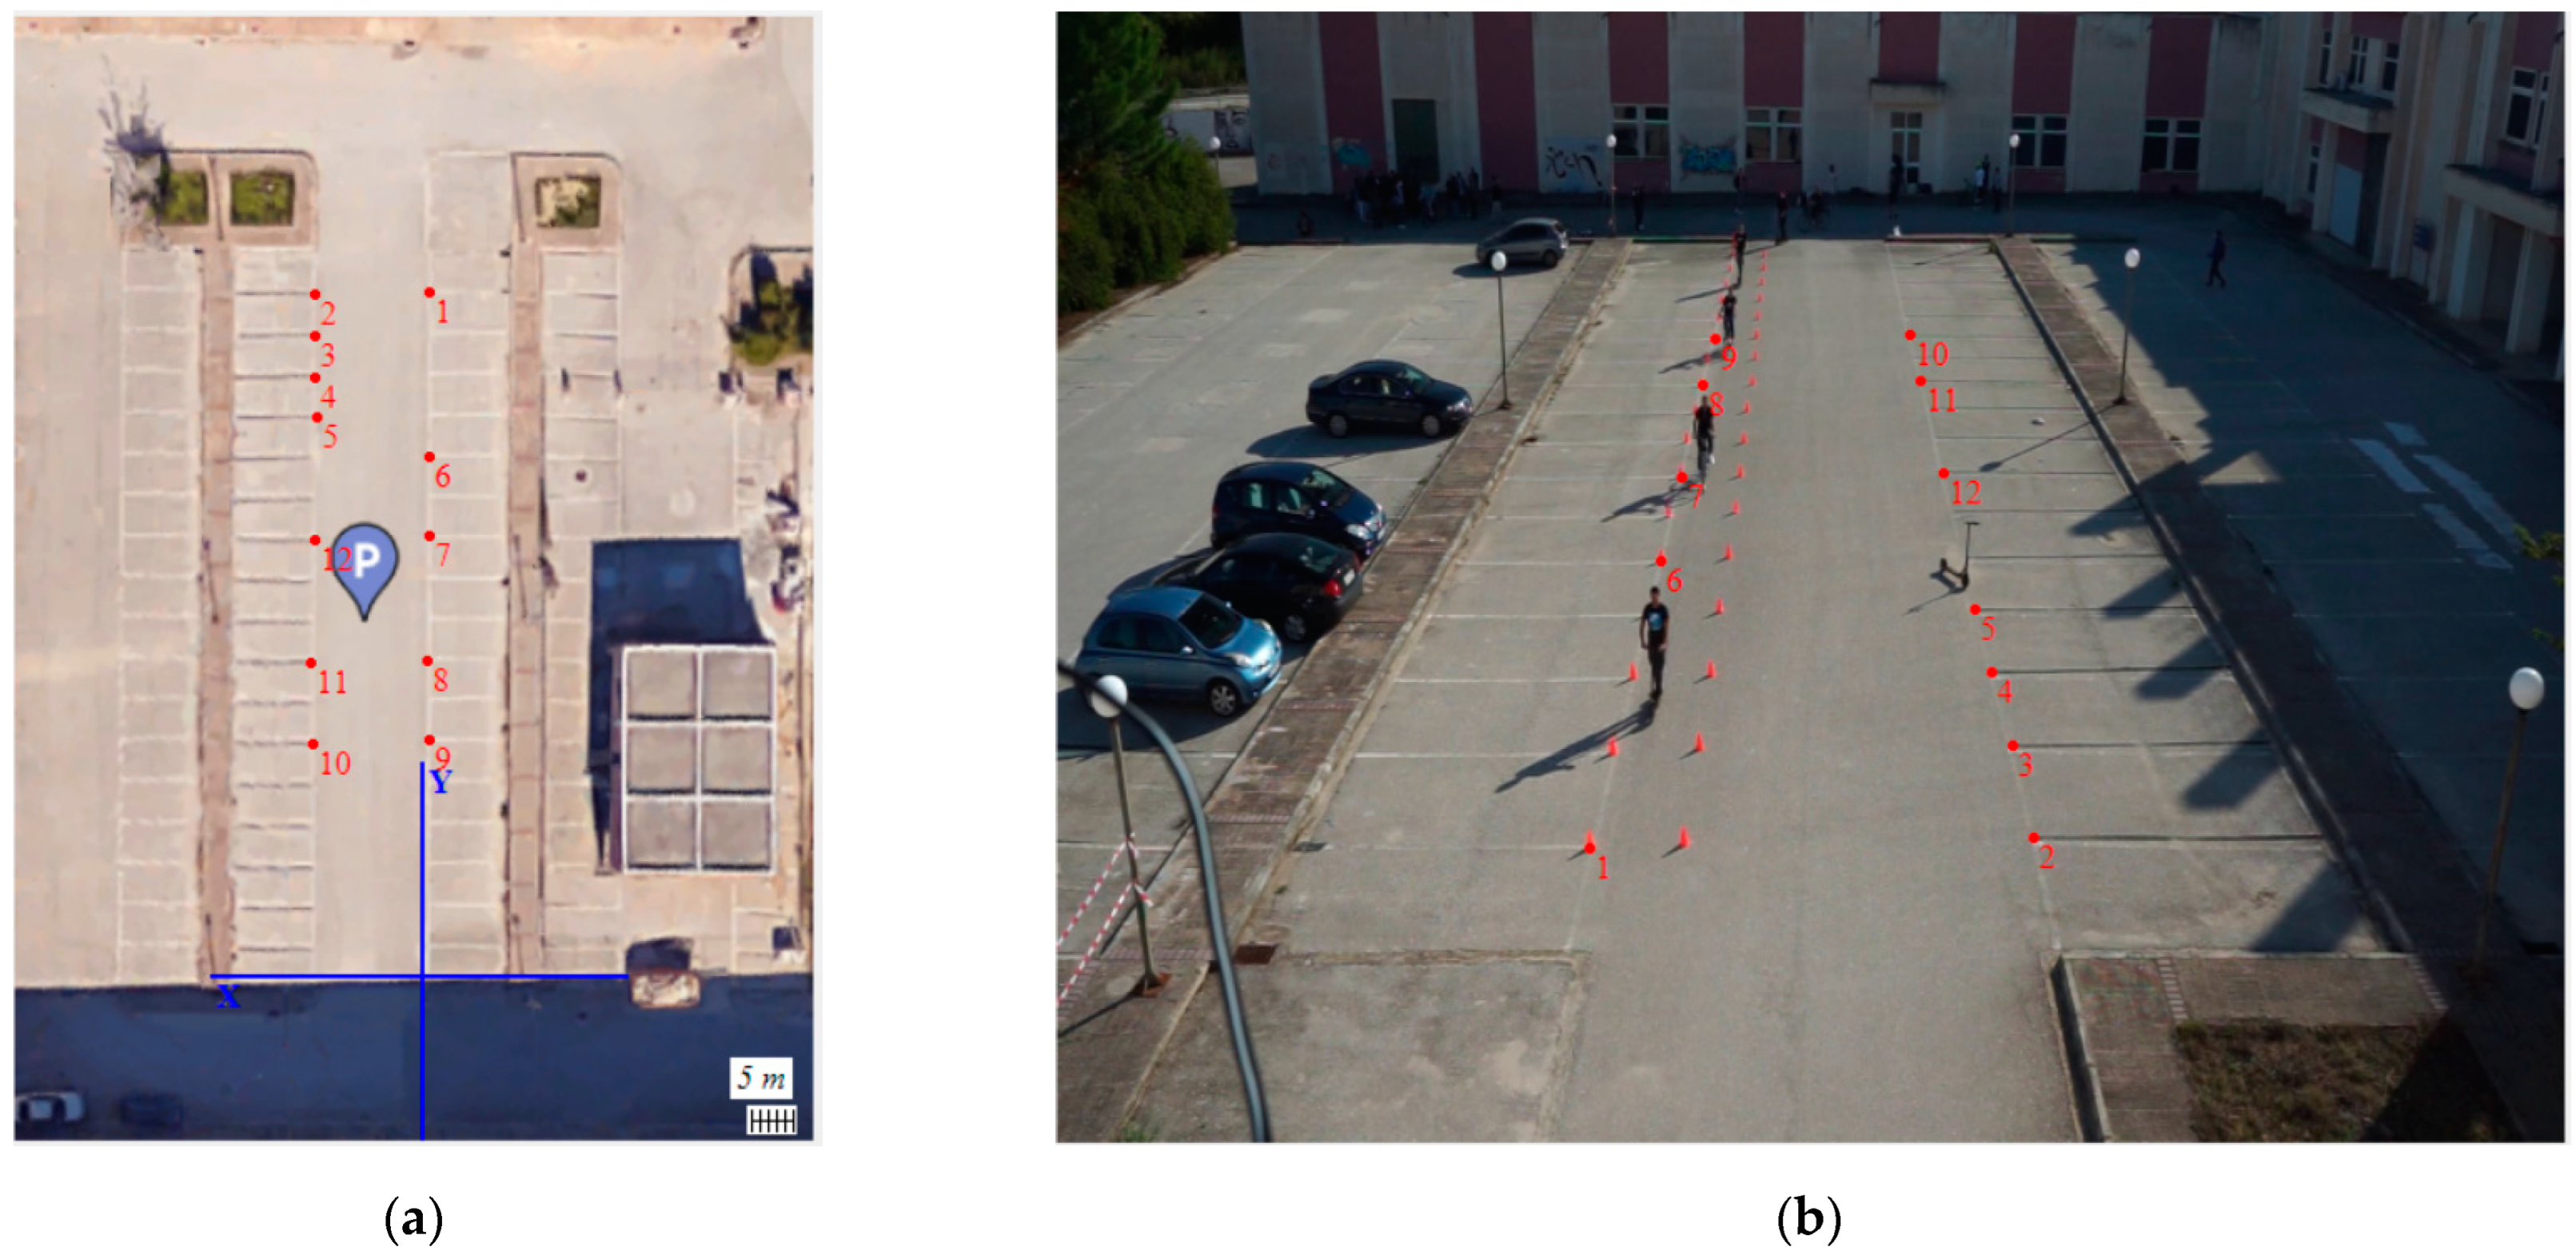
2.1. Experimental Set-Up

The experiment took place in October 2021 at the parking lot of the Department of Civil Engineering of the University of Patras. It is thus a real-track environment that lasted approximately 75 min. The area context of the field of the experiment is presented in Figure 1a. The dimensions of the parking lot are displayed in Figure 1b. This selected area is a straight road section, suitable for the observation and video recording of interactions between e-scooters, bicycles and pedestrians. It is also a flat road section, preventing any effects on the acceleration of the e-scooters from the ground gradient. For the purposes of the experiment and for the safety of participants, normal car traffic was prohibited during the experiment. General instructions were given to participants in the beginning of the experiment, and they were free to move around the track as they wished afterwards. In that sense, the experiment was semicontrolled, as ‘external’ traffic was controlled while ‘internal’ traffic was not.

2.1.1. E-Scooter and Smartphone Characteristics

Two types of e-scooters were used for the experiment: Fiat 500 and Xiaomi 8ΤΕV Micro. In total, six e-scooters were used, while three participants had installed the Phyphox application. The Phyphox application uses the sensors of the mobile phone to estimate the acceleration rates [45]. It is a robust tool that has been used in previous research [46]. Table 1 presents the characteristics of the two e-scooter models. Table 2 presents the characteristics of the smartphones and accelerometers of equipped riders.

2.1.2. Experimental Scenarios

The design of the experimental scenarios is built varying several mobility and infrastructure parameters. The considered parameters include road width, e-scooter user being distracted, e-scooter’s direction of movement, pedestrian’s direction of movement, pedestrian crowding and existence of a crossing point for pedestrians. Road width is decided according to minimum values set by the Greek regulations (ΦΕΚ Β 1053-14.04.2016) for soft mobility infrastructure. It takes up three values (1.5 m for cycle lanes, 2.5 m for cycle tracks and 3.5 m for pedestrianized roads). Distraction refers to whether e-scooter users were distracted by listening to music. The direction of movement of e-scooters and bicycles can be either clockwise (CW) or counter-clockwise (CCW). The crowd of pedestrians is ranked from very low to very high. The existence of a crossing point for pedestrians is a Boolean variable indicating the operation of a crosswalk. The experimental scenarios are summarized in Table 3.

2.2. Image Analysis Software (μ-Scope)

Gathering data from video sources is important to achieve surrogate safety indicators for pedestrian movement [47,48]. Eye-tracking experiments have been used to assess the impact of intersection typology and use of smartphone on pedestrian behavior [49]. Building upon past work [36], we validate the image analysis algorithm μ-scope in different contexts. The algorithm is capable of automatically obtaining real trajectories of pedestrians, bicycles, PMDs and vehicles from videos through image processing techniques. In order to obtain trajectories with μ-scope, preprocessing is required and explained below.

2.2.1. Preprocessing

Step N°1: Create background from video.
In this step, a random frame is obtained from the video (Figure 2). This frame is used to determine the points corresponding to a real-world x-y coordinate system.
Step N°2: Definition of analysis area.
This step consists of indicating the area from which the trajectories are to be obtained, i.e., a mask is defined that defines the analysis area (Figure 3).
Step N°3: Camera calibration.
The T-Analysis software [50] and, specifically, the T-Calibration module is used to calibrate the trajectories extracted from video recording. The trajectory calibration methodology [51] requires one to define reference points in the camera view and provide real-world coordinates (Figure 4).

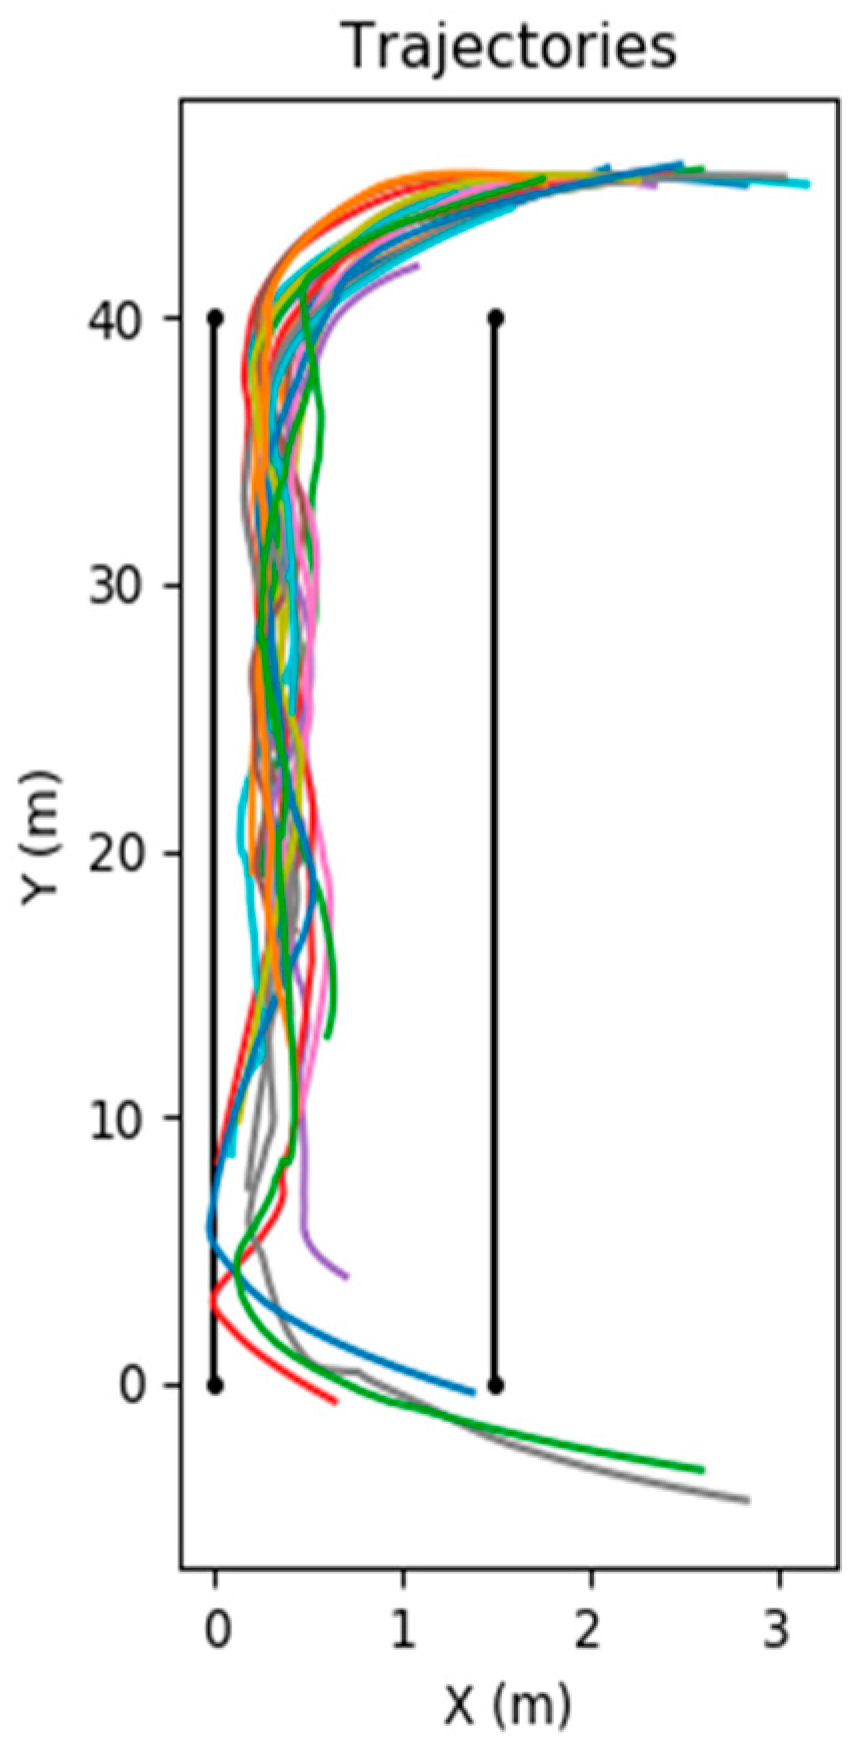
2.2.2. Processing: Trajectory Extraction
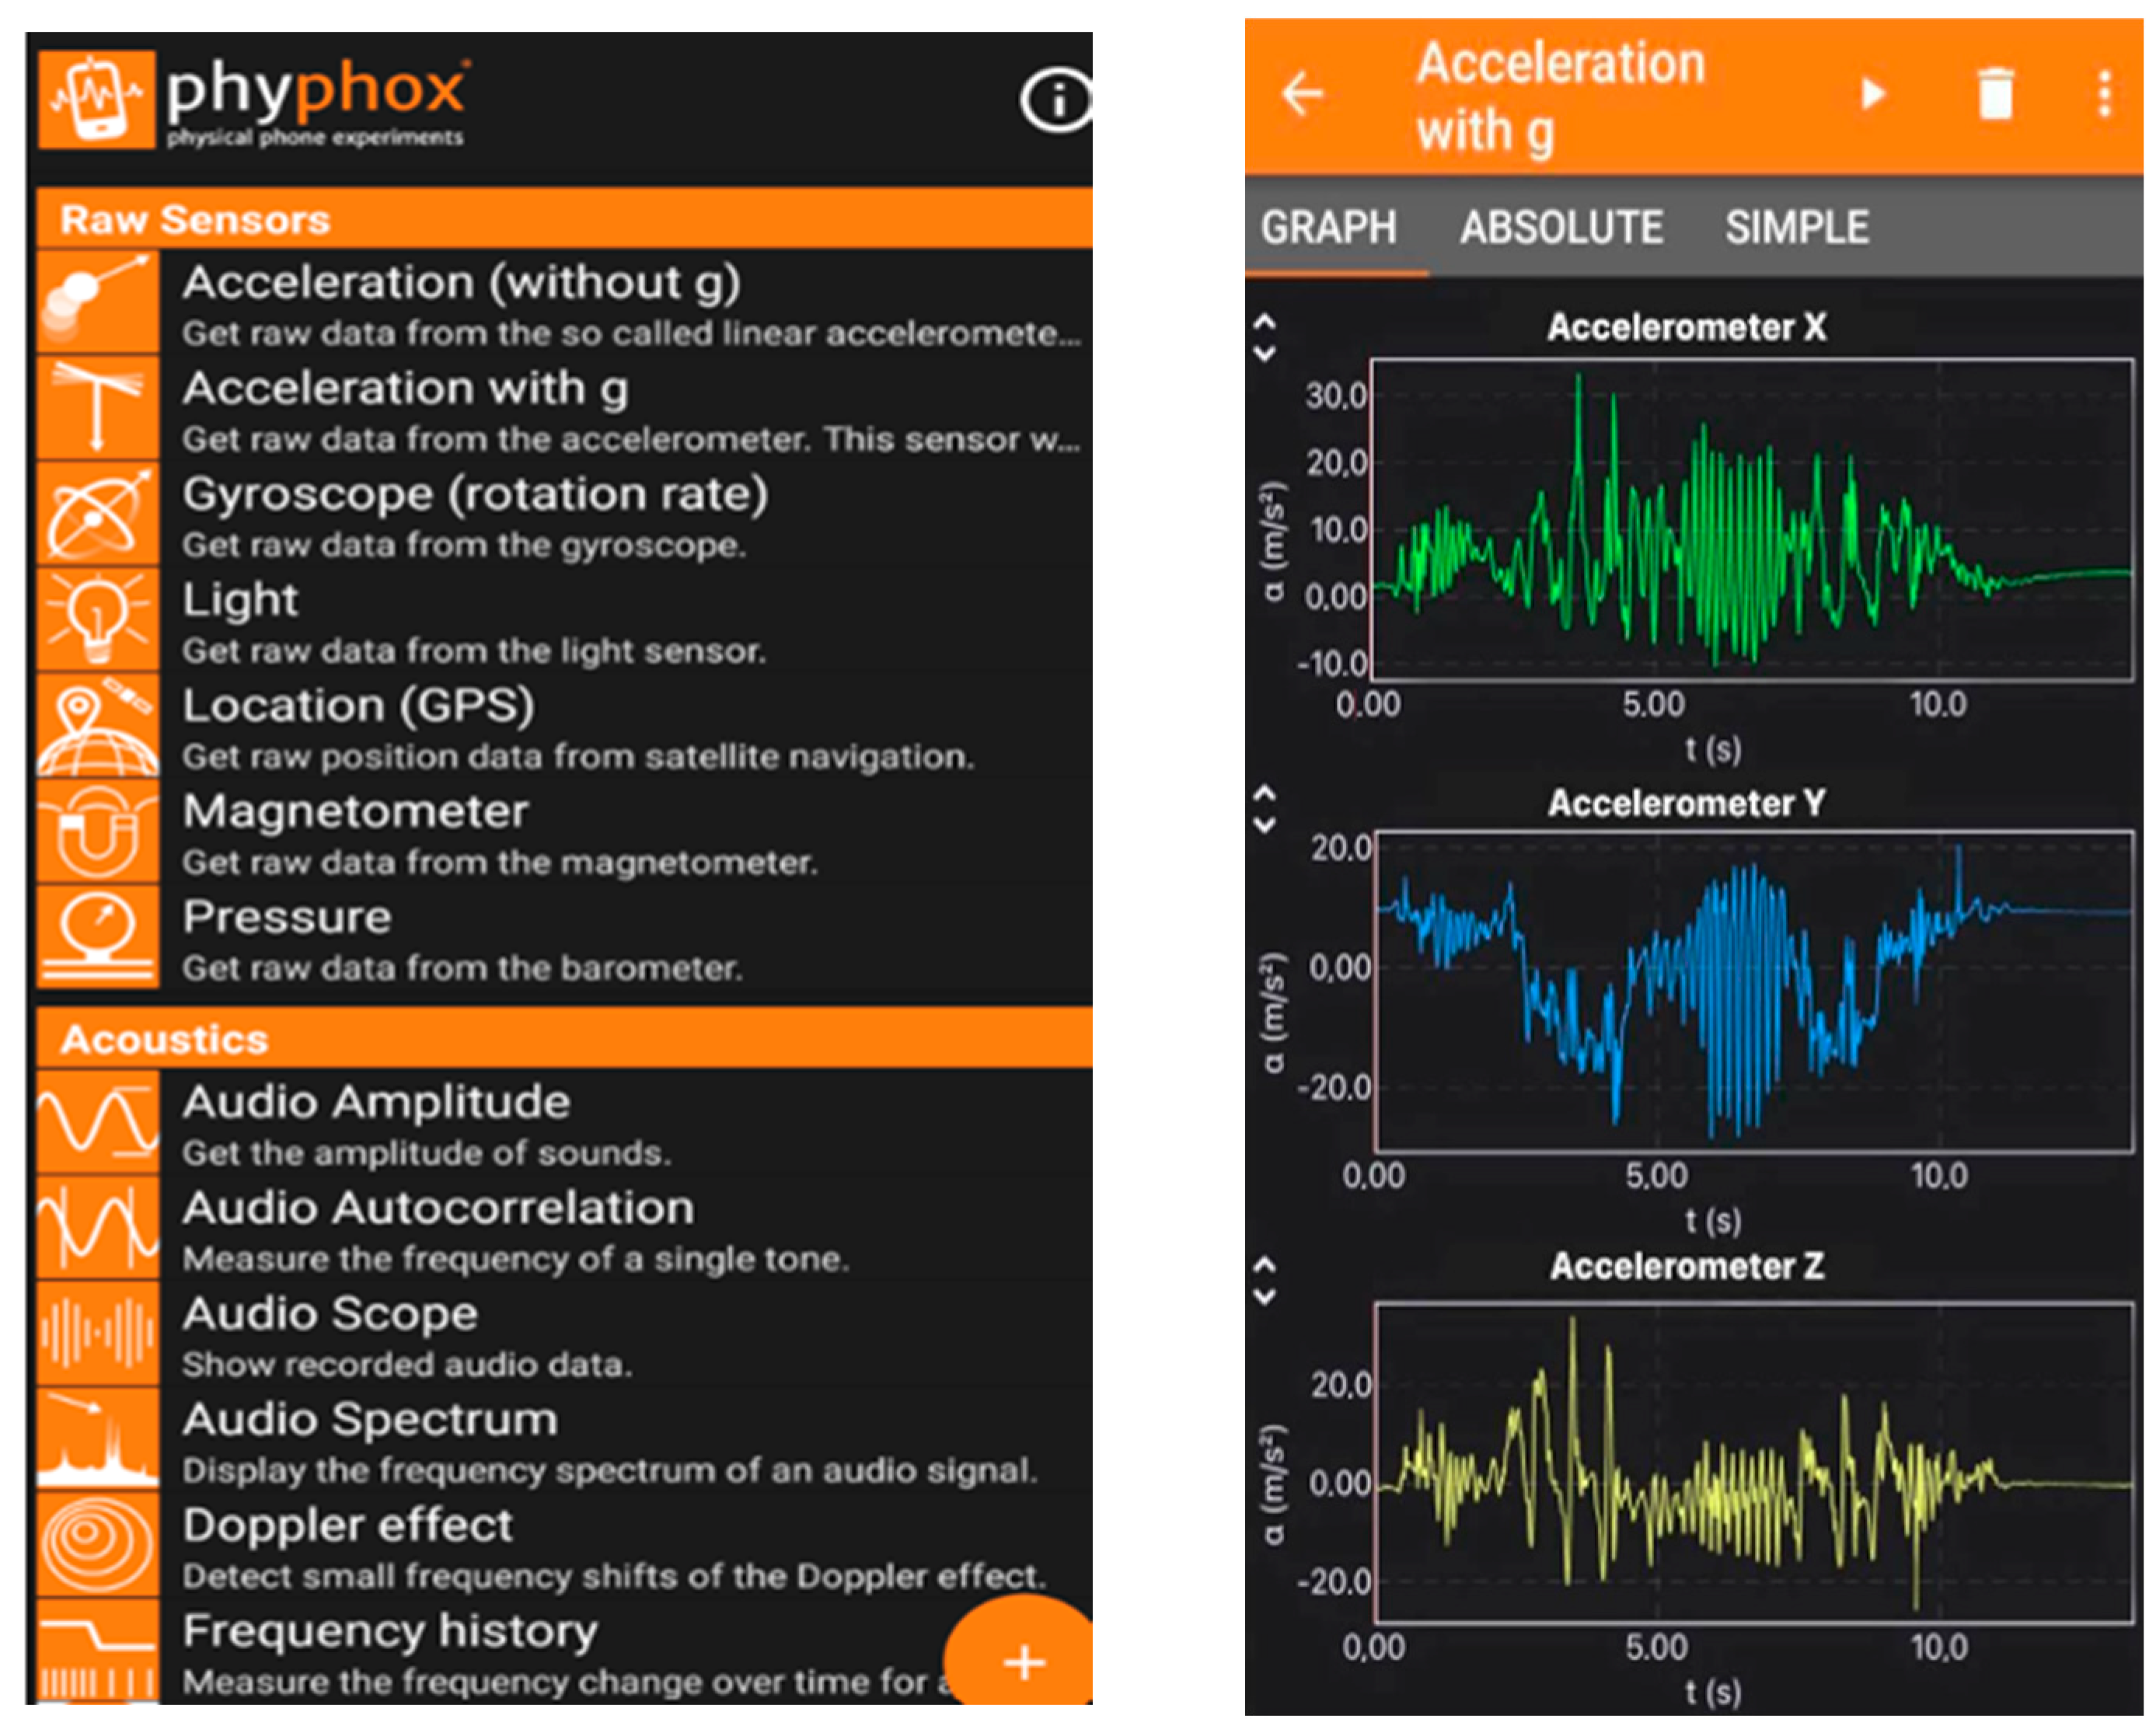
The automated extraction of trajectories consists of three steps: (1) object detection, which is represented by a frame border, (2) object tracking and (3) trajectory extraction with real-world coordinates.
Trajectory extraction in our work is based on YOLO v5 (You Only Look Once) [52] for object detection and classification. YOLO models are able to detect objects with high accuracy, can be used in real-time and are based on convolutional neural networks (CNN). YOLO uses a single neural network to process the whole image. Then, the image is divided into equal parts and, in each of these parts, an object probability is calculated. Then, a nonmaximum suppression is performed to ensure that the object detection is not repeated. In our work, we used the pretrained model YOLOv5m. This model is able to detect and classify cars, bicycles, pedestrians, buses and trucks; however, it is not able to identify a bicycle and its rider as a single object nor an e-scooter and its rider as a single object. That is why additional algorithms were developed to detect the bicycle and its rider as a single object and similarly for e-scooters. An algorithm based on acceleration classification was also developed to differentiate a bicycle from an e-scooter.
For the object tracking process, i.e., to associate a bounding box (Figure 5) detected in one frame of the video with another bounding box in another frame of the video, deep SORT (Simple Online and Real-time Tracking) [53] was used. Deep SORT is an algorithm that has shown remarkable results in the Multiple Object Tracking (MOT) problem. The right part of Figure 5 presents the tracked object and its respective bounding box of a specific time frame. At each bounding box there is a fixed point whose location is tracked. The left part of Figure 5 shows a series of the object’s bounding boxes and the respective red dots, whose consecutive order produces the object’s trajectory. Figure 6 presents the trajectory of each e-scooter with different color.
Finally, based on the tcal file containing the camera calibration data and the trajectories of the tracking process, we obtain the trajectories with real-world coordinates and statistics of velocities and accelerations of each detected object. The speeds and the respective acceleration rates are calculated through trajectory processing.

2.3. Phyphox

The Phyphox application [45] is used to estimate the acceleration of moving objects by utilizing the built-in sensors that each smartphone has. The application was developed by the Second Institute of Physics of the RWTH Aachen University and is available for iOS and android smartphones. Phyphox has been used successfully in smartphone-based experiments [54,55]. So far, Phyphox has been downloaded more than 2 million times. In this study, we select the “Acceleration with g” option, which is provided by the Phyphox application. This means that the sensor will report the Earth’s acceleration of 9.81 m/s2 when the phone is idle. Figure 7 presents some of the physical quantities, which the Phyphox application is capable of measuring.
Phyphox calculates the acceleration in the three vertical axes separately and then aggregates those three by producing the vector sum of the acceleration. In Phyphox, the axes are programmed according to Figure 8. More specifically, the z-axis is perpendicular to the screen pointing out of it, and the x-axis points to the right when the device is in its default position. In practical terms, for phones, this means facing right while looking at the screen in portrait orientation. Finally, the y-axis points up along the long side of the phone.

2.4. Assessment Methodology

After executing the experimental scenarios, we collected Phyphox files, which include the acceleration rates at each timestamp for all experimental scenarios. The recorded acceleration rates cover the approximately 75 min of the experiment’s duration. Depending on the accelerometer, the time-step of recording ranges from 0.005 to 0.007 s. Therefore, we collected approximately 600,000 acceleration rate results. The acceleration rates extracted by the Phyphox software are expressed in the three-dimensional axis, for each axis separately (x-y-z), with ax being the acceleration rate in the x-axis, ay being the acceleration rate in the y-axis and az being the acceleration rate in the z-axis. Equation (1) gives the absolute acceleration rate from the square root of the sum of the squares of the axes x-y-z. The unit of the acceleration rate is m/s2.
Phyphox   ( acceleration ) = a x 2 + a y 2 + a z 2
The data extracted through the image analysis software are expressed in the 2D system, while Phyphox’s program provides the accelerations in the 3D system. This is the main obstacle to comparing the acceleration rate produced by the algorithm to the acceleration rate produced by the Phyphox application. As all the vehicles we consider are e-scooters with their drivers standing on them, the position of the mobile is perpendicular to the ground, with the axis perpendicular to the ground being the y-axis, as shown in Figure 8.
Accelerations in the y-axis are significantly smaller than those in the other axes and are close to zero. This seems reasonable, since the mobile phone remains unmoved in the y-axis as it does not move from the possession of the driver (a minimal movement can be detected, but for our experiment it is considered negligible). Therefore, Equation (1) becomes the vector sum of the other two axes.
Phyphox   ( acceleration ) = a x 2 + a z 2
With the use of Equation (2), the acceleration rate, produced by the application, can be transferred to the two-dimensional system X-Z, which coincides with the two-dimensional measurement system of the X-Y coordinate system of the camera. Nevertheless, the values from the above formula only yield a positive sign, while the camera values can give negative results. For this reason, we converted the above values into an absolute value.
A time adjustment was also found to be necessary for data harmonization. Datasets extracted by Phyphox and μ-scope are expressed in different time-steps. The measurement time-step for the image analysis software is 0.08 s, and 0.005 to 0.01 s with Phyphox. To synchronize the datasets, we select one every sixteen or one every eight accelerations given by Phyphox (0.08/0.005 = 16 or 0.08/0.01 = 8).
Following the adjustment, we use the Root Mean Square Error (RMSE) to aggregate the magnitudes of the errors in the prediction of various data points into a single measure. RMSE is a measure of accuracy to compare prediction errors of different models for a given dataset but not between different datasets, as it directly depends on the scale. Following the calculation of the RMSE, an error analysis is performed to assess the accuracy of μ-scope and to measure the impact of different contexts (road characteristics, rider distraction, traffic direction) on the accuracy. In essence, we suppose here that Phyphox measurements represent the ground-truth, and we validate μ-scope against Phyphox.
RMSE always has a non-negative sign. A value equal to 0 is almost never achieved in practice and indicates a perfect fit to the data. In general, a lower RMSE is better than a higher one. Equation (3) gives the RMSE formula, with n being the number of measurements, y ^ being the μ-scope estimations and y being the Phyphox measured values.
R M S E = i = 1 n y ^ i y i 2 n
Figure 9 indicatively presents both acceleration rates for the 1st e-scooter of S1 along with the speed corresponding to each time point. Similar findings were obtained for all trajectories. A first encouraging remark is that the acceleration curves have close values and follow the same tendency. A second remark is that divergence seems not to have any correlation to speed. As a result, μ-scope can be considered reliable for all velocities in the range of 0–25 km/h. A third observation is that as the e-scooter approaches the camera (i.e., higher time values on the right hand side), the divergence decreases. Therefore, we may reasonably assume that estimation accuracy decreases with distance, with a critical point being at around 30 m from the camera, as discussed below.
Given the practical implications of the location of the camera, we thus measured RMSE as a function of the distance from the camera. To accomplish that, we developed an X-Y system of coordinates, as illustrated in Figure 10. At the intercept point of the two axes, the coordinates x and y are equal to zero. It has to be noted that the intercept point is at the furthest point away from the camera. Therefore, the longer the distance, the closer the e-scooter is to the camera.
In accordance with the coordinate system, we estimate the Euclidean distance for each moving e-scooter (Equation (4)).
d = x 1 x 2 2 y 1 y 2 2
We use the distance d to build graphs which display on the vertical axis the error, i.e., the difference of the RMSE values calculated with the two different methods and the distance on the horizontal axis. Figure 11 presents such graphs for 3 e-scooters. At the beginning of each measurement, the error values are high and have a positive sign, which means that the camera values result in larger values than those of Phyphox. As the measurement progresses, the values decreases and eventually approaches 0. Then, the acceleration rates produced by the software converge to those produced by the Phyphox application.

3. Results

3.1. Error Analysis: Factors Influencing the Accuracy of Measurements

The assessment and validation methodology was then implemented and the RMSE was calculated for all participants who used an e-scooter and had installed the Phyphox applications in their smartphones by comparing the acceleration rates produced by the μ-scope and Phyphox. In this section, we explore the impact of considered factors on the quality of μ-scope estimations. The factors selected for study are:
  • Presence of pedestrians
  • Rider being distracted
  • Road width
  • Direction of PMDs
  • Direction of pedestrians
In all following tables, the units of measurement for acceleration rates is m/s2, and for velocities is m/s. All vehicles presented below are e-scooters.

3.1.1. Presence of Pedestrians across the Study Area

Table 4 presents the RMSE values for all three e-scooters whose users were equipped with the Phyphox application. Depending on the duration of each scenario, each vehicle appeared on camera twice or more, as the track was circular. This explains why there are two RMSE values for the first e-scooter at Scenario S9, while there are four RMSE values for the same e-scooter at scenarios S1, S2, S3, S5, S6 and S8. The scenarios are ranked based on the value of the RMSE. The order of the scenarios (S9 to S7, etc.) is an ascending order of pedestrian presence; S9 for no pedestrian and S4 for important pedestrian crowding. The color scale indicates the magnitude of RMSE value; dark green is used for lower values, whereas dark red is used for higher values. The table caption indicates the color used for each RMSE value range.
A straightforward observation is that pedestrian presence significantly increases the estimation error whose value is not acceptable in the extreme-case scenarios of S3 and S4. In all other cases, RMSE values rarely exceed 0.5 m/s2, and thus, μ-scope can be considered as valid in this range of pedestrian densities. The increase in S3 and S4 may be attributed to sharp braking, to which μ-scope attributes higher values than the application, and primarily the discontinuity of the vehicle trajectory (either due to loss of tracking by the camera or due to the presence of a pedestrian, who hides the e-scooter user from the camera). Conversely, in scenarios with small crowds of pedestrians or only e-scooters and bicycles, the error remains consistently low, as there is continuous contact of the detector with the e-scooter, and only slight interruptions occur.
Figure 12 presents an example of the acceleration of an e-scooter and its speed in the absence of pedestrians (S9). From the beginning of the measurement, the acceleration rates are similar and constant, a fact that is also verified by the speed line. The measurement seems to progress smoothly, with no loss of contact with the vehicle.
Figure 13 presents an example of acceleration rates with high pedestrian presence (S4). In particular, between 1.92 s and 2.24 s, there seems to be loss of contact. After consulting the video, it was confirmed that there were pedestrians in front of the e-scooter, which prevented the camera from capturing the e-scooter.

3.1.2. Road Width

As discussed in Section 2.1.2, three different road widths were tested: 1.5 m, 2.5 m and 3.5 m. Table 3 presents the road width per scenario and Table 5 presents the RMSE values for each scenario. The scenarios are clustered in Table 5 depending on their road width. Within each cluster, scenarios are ranked starting from those with the lowest RMSE. The color scale indicates, again, the magnitude of the RMSE value. Dark green indicates lower values, whereas dark red indicates higher values. The table caption indicates the color used for each RMSE value range. The results indicate that wider roads tend to be associated with higher errors. Further investigation is needed to understand if there is a causal relationship or if this finding may be attributed to the larger crowds of pedestrians.

3.1.3. E-Scooter Direction

We focus here on the S2 and S8 scenarios, where we have two-way cycle paths. In S2, bikes move in the opposite direction of e-scooters and pedestrians. In S8, e-scooters move in the opposite direction of bikes and pedestrians. Table 6 presents RMSE for the movement of the e-scooters, the average error, the average acceleration rates as estimated by μ-scope and Phyphox, as well as the average speed. The changes in the direction of PMDs do not seem to have any significant impact on the accuracy of the algorithm. As a result, μ-scope can be used for both one-way and two-way cycle paths.

3.1.4. Pedestrian Direction

The pedestrians participating in the experiment walked parallel and perpendicularly to the study area in order to reproduce the conditions of a shared urban space (such as a large square) and a cycle path with pedestrian crossing, respectively. In Table 7, scenarios S1 and S3 are presented. These two scenarios were carried out on the same road width, with the same vehicle directions, without driver distraction. In S1, the pedestrians walked parallel to the study area, while in S3, they walked perpendicularly to the study area. We notice that the errors are smaller and more stable in S1 compared to those of S3. In S1, there are much smaller accelerations compared to S3, which is reasonable since in S1, e-scooter users were riding in parallel with the pedestrians. Therefore, there was interaction between them along the study area, causing the PMDs to slow down. In contrast, in S3, there was e-scooter-pedestrian interaction only in the middle of the road, allowing vehicles to accelerate as much as possible after moving away from the pedestrian crossing. The parallel movement of PMDs and pedestrians can be reasonably assumed to interfere less in image capturing compared to pedestrian traversing the street and occulting PMDs from the camera’s field of vision. We can therefore conclude that high pedestrian densities are detrimental only in the case of pedestrian crossings and careful installation away from such points can assure the accuracy of estimations.

3.1.5. Rider Distraction

In three of the scenarios (S4, S7, S8), e-scooter users were slightly distracted by listening to music using earphones. Table 8 presents a scenario with distracted e-scooter users (S7) and a similar scenario without distraction (S5) for comparison purposes. In both scenarios, e-scooters move in the same direction, there is the same number of pedestrians who cross a certain point of the study area and the width of the road is the same in both cases (2.5 m). The difference in the number of appearances per e-scooter is explained by the different duration of the scenarios. The errors of both scenarios are similar with an average of 0.3955. It becomes clear, however, that there is a big difference in the values of the speeds and, by extension, also in those of the accelerations. This may be explained by the fact that distracted e-scooter users compensate the risk by riding at lower speeds to avoid abrupt interaction with another e-scooter, bike or pedestrian. Tuning to μ-scope, we observe that distraction has no impact on the estimation errors.

3.2. Error Analysis: Impact of Riding Style

Following the exploration of the impact that various factors may have on the performance of μ-scope, we explore whether natural heterogeneity in riding styles has an impact upon errors. The three riders had different riding experience levels and genders, and thus, presumably different risk-taking behaviors. The results indicate that the quality of the estimations is independent from the behavior of participating e-scooter riders. However, their number is small, they have similar age (21–26 years old) and further investigation is needed to confirm this finding.
RMSE values for the appearances of all e-scooter riders are presented in Table 9. The color scale is the same as previously. We observe that colors change in a similar way for all three riders when moving from one scenario to the next, with some exceptions. Therefore, we looked closer to extreme values observed, for example, under S5 and S6. We considered that all ‘inconsistencies’ may be well explained by the impact of previously explored factors and most predominantly by the presence of pedestrians occulting PMDs. For example, in S3, the second e-scooter has an extreme RMSE value of 0.9102. Camera recording viewing confirmed that, at this exact point, there was a loss of contact due to interference of pedestrians.
Table 10 presents the average error for all e-scooter riders for all scenarios. The values with positive signs are presented in bold. When the average error is negative, then the Phyphox application gives higher values than μ-scope. In almost all scenarios, μ-scope gives lower acceleration values than the application.

4. Discussions

The popularity of PMDs raises questions about the safety of their users and the integration of PMD vehicles in global traffic simulation tools. The reliable sensing and analysis of the movement of PMDs is essential for stakeholders to make informed, evidence-based decisions and for researchers to analyze vehicle dynamics and associated risks. This paper validates the ability of the novel image analysis algorithm μ-scope to estimate the trajectories of PMDs with acceptable accuracy. Acceleration rates of e-scooters participating in a closed-track, semicontrolled field experiment were calculated by using μ-scope and also the Phyphox application as the ground-truth measurement. The acceleration rates calculated with μ-scope and Phyphox were compared through error analysis and with the use of RMSE. In addition, μ-scope provided speed measurements under different traffic and road contexts.
The overall results provide new insight into e-scooter dynamics. In particular, riding styles do not seem to be heterogeneous, presumably due to the regulatory low speed limit of 25 km/h not allowing for important speed deviation. Similarly to private cars, distraction seems to lower velocities for risk compensation. Additionally, the presence of pedestrians seems to lower speeds but increase acceleration and deceleration rates. The specific results of the error analysis validate the image analysis algorithm and allow for the formulation of recommendations for camera installation in the purpose of gathering and analyzing micromobility data. First and foremost, low-resolution cameras are enough for satisfactory image recognition and analysis. Secondly, μ-scope is reliable in all linear micromobility road configurations, both one-way and two-way cycle paths. Third, the distance to the camera increases the estimation error. It is thus recommended to use data within a 30 m distance from the camera and discard more distant ones. Fourth, camera installation close to pedestrian crossings must be avoided, as PMDs are occulted and bias is introduced in the analysis. In such cases, error may be acceptable for low pedestrian volumes but not in the case of high pedestrian volumes.
This research offers new tools and insight into a novel field but suffers from the inherent shortcomings of all experiments: results need to be confirmed in the case of other road configurations, different traffic scenarios and for a greater number of e-scooter riders. We intend to undertake a second experiment covering these aspects in 2022. In addition, possible measurement error of the Phyphox application was neglected. Furthermore, in this first analysis, we exploited only e-scooter trajectories. Bicycle and pedestrian trajectories are currently being analyzed and will be presented in an upcoming publication. Finally, interesting future research steps include a thorough analysis of the impact of distraction on e-scooter riders, the estimation of traffic parameters such as intervehicular distances under different scenarios and microvehicle travel time prediction using real-time traffic data.
Future work includes improving the image analysis software to overcome the current shortcomings. It also includes the utilization of the experimental results to analyze the movement of e-scooters and their interactions with pedestrians and bicycles.

Author Contributions

Conceptualization, Z.C. and C.G.; methodology, Z.C., C.G., Y.V. and G.V.-V.; software, Y.V.; validation, Z.C. and C.G.; formal analysis, C.G. and G.V.-V.; investigation, Z.C.; data curation, C.G. and G.V.-V.; writing—original draft preparation, Z.C., C.G, Y.V. and G.V.-V.; writing—review and editing; visualization, C.G, Y.V. and G.V.-V.; supervision, Z.C.; project administration, Z.C.; All authors have read and agreed to the published version of the manuscript.

Funding

This research received no external funding.

Institutional Review Board Statement

Not applicable.

Informed Consent Statement

Informed consent was obtained from all subjects involved in the study.

Data Availability Statement

Not applicable.

Acknowledgments

We acknowledge all participants in the experiment.

Conflicts of Interest

The authors declare no conflict of interest.

References

  1. Zagorskas, J.; Marija Burinskienė, M. Challenges caused by increased use of e-powered personal mobility vehicles in European cities. Sustainability 2019, 12, 273. [Google Scholar] [CrossRef]
  2. Gössling, S. Integrating e-scooters in urban transportation: Problems, policies, and the prospect of system change. Transp. Res. Part D Transp. Environ. 2020, 79, 102230. [Google Scholar] [CrossRef]
  3. Wang, K.; Qian, X.; Fitch, D.T.; Lee, Y.; Malik, J.; Circella, G. What travel modes do shared e-scooters displace? A review of recent research findings. Transp. Rev. 2022, 1–27. [Google Scholar] [CrossRef]
  4. Moreau, H.; de Jamblinne de Meux, L.; Zeller, V.; D’Ans, P.; Ruwet, C.; Achten, W.M. Dockless e-scooter: A green solution for mobility? Comparative case study between dockless e-scooters, displaced transport, and personal e-scooters. Sustainability 2020, 12, 1803. [Google Scholar] [CrossRef]
  5. Dibaj, S.; Hosseinzadeh, A.; Mladenović, M.N.; Kluger, R. Where Have Shared E-Scooters Taken Us So Far? A Review of Mobility Patterns, Usage Frequency, and Personas. Sustainability 2021, 13, 11792. [Google Scholar] [CrossRef]
  6. Bozzi, A.D.; Aguilera, A. Shared E-scooters: A review of uses, health and environmental impacts, and policy implications of a new micro-mobility service. Sustainability 2021, 13, 8676. [Google Scholar] [CrossRef]
  7. Orozco-Fontalvo, M.; Llerena, L.; Cantillo, V. Dockless electric scooters: A review of a growing micromobility mode. Int. J. Sustain. Transp. 2022. [Google Scholar] [CrossRef]
  8. Marques, D.L.; Coelho, M.C. A Literature Review of Emerging Research Needs for Micromobility—Integration through a Life Cycle Thinking Approach. Future Transp. 2020, 2, 135–164. [Google Scholar] [CrossRef]
  9. Yang, H.; Ma, Q.; Wang, Z.; Cai, Q.; Xie, K.; Yang, D. Safety of micro-mobility: Analysis of E-Scooter crashes by mining news reports. Accid. Anal. Prev. 2020, 143, 105608. [Google Scholar] [CrossRef]
  10. McKenzie, G. Spatiotemporal comparative analysis of scooter-share and bike-share usage patterns in Washington, DC. J. Transp. Geogr. 2019, 78, 19–28. [Google Scholar] [CrossRef]
  11. Noland, R.B. Trip patterns and revenue of shared e-scooters in Louisville, Kentucky. Findings 2019, 7747. [Google Scholar] [CrossRef]
  12. Huo, J.; Yang, H.; Li, C.; Zheng, R.; Yang, L.; Wen, Y. Influence of the built environment on E-scooter sharing ridership: A tale of five cities. J. Transp. Geogr. 2021, 93, 103084. [Google Scholar] [CrossRef]
  13. Liu, M.; Seeder, S.; Li, H. Analysis of e-scooter trips and their temporal usage patterns. Inst. Transp. Engineers. ITE J. 2019, 89, 44–49. [Google Scholar]
  14. Orr, B.; MacArthur, J.; Dill, J. The Portland E-Scooter Experience. 2019. Available online: https://pdxscholar.library.pdx.edu/trec_seminar/163/ (accessed on 15 July 2022).
  15. Hosseinzadeh, A.; Algomaiah, M.; Kluger, R.; Li, Z. E-scooters and sustainability: Investigating the relationship between the density of E-scooter trips and characteristics of sustainable urban development. Sustain. Cities Soc. 2021, 66, 102624. [Google Scholar] [CrossRef]
  16. Bai, S.; Jiao, J. Dockless E-scooter usage patterns and urban built Environments: A comparison study of Austin, TX, and Minneapolis, MN. Travel Behav. Soc. 2020, 20, 264–272. [Google Scholar] [CrossRef]
  17. Jiao, J.; Bai, S. Understanding the shared e-scooter travels in Austin, TX. ISPRS Int. J. Geo-Inf. 2020, 9, 135. [Google Scholar] [CrossRef]
  18. Or, C.; Smart, M.J.; Noland, R.B. Spatial associations of dockless shared e-scooter usage. Transp. Res. Part D Transp. Environ. 2020, 86, 102396. [Google Scholar]
  19. Feng, Y.; Zhong, D.; Sun, P.; Zheng, W.; Cao, Q.; Luo, X.; Lu, Z. Micromobility in smart cities: A closer look at shared dockless e-scooters via big social data. In Proceedings of the ICC 2021—IEEE International Conference on Communications, Montreal, QC, Canada, 14–23 June 2021. [Google Scholar]
  20. Foissaud, N.; Gioldasis, C.; Tamura, S.; Christoforou, Z.; Farhi, N. Free-floating e-scooter usage in urban areas: A spatiotemporal analysis. J. Transp. Geogr. 2022, 100, 103335. [Google Scholar] [CrossRef]
  21. Chicco, A.; Diana, M. Understanding micro-mobility usage patterns: A preliminary comparison between dockless bike sharing and e-scooters in the city of Turin (Italy). Transp. Res. Procedia 2022, 62, 459–466. [Google Scholar] [CrossRef]
  22. Moran, M.E.; Laa, B.; Emberger, G. Six scooter operators, six maps: Spatial coverage and regulation of micromobility in Vienna, Austria. Case Stud. Transp. Policy 2020, 8, 658–671. [Google Scholar] [CrossRef]
  23. Younes, H.; Zou, Z.; Wu, J.; Baiocchi, G. Comparing the temporal determinants of dockless scooter-share and station-based bike-share in Washington, DC. Transp. Res. Part A Policy Pract. 2020, 134, 308–320. [Google Scholar] [CrossRef]
  24. Christoforou, Z.; de Bortoli, A.; Gioldasis, C.; Seidowsky, R. Who is using e-scooters and how? Evidence from Paris. Transp. Res. Part D Transp. Environ. 2021, 92, 102708. [Google Scholar] [CrossRef]
  25. Campisi, T.; Akgün-Tanbay, N.; Nahiduzzaman, K.M.; Dissanayake, D. Uptake of e-Scooters in Palermo, Italy: Do the Road Users Tend to Rent, Buy or Share? In Proceedings of the International Conference on Computational Science and Its Applications, Cagliari, Italy, 13–16 September 2021; Springer: Cham, Switzerland, 2021. [Google Scholar]
  26. Laa, B.; Leth, U. Survey of E-scooter users in Vienna: Who they are and how they ride. J. Transp. Geogr. 2020, 89, 102874. [Google Scholar] [CrossRef]
  27. Almannaa, M.; Alsahhaf, F.; Ashqar, H.; Elhenawy, M.; Masoud, M.; Rakotonirainy, A. Perception analysis of E-scooter riders and non-riders in Riyadh, Saudi Arabia: Survey outputs. Sustainability 2021, 13, 863. [Google Scholar] [CrossRef]
  28. Guo, Y.; Yu, Z. Understanding factors influencing shared e-scooter usage and its impact on auto mode substitution. Transp. Res. Part D Transp. Environ. 2021, 99, 102991. [Google Scholar] [CrossRef]
  29. Nikiforiadis, A.; Paschalidis, E.; Stamatiadis, N.; Raptopoulou, A.; Kostareli, A.; Basbas, S. Analysis of attitudes and engagement of shared e-scooter users. Transp. Res. Part D Transp. Environ. 2021, 94, 102790. [Google Scholar] [CrossRef]
  30. Latinopoulos, C.; Patrier, A.; Sivakumar, A. Planning for e-scooter use in metropolitan cities: A case study for Paris. Transp. Res. Part D Transp. Environ. 2021, 100, 103037. [Google Scholar] [CrossRef]
  31. Bahrami, F.; Rigal, A. Planning for plurality of streets: A spheric approach to micromobilities. Mobilities 2022, 17, 1–18. [Google Scholar] [CrossRef]
  32. Gioldasis, C.; Christoforou, Z.; Seidowsky, R. Risk-taking behaviors of e-scooter users: A survey in Paris. Accid. Anal. Prev. 2021, 163, 106427. [Google Scholar] [CrossRef]
  33. Gioldasis, C.; Christoforou, Z. Smart Infrastructure for Shared Mobility. In Proceedings of the Conference on Sustainable Urban Mobility, Skiathos Island, Greece, 17–19 June 2020; Springer: Cham, Switzerland, 2020. [Google Scholar]
  34. Kazemzadeh, K.; Sprei, F. Towards an electric scooter level of service: A review and framework. Travel Behav. Soc. 2022, 29, 149–164. [Google Scholar] [CrossRef]
  35. Dias, C.; Iryo-Asano, M.; Nishiuchi, H.; Todoroki, T. Calibrating a social force based model for simulating personal mobility vehicles and pedestrian mixed traffic. Simul. Model. Pract. Theory 2018, 87, 395–411. [Google Scholar] [CrossRef]
  36. Valero, Y.; et Antonelli, A.; Christoforou, Z.; Farhi, N.; Kabalan, B.; Gioldasis, C.; Foissaud, N. Adaptation and calibration of a social force based model to study interactions between electric scooters and pedestrians. In Proceedings of the 2020 IEEE 23rd International Conference on Intelligent Transportation Systems (ITSC), Rhodes, Greece, 20–23 September 2020. [Google Scholar]
  37. Glavić, D.; Trpković, A.; Milenković, M.; Jevremović, S. The E-Scooter Potential to Change Urban Mobility—Belgrade Case Study. Sustainability 2021, 13, 5948. [Google Scholar] [CrossRef]
  38. Kostareli, A.; Basbas, S.; Stamatiadis, N.; Nikiforiadis, A. Attitudes of e-scooter non-users towards users. In Proceedings of the Conference on Sustainable Urban Mobility, Skiathos Island, Greece, 17–19 June 2020; Springer: Cham, Switzerland, 2020; pp. 87–96. [Google Scholar]
  39. Nikiforiadis, A.; Basbas, S.; Campisi, T.; Tesoriere, G.; Garyfalou, M.I.; Meintanis, I.; Papas, T.; Trouva, M. Quantifying the negative impact of interactions between users of pedestrians-cyclists shared use space. In Proceedings of the International Conference on Computational Science and Its Applications, Cagliari, Italy, 1–4 July 2020; Springer: Cham, Switzerland, 2020; pp. 809–818. [Google Scholar]
  40. Che, M.; Lum, K.M.; Wong, Y.D. Users’ attitudes on electric scooter riding speed on shared footpath: A virtual reality study. Int. J. Sustain. Transp. 2021, 15, 152–161. [Google Scholar] [CrossRef]
  41. Yu, H.; Dias, C.; Iryo-Asano, M.; Nishiuchi, H. Modeling pedestrians’ subjective danger perception toward personal mobility vehicles. Transp. Res. Part F Traffic Psychol. Behav. 2018, 56, 256–267. [Google Scholar]
  42. Pashkevich, A.; Burghardt, T.E.; Puławska-Obiedowska, S.; Šucha, M. Visual attention and speeds of pedestrians, cyclists, and electric scooter riders when using shared road–a field eye tracker experiment. Case Stud. Transp. Policy 2022, 10, 549–558. [Google Scholar] [CrossRef]
  43. Kim, D.; Park, K. Analysis of potential collisions between pedestrians and personal transportation devices in a university campus: An application of unmanned aerial vehicles. J. Am. Coll. Health 2021. [Google Scholar] [CrossRef]
  44. Dozza, M.; Violin, A.; Rasch, A. A data-driven framework for the safe integration of micro-mobility into the transport system: Comparing bicycles and e-scooters in field trials. J. Saf. Res. 2022, 81, 67–77. [Google Scholar] [CrossRef]
  45. Phyphox. Available online: https://phyphox.org/ (accessed on 20 July 2022).
  46. Staacks, S.; Hütz, S.; Heinke, H.; Stampfer, C. Advanced tools for smartphone-based experiments: Phyphox. Phys. Educ. 2018, 53, 045009. [Google Scholar] [CrossRef]
  47. Koetsier, C.; Busch, S.; Sester, M. Trajectory extraction for analysis of unsafe driving behaviour. In Proceedings of the International Archives of the Photogrammetry, Remote Sensing and Spatial Information Sciences, Enschede, The Netherlands, 10–14 June 2019; pp. 1573–1578. [Google Scholar]
  48. Gruden, C.; Campisi, T.; Canale, A.; Tesoriere, G.; Sraml, M. A cross-study on video data gathering and microsimulation techniques to estimate pedestrian safety level in a confined space. IOP Conf. Ser. Mater. Sci. Eng. 2019, 603, 042008. [Google Scholar] [CrossRef]
  49. Gruden, C.; Ištoka Otković, I.; Šraml, M. An Eye-Tracking Study on the Effect of Different Signalized Intersection Typologies on Pedestrian Performance. Sustainability 2022, 14, 2112. [Google Scholar] [CrossRef]
  50. Johnsson, C.; Norén, H.; Laureshyn, A.; Ivina, D. T-Analyst-semi-automated tool for traffic conflict analysis. In InDeV, Horizon 2020 Project. Deliverable 6.1; Lund University: Lund, Sweden, 2018; Available online: https://ec.europa.eu/research/participants/documents/downloadPublic?documentIds=080166e5c2c9951c&appId=PPGMS (accessed on 15 July 2022).
  51. Tsai, R. A versatile camera calibration technique for high-accuracy 3D machine vision metrology using off-the-shelf TV cameras and lenses. IEEE J. Robot. Autom. 1987, 3, 323–344. [Google Scholar] [CrossRef]
  52. Jocher, G.; Chaurasia, A.; Stoken, A.; Borovec, J.; NanoCode012; Kwon, Y.; TaoXie; Fang, J.; imyhxy; Michael, K.; et al. Ultralytics/yolov5: v4. 0-nn. SiLU () Activations, Weights & Biases Logging, PyTorch Hub Integration. Zenodo. 2021. Available online: https://zenodo.org/record/4418161 (accessed on 15 July 2022).
  53. Wojke, N.; Bewley, A.; Paulus, D. Simple online and realtime tracking with a deep association metric. In Proceedings of the 2017 IEEE International Conference on Image Processing (ICIP), Beijing, China, 17–20 September 2017. [Google Scholar]
  54. Pelaez Barrajon, J.; Juan, A.F.S. Validity and reliability of a smartphone accelerometer for measuring lift velocity in bench-press exercises. Sustainability 2020, 12, 2312. [Google Scholar] [CrossRef]
  55. Kittiravechote, A.; Sujarittham, T. Smartphone as monitor of the gravitational acceleration: A classroom demonstration and student experiment. J. Phys. Conf. Ser. 2021, 1719, 012094. [Google Scholar] [CrossRef]
Figure 1. (a) Area context of the field of the experiment and (b) top view and dimensions of the field of the experiment.
Sustainability 14 11150 g001
Figure 2. Random frame.
Sustainability 14 11150 g002
Figure 3. Mask of the analysis area.
Sustainability 14 11150 g003
Figure 4. (a) Reference points (1–12) with real-world coordinates and (b) reference points in camera view.
Sustainability 14 11150 g004
Figure 5. Object tracking.
Sustainability 14 11150 g005
Figure 6. Trajectories.
Sustainability 14 11150 g006
Figure 7. View of the Phyphox application [45].
Sustainability 14 11150 g007
Figure 8. Axis system in the Phyphox software [45].
Sustainability 14 11150 g008
Figure 9. Acceleration rates of the 1st e-scooter of S1.
Sustainability 14 11150 g009
Figure 10. Coordinate system.
Sustainability 14 11150 g010
Figure 11. RMSE in function of distance d. (a) 1st e-scooter of S1 (b) 2nd e-scooter of S3 (c) 3rd e-scooter of S4.
Sustainability 14 11150 g011aSustainability 14 11150 g011b
Figure 12. Acceleration rates for the first e-scooter of S9.
Sustainability 14 11150 g012
Figure 13. Acceleration rates for the third e-scooter at S4 at its fourth appearance.
Sustainability 14 11150 g013
Table 1. E-scooter model characteristics.
Model
CharacteristicXiaomiFiat F500-F85K
Maximum speed (km/h)1820
Wheel Diameter8.5″8.5″
Weight (kg)1214
Engine Power250 W350 W
Maximum Range (km)2024.9
Maximum user weight (kg)100120
Cruise ControlYesYes
Table 2. Smartphone and accelerometer characteristics.
Vehicle1st2nd3rd
Device modelSM-A515FMi Note 10 LiteRedmi Note 9
Device brandSamsungXiaomiRedmi
Device boardexynos9611tocojoyeuse
Device manufacturerSamsungXiaomiXiaomi
Accelerometer range78.453278.4531878.45318
Accelerometer analysis0.00239420.0023928230.002392823
Accelerometer MinDelay200024042404
Accelerometer MaxDelay160,0001,000,0001,000,000
Accelerometer Power0.150.170.15
Accelerometer version15,932142,338140,549
Range of linear acceleration78.4532156.98999156.98999
Linear acceleration Analysis0.00239420.010.01
MinDelay linear acceleration10,00050005000
MaxDelay linear acceleration0200,000200,000
Linear acceleration Power1.90.5150.515
Linear acceleration Version111
Table 3. Experimental scenarios.
Scenarios
S1S2S3S4S5S6S7S8S9
Width (m)1.51.51.51.52.52.52.52.53.5
DistractionNoYesNoYesNoYesNoYesNo
E-scooter DirectionCWCWCCWCCWCWCWCCWCCWCW
Bicycle DirectionCCWCCWCWCWCCWCCWCWCWCCW
Pedestrian crowdHighHighVery highHighAverageAverageLowVery Low
Pedestrian crossing pointYesYesYesYesYesYesYesYesNo
Table 4. Pedestrian presence: RMSE per e-scooter appearance for all scenarios.
RMSE Value
>0.1>0.2>0.3>0.4>0.5>0.6>0.7>0.8>0.9
Scenario
E-ScooterS9S7S8S2S5S1S6S3S4
1st0.10380.27160.28950.35770.23960.45310.47610.69250.6146
0.29200.27680.33420.27240.44720.69200.72290.83560.7677
0.34660.25480.32540.58590.42120.66630.68030.6171
0.37940.36280.53380.39430.72160.60230.6992
0.37020.43050.49500.54130.61570.7223
2nd0.18060.39240.23050.39850.51290.46070.60140.67650.9265
0.12240.33730.24920.34930.41260.59320.58290.91020.7914
0.33470.28870.33930.46680.39120.51920.76970.7070
0.33610.49080.48030.42060.52890.64510.7839
0.28360.30600.37930.36430.49980.6217
3rd0.20570.35170.35530.30140.43040.44820.50650.61790.6497
0.10410.21500.30450.32220.31560.46560.37090.90650.9823
0.38930.29970.44920.35170.39130.46710.70150.6774
0.33320.36350.47170.55630.35030.76430.9098
0.31690.33640.55330.44200.48610.4221
Table 5. Road width: RMSE per e-scooter appearance for all scenarios.
RMSE Value
>0.1>0.2>0.3>0.4>0.5>0.6>0.7>0.8>0.9
1.5 m2.5 m2.5 m2.5 m2.5 m3.5 m3.5 m3.5 m3.5 m
E-ScooterS9S5S6S7S8S1S2S3S4
1st0.10380.23960.47610.27160.28950.45310.35770.69250.6146
0.29200.44720.72290.27680.33420.69200.27240.83560.7677
0.58590.66630.34660.25480.42120.32540.68030.6171
0.53380.7216 0.37940.39430.36280.60230.6992
0.49500.6157 0.37020.54130.43050.7223
2nd0.18060.51290.60140.39240.23050.46070.39850.67650.9265
0.12240.41260.58290.33730.24920.59320.34930.91020.7914
0.46680.51920.33470.28870.39120.33930.76970.7070
0.48030.5289 0.33610.42060.49080.64510.7839
0.37930.4998 0.28360.36430.30600.6217
3rd0.20570.43040.50650.35170.35530.44820.30140.61790.6497
0.10410.31560.37090.21500.30450.46560.32220.90650.9823
0.35170.46710.38930.29970.39130.44920.70150.6774
0.47170.3503 0.33320.55630.36350.76430.9098
0.55330.4861 0.31690.44200.33640.4221
Table 6. E-scooter direction: RMSE per e-scooter appearance for S2 and S6.
S2S6
E-ScooterRMSEAverage ErrorAver. μ-ScopeAccel. PhyphoxSpeedE-ScooterRMSEAverage ErrorAver. μ-ScopeAccel. PhyphoxSpeed
1st0.358−0.0960.5860.6822.0311st 0.476−0.0291.1961.2252.500
0.272−0.0620.9061.4471.542 0.7230.0160.7210.6052.134
0.325−0.0580.7491.7061.726 0.666−0.1790.6950.8742.532
0.363−0.0611.0821.7601.834 0.722−0.1420.8150.9574.109
0.431−0.0641.0791.6321.855 0.616−0.0301.2551.1852.011
2nd0.399−0.0430.6780.8461.7152nd0.601−0.1691.1311.3000.484
0.349−0.1090.9651.0823.088 0.5830.0201.2901.2692.667
0.339−0.0951.2390.9774.043 0.519−0.3492.7202.0692.116
0.4910.1331.9881.8552.147 0.5290.1931.3401.1463.204
0.500−0.0221.7061.7110.378
3rd0.301−0.1210.5770.9013.2043rd0.507−0.0260.9460.9722.405
0.322−0.0411.1151.1564.189 0.3710.0921.0741.0822.708
0.449−0.1742.0381.4895.199 0.467−0.4031.2121.2152.287
0.363−0.0830.4170.9994.979 0.350−0.1230.8590.6822.747
0.336−0.0680.7370.8062.165 0.486−0.0060.7990.7052.419
Table 7. Pedestrian direction: RMSE per e-scooter appearance for S1 and S3.
S1S3
E-ScooterRMSEAv. Er.Accel. μ-ScopeAccel. PhyphoxSpeedE-ScooterRMSEAv. Er.CameraPhyphoxSpeed
1st0.4531−0.10760.66610.77371.08571st0.6925−0.11561.07241.18803.2952
0.49200.69202.02811.35501.5660 0.8356−0.05661.17691.25432.1451
0.4212−0.32461.42951.75411.9186 0.6803−0.12440.66240.78672.6110
0.3943−0.07850.82170.90031.1819 0.6023−0.08250.89870.98122.8299
0.5413−0.06020.89560.95581.6780 0.7223−0.04150.55180.59334.2778
2nd0.4607−0.02281.07211.04930.91192nd0.6765−0.12231.29611.41843.1886
0.5932−0.01771.50211.54591.6828 0.9102−0.14911.85342.04462.1460
0.3912−0.01121.49071.50182.7937 0.7697−0.01032.31752.32772.4185
0.4206−0.16690.74390.91081.1714 0.6451−0.07121.26521.31423.5030
0.3643−0.07850.64140.72491.6760 0.6217−0.0712
3rd0.4482−0.01610.69840.71451.44593rd0.6179−0.15380.98781.14164.5734
0.4656−0.01970.97730.99721.5293 0.9065−0.10491.44521.51022.3506
0.3913−0.26390.68830.74051.5222 0.70150.01911.18881.16972.4805
0.5563−0.05220.94631.21012.2565 0.7643−0.05911.52041.57952.7048
0.4420−0.03550.73690.79931.4801 0.4221−0.10390.93851.04243.9259
Table 8. Rider distraction: RMSE per e-scooter appearance for S5 and S7.
S5S7
E-ScooterRMSEAv. Er.Accel. μ-ScopeAccel. PhyphoxSpeedE-ScooterRMSEAv. Er.Accel. μ-ScopeAccel. PhyphoxSpeed
1st0.23960.04520.31300.26794.15371st0.2716−0.00230.75960.76192.2257
0.4472−0.41650.81711.23363.2815 0.2768−0.03330.30650.33980.4194
0.58590.17610.66270.48663.4829 0.3466−0.23731.12711.66452.3519
0.53380.08501.05410.96913.5603
2nd0.5129−0.09191.03411.12594.09672nd0.3924−0.02340.51510.53350.5969
0.41260.10351.08200.97850.3133 0.33730.09060.43570.34520.6318
0.4668−0.12240.61871.03523.0831 0.33470.09101.52331.93234.6892
0.4803−0.32170.46420.28813.2844
0.3793−0.47880.85560.77073.3619
3rd0.4304−0.01120.98941.00064.16053rd0.3517−0.00600.35020.35620.5948
0.3156−0.03520.89960.93484.2043 0.21500.03991.21581.17592.8876
0.3517−0.03100.74730.77844.0477 0.38930.06050.66720.60672.5315
0.47170.17350.63280.45933.9034
0.55330.18460.67960.49493.3578
Table 9. RMSE per scenario and per e-scooter appearance for all e-scooters.
RMSE Value
>0.1>0.2>0.3>0.4>0.5>0.6>0.7>0.8>0.9
Scenario
E-ScooterS1S2S3S4S5S6S7S8S9
1st0.45310.35770.59250.61450.23960.67610.27150.28950.1037
0.49200.27230.63550.76760.44710.72290.27680.33410.2220
0.42120.32530.58030.61700.58580.66620.34660.2547
0.39420.36280.60230.69910.53370.7215 0.3794
0.54130.43050.6222 0.49490.6157 0.3701
2nd0.46070.39850.40650.92650.51290.60140.39240.23050.1806
0.59320.34930.91020.79140.41260.58290.33730.24920.1224
0.39120.33930.46970.70700.46680.51920.33470.2887
0.42060.49080.44510.78390.48030.5289 0.3361
0.36430.30600.6217 0.37930.4998 0.2836
3rd0.44820.30140.41790.64970.43040.50650.35170.35530.2057
0.46560.32220.90650.98230.31560.37090.21500.30450.1041
0.39130.44920.60150.67740.35170.46710.20930.2997
0.55630.36350.56430.90980.47170.3503 0.3332
0.44200.33640.4221 0.55330.4861 0.3169
Table 10. Average error for all e-scooter riders.
Scenario
E-ScooterS1S2S3S4S5S6S7S8S9
1st−0.1076−0.0958−0.11560.35500.0452−0.0290−0.0023−0.0714−0.0218
0.0673−0.0622−0.0566−0.0339−0.41650.0164−0.0333−0.2883−0.0060
−0.3246−0.0583−0.12440.24670.1761−0.1786−0.2373−0.1010
−0.0785−0.0605−0.0825−0.19430.0850−0.1418 −0.0027
−0.0602−0.0643−0.0415 −0.0305 −0.0875
2nd−0.0228−0.0433−0.12230.0116−0.0919−0.1687−0.0234−0.0617−0.0276
−0.0177−0.10910.49140.24750.10350.0204−0.0906−0.1632−0.0290
−0.0112−0.0949−0.01030.6073−0.1224−0.34930.0910−0.0569
−0.16690.1333−0.0712−0.4161−0.32170.1932 −0.0391
−0.0785 −0.0712 −0.4788−0.0217 0.0238
3rd−0.0161−0.1212−0.1538−0.0554−0.0112−0.0261−0.0060−0.1911−0.0598
−0.0197−0.0413−0.1049−0.2540−0.03520.0916−0.0399−0.1643−0.0788
−0.2639−0.17410.0191−0.1156−0.0310−0.4031−0.06050.3347
−0.0522−0.0826−0.0591−0.41210.1735−0.1227 −0.2627
−0.0355−0.0683−0.1039 0.1846−0.0063 −0.2615
Publisher’s Note: MDPI stays neutral with regard to jurisdictional claims in published maps and institutional affiliations.

