

A Multi-Dimensional Deep Siamese Network for Land Cover Change Detection in Bi-Temporal Hyperspectral Imagery


Abstract
1. Introduction
2. Case Study and Reference Data
3. Methodology
3.1. Pre-Processing
3.2. Sample Data Generation
3.2.1. Sub-Regions Determination
3.2.2. Change/No-Change Prediction
3.2.3. Hierarchical Otsu Thresholding
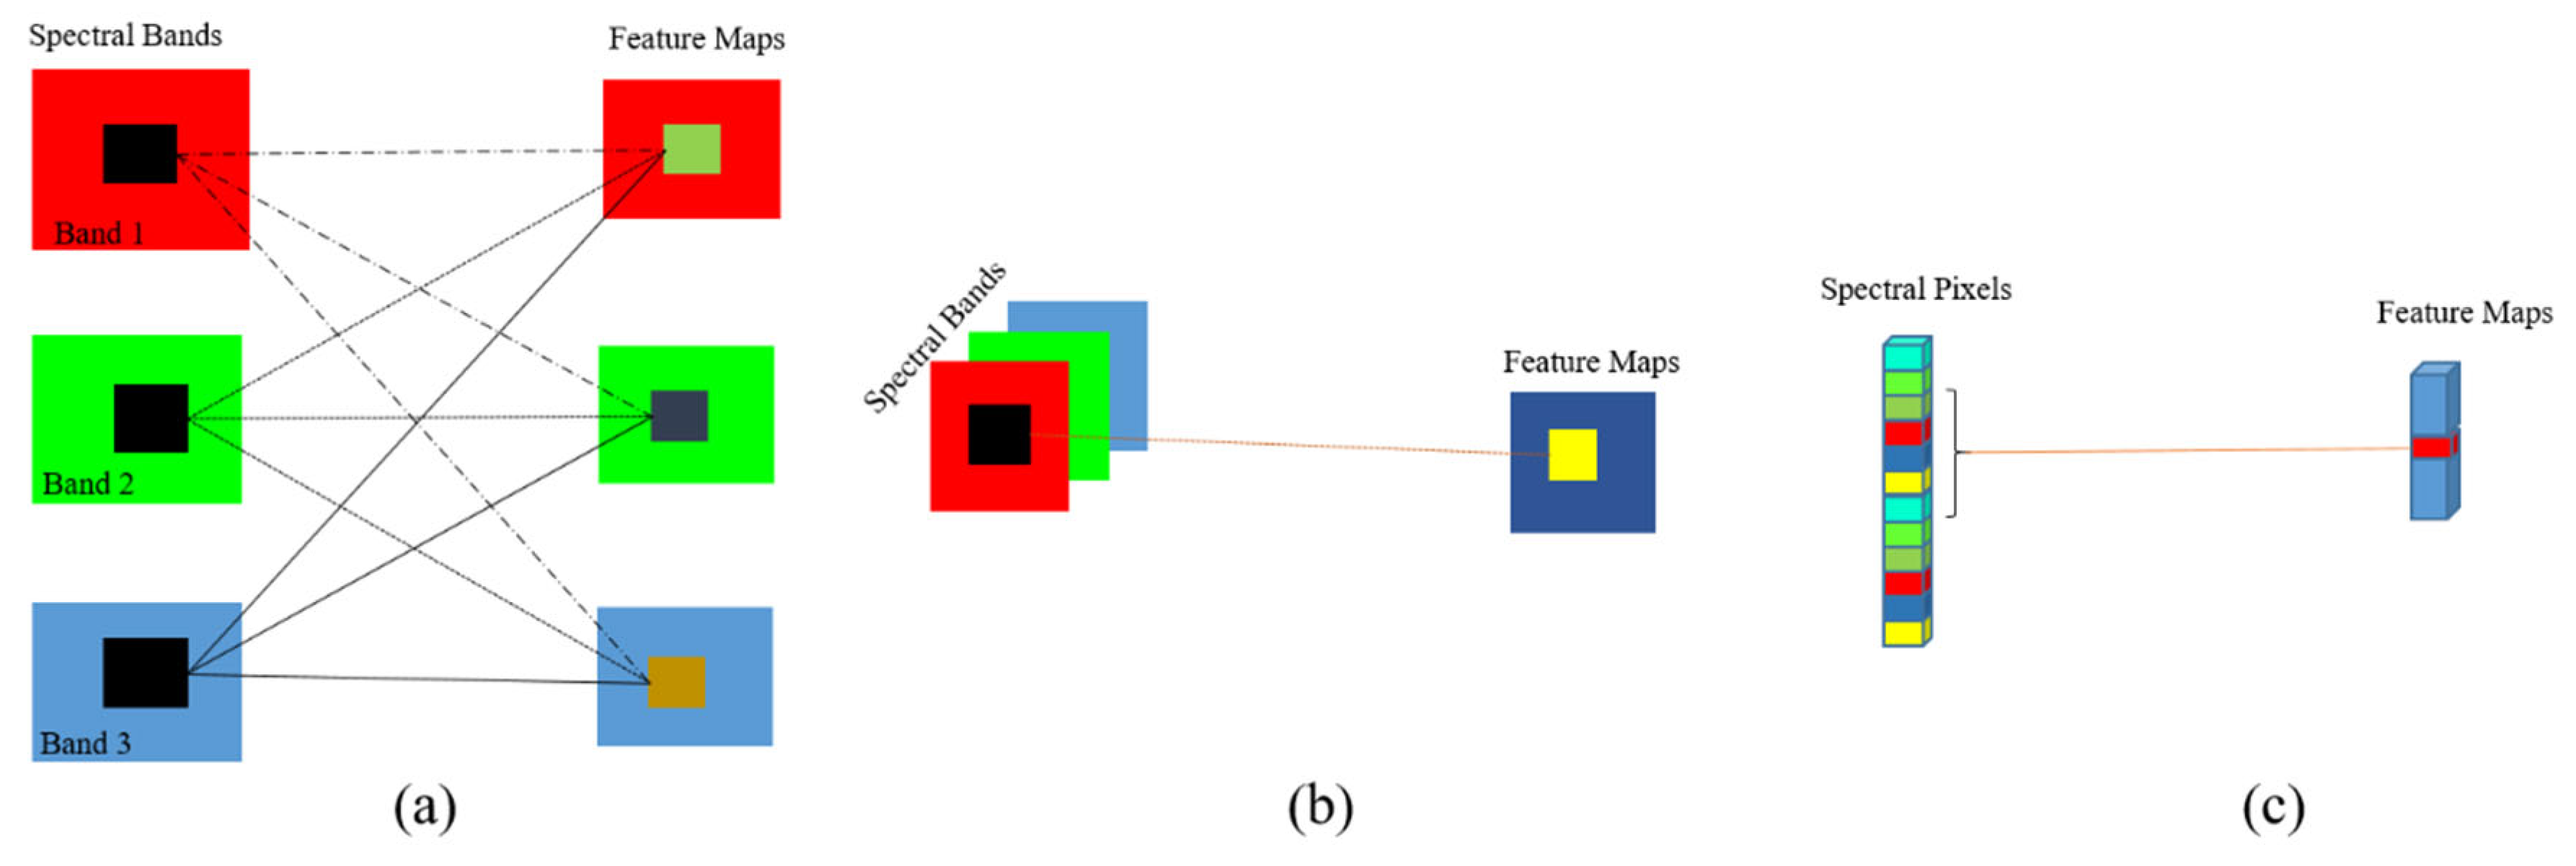
3.3. End-to-End CNN-Based Binary CD
3.4. Accuracy Assessment and Comparison
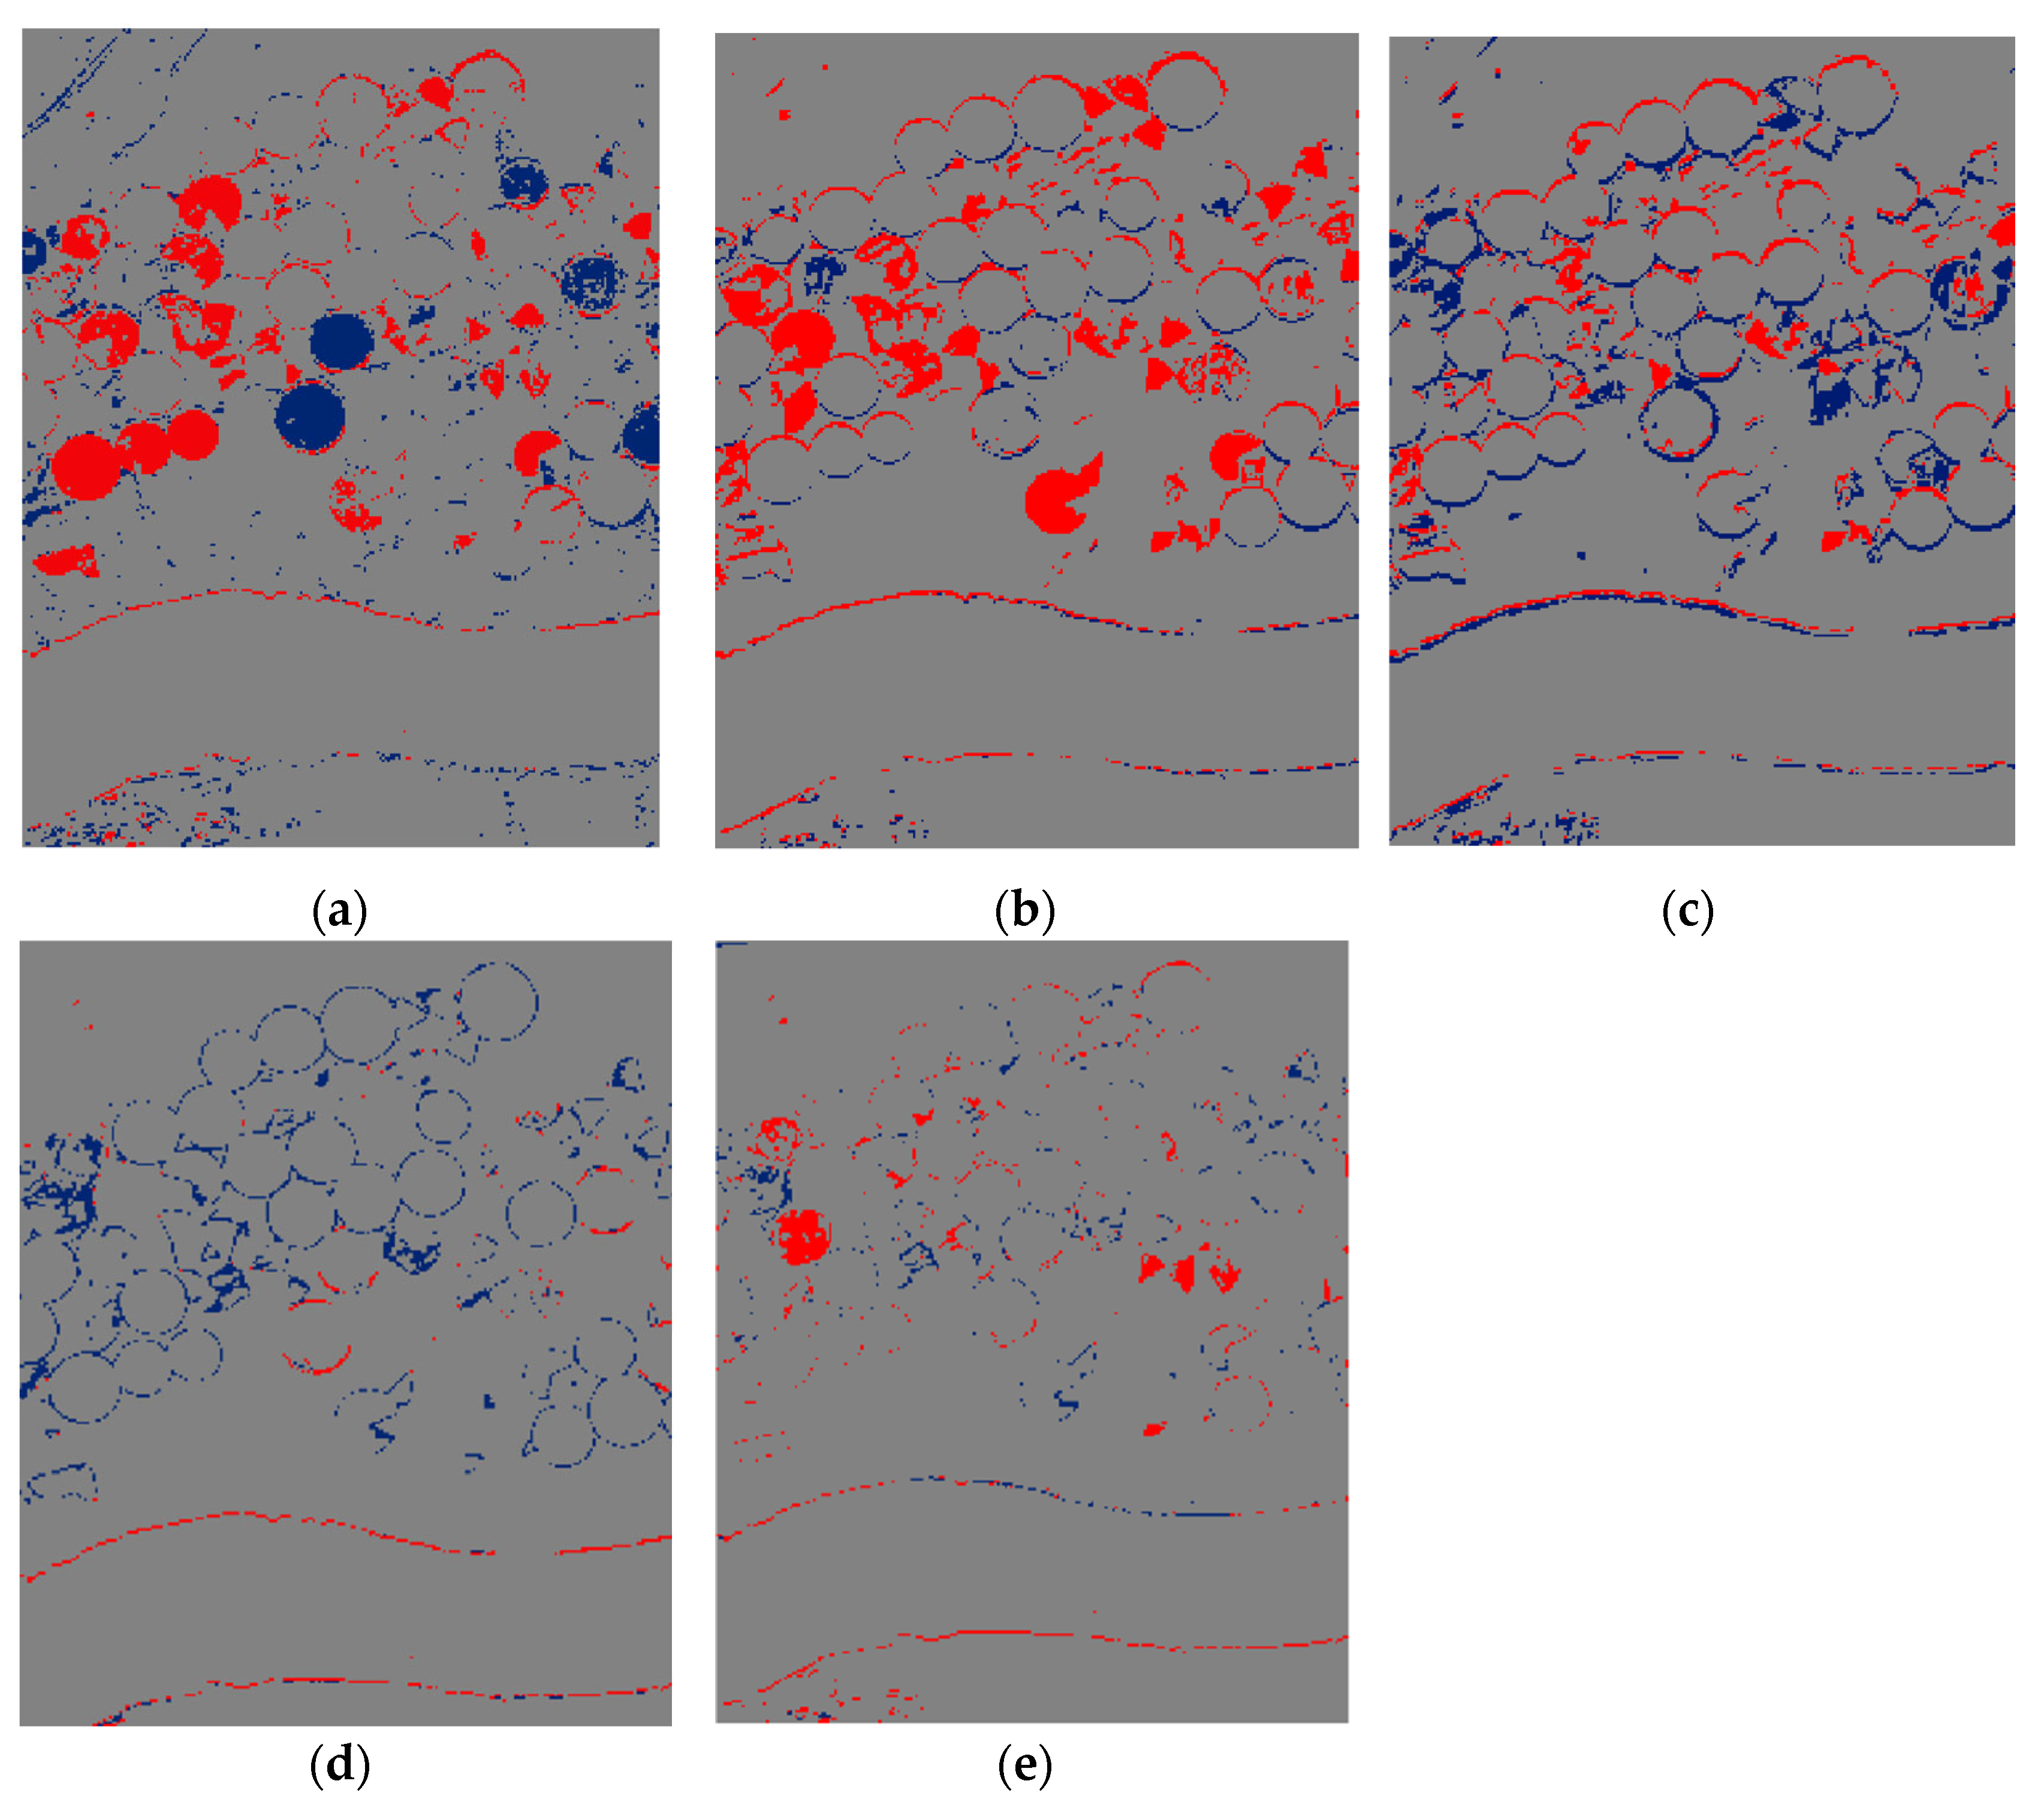
4. Experiments and Results
5. Discussion
6. Conclusions
Author Contributions
Funding
Institutional Review Board Statement
Informed Consent Statement
Data Availability Statement
Conflicts of Interest
References
- Song, Y.; Chen, B.; Kwan, M.-P. How does urban expansion impact people’s exposure to green environments? A comparative study of 290 Chinese cities. J. Clean. Prod. 2020, 246, 119018. [Google Scholar] [CrossRef]
- Koko, A.F.; Yue, W.; Abubakar, G.A.; Hamed, R.; Alabsi, A.A.N. Monitoring and Predicting Spatio-Temporal Land Use/Land Cover Changes in Zaria City, Nigeria, through an Integrated Cellular Automata and Markov Chain Model (CA-Markov). Sustainability 2020, 12, 10452. [Google Scholar] [CrossRef]
- Çağlıyan, A.; Dağlı, D. Monitoring Land Use Land Cover Changes and Modelling of Urban Growth Using a Future Land Use Simulation Model (FLUS) in Diyarbakır, Turkey. Sustainability 2022, 14, 9180. [Google Scholar] [CrossRef]
- Kuzevic, S.; Bobikova, D.; Kuzevicova, Z. Land Cover and Vegetation Coverage Changes in the Mining Area—A Case Study from Slovakia. Sustainability 2022, 14, 1180. [Google Scholar] [CrossRef]
- Daba, M.H.; You, S. Quantitatively assessing the future land-use/land-cover changes and their driving factors in the upper stream of the Awash River based on the CA–markov model and their implications for water resources management. Sustainability 2022, 14, 1538. [Google Scholar] [CrossRef]
- Quan, Q.; Gao, S.; Shang, Y.; Wang, B. Assessment of the sustainability of Gymnocypris eckloni habitat under river damming in the source region of the Yellow River. Sci. Total Environ. 2021, 778, 146312. [Google Scholar] [CrossRef]
- Zhang, K.; Wang, S.; Bao, H.; Zhao, X. Characteristics and influencing factors of rainfall-induced landslide and debris flow hazards in Shaanxi Province, China. Nat. Hazards Earth Syst. Sci. 2019, 19, 93–105. [Google Scholar] [CrossRef]
- Luppino, L.T.; Kampffmeyer, M.; Bianchi, F.M.; Moser, G.; Serpico, S.B.; Jenssen, R.; Anfinsen, S.N. Deep image translation with an affinity-based change prior for unsupervised multimodal change detection. IEEE Trans. Geosci. Remote Sens. 2021. [Google Scholar] [CrossRef]
- Wang, S.; Zhang, K.; Chao, L.; Li, D.; Tian, X.; Bao, H.; Chen, G.; Xia, Y. Exploring the utility of radar and satellite-sensed precipitation and their dynamic bias correction for integrated prediction of flood and landslide hazards. J. Hydrol. 2021, 603, 126964. [Google Scholar] [CrossRef]
- Zhao, F.; Song, L.; Peng, Z.; Yang, J.; Luan, G.; Chu, C.; Ding, J.; Feng, S.; Jing, Y.; Xie, Z. Night-time light remote sensing mapping: Construction and analysis of ethnic minority development index. Remote Sens. 2021, 13, 2129. [Google Scholar] [CrossRef]
- Chen, Y.; Bruzzone, L. Self-supervised Change Detection in Multi-view Remote Sensing Images. arXiv 2021, arXiv:2103.05969. [Google Scholar]
- Zhou, H.; Zhang, M.; Hu, X.; Li, K.; Sun, J. A Siamese convolutional neural network with high–low level feature fusion for change detection in remotely sensed images. Remote Sens. Lett. 2021, 12, 387–396. [Google Scholar] [CrossRef]
- Arroyo-Mora, J.P.; Kalacska, M.; Løke, T.; Schläpfer, D.; Coops, N.C.; Lucanus, O.; Leblanc, G. Assessing the impact of illumination on UAV pushbroom hyperspectral imagery collected under various cloud cover conditions. Remote Sens. Environ. 2021, 258, 112396. [Google Scholar] [CrossRef]
- Pechanec, V.; Mráz, A.; Rozkošný, L.; Vyvlečka, P. Usage of Airborne Hyperspectral Imaging Data for Identifying Spatial Variability of Soil Nitrogen Content. ISPRS Int. J. Geo. Inf. 2021, 10, 355. [Google Scholar] [CrossRef]
- Xie, R.; Darvishzadeh, R.; Skidmore, A.K.; Heurich, M.; Holzwarth, S.; Gara, T.W.; Reusen, I. Mapping leaf area index in a mixed temperate forest using Fenix airborne hyperspectral data and Gaussian processes regression. Int. J. Appl. Earth Obs. Geoinf. 2021, 95, 102242. [Google Scholar] [CrossRef]
- Chang, C.-I.; Chen, J. Orthogonal Subspace Projection Using Data Sphering and Low-Rank and Sparse Matrix Decomposition for Hyperspectral Target Detection. IEEE Trans. Geosci. Remote Sens. 2021. [Google Scholar] [CrossRef]
- Meerdink, S.; Bocinsky, J.; Zare, A.; Kroeger, N.; McCurley, C.; Shats, D.; Gader, P. Multitarget Multiple-Instance Learning for Hyperspectral Target Detection. IEEE Trans. Geosci. Remote Sens. 2021. [Google Scholar] [CrossRef]
- Gao, C.; Wu, Y.; Hao, X. Hierarchical Suppression Based Matched Filter for Hyperspertral Imagery Target Detection. Sensors 2021, 21, 144. [Google Scholar] [CrossRef] [PubMed]
- Hasanlou, M.; Seydi, S.T. Hyperspectral change detection: An experimental comparative study. Int. J. Remote Sens. 2018, 39, 7029–7083. [Google Scholar] [CrossRef]
- Ghamisi, P.; Yokoya, N.; Li, J.; Liao, W.; Liu, S.; Plaza, J.; Rasti, B.; Plaza, A. Advances in hyperspectral image and signal processing: A comprehensive overview of the state of the art. IEEE Geosci. Remote Sens. Mag. 2017, 5, 37–78. [Google Scholar] [CrossRef]
- Kim, J.; Lee, M.; Han, H.; Kim, D.; Bae, Y.; Kim, H.S. Case Study: Development of the CNN Model Considering Teleconnection for Spatial Downscaling of Precipitation in a Climate Change Scenario. Sustainability 2022, 14, 4719. [Google Scholar] [CrossRef]
- Tsokov, S.; Lazarova, M.; Aleksieva-Petrova, A. A Hybrid Spatiotemporal Deep Model Based on CNN and LSTM for Air Pollution Prediction. Sustainability 2022, 14, 5104. [Google Scholar] [CrossRef]
- Liu, F.; Xu, H.; Qi, M.; Liu, D.; Wang, J.; Kong, J. Depth-Wise Separable Convolution Attention Module for Garbage Image Classification. Sustainability 2022, 14, 3099. [Google Scholar] [CrossRef]
- Li, S.; Liu, C.H.; Lin, Q.; Wen, Q.; Su, L.; Huang, G.; Ding, Z. Deep residual correction network for partial domain adaptation. IEEE Trans. Pattern Anal. Mach. Intell. 2020, 43, 2329–2344. [Google Scholar] [CrossRef]
- Zhang, Q.; Ge, L.; Hensley, S.; Metternicht, G.I.; Liu, C.; Zhang, R. PolGAN: A deep-learning-based unsupervised forest height estimation based on the synergy of PolInSAR and LiDAR data. ISPRS J. Photogramm. Remote Sens. 2022, 186, 123–139. [Google Scholar] [CrossRef]
- Sefrin, O.; Riese, F.M.; Keller, S. Deep Learning for Land Cover Change Detection. Remote Sens. 2021, 13, 78. [Google Scholar] [CrossRef]
- Chen, H.; Zhang, K.; Xiao, W.; Sheng, Y.; Cheng, L.; Zhou, W.; Wang, P.; Su, D.; Ye, L.; Zhang, S. Building change detection in very high-resolution remote sensing image based on pseudo-orthorectification. Int. J. Remote Sens. 2021, 42, 2686–2705. [Google Scholar] [CrossRef]
- Wang, C.; Wang, X. Building change detection from multi-source remote sensing images based on multi-feature fusion and extreme learning machine. Int. J. Remote Sens. 2021, 42, 2246–2257. [Google Scholar] [CrossRef]
- Seydi, S.; Hasanlou, M. Binary Hyperspectral Change Detection Based on 3d Convolution Deep Learning. Int. Arch. Photogramm. Remote Sens. Spat. Inf. Sci. 2020, 43, 1629–1633. [Google Scholar] [CrossRef]
- Huang, F.; Yu, Y.; Feng, T. Hyperspectral remote sensing image change detection based on tensor and deep learning. J. Vis. Commun. Image Represent. 2019, 58, 233–244. [Google Scholar] [CrossRef]
- Wang, L.; Zhang, J.; Liu, P.; Choo, K.-K.R.; Huang, F. Spectral–spatial multi-feature-based deep learning for hyperspectral remote sensing image classification. Soft Comput. 2017, 21, 213–221. [Google Scholar] [CrossRef]
- Ball, J.E.; Anderson, D.T.; Chan Sr, C.S. Comprehensive survey of deep learning in remote sensing: Theories, tools, and challenges for the community. J. Appl. Remote Sens. 2017, 11, 042609. [Google Scholar] [CrossRef]
- Guo, Q.; Zhang, J.; Zhong, C.; Zhang, Y. Change detection for hyperspectral images via convolutional sparse analysis and temporal spectral unmixing. IEEE J. Sel. Top. Appl. Earth Obs. Remote Sens. 2021, 14, 4417–4426. [Google Scholar] [CrossRef]
- Wang, L.; Wang, L.; Wang, Q.; Atkinson, P.M. SSA-SiamNet: Spectral–spatial-wise attention-based Siamese network for hyperspectral image change detection. IEEE Trans. Geosci. Remote Sens. 2021, 60, 1–18. [Google Scholar] [CrossRef]
- Seydi, S.T.; Hasanlou, M. A new land-cover match-based change detection for hyperspectral imagery. Eur. J. Remote Sens. 2017, 50, 517–533. [Google Scholar] [CrossRef]
- Tong, X.; Pan, H.; Liu, S.; Li, B.; Luo, X.; Xie, H.; Xu, X. A novel approach for hyperspectral change detection based on uncertain area analysis and improved transfer learning. IEEE J. Sel. Top. Appl. Earth Obs. Remote Sens. 2020, 13, 2056–2069. [Google Scholar] [CrossRef]
- Liu, L.; Hong, D.; Ni, L.; Gao, L. Multilayer Cascade Screening Strategy for Semi-Supervised Change Detection in Hyperspectral Images. IEEE J. Sel. Top. Appl. Earth Obs. Remote Sens. 2022, 15, 1926–1940. [Google Scholar] [CrossRef]
- Zhan, T.; Song, B.; Sun, L.; Jia, X.; Wan, M.; Yang, G.; Wu, Z. TDSSC: A Three Directions Spectral-Spatial Convolution Neural Networks for Hyperspectral Image Change Detection. IEEE J. Sel. Top. Appl. Earth Obs. Remote Sens. 2020. [Google Scholar] [CrossRef]
- Jafarzadeh, H.; Hasanlou, M. An unsupervised binary and multiple change detection approach for hyperspectral imagery based on spectral unmixing. IEEE J. Sel. Top. Appl. Earth Obs. Remote Sens. 2019, 12, 4888–4906. [Google Scholar] [CrossRef]
- López-Fandiño, J.; Heras, D.B.; Argüello, F.; Dalla Mura, M. GPU framework for change detection in multitemporal hyperspectral images. Int. J. Parallel Program. 2019, 47, 272–292. [Google Scholar] [CrossRef]
- Appice, A.; Di Mauro, N.; Lomuscio, F.; Malerba, D. Empowering change vector analysis with autoencoding in bi-temporal hyperspectral images. In Proceedings of the CEUR Workshop Proceedings, Würzburg, Germany, 20 September 2019. [Google Scholar]
- Song, A.; Kim, Y. Transfer Change Rules from Recurrent Fully Convolutional Networks for Hyperspectral Unmanned Aerial Vehicle Images without Ground Truth Data. Remote Sens. 2020, 12, 1099. [Google Scholar] [CrossRef]
- Seydi, S.T.; Hasanlou, M.; Amani, M. A new end-to-end multi-dimensional CNN framework for land cover/land use change detection in multi-source remote sensing datasets. Remote Sens. 2020, 12, 2010. [Google Scholar] [CrossRef]
- Han, T.; Peng, Q.; Zhu, Z.; Shen, Y.; Huang, H.; Abid, N.N. A pattern representation of stock time series based on DTW. Phys. A Stat. Mech. Appl. 2020, 550, 124161. [Google Scholar] [CrossRef]
- Csillik, O.; Belgiu, M.; Asner, G.P.; Kelly, M. Object-based time-constrained dynamic time warping classification of crops using Sentinel-2. Remote Sens. 2019, 11, 1257. [Google Scholar] [CrossRef]
- Kurita, T.; Otsu, N.; Abdelmalek, N. Maximum likelihood thresholding based on population mixture models. Pattern Recognit. 1992, 25, 1231–1240. [Google Scholar] [CrossRef]
- Goh, T.Y.; Basah, S.N.; Yazid, H.; Safar, M.J.A.; Saad, F.S.A. Performance analysis of image thresholding: Otsu technique. Measurement 2018, 114, 298–307. [Google Scholar] [CrossRef]
- Fang, B.; Li, Y.; Zhang, H.; Chan, J.C.-W. Collaborative learning of lightweight convolutional neural network and deep clustering for hyperspectral image semi-supervised classification with limited training samples. ISPRS J. Photogramm. Remote Sens. 2020, 161, 164–178. [Google Scholar] [CrossRef]
- Liu, S.; Bruzzone, L.; Bovolo, F.; Du, P. Unsupervised multitemporal spectral unmixing for detecting multiple changes in hyperspectral images. IEEE Trans. Geosci. Remote Sens. 2016, 54, 2733–2748. [Google Scholar] [CrossRef]
- Hou, Z.; Li, W.; Li, L.; Tao, R.; Du, Q. Hyperspectral change detection based on multiple morphological profiles. IEEE Trans. Geosci. Remote Sens. 2021, 60, 1–12. [Google Scholar] [CrossRef]
- Du, B.; Ru, L.; Wu, C.; Zhang, L. Unsupervised deep slow feature analysis for change detection in multi-temporal remote sensing images. IEEE Trans. Geosci. Remote Sens. 2019, 57, 9976–9992. [Google Scholar] [CrossRef]
- Glorot, X.; Bengio, Y. Understanding the difficulty of training deep feedforward neural networks. In Proceedings of the Thirteenth International Conference on Artificial Intelligence and Statistics, Sardinia, Italy, 13–15 May 2010; pp. 249–256. [Google Scholar]
- Song, A.; Choi, J.; Han, Y.; Kim, Y. Change detection in hyperspectral images using recurrent 3D fully convolutional networks. Remote Sens. 2018, 10, 1827. [Google Scholar] [CrossRef]


| Confusion Matrix | Predicted | ||
|---|---|---|---|
| Change | No-Change | ||
| Actual | Change | TP | FN |
| No-Change | FP | TN | |
| Dataset | Level | OA | KC | TP | TN | FP | FN |
|---|---|---|---|---|---|---|---|
| Farmland-1 | I | 93.97 | 0.865 | 4968 | 2377 | 386 | 85 |
| II | 98.51 | 0.964 | 4968 | 2056 | 21 | 85 | |
| Farmland-2 | I | 97.08 | 0.938 | 4317 | 7037 | 309 | 32 |
| II | 99.53 | 0.990 | 3831 | 7037 | 19 | 32 |
| Case Study | All Sample Data | Training (50%) | Validation (17%) | Testing (33%) |
|---|---|---|---|---|
| Farmland-1 | 7130 | 3566 | 1212 | 2352 |
| Farmland-2 | 10,919 | 5460 | 1856 | 3603 |
| Method | DSFA-Diff | SU | MSU | SALA | Propose-Method |
|---|---|---|---|---|---|
| OA (%) | 86.64 | 92.50 | 95.16 | 94.65 | 96.33 |
| Precision (%) | 73.25 | 95.37 | 93.07 | 86.30 | 94.35 |
| MD (%) | 9.80 | 16.85 | 8.40 | 1.50 | 6.04 |
| FA (%) | 15.0 | 2.25 | 3.17 | 7.10 | 2.57 |
| F1-Score (%) | 80.86 | 88.83 | 92.32 | 92.01 | 94.15 |
| Recall (%) | 90.23 | 83.14 | 91.59 | 98.53 | 93.95 |
| KC | 0.71 | 0.83 | 0.89 | 0.880 | 0.91 |
| Method | DSFA-Diff | SU | MSU | SALA | Propose-Method |
|---|---|---|---|---|---|
| OA (%) | 88.38 | 90.06 | 89.68 | 95.96 | 96.86 |
| Precision (%) | 72.37 | 63.10 | 80.78 | 85.25 | 94.62 |
| MD (%) | 35.45 | 9.92 | 24.55 | 4.31 | 11.20 |
| FA (%) | 5.87 | 9.95 | 5.76 | 4.02 | 1.42 |
| F1-Score (%) | 68.22 | 74.21 | 78.02 | 90.16 | 91.72 |
| Recall (%) | 64.52 | 90.08 | 75.45 | 95.67 | 88.99 |
| KC | 0.61 | 0.68 | 0.72 | 0.876 | 0.898 |
| Method | Scenario 1 | Scenario 2 | Scenario 3 | Propose-Method |
|---|---|---|---|---|
| OA (%) | 95.55 | 95.05 | 96.18 | 96.86 |
| Precision (%) | 87.98 | 92.52 | 93.27 | 94.62 |
| MD (%) | 11.10 | 18.8 | 13.50 | 11.20 |
| FA (%) | 2.90 | 1.60 | 1.50 | 1.20 |
| F1-Score (%) | 88.45 | 86.46 | 89.74 | 91.72 |
| Recall (%) | 88.92 | 81.16 | 86.48 | 88.99 |
| KC | 0.857 | 0.834 | 0.874 | 0.898 |
Publisher’s Note: MDPI stays neutral with regard to jurisdictional claims in published maps and institutional affiliations. |
© 2022 by the authors. Licensee MDPI, Basel, Switzerland. This article is an open access article distributed under the terms and conditions of the Creative Commons Attribution (CC BY) license (https://creativecommons.org/licenses/by/4.0/).
Share and Cite
Seydi, S.T.; Shah-Hosseini, R.; Amani, M. A Multi-Dimensional Deep Siamese Network for Land Cover Change Detection in Bi-Temporal Hyperspectral Imagery. Sustainability 2022, 14, 12597. https://doi.org/10.3390/su141912597
Seydi ST, Shah-Hosseini R, Amani M. A Multi-Dimensional Deep Siamese Network for Land Cover Change Detection in Bi-Temporal Hyperspectral Imagery. Sustainability. 2022; 14(19):12597. https://doi.org/10.3390/su141912597
Chicago/Turabian StyleSeydi, Seyd Teymoor, Reza Shah-Hosseini, and Meisam Amani. 2022. "A Multi-Dimensional Deep Siamese Network for Land Cover Change Detection in Bi-Temporal Hyperspectral Imagery" Sustainability 14, no. 19: 12597. https://doi.org/10.3390/su141912597
APA StyleSeydi, S. T., Shah-Hosseini, R., & Amani, M. (2022). A Multi-Dimensional Deep Siamese Network for Land Cover Change Detection in Bi-Temporal Hyperspectral Imagery. Sustainability, 14(19), 12597. https://doi.org/10.3390/su141912597