Article

Potassium Determines Sugar Beets’ Yield and Sugar Content under Drip Irrigation Condition

1
College of Water Resource and Civil Engineering, China Agricultural University, Beijing 100083, China
2
Institute of Soil Fertilizer and Agricultural Water Saving, Xinjiang Academy of Agricultural Sciences, Urumqi 830091, China
3
Key Laboratory of Northwest Oasis Water-Saving Agriculture, Ministry of Agriculture and Rural Affairs, Shihezi 832000, China
*
Author to whom correspondence should be addressed.
The authors contributed equally to this work.
Sustainability 2022, 14(19), 12520; https://doi.org/10.3390/su141912520
Submission received: 22 August 2022 / Revised: 25 September 2022 / Accepted: 27 September 2022 / Published: 30 September 2022

Abstract

:
Sugar beet is one of the main sugar crops and an important cash crop in the three northern regions of China (Northeast China, North China, and Northwest China). As an arid region, Xinjiang lacks water resources. The establishment of a reasonable drip-irrigation system for sugar beet in Xinjiang can not only achieve the goal of high quality and high yield, but is also crucial for the efficient utilization of water and fertilizer. This research was implemented in the experimental field of the Xinjiang Academy of Agricultural Sciences’ Sugar Beet Improvement Center in Manas County, Xinjiang, from the year 2019. Taking ST 15140 sugar beet as the experimental variety, a field study was conducted to investigate the effects of different irrigation and fertilization methods on the yield and sugar content of sugar beets. Ten treatments of two irrigation levels (W1: 4500 m3 ha−1, W2: 5400 m3 ha−1) and five fertilization methods (F1, F2, F3, F4, and F5) were carried out in a randomized block design with three replications. The yield and sugar content; growth indicators such as leaf photosynthetic rate, stomatal conductance, chlorophyll content and intercellular CO2 concentration; and fertilizer-use efficiency (nitrogen-use efficiency (NUE), phosphorus-use efficiency (PUE), and potassium-use efficiency (KUE)) during the sugar beet growing seasons were determined. The results indicated that the W1F3 (4500 m3 ha−1, N 229.5 kg ha−1 + P2O5 180 kg ha−1 + K2O 202.5 kg ha−1 + hydroquinone 229.5 g ha−1) treatment had the highest yield and sugar content of 132.20 Mg ha−1 and 15.61%, respectively. For crop growth indicators, the photosynthetic rate (33.27 μmol m−2 s−1) and the stomatal conductance (252.67 mmol m−2 s−1) under W1F3 were both the highest among all of the treatments. The fertilizer-use efficiency in W1F3 was in the following order: KUE > NUE > PUE. The highest KUE (128.10%) and NUE (65.49%) occurred under W1F3 at the sugar accumulation stage of the crop growing season. In addition, K determined the yield and sugar content of sugar beet by influencing growth factors such as the photosynthetic rate, chlorophyll content, intercellular CO2 concentration, along with the KUE, which explained 30.2%, 5.1%, 10%, and 14.7% of the variation in yield and sugar content, respectively. The results of this study indicated that the application of an inhibitor with optimized-minus-N fertilization under lower irrigation (W1F3) was the optimal treatment. Above all, K determined the yield and sugar contents of sugar beets, emphasizing the pivotal role of K in the growth, physiological processes, and output of sugar beets.

1. Introduction

In China, sugar beet is one of the most important commercial crops, for which nearly 60,000 ha of farmland is cultivated annually in Xinjiang Province, which makes this region the largest sugar-beet-producing area [1]. Sugar beets are famous for their tolerance to water stress and ability to adapt to extreme dry weather [2,3]. Xinjiang is an arid area, with an average annual precipitation ranging from 100 to 230 mm but an average annual evaporation of 2000–3000 mm [4,5]. Therefore, irrigation water plays a crucial role in agricultural development in this water-scarce area [6]. Unlike furrow irrigation, drip irrigation supplies small and frequent water applications directly to the plants’ root zone, which has proven to be successful in saving water and improving yields [7,8,9]. Currently, the drip-irrigated sugar beet yield is approximately 60 t ha−1 in the Xinjiang area—a level that is higher than the national average yield of 35.2 t ha−1 [1].
The yield and sugar content of sugar beet are mainly influenced by the weather conditions, irrigation method, plant density, genotype, and nitrogen application—especially by irrigation and fertilization [10]. Sugar beet is thought to be one of the most water-consuming crops because of its long growth period, and its seasonal water consumption worldwide ranges from 350 to 1150 mm [11]. Deficit (low) irrigation and full (high) irrigation have different effects on crop growth [12]. Low irrigation is presumed to maximize the yield per unit of water uptake as the plant experiences water stress [13], but Saif et al. [14] noted that any degree of water stress may cause detrimental effects on the growth and, hence, the yield of the crop. Inorganic chemical fertilizers including nitrogen (N), phosphorus (P), and potassium (K) are considered to be key components for acquiring high yield and quality, and an abundant supply of nitrogen is necessary for optimal yield [15,16]. However, excessive N may result in high nitrate leaching, reducing sugar content and increasing impurities (e.g., Na, K, and amino-N) in sugar beets [17,18]. Although there have been numerous studies on how different water application levels, irrigation methods, or fertilization practices affect the quality and yield of sugar beet [19,20,21], little has been reported on the effects of the interaction between irrigation and fertilization on sugar beet yield and sugar content.
N, P, and K are essential elements for crop growth and have important influences on the yield and quality of field crops [15,22]. Among many crops, sugar beet is one of the crops that prefer fertilizer, and is sensitive to N, P, and K [23,24]. Radin and Matthews [25] indicated that both N and P deficiencies reduced stomatal conductance and constrained leaf photosynthesis and the hydraulic conductivity of the plants. Nevertheless, K can promote the enzyme activation in sugar beet, enhance its leaf photosynthesis, promote its sugar metabolism and protein synthesis, and enhance its stress resistance [26]. K also plays an important role in sugar beet growth and is necessary for the assimilation of CO2 by field crops [27]. K is needed for the maintenance of transmembrane voltage gradients and osmotic potential, as well as to regulate the movement of the stomata [28,29]. Therefore, K can increase the photosynthesis rate in sugar beet leaves, the leaf area index, the chlorophyll content, and the transportation of photosynthetic products to the roots of sugar beet [29]. Because K is beneficial to the physiological growth of crops, it can subsequently enhance the accumulation of photosynthesis products, as well as crop yield [30], and the application of K can promote the production of sugar beet dry matter and distribute it to the growth center of beets in each growth period [31]. Several previous studies have reported that the dry matter accumulation, root tuber yield, sugar content, and sugar yield of sugar beet increased with the application of K fertilizer, showing a significant positive correlation [32]. However, Campbell and Kern [33] reported that the sugar content of sugar beet was significantly negatively correlated with K (p < 0.01). Despite the key regulatory role of N, P, and K in crop production and growth, it is not clear how they affect the crop growth indicators and, hence, affect the yield and sugar content of sugar beet—particularly under extreme dry weather conditions in Xinjiang Province.
To evaluate the impacts of different irrigation and fertilization methods on sugar beets’ quality and quantity, we conducted a drip irrigation and fertilization interaction experiment in Xinjiang Province in China, and two irrigation levels and five fertilization methods were established. We determined the yield, sugar content, growth, and physiological indicators of the sugar beets. The objectives of this study were to (1) investigate the effects of different levels of water and NPK on the yield, sugar content, leaf physiology, and fertilizer-use efficiency of sugar beets; (2) determine the factors that significantly affect the yield and sugar content of sugar beets, and assess their contribution to the variations in yield and sugar content; and (3) recommend a suitable irrigation and fertilization strategy for drip-irrigated sugar beets grown in Northwest China.

2. Materials and Methods

2.1. Experimental Site and Materials

The experiment was conducted at the Sugar Beet Improvement Center in Manasi, Xinjiang Academy of Agricultural Sciences, China (43°07′–45°20″ N, 86°5′–87°08′ E). This region has a temperate continental arid and semiarid climate. The sugar beet growth season in this study was from April to October 2019. During the growth season, the average temperature and effective accumulated temperature were 21.8 °C and 2000 °C, respectively. The sunshine hours and frost-free period were approximately 1780 h and 177 days, respectively. This site represents an arid and semiarid desert region with gray desert soil or haplic Calcisol according to the FAO soil classification, which is regarded as having good soil fertility, with slight alkalinity, high nutrient concentrations, and low salt contents [34]. The soil texture of the topsoil (0–30 cm) and the subsoil (30–70 cm) is loam and clay, respectively. The topsoil (0–30 cm) properties were as follows: soil pH of 8.4; soil organic matter of 22.8 g kg−1; soil available nitrogen, phosphorus, and potassium concentrations of 125.2, 69.4, and 876 mg kg−1, respectively; soil total salt concentration of 1.2 g kg−1; soil density and field capacity of 1.57 g cm−3 and 35.48%, respectively. These soil properties were determined according to generally accepted methods [35,36].

2.2. Experimental Design

This experiment was set up in a random block design with the combination of irrigation (W) and fertilization (F). Ten treatments (W1F1, W1F2, W1F3, W1F4, W1F5, W2F1, W2F2, W2F3, W2F4, and W2F5) were included in this research (Table 1). Each treatment was replicated thrice, and protection rows were provided on both sides of the test area. The area of each plot was 30 m2 (10 m × 3 m), and each plot was irrigated through drip irrigation under plastic film. For W1, the irrigation amount was 4500 m3, the irrigation norm was 450 mm, and the irrigation was applied 10 times; for W2, the irrigation amount was 5400 m3, the irrigation norm was 540 mm, and the irrigation was applied 9 times. The irrigation amount was controlled by a water meter, and the water was delivered through a labyrinth drip-irrigation belt placed along the centerline of the mulch. Five fertilization treatments (F1, F2, F3, F4, and F5) were set under each irrigation treatment (W). The F1 treatment is the customary fertilization practice in this region, and the other fertilization treatments were applied according to different ratios of N:P2O5:K2O. The mineral N, P, and K fertilizers were urea, calcium superphosphate, and potassium chloride, respectively. A detailed description of the irrigation and fertilization treatments is provided in Table 1. The sugar beet variety was ST 15140, which is the most common local variety. The row spacing was 50 cm, and each plant was planted at 20 cm intervals within the row. The dripper spacing was 30 cm, and the discharge rate was 3 L/h.

2.3. Crop Sampling and Analysis

During the harvest time of sugar beets, the roots were taken from the middle row of each plot, and the mass of the sugar beet roots was recorded. For the sugar content, first, a 1.0 cm thick slice of the tuberous root at the central strip along an upright 45° angle was cut and crushed into juice after removing the epidermis. Then, the soluble solids content from the juice of the crushed roots was measured using a vertical scale (Expert Pro, EMC, Miam Lakes, FL, USA). The sugar content of the roots was calculated as the soluble solids content multiplied by a factor of 0.85 [37,38].
At the storage, root development, and sugar accumulation stages, growth, photodynamic rate, stomatal conductivity, chlorophyll content, and intercellular CO2 concentration were measured. We selected 10 fully expanded functional leaves (the 11th to 30th leaves) for each treatment, and took the average of the measured values during the growth period of each treatment. The leaf photosynthetic rate, stomatal conductance, and intercellular CO2 concentration were measured using an LI-6400 portable photosynthesis device (LI-6400, Li-Cor, Lincoln, NE, Dearborn, MI, USA) in the morning before irrigation (10:00–12:00). The acetone method was used to determine the chlorophyll content with a UV–Vis spectrophotometer (UV-2550, Shimadzu, Japan) [39].
Mineral nitrogen-use efficiency (NUE), phosphorus-use efficiency (PUE), and potassium-use efficiency (KUE) were estimated as the ratio of the total dry mass to the N, P, or K uptake of sugar beets during the production season, and the calculations were as follows [40]:
NUE = Y/N
PUE = Y/P
KUE = Y/K
where NUE, PUE, and KUE are measured in kg kg−1; Y is the total dry mass of the sugar beets (kg ha−1); and N, P, and K are the amounts of N, P, and K applied, respectively (kg ha−1).

2.4. Statistical Analysis

One-way analysis of variance (AVOVA) was performed with SPSS 16.0 (SPSS Inc., Chicago, IL, USA) to compare the yield, sugar content, leaf physiology, and NUE, PUE, and KUE among the different treatments. The least significant difference (LSD) was used to establish whether the differences between the treatments were significant at a p-value of 0.05. Redundancy analysis (RDA) was conducted using CANOCO 5 (Microcomputer Power, Ithaca, NY, USA) to explore the relationships between the growth indicators and leaf physiology and the yield and sugar contents. First, the root length, leaf weight, root weight, LAI, leaf photosynthetic rate, stomatal conductance, intercellular CO2 concentration, NUE, PUE, and KUE were put into the model as driving factors. The four most significant influencing factors (i.e., the photosynthetic rate, chlorophyll content, intercellular CO2 concentration, and KUE) were retained by the step iterative method, and the contributions of the photosynthetic rate, chlorophyll content, intercellular CO2 concentration, and KUE to the yield and sugar content were quantified. Figures were drawn using OriginPro 2016 (OriginLab Corporation, Northampton, MA, USA).

3. Results

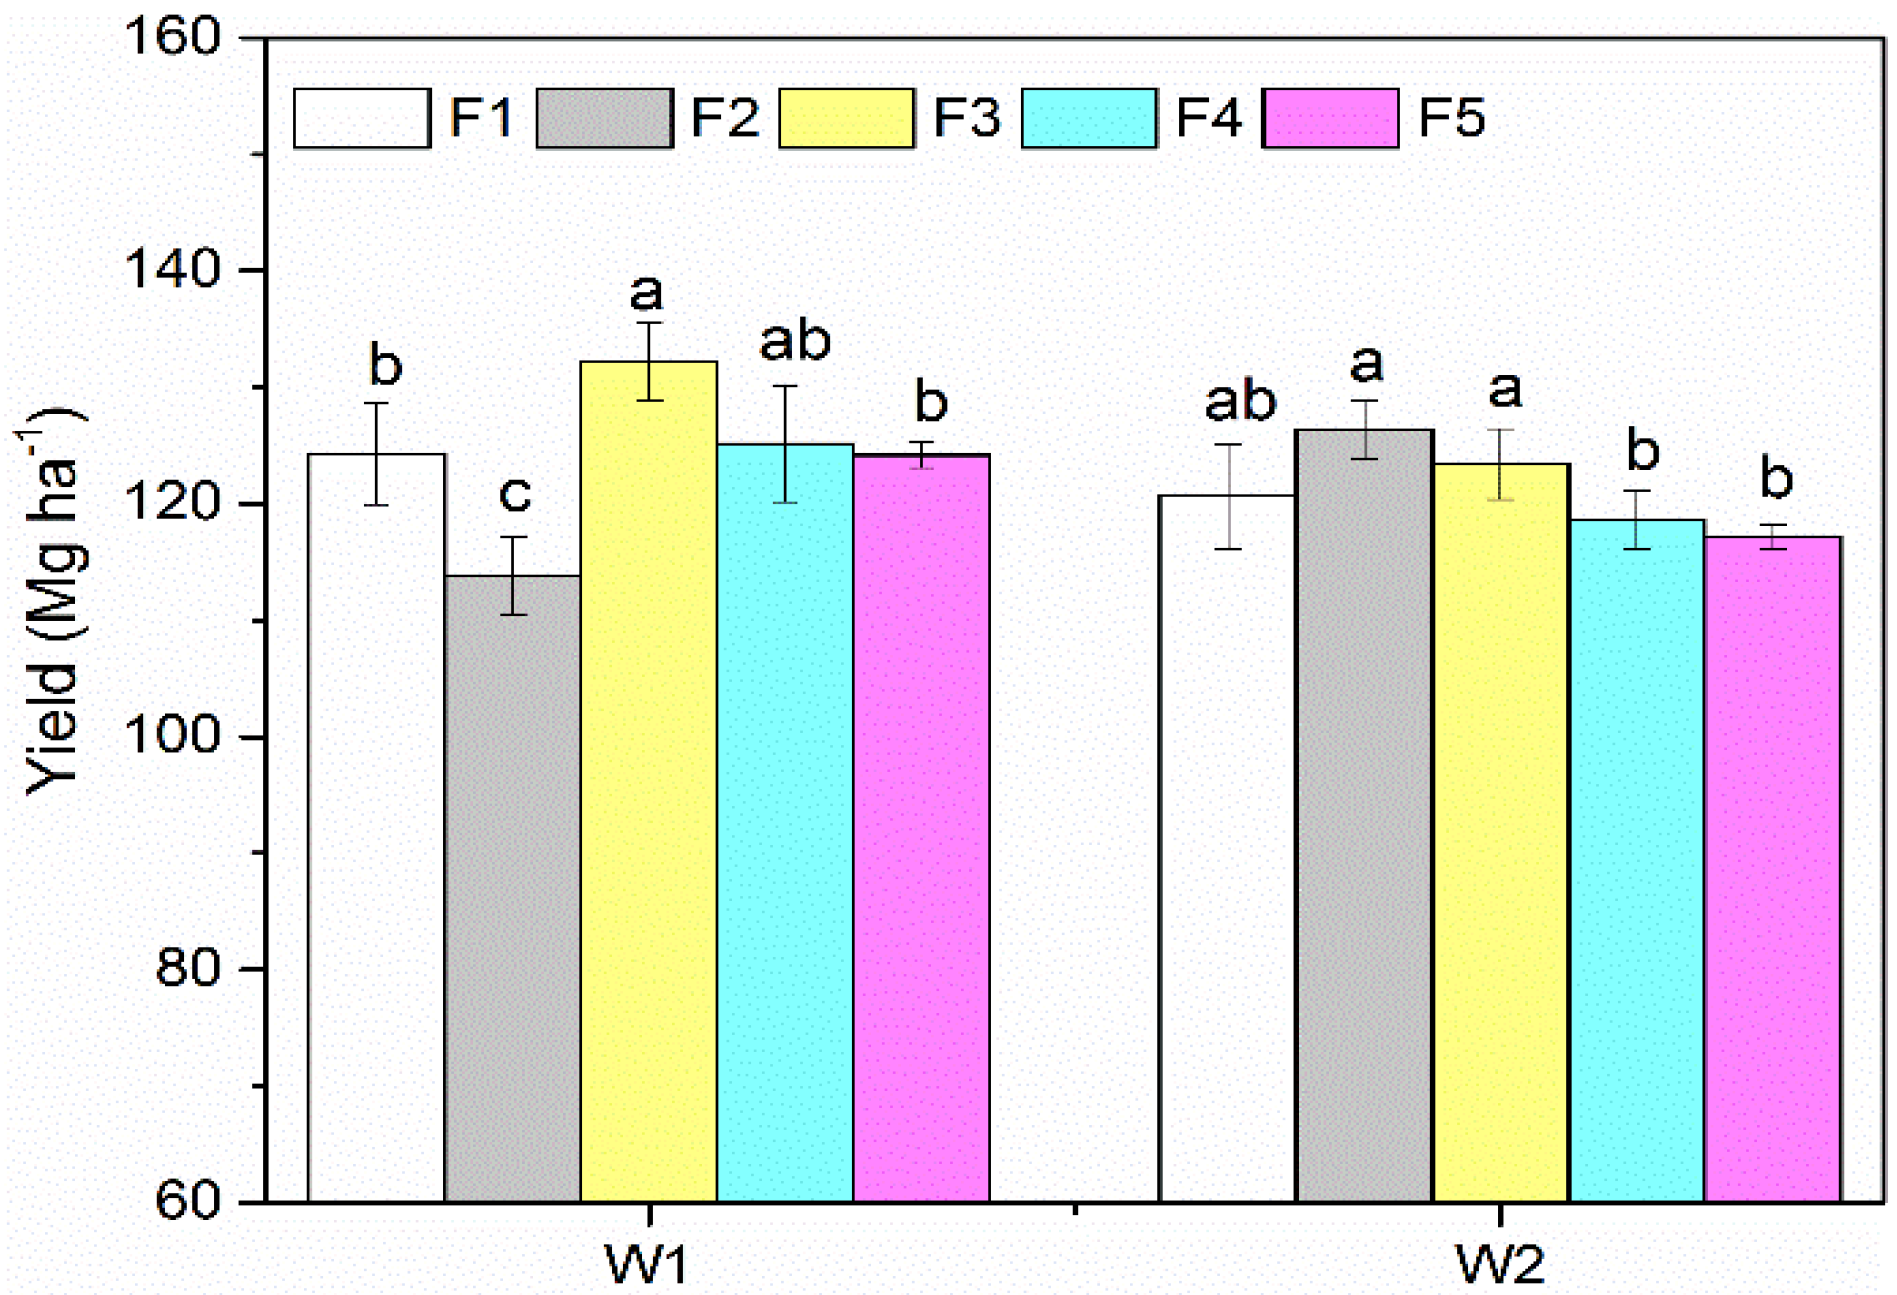
3.1. Yield and Sugar Content
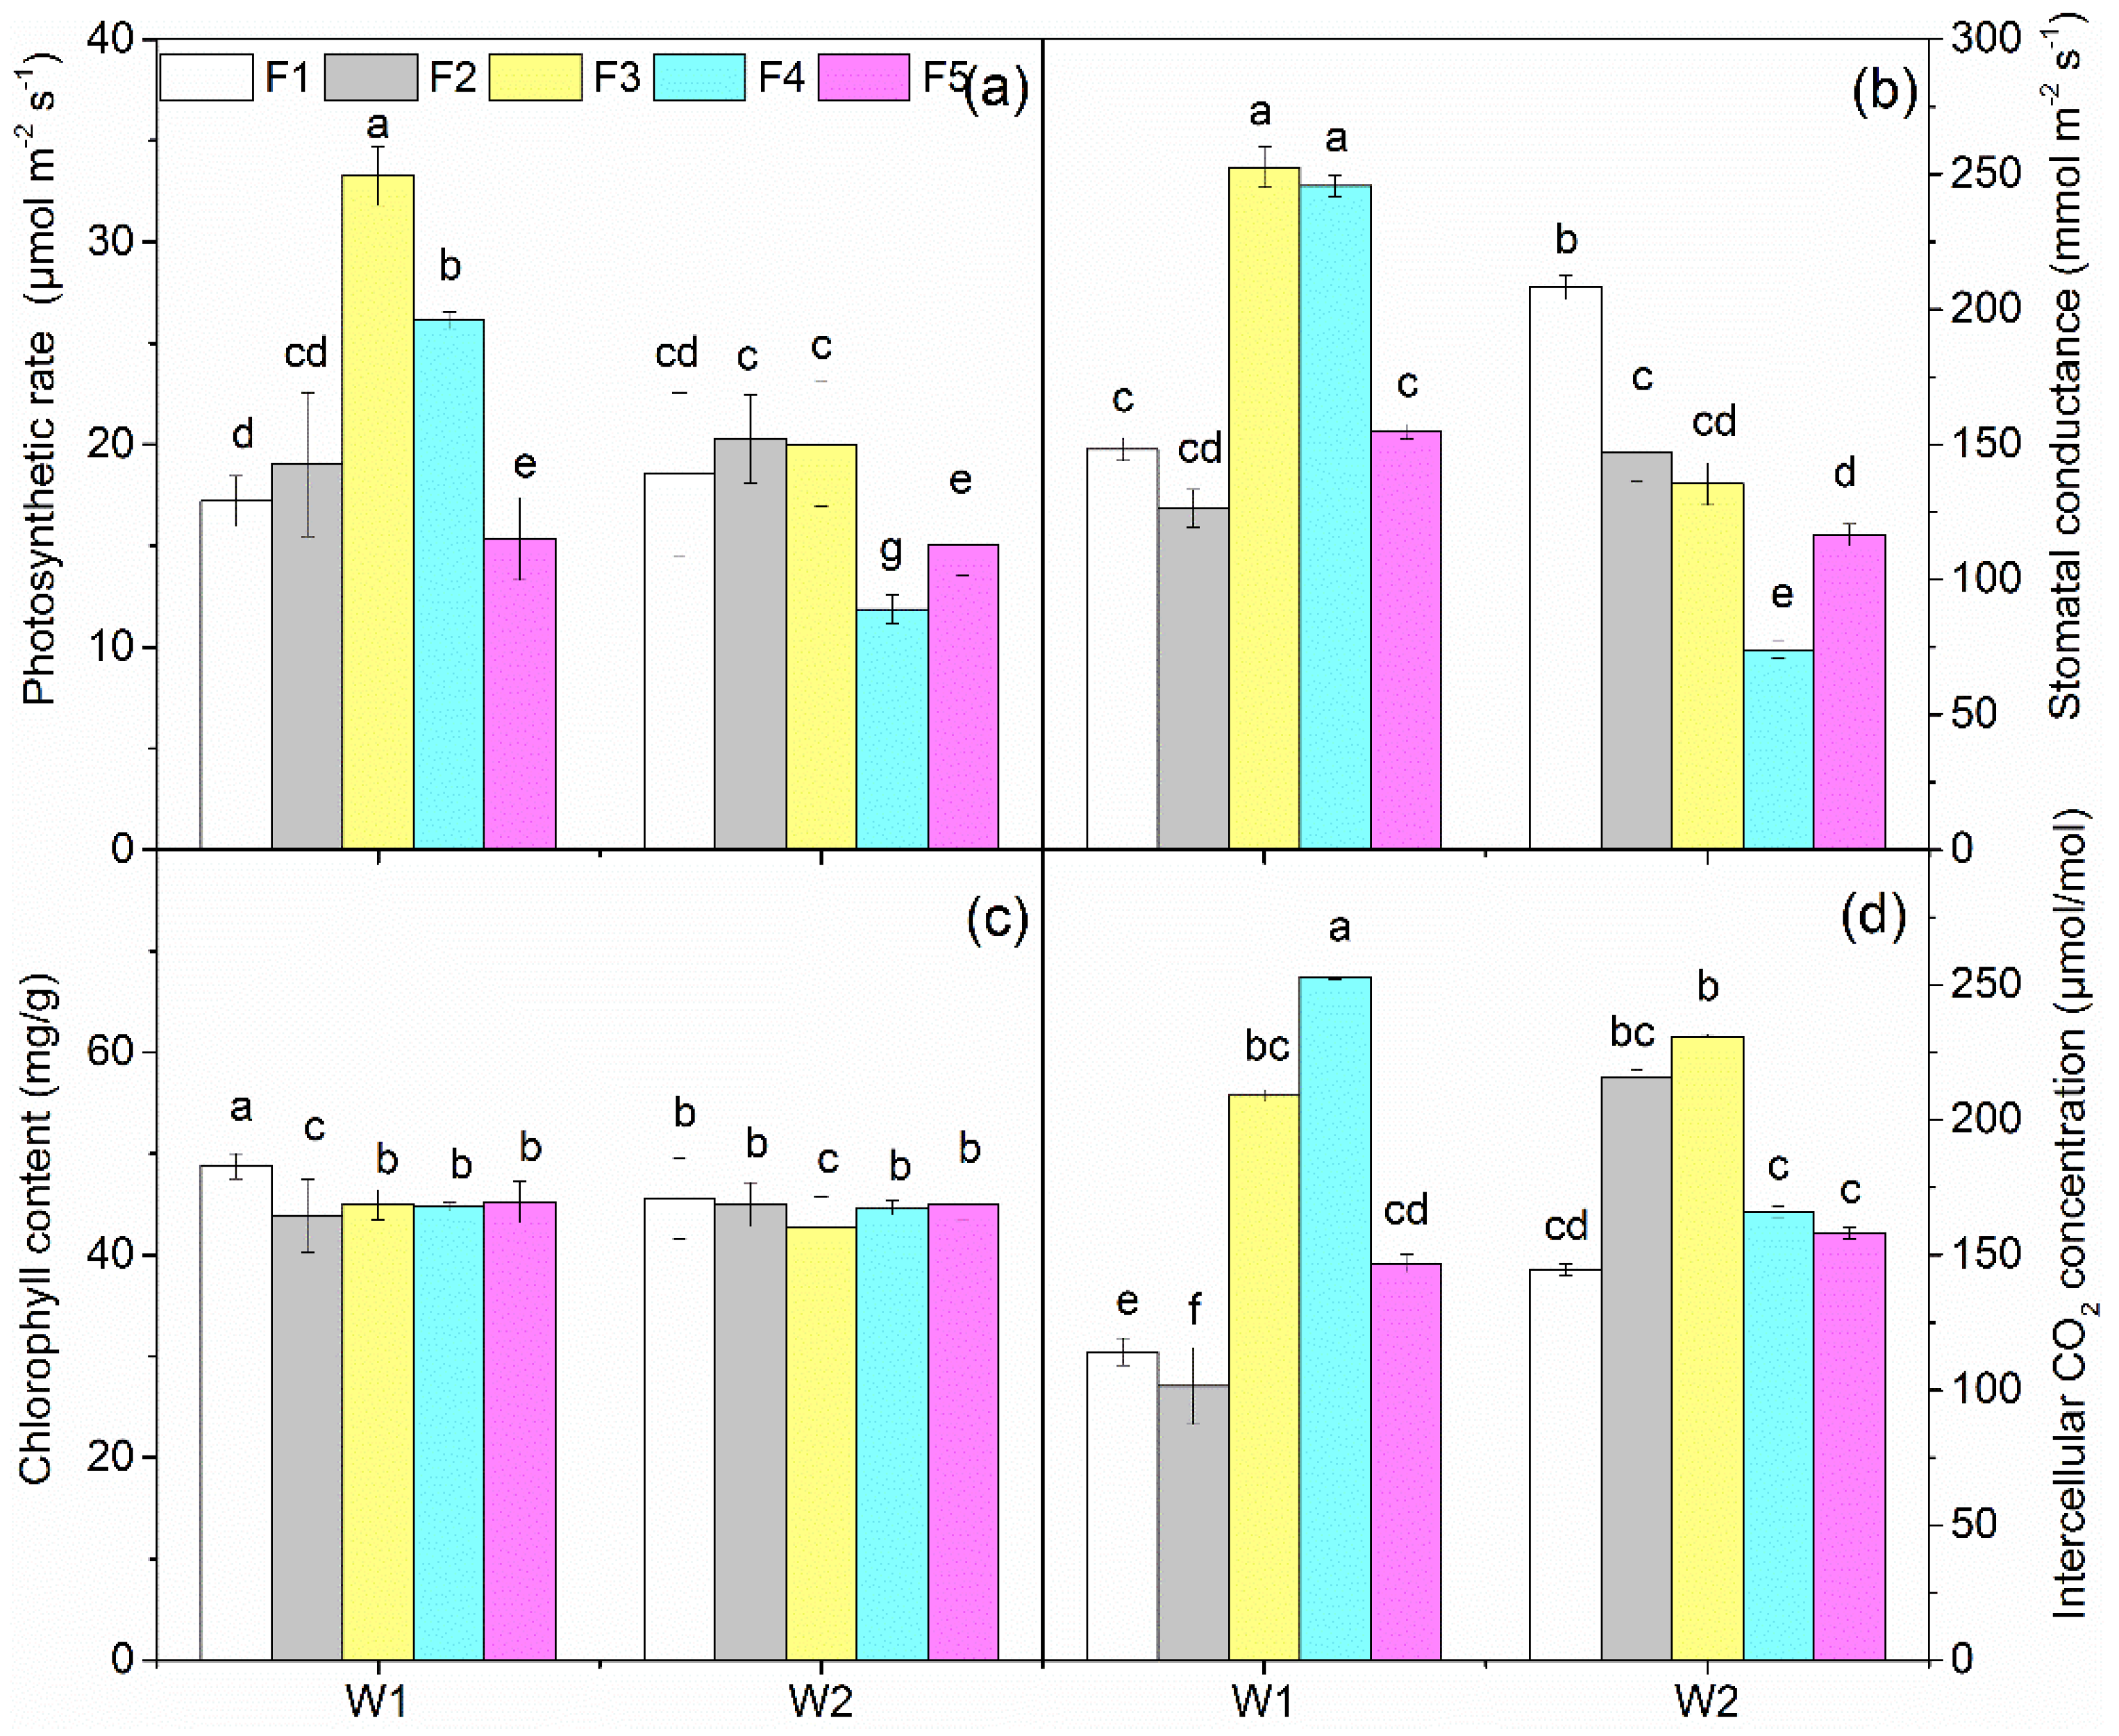
Different irrigation and fertilization practices had significant effects on the sugar beets’ yield and sugar content (Figure 1 and Figure 2). The highest sugar beet yield (132.20 Mg ha−1) occurred in the W1F3 treatment. The sugar beet yield under the W1F3 treatment was significantly higher than that under the W1F1, W1F2, and W1F5 treatments, with increases of 6.40%, 16.15%, and 6.44%, respectively. The F2 treatment had the highest yield of sugar beet (126.34 Mg ha−1) among all of the fertilization treatments under W2 conditions. The yield of sugar beet under the W2F2 and W2F3 treatments was significantly higher than that under the W2F4 (increased by 6.49% and 4.03%, respectively) and W2F5 (increased by 7.83% and 5.34%, respectively) treatments.
For the sugar content of sugar beets, the highest value occurred in the W1F3 treatment (15.61%), which was significantly higher than that in the W1F1 and W1F2 treatments, with increases of 2.50% and 3.31%, respectively. The highest sugar contents occurred in the F4 treatment, while the lowest sugar contents occurred in the F3 treatment, among all fertilization treatments under W2 conditions. The sugar content under the W2F4 treatment (16.12%) was significantly higher than that under the W2F1, W2F2, and W2F3 treatments.

3.2. Crop Growth

Different irrigation and fertilization practices also had significant effects on the photosynthetic rate, stomatal conductance, chlorophyll content, and intercellular CO2 concentration (Figure 3). The highest and lowest photosynthetic rates among all treatments (33.26 μmol m−2 s−1 and 11.88 μmol m−2 s−1, respectively) occurred in the W1F3 and W2F4 treatments, respectively. The stomatal conductance values under the W1F3 and W1F4 treatments were significantly higher than those under the other irrigation and fertilization treatments. The W2F4 treatment had the lowest stomatal conductance among all of the treatments, at 74 m mol m−2 s−1. The chlorophyll content in the W1F1 treatment was significantly higher than that in the other treatments. The W2F3 treatment had the lowest chlorophyll content among all of the treatments. The intercellular CO2 concentration under the W1F4 treatment (245.67 μmol mol−1) was significantly higher than that under the other treatments. W1F2 (126.40 μmol mol−1) had the lowest intercellular CO2 concentration compared with the other treatments.

3.3. Mineral Nitrogen-, Phosphorus-, and Potassium-Use Efficiency

The NUE, PUE, and KUE showed significant differences at the different growth stages and under the various irrigation and fertilization treatments (Table 2, Table 3 and Table 4). Overall, the fertilizer-use efficiency was as follows: KUE > NUE > PUE. The average NUE at the sugar accumulation stage was the highest compared to those in the first three growth seasons. The average NUE values of F1, F2, F3, and F4 were 36.78%, 40.21%, 47.71%, and 40.35% under W1 conditions and 37.51%, 52.99%, 43.23%, and 46.43% under W2 conditions, respectively. Under W1 conditions, the highest and lowest values of PUE appeared in the expanding stage under the F5 treatment and the seedling stage under the F4 treatment, respectively. The highest PUE values in the seedling stage, luxuriant foliage stage, expanding stage, and sugar accumulation stage were observed in the F2 treatment under W1 conditions, at 6.52%, 7.18%, 8.36%, and 7.45%, respectively. The average KUE in the luxuriant foliage stage was the lowest over the whole growing season among all of the treatments. The highest and lowest KUE values were observed in the sugar accumulation stage under W1F3 (128.10%) and the luxuriant foliage stage under W2F4 (31.12%), respectively. Under W2 conditions, the highest KUE was observed in the sugar accumulation stage under the F2 treatment.

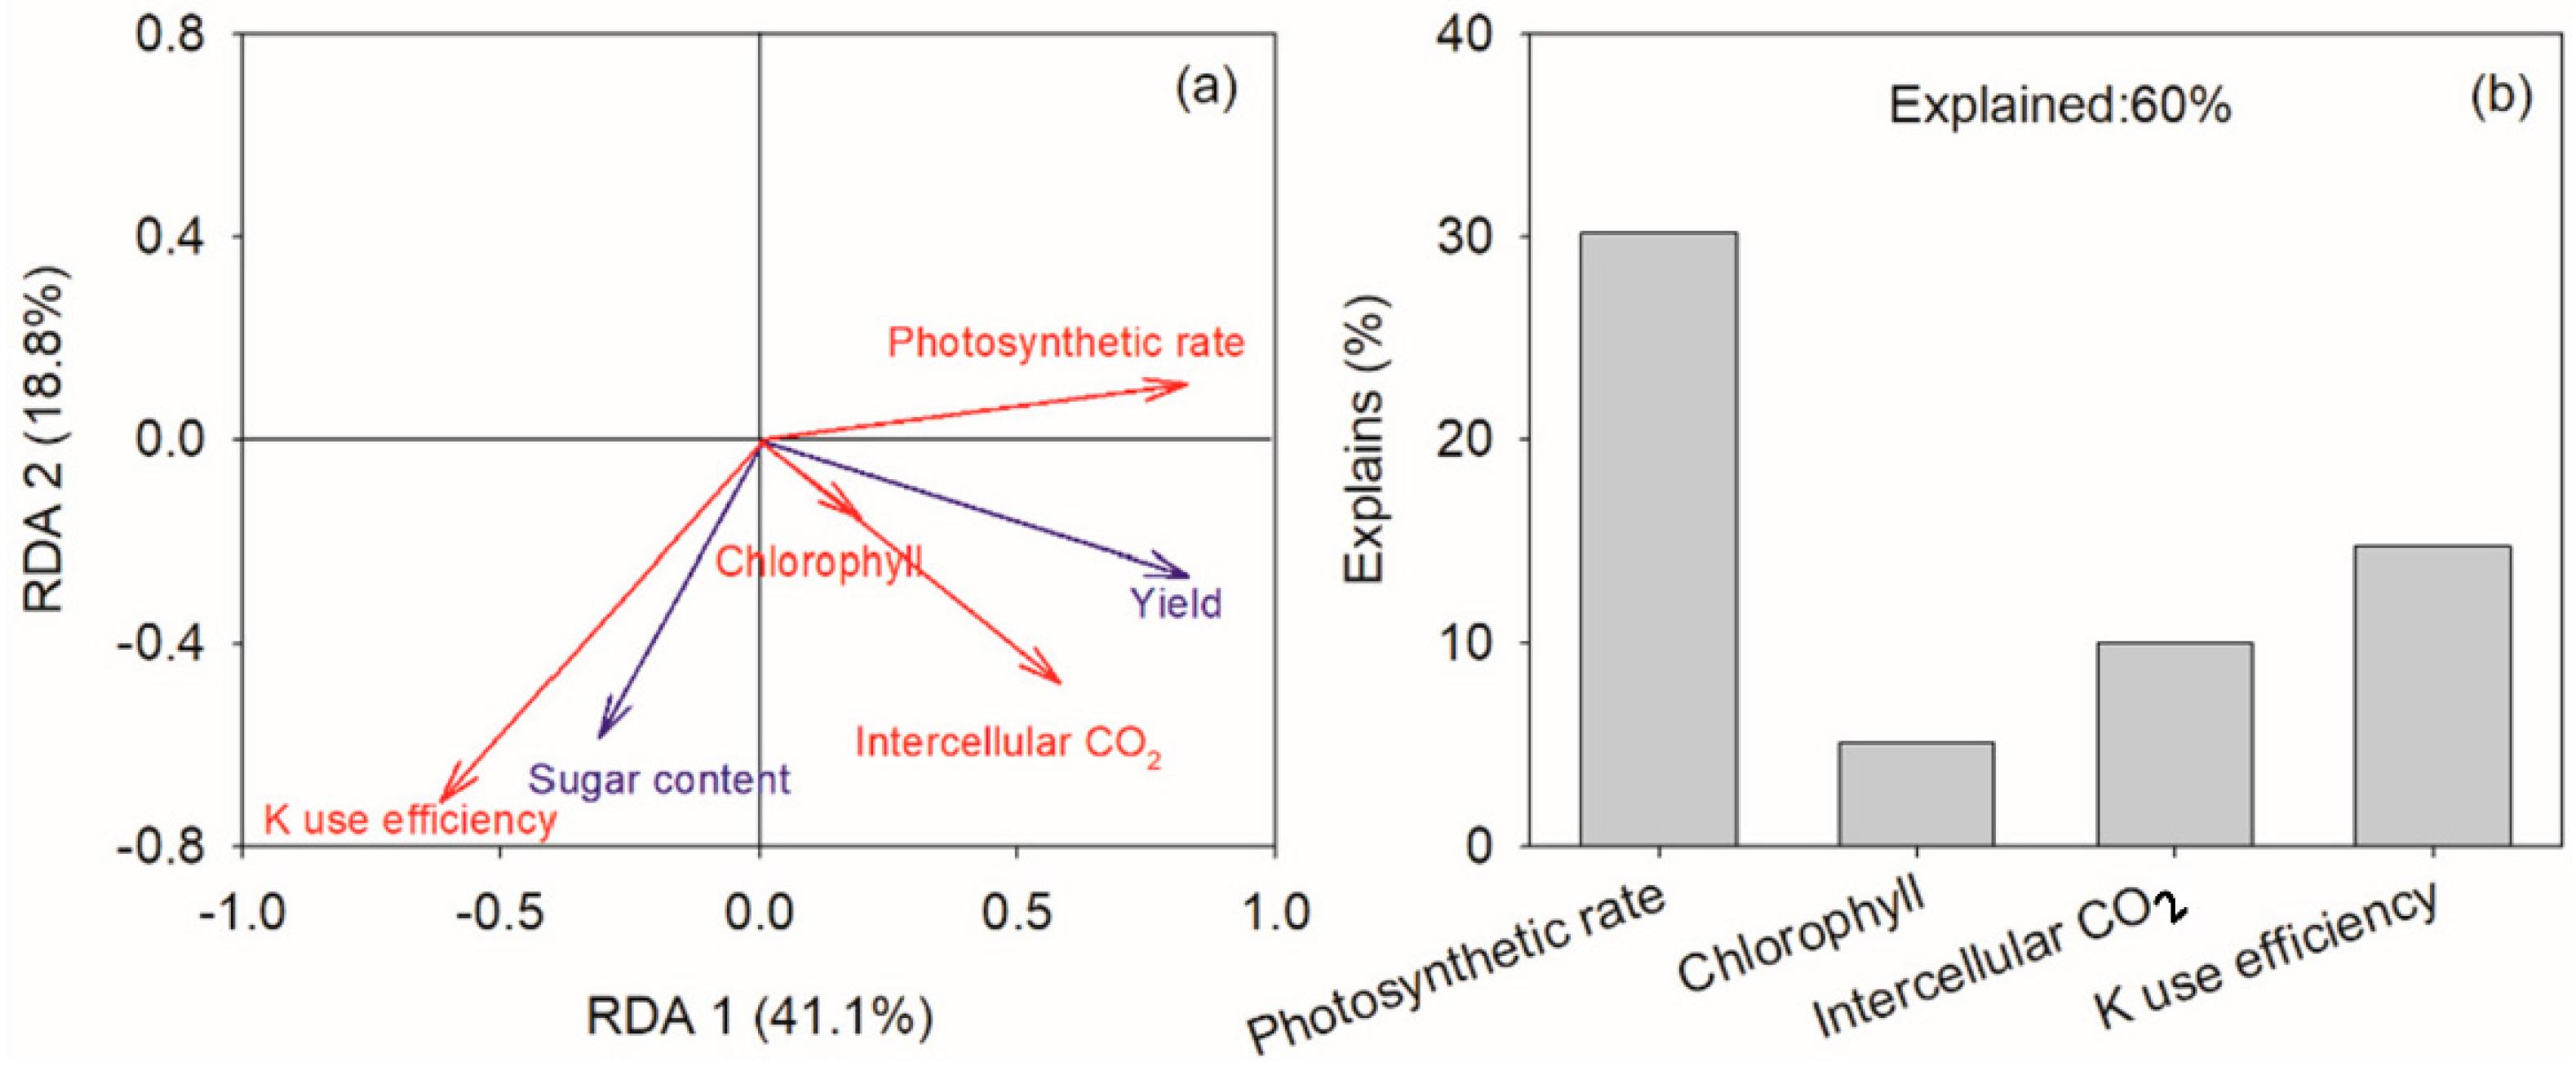
3.4. Driving Factors of Yield and Sugar Content

The first and second axes of the redundancy analysis (RDA) explained approximately 41.1% and 18.8% of the total variation in yield and sugar content, respectively (Figure 4). Photosynthetic rate, chlorophyll content, intercellular CO2, and KUE were the driving factors regulating the yield and sugar content, and the driving factors varied under the different treatments. There were positive relationships between KUE and the sugar content, and the yield of sugar beet was positively affected by the photosynthetic rate, chlorophyll content, and intercellular CO2 concentrations. However, the KUE had negative effects on the photosynthetic rate, chlorophyll content, and intercellular CO2 concentrations, as well as the yield of sugar beet. Overall, the photosynthetic rate, chlorophyll content, intercellular CO2, and KUE could explain 30.2%, 5.1%, 10%, and 14.7% of the total variation in yield and sugar content, respectively.

4. Discussion

4.1. Effects of Different Irrigation Levels and Fertilization Treatments on Yield, Sugar Content, and Growth Parameters

Previous studies reported that crop yield increased with the amount of irrigation water [24,41]. Other researchers have indicated that water stress decreases crop yield to different extents depending on the rate of N supply [42,43]. The different irrigation levels and fertilization treatments in our study significantly affected the sugar beet yield, but the highest yield in this study was under W1F3 rather than at the higher level of irrigation. This result is consistent with a previous finding [30]. Applying the optimal amount of N may amplify the effect of irrigation. The application of 229.5 kg N ha−1 produced the highest sugar beet yield, and N application above this level did not enhance the yield. It is likely that the higher level of N application promotes vegetative growth but weakens the transportation of photosynthates. Deficit irrigation can notably improve the quality of fruit due to lower dilution and less water accumulation in the fruit than under ample irrigation [44,45]. Hamzei and Soltani [46] and Li et al. [47] found that moderate soil stress and an optimal N supply could stimulate the allocation of aboveground biomass to the fruit. Similar to these findings, we found that the highest sugar yield was under the W1F3 treatment in the present research. Masri et al. [48] found that sugar yield significantly increased with the addition of N from 60 to 120 kg/fed. Several previous studies found that sugar beet root and sugar yields were not significantly different between 100–300 kg ha−1 [49], 180–240 kg ha−1 [50], and 120–240 kg ha−1 [21] of nitrogen application. We speculated that the minimal N application in this study was sufficient for plant growth, which could have weakened the role of increased N in improving the yield and quality of sugar beet. Overall, water and N are the most effective factors in crop production, and the combined impact of irrigation and fertilization is more important than their individual influences.
The photosynthetic rate was affected by water and N to a great extent [51]. In our study, the photosynthetic rate was the highest in W1F3 but the lowest in W2F4. In addition to their different irrigation levels, the distinct difference between the two treatments was whether the lower N amount was paired with an inhibitor or with a microbial fertilizer. The inhibitor retarded the release of nitrogen, substantially increasing the N uptake and use efficiency in the plants. The optimal fertilizer minus N together with the lower irrigation level maximized the photosynthetic efficiency of the plants, and was better for field crop management than the other combinations. Kang and Zhang [52] reported that drip irrigation may greatly reduce water loss but has little influence on photosynthesis. Our study showed that the average chlorophyll content under W1 and W2 did not vary significantly. However, the optimal fertilizer minus N at the lower irrigation level (W1F3 and W1F4) significantly increased the stomatal conductance and the intercellular CO2 concentration, which is consistent with previous findings [53,54].
Nitrogen-use efficiency (NUE) was found to decrease with increasing N addition and water supply [55,56]. Sun et al. [43] reported that NUE tends to increase with increasing water supply at a constant rate of N application. Scholberg et al. [57] reported that NUE appeared to decrease when the added water was above 223.0 mm; this was likely caused by water dilution or N leaching, which decrease NUE. In the present study, the highest NUE was recorded with optimal fertilizer minus N under W1 (W1F3). It is clear that NUE was negatively affected by the water regime, while it was enhanced with a reduction in N fertilizer rates. This result is consistent with the findings of a previous study conducted by [58]. Hence, for crop production management, the optimal N application rate depends on the optimal amount of applied irrigation water. For PUE, the highest value was under W1F5 at the expanding stage. At this stage, the remobilization of P from senescing tissues may become a very important internal source of P [59]. However, at the W2 irrigation level, the PUE of the F2 treatment was significantly higher than that in the other fertilization treatments, indicating the increased uptake of P under the W2F2 treatment. One possible reason for this is that plants’ roots release large amounts of organic acids to enhance the uptake of available P under relatively low P application conditions [60,61]. The highest KUE was found at the sugar accumulation stage under W1F3, indicating higher absorption and transportation of K under W1F3 than under the other treatments. White [62] reported that the most important KUE mechanisms within plants include greater and more effective redistribution of K within plants—particularly from senescent to younger tissues—and tolerance to low tissue K concentrations. At the sugar accumulation stage, the accumulation of sugar and starch in roots promotes the redistribution of K, which may improve the KUE of plants.

4.2. The Predominant Role of K in Sugar Beet Yield and Sugar Content

K plays a key role in a large range of metabolic functions in plants, including stomatal opening and photosynthesis, translocation of photosynthates, enzyme activation, and osmotic potential, as well as fruit quality [63,64]. According to Yang et al. [65], KUE is closely associated with the efficient translocation and distribution of K and carbohydrates within plants. Waraich et al. [66] found that K within crops not only affected their photosynthetic efficiency, but also regulated their photosynthate distribution. In the present study, the efficient translocation and distribution of K and sugars was likely responsible for the high correlations between KUE and the sugar contents of the sugar beet. In addition, K can regulate the osmotic pressure of beets and other crops’ roots, which is conducive to the absorption of water and fertilizer. It can also regulate nitrogen metabolism, reduce the amount of nitrogen absorbed by crops—affecting the soluble components in sugar juice—and further improve the quality of sugar beet [67]. In addition, K is thought to be able to increase NUE and PUE as well as overall agricultural productivity [68]. K can promote the synthesis and transportation of sugar and amino acid in sugar beet, and can improve the yield increase benefit and nitrogen fixation capacity of N fertilizer [48]. Because N and P are crucial resources for the growth, physiology, and nutrient uptake of plants, their availability significantly affects crop yield and quality [69]. Theoretically, an increase in NUE and PUE may lead to a corresponding increase in sugar content in sugar beets. Moreover, the influence of K on the seasonal variations in stomatal opening and closure probably leads to high water-use efficiency in field crops [70]. Because irrigation can affect fertilizer-use efficiency and plant development [23,24], the higher the water-use efficiency, the better the crop growth. Hence, the higher sugar content of sugar beet may be ascribed to its greater ability to utilize K efficiently.
Previous studies found that K has significant effects on plants’ photosynthesis traits, such as stomatal conductance and intercellular CO2 concentration [71]. Crop roots can transport K into leaves to improve chlorophyll production and enhance photosynthesis, so as to maintain leaf function and plant growth [72]. However, in the present study, we found that K had negative effects on these photosynthesis indicators and sugar beet yield, although there were strong correlations between the latter two indicators. As reported by Naumann et al. [73], the photosynthetic process, including diffusion of CO2 to the chloroplasts and stomatal opening, can be inhibited by salinity (K+, Na+) [74,75]. In addition, the process by which K enters a plant is considered to be very complex, as it is a mixture of uptake and utilization [76]. K uptake is mainly controlled by root characteristics (e.g., root architecture, root exudates, and root surfaces), while the utilization of K can be estimated from the responses of crop yield and quality [71,77,78]. As Gerendás et al. [79] noted, efficiency indicators cannot fully represent agronomic yield. Thus, the negative relationships between KUE and yield in this study may not accurately describe the actual effects of K on sugar beet yield. However, based on these significant influences of K on physiological growth, the modulatory role of K in sugar beet yield and sugar content is worthy of our attention in future agricultural production studies.

5. Conclusions

The present study investigated the effects of different irrigation and fertilization treatments on sugar beet yield and sugar content. The results showed that the highest yield and sugar content were obtained from the W1F3 treatment. Moreover, both the photosynthetic rate and stomatal conductance under the W1F3 treatment were the highest among all of the treatments, and the highest KUE and NUE occurred in W1F3 at the sugar accumulation stage during the sugar beet growing season. Therefore, the W1F3 treatment, with the highest yield and KUE, can be recommended for the cultivation of sugar beet in similar climatic conditions in terms of water and fertilizer savings. In addition, there were close relationships between K levels and sugar beets’ physiological growth indicators, suggesting the determinant role of K in sugar beet yield and sugar content.

Author Contributions

X.X., Q.Z. and Y.X., conceived and designed the experiments. X.X., Q.Z., Y.X., X.M. and F.D. analyzed the data. X.X. wrote and revised the paper. G.L. Revised the paper and provided guidance. All authors have read and agreed to the published version of the manuscript.

Funding

This work was financially supported by the National Key Research and Development Program of China (Grant No. 2017YFD0201506-4),the Major Science and Technology Project of Xinjiang Uygur Autonomous Region (2020A01003-2) and the National Key Research and Development Program of China (2021YFD1900800).

Institutional Review Board Statement

Not applicable.

Informed Consent Statement

Not applicable.

Data Availability Statement

Not applicable.

Acknowledgments

Financial support from the Institute of Soil Fertilizer and Agricultural Water Saving, Xinjiang Academy of Agricultural Sciences. We thank all of our colleagues who were involved in these long-term trials and helped maintain these unique experiments. We gratefully acknowledge the helpful comments by the anonymous referees who stimulated significant improvements in the analysis and writing.

Conflicts of Interest

The authors declare no conflict of interest.

References

  1. Hua, F.; Yangyang, L.; Cong, F.; Peishu, H.; Kaiyong, W. Energy-Use Efficiency and Economic Analysis of Sugar Beet Production in China: A Case Study in Xinjiang Province. Sugar Tech 2016, 18, 309–316. [Google Scholar] [CrossRef]
  2. Sagar, G.R.; Salter, P.J.; Goode, J.E. Crop Responses to Water at Different Stages of Growth. J. Ecol. 1967, 56, 626. [Google Scholar] [CrossRef]
  3. Ghamarnia, H.; Arji, I.; Sepehri, S.; Norozpour, S.; Khodaei, E. Evaluation and Comparison of Drip and Conventional Irrigation Methods on Sugar Beets in a Semiarid Region. J. Irrig. Drain. Eng. 2011, 138, 90–97. [Google Scholar] [CrossRef]
  4. Zhang, H.; Bai, C.; Wang, H.Z.; Zhang, H.Z.; Xiao, L.I.; Zeng, F.U. Research progress of proteomics in sugar beet. Sugar Crops China 2017, 39, 58–61+74. [Google Scholar]
  5. Cui, J. On the development and utilization of water resources and ecological environment in Xinjiang. West. Expl. Proj. 2018, 8, 129–140. [Google Scholar]
  6. Gençoğlan, C.; Altunbey, H.; Gençoğlan, S. Response of green bean (P. vulgaris L.) to subsurface drip irrigation and partial rootzone-drying irrigation. Agric. Water Manag. 2006, 84, 274–280. [Google Scholar] [CrossRef]
  7. Bhardwaj, S. Importance of drip irrigation in Indian agriculture. Kissan World 2001, 28, 32–33. [Google Scholar]
  8. Janat, M. Effect of drip fertigation on improvement of potato yield and water use efficiency. AECS-A/RRE 2003, 126, 1–38. [Google Scholar]
  9. Rahil, M.; Antonopoulos, V. Simulating soil water flow and nitrogen dynamics in a sunflower field irrigated with reclaimed wastewater. Agric. Water Manag. 2007, 92, 142–150. [Google Scholar] [CrossRef]
  10. Kuchaki, A.; Soltani, A. Sugar Beet Agronomy; Mashhad University Publisher: Mashhad, Iran, 1995. [Google Scholar]
  11. Allen, G.R.; Pereira, L.S.; Raes, D.; Smith, M. Crop evapotranspiration-Guidelines for computing crop water re-quirements-FAO Irrigation and drainage paper 56. Fao Rome 1998, 300, D05109. [Google Scholar]
  12. Kiymaz, S.; Ertek, A. Yield and quality of sugar beet (Beta vulgaris L.) at different water and nitrogen levels under the climatic conditions of Kırsehir, Turkey. Agric. Water Manag. 2015, 158, 156–165. [Google Scholar] [CrossRef]
  13. Kirda, C. Deficit Irrigation Scheduling Based on Plant Growth Stages Showing Water Stress Tolerance; Deficit Irrigation Practices, Water Reports; Food and Agricultural Organization of the United Nations: Rome, Italy, 2002; Volume 22, 102p. [Google Scholar]
  14. Saif, U.; Maqsood, M.; Farooq, M.; Hussain, S.; Habib, A. Effect of planting patterns and different irrigation levels on yield and yield component of maize (Zea mays L.). Int. J. Agric. Biol. 2003, 1, 64–66. [Google Scholar]
  15. Li, Z.; Liu, M.; Wu, X.; Han, F.; Zhang, T. Effects of long-term chemical fertilization and organic amendments on dynamics of soil organic C and total N in paddy soil derived from barren land in subtropical China. Soil Tillage Res. 2010, 106, 268–274. [Google Scholar] [CrossRef]
  16. Zhu, Z.; Ge, T.; Liu, S.; Hu, Y.; Ye, R.; Xiao, M.; Tong, C.; Kuzyakov, Y.; Wu, J. Rice rhizodeposits affect organic matter priming in paddy soil: The role of N fertilization and plant growth for enzyme activities, CO2 and CH4 emissions. Soil Biol. Biochem. 2018, 116, 369–377. [Google Scholar] [CrossRef]
  17. Ouda, S.M. Effect of nitrogen and sulpher fertilizers levels on sugar beet in newly cultivated sandy soil. Zagazig J. Agric. Res. 2003, 29, 33–50. [Google Scholar]
  18. Abdel-Motagally, F.M.; Attia, K.K. Response of sugar beet plants to nitrogen and potassium fertilization in sandy calcareous soil. Int. J. Agric. Biol. 2009, 11, 695–700. [Google Scholar]
  19. Sharifi, H.; Hosseinpor, M.; Rahnama, A. Effect of irrigation termination before harvest and late nitrogen applica-tion on sugar beet, yield and quality and root rot in Dezful. Sugar Beet J. 2002, 17, 86–98. [Google Scholar]
  20. Vazifedoust, M.; van Dam, J.; Feddes, R.; Feizi, M. Increasing water productivity of irrigated crops under limited water supply at field scale. Agric. Water Manag. 2008, 95, 89–102. [Google Scholar] [CrossRef]
  21. Tsialtas, J.; Maslaris, N. Nitrogen effects on yield, quality and K/Na selectivity of sugar beets grown on clays under semi-arid, irrigated conditions. Int. J. Plant Prod. 2013, 7, 355–372. [Google Scholar] [CrossRef]
  22. Huang, S.; Peng, X.; Huang, Q.; Zhang, W. Soil aggregation and organic carbon fractions affected by long-term fer-tilization in a red soil of subtropical China. Geoderma 2010, 154, 364–369. [Google Scholar] [CrossRef]
  23. Aujla, M.; Thind, H.; Buttar, G. Fruit yield and water use efficiency of eggplant (Solanum melongema L.) as influ-enced by different quantities of nitrogen and water applied through drip and furrow irrigation. Sci. Hortic. 2007, 112, 142–148. [Google Scholar] [CrossRef]
  24. Kuscu, H.; Turhan, A.; Ozmen, N.; Aydinol, P.; Demir, A.O. Optimizing levels of water and nitrogen applied through drip irrigation for yield, quality, and water productivity of processing tomato (Lycopersicon esculentum Mill.). Hortic. Environ. Biotechnol. 2014, 55, 103–114. [Google Scholar] [CrossRef]
  25. Radin, J.W.; Matthews, M.A. Water transport properties of cortical cells in roots of nitrogen-and phospho-rus-deficient cotton seedlings. Plant Physiol. 1989, 89, 264–268. [Google Scholar] [CrossRef] [PubMed]
  26. Füllgrabe, H.; Claassen, N.; Hilmer, R.; Koch, H.; Dittert, K.; Kreszies, T. Potassium deficiency reduces sugar yield in sugar beet through decreased growth of young plants. J. Plant Nutr. Soil Sci. 2022. [Google Scholar] [CrossRef]
  27. Hu, W.; Coomer, T.D.; Loka, D.A.; Oosterhuis, D.M.; Zhou, Z. Potassium deficiency affects the carbon-nitrogen balance in cotton leaves. Plant Physiol. Biochem. 2017, 115, 408–417. [Google Scholar] [CrossRef] [PubMed]
  28. Humble, G.; Raschke, K. Stomatal opening quantitatively related to potassium transport: Evidence from electron probe analysis. Plant Physiol. 1971, 48, 447–453. [Google Scholar] [CrossRef]
  29. Kaiser, W.M. Correlation between changes in photosynthetic activity and changes in total protoplast volume in leaf tissue from hygro-, meso- and xerophytes under osmotic stress. Planta 1982, 154, 538–545. [Google Scholar] [CrossRef]
  30. DU, Y.-D.; Cao, H.-X.; Liu, S.-Q.; Gu, X.; Cao, Y.-X. Response of yield, quality, water and nitrogen use efficiency of tomato to different levels of water and nitrogen under drip irrigation in Northwestern China. J. Integr. Agric. 2017, 16, 1153–1161. [Google Scholar] [CrossRef]
  31. El-Mageed, T.A.A.; Mekdad, A.A.A.; Rady, M.O.A.; Abdelbaky, A.S.; Saudy, H.S.; Shaaban, A. Physio-biochemical and Agronomic Changes of Two Sugar Beet Cultivars Grown in Saline Soil as Influenced by Potassium Fertilizer. J. Soil Sci. Plant Nutr. 2022, 1–19. [Google Scholar] [CrossRef]
  32. Hadir, S.; Gaiser, T.; Hüging, H.; Athmann, M.; Pfarr, D.; Kemper, R.; Ewert, F.; Seidel, S. Sugar beet shoot and root pheno-typic plasticity to nitrogen, phosphorus, potassium and lime omission. Agriculture 2020, 11, 21. [Google Scholar] [CrossRef]
  33. Campbell, L.G.; Kern, J.J. Relationships among components of yield and quality of sugarbeets. J. Am. Soc. Sugar Beet Technol. 1983. Available online: https://bsdf-assbt.org/wp-content/uploads/2017/04/JSBRVol22No2P135to145RelationshipsAmongComponentsofYieldandQualityofSugarbeets.pdf (accessed on 1 August 2022). [CrossRef]
  34. WRB, I.W.G. World reference base for soil resources 2014: International soil classification system for naming soils and creating legends for soil maps. World Soil Resour. Rep. 2014, 106, 12–21. [Google Scholar]
  35. Page, A.L.; Miller, R.H.; Keeney, D.R. Methods of Soil Analysis: Chemical and Microbiological Properties; American Society of Agronomy, Inc.: Madison, WI, USA, 1982. [Google Scholar]
  36. Klute, A.; Dirksen, C. Hydraulic conductivity and diffusivity: Laboratory methods. Methods Soil Anal. Part 1 Phys. Mineral. Methods 1986, 5, 687–734. [Google Scholar]
  37. Afshar, R.K.; Nilahyane, A.; Chen, C.; He, H.; Stevens, W.B.; Iversen, W.M. Impact of conservation tillage and ni-trogen on sugarbeet yield and quality. Soil Tillage Res. 2019, 191, 216–223. [Google Scholar] [CrossRef]
  38. Afshar, R.K.; Chen, C.; Eckhoff, J.; Flynn, C. Impact of a living mulch cover crop on sugarbeet establishment, root yield and sucrose purity. Field Crops Res. 2018, 223, 150–154. [Google Scholar] [CrossRef]
  39. Watson, D.J. Comparative Physiological Studies on the Growth of Field Crops: I. Variation in Net Assimilation Rate and Leaf Area between Species and Varieties, and within and between Years. Ann. Bot. 1947, 11, 41–76. [Google Scholar] [CrossRef]
  40. López-Bellido, R.; López-Bellido, L. Efficiency of nitrogen in wheat under Mediterranean conditions: Effect of tillage, crop rotation and N fertilization. Field Crops Res. 2001, 71, 31–46. [Google Scholar] [CrossRef]
  41. Yavuz, D.; Seymen, M.; Yavuz, N.; Türkmen, Ö. Effects of irrigation interval and quantity on the yield and quality of confectionary pumpkin grown under field conditions. Agric. Water Manag. 2015, 159, 290–298. [Google Scholar] [CrossRef]
  42. Chen, J.; Kang, S.; Du, T.; Qiu, R.; Guo, P.; Chen, R. Quantitative response of greenhouse tomato yield and quality to water deficit at different growth stages. Agric. Water Manag. 2013, 129, 152–162. [Google Scholar] [CrossRef]
  43. Sun, Y.; Hu, K.L.; Fan, Z.B.; Wei, Y.P.; Lin, S.; Wang, J.G. Simulating the fate of nitrogen and optimizing water and nitrogen management of greenhouse tomato in North China using the EU-Rotate_N model. Agric. Water Manag. 2013, 128, 72–84. [Google Scholar] [CrossRef]
  44. Mitchell, J.; Shennan, C.; Grattan, S.; May, D. Tomato fruit yields and quality under water deficit and salinity. J. Am. Soc. Hortic. Sci. 1991, 116, 215–221. [Google Scholar] [CrossRef] [Green Version]
  45. Guichard, S.; Gary, C.; Longuenesse, J.; Leonardi, C. Water fluxes and growth of greenhouse tomato fruits under summer conditions. In III International Workshop on Models for Plant Growth and Control of the Shoot and Root Environments in Greenhouses; ISHS: Leuven, Belgium, 1999; Volume 507, pp. 223–230. [Google Scholar]
  46. Hamzei, J.; Soltani, J. Deficit irrigation of rapeseed for water-saving: Effects on biomass accumulation, light interception and radiation use efficiency under different N rates. Agric. Ecosyst. Environ. 2012, 155, 153–160. [Google Scholar] [CrossRef]
  47. Li, X.; FLiu GLi, Q.L.i.n.; Jensen, C.R. Soil microbial response, water and nitrogen use by tomato under different irrigation regimes. Agric. Water Manag. 2010, 98, 414–418. [Google Scholar] [CrossRef]
  48. Masri, M.I.; Ramadan, B.S.B.; El-Shafai, A.M.A.; El-Kady, M.S. Effect of water stress and fertilization on yield and quality of sugar beet under drip and sprinkler irrigation systems in sandy soil. Int. J. Agric. Sci. 2015, 5, 414–425. [Google Scholar]
  49. Schmehl, W.R.; Finkner, R.; Swink, J. Effect of Nitrogen Fertilization on Yield and Quality of Sugar beets. J. Sugar Beet Res. 1963, 12, 538–544. [Google Scholar] [CrossRef]
  50. Jahedi, A.; Noorozi, A.; Hasani, M.; Hamdi, F. Effect of irrigation methods and nitrogen application on sugar beet yield and quality. J. Sugar Beet 2012, 28, 23–28. [Google Scholar]
  51. Mofokeng, M.; Steyn, J.; Plooy, C.D.; Prinsloo, G.; Araya, H. Growth of Pelargonium sidoides DC. in response to water and nitrogen level. S. Afr. J. Bot. 2015, 100, 183–189. [Google Scholar] [CrossRef]
  52. Kang, S.; Zhang, J. Controlled alternate partial root-zone irrigation: Its physiological consequences and impact on water use efficiency. J. Exp. Bot. 2004, 55, 2437–2446. [Google Scholar] [CrossRef]
  53. Zhang, S.; Li, Y. Study on effects of fertilizing on crop yield and its mechanism to raise water use efficiency. Res. Soil Water Conserv. 1996, 3, 185–191. [Google Scholar]
  54. Yang, Q.; Zhang, F.; Li, F. Effect of different drip irrigation methods and fertilization on growth, physiology and water use of young apple tree. Sci. Hortic. 2011, 129, 119–126. [Google Scholar] [CrossRef]
  55. Song, X.-Z.; Zhao, C.-X.; Wang, X.-L.; Li, J. Study of nitrate leaching and nitrogen fate under intensive vegetable production pattern in northern China. Comptes Rendus. Biol. 2009, 332, 385–392. [Google Scholar] [CrossRef] [PubMed]
  56. Ju, M.; Xu, Z.; Wei-Ming, S.; Guang-Xi, X.; Zhao-Liang, Z. Nitrogen balance and loss in a greenhouse vegetable system in southeastern China. Pedosphere 2011, 21, 464–472. [Google Scholar]
  57. Scholberg, J.; Parsons, L.; Wheaton, T.; McNeal, B.; Morgan, K. Soil temperature, nitrogen concentration, and resi-dence time affect nitrogen uptake efficiency in citrus. J. Environ. Qual. 2002, 31, 759–768. [Google Scholar] [CrossRef] [PubMed]
  58. El-Hadidi, E.; Aziz, H.A.; Enab, M. Efficient Utilization of Nitrogen by Sugar Beet Irrigated with Saline Water under Fertilizer Rates and Water Regime Using 15N Tracer Technique. J. Soil Sci. Agric. Eng. 2017, 8, 655–660. [Google Scholar] [CrossRef]
  59. Veneklaas, E.J.; Lambers, H.; Bragg, J.; Finnegan, P.; Lovelock, C.; Plaxton, W.; Price, C.A.; Scheible, W.-R.; Shane, M.W.; White, P.; et al. Opportunities for improving phosphorus-use efficiency in crop plants. New Phytol. 2012, 195, 306–320. [Google Scholar] [CrossRef] [PubMed]
  60. Neumann, G.; Massonneau, A.; Martinoia, E.; Römheld, V. Physiological adaptations to phosphorus deficiency during proteoid root development in white lupin. Planta 1999, 208, 373–382. [Google Scholar] [CrossRef]
  61. Shenoy, V.; Kalagudi, G. Enhancing plant phosphorus use efficiency for sustainable cropping. Biotechnol. Adv. 2005, 23, 501–513. [Google Scholar] [CrossRef]
  62. White, P.J. Improving potassium acquisition and utilisation by crop plants. J. Plant Nutr. Soil Sci. 2013, 176, 305–316. [Google Scholar] [CrossRef]
  63. Marschner, H. Mineral nutrition of higher plants. J. Ecol. 1995, 76, 1250. [Google Scholar]
  64. Arquero, O.; Barranco, D.; Benlloch, M. Potassium Starvation Increases Stomatal Conductance in Olive Trees. HortScience 2006, 41, 433–436. [Google Scholar] [CrossRef]
  65. Yang, X.E.; Liu, J.X.; Wang, W.M.; Ye, Z.Q.; Luo, A.C. Potassium Internal Use Efficiency Relative to Growth Vigor, Potassium Distribution, and Carbohydrate Allocation in Rice Genotypes. J. Plant Nutr. 2004, 27, 837–852. [Google Scholar] [CrossRef]
  66. Waraich, E.A.; Ahmad, R.; Ashraf, M.Y.; Saifullah; Ahmad, M. Improving agricultural water use efficiency by nu-trient management in crop plants. Acta Agric. Scand. Sect. B-Soil Plant Sci. 2011, 61, 291–304. [Google Scholar]
  67. Chatterjee, A.; Subedi, K.; Franzen, D.; Mickelson, H.; Cattanach, N. Nitrogen Fertilizer Optimization for Sugarbeet in the Red River Valley of North Dakota and Minnesota. Agron. J. 2018, 110, 1554–1560. [Google Scholar] [CrossRef]
  68. Kaiser, W.M. Mineral Nutrition of Plants: Principles and Perspectives; Epstein, E., Bloom, A., Eds.; Sinauer Associates, Inc. Publishers: Sunderland, MA, USA, 2004; 400p, ISBN 0-87893-172-4. [Google Scholar]
  69. Topak, R.; Acar, B.; Uyanöz, R.; Ceyhan, E. Performance of partial root-zone drip irrigation for sugar beet produc-tion in a semi-arid area. Agric. Water Manag. 2016, 176, 180–190. [Google Scholar] [CrossRef]
  70. Saykhul, A.; Chatzistathis, T.; Chatzissavvidis, C.; Koundouras, S.; Therios, I.; Dimassi, K. Potassium utilization effi-ciency of three olive cultivars grown in a hydroponic system. Sci. Hortic. 2013, 162, 55–62. [Google Scholar] [CrossRef]
  71. George, M.S.; Lu, G.; Zhou, W. Genotypic variation for potassium uptake and utilization efficiency in sweet potato (Ipomoea batatas L.). Field Crops Res. 2002, 77, 7–15. [Google Scholar] [CrossRef]
  72. Wang, X.; Mohamed, I.; Xia, Y.; Chen, F. Effects of water and potassium stresses on potassium utilization efficiency of two cotton genotypes. J. Soil Sci. Plant Nutr. 2014, 14, 833–844. [Google Scholar] [CrossRef] [Green Version]
  73. Naumann, J.C.; Young, D.R.; Anderson, J.E. Linking leaf chlorophyll fluorescence properties to physiological responses for detection of salt and drought stress in coastal plant species. Physiol. Plant. 2007, 131, 422–433. [Google Scholar] [CrossRef]
  74. Chaves, M.M.; Pereira, J.S.; Marôco, J.; Rodrigues, M.L.; Ricardo, C.P.P.; Osório, M.L.; Carvalho, I.; Faria, T.; Pinheiro, C. How Plants Cope with Water Stress in the Field? Photosynthesis and Growth. Ann. Bot. 2002, 89, 907–916. [Google Scholar] [CrossRef]
  75. Centritto, M.; Loreto, F.; Chartzoulakis, K. The use of low [CO2] to estimate diffusional and non-diffusional limita-tions of photosynthetic capacity of salt-stressed olive saplings. Plant Cell Environ. 2003, 26, 585–594. [Google Scholar] [CrossRef]
  76. Xia, Y.; Jiang, C.; Wang, X.; Chen, F. Studies on potassium uptake and use efficiency of different cotton (Gossypium hirsutum L.) genotypes by grafting. J. Food Agric. Environ. 2013, 11, 472–476. [Google Scholar]
  77. Cassman, K.G.; Kerby, T.A.; Roberts, B.A.; Bryant, D.C.; Brouder, S.M. Differential Response of Two Cotton Cultivars to Fertilizer and Soil Potassium. Agron. J. 1989, 81, 870–876. [Google Scholar] [CrossRef]
  78. Rengel, Z.; Damon, P.M. Crops and genotypes differ in efficiency of potassium uptake and use. Physiol. Plant. 2008, 133, 624–636. [Google Scholar] [CrossRef]
  79. Gerendás, J.; Abbadi, J.; Sattelmacher, B. Potassium efficiency of safflower (Carthamus tinctorius L.) and sunflower (Helianthus annuus L.). J. Plant Nutr. Soil Sci. 2008, 171, 431–439. [Google Scholar] [CrossRef]
Figure 1. The sugar beet yield under the different treatments. W1: irrigation water quota of 45 mm; W2: irrigation water quota of 60 mm; F1: customary fertilization; F2: optimized fertilization; F3: optimized fertilization minus N + inhibitor; F4: optimized fertilization minus N + organic microbial fertilizer; F5: PK. Different letters in the same irrigation treatment indicate significant differences (p < 0.05) among the various fertilization treatments.
Sustainability 14 12520 g001
Figure 2. The sugar beet sugar content (%) under the different treatments. W1: irrigation water quota of 45 mm; W2: irrigation water quota of 60 mm; F1: customary fertilization; F2: optimized fertilization; F3: optimized fertilization minus N + inhibitor; F4: optimized fertilization minus N + organic microbial fertilizer; F5: PK. Different letters in the same irrigation treatment indicate significant differences (p < 0.05) among the various fertilization treatments.
Sustainability 14 12520 g002
Figure 3. The photosynthetic rate (a), stomatal conductance (b), chlorophyll content (c), and intercellular CO2 concentration (d) under different treatments. W1: irrigation water quota of 45 mm; W2: irrigation water quota of 60 mm; F1: customary fertilization; F2: optimized fertilization; F3: optimized fertilization minus N + inhibitor; F4: optimized fertilization minus N + organic microbial fertilizer; F5: PK. Different letters in the same irrigation treatment indicate significant differences (p < 0.05) among the various fertilization treatments.
Sustainability 14 12520 g003
Figure 4. Redundancy analysis (RDA) of the yield and sugar content and the photosynthetic rate, chlorophyll content, intercellular CO2 concentration, and KUE (environmental variables) of sugar beet (a); explanatory power of the environmental variables (b).
Sustainability 14 12520 g004
Table 1. Application of inorganic N, P, and K fertilizers under five fertilization treatments.
FertilizationInorganic N
(kg ha−1)
Inorganic P
(kg ha−1)
Inorganic K
(kg ha−1)
Hydroquinone
(kg ha−1)
Microbial Fertilizer
(kg ha−1)
F130027015000
F2270180202.500
F3229.5180202.50.22950
F4229.5180202.50300
F567.5180202.500
F1: customary fertilization (N:P2O5:K2O = 1:0.9:0.5); F2: optimized fertilization (N:P2O5:K2O = 1:0.67:0.75); F3: optimized fertilization minus N + inhibitor (N:P2O5:K2O = 1:0.67:0.75); F4: optimized fertilization minus N + organic microbial fertilizer (N:P2O5:K2O = 1:0.67:0.75); F5: PK (N:P2O5:K2O = 1:2.78:3).
Table 2. Nitrogen-use efficiency (NUE) of sugar beets during different growth periods.
IrrigationFertilizationSeedling StageLuxuriant Foliage StageExpanding StageSugar Accumulation
W1F139.45 ± 5.61 bcd29.42 ± 4.48 cd42.28 ± 3.25 abcd35.95 ± 11.22 bcd
F242.90 ± 8.09 abcd34.47 ± 7.15 bcd41.94 ± 3.98 abcd41.54 ± 0.84 abcd
F336.04 ± 15.56 bcd31.46 ± 2.54 cd57.83 ± 8.29 ab65.49 ± 37.44 a
F428.65 ± 8.21 d33.62 ± 13.34 bcd45.16 ± 5.99 abcd53.96 ± 14.37 abc
F5////
W2F138.78 ± 7.11 abc28.08 ± 9.61 c39.18 ± 5.30 abc43.98 ± 20.06 abc
F249.75 ± 20.07 abc41.63 ± 11.18 abc58.45 ± 3.43 abc62.13 ± 12.04 bc
F333.35 ± 29.03 bc27.74 ± 11.05 c64.47 ± 6.31 a47.34 ± 11.04 abc
F446.28 ± 27.73 abc27.77 ± 15.74 c55.11 ± 16.93 abc56.54 ± 15.17 abc
F5////
W1: irrigation water quota of 45 mm; W2: irrigation water quota of 60 mm; F1: customary fertilization; F2: optimized fertilization; F3: optimized fertilization minus N + inhibitor; F4: optimized fertilization minus N + organic microbial fertilizer; F5: PK. Different letters in the same irrigation treatment indicate significant differences (p < 0.05) among the various fertilization treatments.
Table 3. Phosphorus-use efficiency (PUE) of sugar beets during different growth periods.
IrrigationFertilizationSeedling StageLuxuriant Foliage StageExpanding StageSugar Accumulation
W1F15.02 ± 0.7 cd4.92 ± 0.21 cd6.71 ± 0.94 abc3.78 ± 1.13 d
F27.82 ± 2.49 ab5.33 ± 0.51 cd5.56 ± 0.58 bcd5.12 ± 1.09 cd
F34.77 ± 1.77 cd5.10 ± 0.7 cd6.49 ± 0.62 abc7.07 ± 1.57 bcd
F43.77 ± 1.74 d5.17 ± 1.41 cd6.18 ± 0.93 abcd5.84 ± 1.57 abcd
F56.20 ± 1.74 abcd6.05 ± 0.65 abcd8.35 ± 0.78 a5.89 ± 1.21 abcd
W2F15.84 ± 1.46 abcd4.68 ± 1.10 bcd5.83 ± 0.91 abcd5.42 ± 2.00 abcd
F26.52 ± 2.46 abcd7.18 ± 1.84 abcd8.36 ± 1.31 a7.45 ± 1.40 ab
F34.13 ± 3.04 d4.28 ± 1.16 bcd7.21 ± 0.45 abcd6.02 ± 0.79 abcd
F46.06 ± 2.80 abcd4.13 ± 1.79 d5.67 ± 1.62 abcd6.99 ± 0.41 abcd
F54.20 ± 1.20 cd4.46 ± 1.81 bcd7.42 ± 1.15 abc6.11 ± 0.62 abcd
W1: irrigation water quota of 45 mm; W2: irrigation water quota of 60 mm; F1: customary fertilization; F2: optimized fertilization; F3: optimized fertilization minus N + inhibitor; F4: optimized fertilization minus N + organic microbial fertilizer; F5: PK. Different letters in the same irrigation treatment indicate significant differences (p < 0.05) among the various fertilization treatments.
Table 4. Potassium-use efficiency (KUE) of sugar beets during different growth periods.
IrrigationFertilizationSeedling StageLuxuriant Foliage StageExpanding StageSugar Accumulation
W1F158.96 ± 11.9 defg50.93 ± 3.54 efg101 ± 16.47 abc84.93 ± 23 bcde
F257.17 ± 15 defg46.19 ± 9.54 fg66.06 ± 12 cdefg76.88 ± 18 bcde
F344.45 ± 23.70 fg35.87 ± 2.46 g98.24 ± 22.68 abc128.10 ± 40.92 a
F432.62 ± 11.67 g35.31 ± 8.80 g74.55 ± 19 bcdef104.8 ± 37.35 ab
F555.18 ± 14.8 defg43.01 ± 7.22 fg84.16 ± 3.32 bcde88.95 ± 18 bcd
W2F161.38 ± 4.31 bcde47.50 ± 13.20 de94.02 ± 12.64 ab93.29 ± 34.63 ab
F264.24 ± 23 bcde52.74 ± 13 cde94.83 ± 16.85 ab121.77 ± 27.95 a
F343.95 ± 39.65 e32.16 ± 12.76 e107.47 ± 14.75 a99.63 ± 22.39 ab
F462.11 ± 31 bcde31.12 ± 14.80 e89.47 ± 21.90 abc116.98 ± 12.93 a
F540.11 ± 15.07 e32.78 ± 16.24 e90.57 ± 9.02 abc84.69 ± 4.8 abcd
W1: irrigation water quota of 45 mm; W2: irrigation water quota of 60 mm; F1: customary fertilization; F2: optimized fertilization; F3: optimized fertilization minus N + inhibitor; F4: optimized fertilization minus N + organic microbial fertilizer; F5: PK. Different letters in the same irrigation treatment indicate significant differences (p < 0.05) among the various fertilization treatments.
Publisher’s Note: MDPI stays neutral with regard to jurisdictional claims in published maps and institutional affiliations.

