

Trend of Percentile Climate Indices in Montenegro in the Period 1961–2020


Abstract

1. Introduction
2. Study Area
3. Database and Methods
4. Results
4.1. Trend of Percentile Temperature Indices
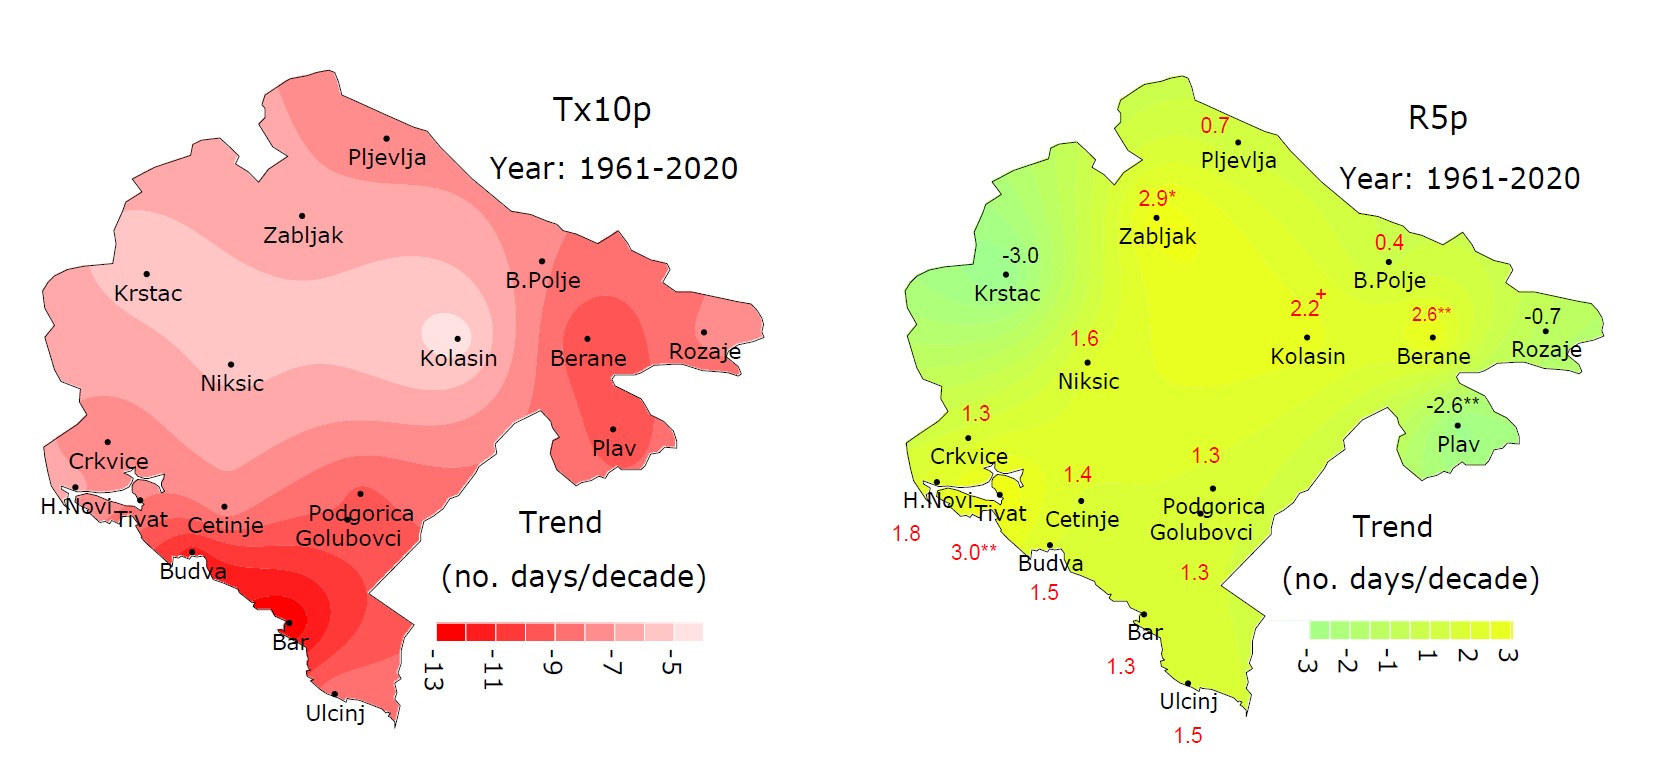
4.1.1. Cold Days and Cold Nights (Tn10p and Tx10p)
4.1.2. Warm Days and Warm Nights (Tx90p and Tn90p)
4.2. Trend of Percentile Precipitation Indice
4.2.1. Very Wet Days and Moderately Humid Days (R95p and R75p)
4.2.2. Moderately Dry Days and Very Dry Days (R25p and R5p)
5. Discussion
6. Conclusions
Author Contributions
Funding
Institutional Review Board Statement
Data Availability Statement
Conflicts of Interest
Appendix A

| MS | Very Wet Days (R95p) | Moderately Humid Days (R75p) | ||||||||
|---|---|---|---|---|---|---|---|---|---|---|
| Winter | Spring | Summer | Autumn | Year | Winter | Spring | Summer | Autum | Year | |
| Ulcinj | 41.8 | 40.9 | 47.1 | 56.9 | 46.0 | 19.9 | 15.8 | 16.9 | 22.3 | 19.5 |
| Bar | 43.2 | 43.5 | 47.5 | 53.6 | 47.8 | 20.3 | 16.3 | 15.6 | 23.8 | 19.8 |
| Budva | 46.9 | 44.6 | 41.3 | 55.6 | 47.3 | 20.8 | 17.4 | 16.1 | 23.3 | 20.1 |
| Tivat | 47.9 | 42.3 | 45.7 | 61.2 | 49.8 | 22.0 | 18.2 | 15.7 | 23.8 | 20.3 |
| H. Novi | 62.1 | 52.7 | 49.2 | 65.7 | 59.9 | 25.5 | 20.4 | 16.7 | 26.3 | 22.8 |
| Golubovci | 46.6 | 40.4 | 41.2 | 66.2 | 51.0 | 23.1 | 18.0 | 13.6 | 27.6 | 21.7 |
| Podgorica | 52.4 | 46.2 | 38.2 | 69.7 | 54.0 | 23.7 | 19.5 | 12.7 | 29.2 | 22.8 |
| Cetinje | 121.9 | 77.2 | 46.7 | 114.8 | 102.0 | 47.3 | 26.3 | 13.6 | 42.4 | 34.2 |
| Crkvice | 181.1 | 130.1 | 55.4 | 167.5 | 156.2 | 69.0 | 38.0 | 17.0 | 60.2 | 48.2 |
| Niksic | 67.1 | 44.2 | 33.3 | 75.6 | 60.3 | 28.2 | 19.5 | 12.6 | 29.0 | 23.0 |
| Krstac | 54.8 | 38.6 | 26.8 | 56.9 | 46.9 | 24.1 | 16.8 | 12.6 | 25.6 | 19.4 |
| Plav | 32.4 | 26.2 | 22.3 | 34.6 | 29.5 | 14.2 | 9.2 | 8.5 | 14.8 | 12.4 |
| Kolasin | 59.9 | 47.5 | 35.7 | 72.3 | 57.2 | 24.5 | 16.1 | 11.1 | 29.0 | 20.4 |
| Zabljak | 44.1 | 35.1 | 24.4 | 56.9 | 41.2 | 16.1 | 11.4 | 11.1 | 20.7 | 14.1 |
| Rozaje | 21.7 | 24.5 | 29.3 | 27.4 | 25.4 | 8.8 | 9.4 | 12.3 | 12.2 | 10.7 |
| Berane | 28.9 | 27.1 | 24.0 | 33.0 | 29.0 | 12.1 | 11.0 | 10.2 | 14.4 | 12.0 |
| B. Polje | 26.5 | 25.3 | 24.6 | 34.8 | 27.8 | 11.2 | 9.8 | 11.1 | 14.2 | 11.4 |
| Pljevlja | 20.7 | 20.1 | 25.3 | 26.8 | 23.2 | 8.3 | 8.2 | 10.7 | 11.2 | 9.5 |
| MS | Moderately Dry Days (R25p) | Very Dry Days (R5p) | ||||||||
| Winter | Spring | Summer | Autumn | Year | Winter | Spring | Summer | Autumn | Year | |
| Ulcinj | 4.3 | 3.1 | 2.8 | 3.7 | 3.5 | 1.4 | 1.2 | 1.2 | 1.2 | 1.3 |
| Bar | 3.9 | 3.2 | 2.8 | 3.6 | 3.3 | 1.3 | 1.2 | 1.3 | 1.2 | 1.2 |
| Budva | 4.2 | 3.3 | 2.6 | 4.6 | 3.8 | 1.4 | 1.2 | 1.2 | 1.4 | 1.3 |
| Tivat | 3.8 | 3.0 | 2.4 | 3.9 | 3.4 | 1.2 | 1.0 | 1.0 | 1.2 | 1.1 |
| H. Novi | 4.6 | 3.3 | 2.6 | 4.3 | 3.8 | 1.4 | 1.2 | 1.2 | 1.4 | 1.3 |
| Golubovci | 4.6 | 3.3 | 2.4 | 4.9 | 3.8 | 1.4 | 1.2 | 1.2 | 1.3 | 1.3 |
| Podgorica | 5.1 | 3.9 | 2.8 | 4.9 | 4.2 | 1.5 | 1.3 | 1.3 | 1.4 | 1.4 |
| Cetinje | 7.3 | 3.2 | 2.5 | 5.1 | 4.0 | 1.6 | 1.2 | 1.0 | 1.2 | 1.2 |
| Crkvice | 8.8 | 5.0 | 3.3 | 7.6 | 5.8 | 1.8 | 1.4 | 1.2 | 1.9 | 1.5 |
| Niksic | 5.0 | 3.4 | 2.5 | 4.6 | 3.8 | 1.5 | 1.3 | 1.1 | 1.4 | 1.3 |
| Krstac | 5.4 | 3.7 | 3.0 | 4.8 | 3.9 | 1.7 | 1.5 | 1.3 | 1.5 | 1.4 |
| Plav | 3.1 | 2.4 | 2.4 | 2.8 | 2.6 | 1.4 | 1.2 | 1.2 | 1.2 | 1.2 |
| Kolasin | 3.0 | 2.5 | 2.3 | 4.1 | 2.9 | 1.3 | 1.2 | 1.1 | 1.4 | 1.2 |
| Zabljak | 2.6 | 2.5 | 2.4 | 3.1 | 2.6 | 1.2 | 1.2 | 1.2 | 1.2 | 1.2 |
| Rozaje | 2.1 | 2.3 | 2.8 | 2.6 | 2.3 | 1.1 | 1.2 | 1.2 | 1.2 | 1.2 |
| Berane | 2.0 | 2.0 | 2.1 | 2.8 | 2.1 | 1.0 | 1.0 | 1.0 | 1.0 | 1.0 |
| B. Polje | 2.5 | 2.4 | 2.7 | 2.8 | 2.6 | 1.2 | 1.2 | 1.4 | 1.3 | 1.2 |
| Pljevlja | 2.2 | 2.3 | 2.6 | 2.5 | 2.4 | 1.1 | 1.1 | 1.2 | 1.1 | 1.1 |
References
- IPCC. Summary for Policymakers. In Climate Change 2021: The Physical Science Basis. Contribution of Working Group I to the Sixth Assessment Report of the Intergovernmental Panel on Climate Change; Masson–Delmotte, V., Zhai, P., Pirani, A., Connors, S.L., Péan, C., Berger, S., Caud, N., Chen, Y., Goldfarb, L., Gomis, M.I., et al., Eds.; Cambridge University Press: Cambridge, UK, 2021; p. 40. Available online: https://www.ipcc.ch/report/ar6/wg1/downloads/report/IPCC_AR6_WGI_SPM_final.pdf (accessed on 18 February 2022).
- NOAA. Increase in Atmospheric Methane Set Another Record during 2021. Available online: https://www.noaa.gov/news-release/increase-in-atmospheric-methane-set-another-record-during-2021 (accessed on 29 May 2022).
- Schmidt, R.C. Are there similarities between the Corona and the climate crisis? J. Environ. Stud. Sci. 2021, 11, 159–163. [Google Scholar] [CrossRef] [PubMed]
- Feldman, L.; Hart, P.S. Upping the ante? The effects of “emergency” and “crisis” framing in climate change news. Clim. Change 2021, 169, 10. [Google Scholar] [CrossRef]
- Geiger, N.; Gore, A.; Squire, C.V.; Attari, S.Z. Investigating similarities and differences in individual reactions to the COVID–19 pandemic and the climate crisis. Clim. Change 2021, 167, 1. [Google Scholar] [CrossRef] [PubMed]
- Meijers, M.H.C.; Scholz, C.; Torfadóttir, R.; Wonneberger, A.; Markov, M. Learning from the COVID–19 pandemic to combat climate change: Comparing drivers of individual action in global crises. J. Environ. Stud. Sci. 2021, 12, 272–279. [Google Scholar] [CrossRef] [PubMed]
- Yang, S.; Dong, W.; Chou, J.; Dai, T.; Hong, T.; Xiao, C.; Wei, T.; Tian, D.; Ji, D. Quantifying the developed and developing worlds’ carbon reduction contributions to Northern Hemisphere cryosphere change. Int. J. Climatol. 2019, 39, 3231–3240. [Google Scholar] [CrossRef]
- Wei, T.; Liu, C.; Dong, W.; Yu, H.; Yang, S.; Yan, Q.; Hao, Z. Reduction in extreme climate events and potential impacts by the use of technological advances. Int. J. Climatol. 2020, 41, 2495–2508. [Google Scholar] [CrossRef]
- Murali, R.; Kuwar, A.; Nagendra, H. Who’s responsible for climate change? Untangling threads of media discussions in India, Nigeria, Australia, and the USA. Clim. Change 2021, 164, 51. [Google Scholar] [CrossRef]
- C3S/ECMWF. Globe in 2020. Available online: https://climate.copernicus.eu/esotc/2020 (accessed on 11 May 2021).
- Ionita, M.; Nagavciuc, V. Changes in drought features at the European level over the last 120 years. Nat. Hazards Earth Syst. Sci. 2021, 21, 1685–1701. [Google Scholar] [CrossRef]
- Del Rio, S.; Cano-Ortiz, A.; Herrero, L.; Penas, A.P. Recent trends in mean maximum and minimum air temperatures over Spain (1961–2006). Theor. Appl. Climatol. 2012, 109, 605–626. [Google Scholar] [CrossRef]
- Hoerling, M.; Eischeid, J.; Perlwitz, J.; Quan, X.; Zhang, T.; Pegion, P. On the increased frequency of Mediterranean drought. J. Clim. 2012, 25, 2146–2161. [Google Scholar] [CrossRef]
- Milošević, D.D.; Savić, S.M.; Pantelić, M.; Stankov, U.; Žiberna, I.; Dolinaj, D.; Leščešen, I. Variability of seasonal and annual precipitation in Slovenia and its correlation with large–scale atmospheric circulation. Open Geosci. 2016, 8, 593–605. [Google Scholar] [CrossRef]
- Milošević, D.; Savić, M.; Stankov, U.; Žiberna, I.; Pantelić, M.; Dolinaj, D.; Leščešen, I. Maximum temperatures over Slovenia and their relationship with atmospheric circulation patterns. Geografie 2017, 122, 1–20. [Google Scholar] [CrossRef]
- Kostopoulou, E.; Giannakopoulos, C.; Krapsiti, D.; Karali, A. Temporal and Spatial Trends of the Standardized Precipitation Index (SPI) in Greece Using Observations and Output from Regional Climate Models. In Perspectives on Atmospheric Sciences; Karacostas, T., Bais, A., Nastos, P., Eds.; Springer: Berlin/Heidelberg, Germany, 2017; pp. 475–481. [Google Scholar] [CrossRef]
- Lemus-Canovas, M.; Lopez–Bustins, J.A. Assessing internal changes in the future structure of dry–hot compound events: The case of the Pyrenees. Nat. Hazards Earth Syst. Sci. 2021, 21, 1721–1738. [Google Scholar] [CrossRef]
- Stagge, J.H.; Kingston, D.G.; Tallaksen, L.M.; Hannah, D.M. Observed drought indices show increasing divergence across Europe. Sci. Rep. 2017, 7, 14045. [Google Scholar] [CrossRef]
- Tosic, I.; Unkasevic, M. Analysis of wet and dry periods in Serbia. Int. J. Climatol. 2014, 34, 1357–1368. [Google Scholar] [CrossRef]
- Arsenović, P.; Tošić, I.; Unkašević, M. Trends in combined climate indices in Serbia from 1961 to 2010. Meteorol. Atmos. Phys. 2015, 127, 489–498. [Google Scholar] [CrossRef]
- Bajat, B.; Blagojević, D.; Kilibarda, M.; Liković, J.; Tošić, I. Spatial analysis of the temperature trends in Serbia during the period 1961–2010. Theor. Appl. Climatol. 2015, 121, 289–301. [Google Scholar] [CrossRef]
- Luković, J.; Bajat, B.; Blagojević, D.; Kilibarda, M. Spatial pattern of recent rainfall trends in Serbia (1961–2009). Reg. Environ. Change 2014, 14, 1789–1799. [Google Scholar] [CrossRef]
- Luković, J.; Blagojevć, D.; Kilibarda, M.; Bajat, B. Spatial pattern of North Atlantic Oscillation impact on rainfall in Serbia. Spat. Stat. 2015, 14, 39–52. [Google Scholar] [CrossRef]
- Stanojević, G.; Stojilković, J.; Spalević, A.; Kokotović, V. The impact of heat waves on daily mortality in Belgrade (Serbia) during summer. Environ. Hazards 2014, 13, 329–342. [Google Scholar] [CrossRef]
- Kutiel, H.; Lukovic, J.; Buric, D. Spatial and temporal variability of rain–spells’ characteristics in Serbia and Montenegro. Int. J. Climatol. 2015, 35, 1611–1624. [Google Scholar] [CrossRef]
- Malinovic-Milicevic, S.; Radovanovic, M.M.; Stanojevic, G.; Milovanović, B. Recent changes in Serbian climate extreme indices from 1961 to 2010. Theor. Appl. Climatol. 2016, 124, 1089–1098. [Google Scholar] [CrossRef]
- Pecelj, M.M.; Lukić, Z.M.; Filipović, J.D.; Protić, M.B.; Bogdanović, M.U. Analysis of the Universal Thermal Climate Index during heat waves in Serbia. Nat. Hazards Earth Syst. Sci. 2020, 20, 2021–2036. [Google Scholar] [CrossRef]
- Trbić, G.; Popov, T.; Gnjato, S. Analysis of air temperature trends in Bosnia and Herzegovina. Geogr. Pannonica 2017, 21, 68–84. [Google Scholar] [CrossRef]
- Popov, T.; Gnjato, S.; Trbić, G.; Ivanišević, M. Recent trends in extreme temperature indices in Bosnia and Herzegovina. Carpathian J. Earth Environ. Sci. 2018, 13, 211–224. [Google Scholar] [CrossRef]
- Popov, T.; Gnjato, S.; Trbić, G. Changes in temperature extremes in Bosnia and Herzegovina: A fixed thresholds–based index analysis. J. Geogr. Inst. Jovan Cvijic SASA 2018, 68, 17–33. [Google Scholar] [CrossRef]
- Burić, D.; Luković, J.; Ducić, V.; Dragojlović, J.; Doderović, M. Recent trends in daily temperature extremes over southern Montenegro (1951–2010). Nat. Hazards Earth Syst. Sci. 2014, 14, 67–72. [Google Scholar] [CrossRef]
- Burić, D.; Luković, J.; Bajat, B.; Kilibarda, M.; Živković, N. Recent trends in daily rainfall extremes over Montenegro (1951–2010). Nat. Hazards Earth Syst. Sci. 2015, 15, 2069–2077. [Google Scholar] [CrossRef]
- Mihajlović, J.; Burić, D.; Ducić, V.; Milenković, M. Synoptic characteristics of an extreme weather event: The tornadic waterspout in Tivat (Montenegro), on June 9, 2018. Geogr. Pol. 2021, 94, 69–90. [Google Scholar] [CrossRef]
- Burić, D.; Ducić, V.; Mihajlović, J. The climate of Montenegro: Modificators and types—Part one. Bull. Serb. Geogr. Soc. 2013, 93, 83–102. [Google Scholar] [CrossRef]
- Burić, D.; Ducić, V.; Mihajlović, J. The climate of Montenegro: Modificators and types—Part two. Bull. Serb. Geogr. Soc. 2014, 94, 73–90. [Google Scholar] [CrossRef]
- Doderović, M.; Burić, D.; Mijanović, I.; Premović, M. Analysis of River Water and Air Pollution—Pljevlja as a “Hot Spot” of Montenegro. Sustainability 2021, 13, 5229. [Google Scholar] [CrossRef]
- Szentimrey, T. Multiple Analysis of Series for Homogenization (MASH). In Proceedings of the Second Seminar for Homogenization of Surface Climatological Data, Budapest, Hungary, 9–13 November 1998; WCDMP–No. 41. WMO: Budapest, Hungary, 1999; pp. 27–46. [Google Scholar]
- Szentimrey, T. Multiple analysis of series for homogenization (MASH); Verification procedure for homogenized time series. In Proceedings of the Fourth Seminar for Homogenization and Quality Control in Climatological Databases, Budapest, Hungary, 6–10 October 2003; WMO–TD No. 1236. WMO: Budapest, Hungary, 2003; pp. 193–201. [Google Scholar]
- Szentimrey, T. Manual of Homogenization Software MASHv3.02; Authorized script; Hungary Meteorological Service: Budapest, Hungary, 2007; p. 65. [Google Scholar]
- Peterson, T.C.; Folland, C.; Gruza, G.; Hogg, W.; Mokssit, A.; Plummer, N. Report on the Activities of the Working Group on Climate Change Detection and Related Rapporteurs 1998–2001; World Meteorological Organisation Rep. WMO–TD No. 1071, WCDMP–No. 47; WHO: Geneva, Switzerland, 2001; p. 143. Available online: http://etccdi.pacificclimate.org/docs/wgccd.2001.pdf (accessed on 2 February 2022).
- World Meteorological Organization. Report of the CCI/CLIVAR Expert Team on Climate Change Detection, Monitoring and Indices (ETCCDMI); WHO: Geneva, Switzerland, 2004; Available online: https://library.wmo.int/doc_num.php?explnum_id=9265 (accessed on 25 February 2022).
- World Meteorological Organization. Guidelines on Analysis of Extremes in a Changing Climate in Support of Informed Decisions for Adaptation; Climate Data and Monitoring WCDMP–No. 72; WHO: Geneva, Switzerland, 2009. [Google Scholar]
- Mann, H.B. Nonparametric tests against trend. Econometrica 1945, 13, 245–259. Available online: https://www.jstor.org/stable/1907187 (accessed on 19 November 2020). [CrossRef]
- Kendall, M.G. Rank Correlation Methods, 4th ed.; Charles Griffin: London, UK, 1975. [Google Scholar]
- Salmi, T.; Määttä, A.; Anttila, P.; Ruoho-Airola, T.; Amnell, T. Detecting Trends of Annual Values of Atmospheric Pollutants by the Mann–Kendall Test and Sen’s Slope Estimates–The Excel Template Application MAKESENS; Publications on Air Quality Number: 31; Finnish Meteorolog Institute: Helsinki, Finland, 2002. [Google Scholar]
- WMO. WMO Guidelines on the Calculation of Climate Normals; WMO–No. 1203; WHO: Geneva, Switzerland, 2017; p. 29. Available online: https://library.wmo.int/doc_num.php?explnum_id=4166 (accessed on 25 June 2021).
- Serykh, I.V.; Sonechkin, D.M. El Niño forecasting based on the global atmospheric oscillation. Int. J. Climatol. 2021, 41, 3781–3792. [Google Scholar] [CrossRef]
- Serykh, I.V.; Sonechkin, D.M. El Niño–Global Atmospheric Oscillation as the Main Mode of Interannual Climate Variability. Atmosphere 2021, 12, 1443. [Google Scholar] [CrossRef]
- Diaz, H.F.; Hoerling, M.P.; Eischeid, J.K. ENSO variability, teleconnections and climate change. Int. J. Climatol. 2001, 21, 1845–1862. [Google Scholar] [CrossRef]
- Abid, M.A.; Ashfaq, M.; Kucharski, F.; Evans, K.J.; Almazroui, M. Tropical Indian Ocean mediates ENSO influence over Central Southwest Asia during the wet season. Geophys. Res. Lett. 2020, 47, e2020GL089308. [Google Scholar] [CrossRef]
- Broennimann, S. Impact of El Niño-Southern Oscillation on European climate. Rev. Geophys. 2007, 45, RG3003. [Google Scholar] [CrossRef]
- Ducic, V.; Milovanovic, B.; Lukovic, J. Connection between ENSO index, NAO index and decadal-scale variability of precipitation in Serbia. In Proceedings of the Third International Conference-Global Changes and Regional Challenges, Sofia, Bulgaria, 16–17 April 2006; pp. 28–29. Available online: https://scholar.google.com/scholar?hl=sr&as_sdt=0,5&cluster=1633933266264773797 (accessed on 18 September 2021).
- Burić, D.; Dragojlović, J.; Penjišević-Sočanac, I.; Luković, J.; Doderović, M. Relationship Between Atmospheric Circulation and Temperature Extremes in Montenegro in the Period 1951–2010. In Climate Change Adaptation in Eastern Europe—Managing Risks and Building Resilience to Climate Change; Leal Filho, W., Trbic, G., Filipovic, D., Eds.; Springer: Berlin/Heidelberg, Germany, 2019; pp. 29–42. [Google Scholar] [CrossRef]
- Burić, D.; Stanojević., G. Trends and possible causes of cloudiness variability in Montenegro in the period 1961–2017. Clim. Res. 2020, 81, 187–205. [Google Scholar] [CrossRef]
- Burić, D.; Doderović, M.; Dragojlović, J.; Penjišević, I. Extreme weather and climate events in Montenegro—Case study, November 2019. Weather 2021, 76, 383–388. [Google Scholar] [CrossRef]
- Malinović-Milićević, S.; Mihailović, D.T.; Radovanović, M.M.; Drešković, N. Extreme precipitation indices in Vojvodina region (Serbia). J. Geogr. Inst. Jovan Cvijic SASA 2018, 68, 1–15. [Google Scholar] [CrossRef]
- Gajić-Čapka, M.; Cindrić, K.; Pasarić, Z. Trends in precipitation indices in Croatia, 1961–2010. Theor. Appl. Climatol. 2015, 121, 167–177. [Google Scholar] [CrossRef]
- Schär, C.; Ban, N.; Fischer, E.M.; Rajczak, J.; Schmidli, J.; Frej, C.; Giorgi, F.; Karl, T.R.; Kendon, E.J.; Klein Tank, A.M.G.; et al. Percentile indices for assessing changes in heavy precipitation events. Clim. Change 2016, 137, 201–216. [Google Scholar] [CrossRef]


| No. | Index | Definition |
|---|---|---|
| Temperature | ||
| 1. | Tx10p | Number of cold days—daily Tx < 10th percentile |
| 2. | Tn10p | Number of cold nights—daily Tn < 10th percentile |
| 3. | Tx90p | Number of warm days—daily Tx > 90th percentile |
| 4. | Tn90p | Number of warm nights—daily Tn > 90th percentile |
| Precipitation | ||
| 1. | R95p | No. of very wet days—Rd > 95th percentile for days with Rd ≥ 1 mm |
| 2. | R75p | No. of moderately humid days—Rd > 75th percentile for days with Rd ≥ 1 mm |
| 3. | R25p | No. of moderately dry days—Rd < 25th percentile for days with Rd ≥ 1 mm |
| 4. | R5p | No. of very dry days—Rd < 5th percentile for days with Rd ≥ 1 mm |
| MS | Winter | Spring | Summer | Autumn | Winter | Spring | Summer | Autumn |
|---|---|---|---|---|---|---|---|---|
| Cold Days (Tx10p) | Cold Nights (Tn10p) | |||||||
| Ulcinj | −1.4 ** | −1.7 *** | −2.8 *** | −1.3 * | −0.3 | −0.3 | −1.8 ** | 0.3 |
| Bar | −1.0 * | −2.6 *** | −6.9 *** | −1.4 ** | −2.5 *** | −3.2 *** | −6.7 *** | −2.7 *** |
| Budva | −1.3 ** | −2.3 *** | −5.5 *** | −1.3 ** | −0.5 | −2.1 *** | −4.6 *** | −1.1 * |
| Tivat | −0.7 | −1.6 *** | −5.0 *** | −0.6 | 0.0 | −0.7 + | −2.2 *** | −0.9 * |
| H. Novi | −1.2 ** | −1.8 *** | −2.2 *** | −0.9 + | −0.5 | −1.9 ** | −3.7 *** | 0.0 |
| Golubovci | −1.8 ** | −1.8 *** | −3.3 *** | −1.5 ** | −0.9+ | −1.9 *** | −4.2 *** | −0.9 * |
| Podgorica | −1.8 *** | −1.8 *** | −3.3 *** | −1.2 * | −0.7 | −1.8 *** | −3.3 *** | −0.4 |
| Cetinje | −1.0 * | −1.6 *** | −3.3 *** | −0.9 + | 0.0 | −0.7 + | −2.5 *** | −1.4 * |
| Crkvice | −1.0 * | −2.0 *** | −3.7 *** | −0.7 | −0.3 | −1.7 *** | −3.6 *** | −1.0 + |
| Nikšić | −1.0 + | −1.1 ** | −2.3 *** | −0.6 | −0.7 | −0.9 * | −3.2 *** | −0.1 |
| Krstac | −1.3 * | −1.4 ** | −1.9 *** | −0.9 * | −0.6 | −0.6 + | −2.4 *** | −0.7 |
| Plav | −1.9 *** | −2.2 *** | −2.9 *** | −1.3 ** | −1.6 ** | −2.5 *** | −3.2 *** | −2.6 *** |
| Kolašin | −0.4 | −1.4 *** | −1.8 *** | −0.2 | −0.8 + | −1.3 ** | −3.2 *** | −1.8 *** |
| Žabljak | −1.3 ** | −1.9 *** | −2.5 *** | −0.8 + | −1.4 ** | −1.9 *** | −3.6 *** | −1.0 * |
| Rožaje | −2.0 *** | −1.5 *** | −2.5 *** | −0.6 | −2.5 *** | −3.7 *** | −7.1 *** | −4.1 *** |
| Berane | −3.1 *** | −1.9 *** | −3.0 *** | −0.7 + | −1.7 ** | −2.0 *** | −5.0 *** | −2.6 *** |
| B. Polje | −2.5 *** | −1.8 *** | −2.1 *** | −0.8 + | −1.3 * | −2.0 *** | −4.5 *** | −2.2 *** |
| Pljevlja | −2.4 *** | −1.6 *** | −2.2 *** | −0.4 | −1.8 ** | −1.5 *** | −3.6 *** | −2.3 *** |
| MS | Winter | Spring | Summer | Autumn | Winter | Spring | Summer | Autumn |
|---|---|---|---|---|---|---|---|---|
| Warm Days (TX90P) | Warm Nights (TN90P) | |||||||
| Ulcinj | 1.0 ** | 1.6 *** | 1.5 *** | 1.2 ** | 0.2 | 0.4 | 0.2 | 0.0 |
| Bar | 0.9 ** | 1.2 *** | 1.6 *** | 0.8 *** | 0.7 + | 1.5 *** | 1.9 *** | 1.3 *** |
| Budva | 1.3 *** | 1.6 *** | 1.7 *** | 0.9 *** | 0.0 | 1.1 ** | 1.3 *** | 1.0 * |
| Tivat | 0.7 * | 1.3 *** | 1.5 *** | 1.1 ** | 0.0 | 0.0 | 1.2 *** | 0.0 |
| H. Novi | 1.1 ** | 1.5 *** | 1.1 *** | 1.2 ** | 0.0 | 1.0 ** | 1.4 *** | 0.9 * |
| Golubovci | 1.0 ** | 1.4 ** | 1.3 *** | 1.3 ** | 0.6 * | 0.9 ** | 1.2 *** | 0.8 + |
| Podgorica | 1.2 *** | 1.5 *** | 1.2 *** | 1.4 *** | 0.6 | 1.1 *** | 1.1 *** | 0.9 * |
| Cetinje | 1.6 *** | 1.2 ** | 1.3 *** | 1.2 *** | 0.9 * | 1.0 ** | 1.2 *** | 1.4 *** |
| Crkvice | 0.0 | 1.5*** | 1.4*** | 1.2** | 0.0 | 1.0* | 0.8** | 0.9* |
| Nikšić | 1.0 ** | 1.0 * | 1.3 *** | 0.9 ** | 0.3 | 0.7 + | 1.4 *** | 0.8 * |
| Krstac | 1.1 *** | 1.7 *** | 1.4 *** | 1.7 *** | 0.0 | 1.1 *** | 1.5 *** | 0.8 + |
| Plav | 0.0 | 1.0 * | 1.1 *** | 0.0 | 0.5 | 0.4 | 1.1 *** | 0.9 * |
| Kolašin | 0.6 | 1.3 ** | 1.0 *** | 1.2 *** | 0.0 | 0.9 * | 1.8 *** | 0.9 ** |
| Žabljak | 1.1 *** | 1.6 *** | 1.4 *** | 1.2 *** | 0.4 | 1.3 *** | 1.4 *** | 0.7 * |
| Rožaje | 0.6 | 1.5 *** | 1.4 *** | 1.2 ** | 1.0 ** | 1.4 *** | 2.0 *** | 1.5 *** |
| Berane | 1.2 ** | 1.5 *** | 1.3 *** | 1.4 *** | 0.6 | 1.0 *** | 1.8 *** | 0.9 ** |
| B. Polje | 0.8 + | 1.7 *** | 1.4 *** | 1.2 ** | 0.8 + | 1.3 *** | 1.7 *** | 1.3 *** |
| Pljevlja | 0.7 + | 1.5 *** | 1.5 *** | 1.1 ** | 0.3 | 0.0 | 1.4 *** | 0.3 |
| MS | Winter | Spring | Summer | Autumn | Winter | Spring | Summer | Autumn |
|---|---|---|---|---|---|---|---|---|
| Very Wet Days (R95p) | Moderately Humid Days (R75p) | |||||||
| Ulcinj | −0.04 | 0.09 | 0.02 | 0.09 | 0.00 | 0.00 | 0.00 | 0.00 |
| Bar | −0.14 | 0.01 | −0.03 | 0.04 | 0.00 | −0.22 | 0.00 | 0.25 |
| Budva | 0.07 | 0.11 | 0.05 | 0.01 | 0.43 | 0.00 | 0.00 | 0.00 |
| Tivat | −0.08 | −0.14 | 0.00 | 0.02 | 0.00 | −0.18 | 0.00 | 0.00 |
| H. Novi | 0.05 | −0.08 | 0.02 | −0.13 | 0.00 | 0.00 | 0.00 | 0.00 |
| Golubovci | −0.05 | −0.04 | −0.04 | 0.05 | 0.00 | 0.00 | 0.00 | 0.00 |
| Podgorica | −0.03 | −0.05 | −0.08 | 0.10 | 0.00 | 0.00 | 0.00 | 0.00 |
| Cetinje | 0.16 | −0.01 | 0.01 | 0.07 | 0.00 | 0.00 | −0.56 * | 0.00 |
| Crkvice | 0.18 | 0.07 | −0.15 | 0.03 | 0.00 | 0.00 | −0.57 * | 0.00 |
| Nikšić | 0.03 | −0.08 | −0.13 | 0.03 | 0.00 | 0.00 | −0.29 | 0.00 |
| Krstac | −0.26 | −0.37 + | −0.48 + | −0.13 | −0.59 * | −0.55 * | −0.45 * | −0.38 + |
| Plav | −0.11 | −0.18 | −0.17 | 0.05 | 0.00 | 0.00 | 0.00 | 0.24 |
| Kolašin | −0.17 | −0.15 | 0.08 | 0.10 | −0.30 | −0.22 | −0.53 ** | 0.00 |
| Žabljak | 0.17 | 0.05 | −0.24 | 0.00 | 0.48 + | 0.00 | 0.00 | 0.00 |
| Rožaje | −0.21 | 0.07 | 0.09 | 0.13 | −0.37 | 0.00 | 0.00 | 0.26 |
| Berane | 0.00 | 0.07 | 0.05 | 0.07 | 0.00 | 0.00 | 0.00 | 0.00 |
| B. Polje | −0.03 | −0.02 | −0.10 | 0.09 | 0.00 | 0.00 | 0.00 | 0.00 |
| Pljevlja | −0.04 | −0.03 | 0.05 | −0.05 | 0.00 | 0.00 | 0.00 | 0.00 |
| MS | Winter | Spring | Summer | Autumn | Winter | Spring | Summer | Autumn |
|---|---|---|---|---|---|---|---|---|
| Moderately Dry Days (R25p) | Very Dry Days (R5p) | |||||||
| Ulcinj | 0.4 | 0.0 | 0.4 | 0.0 | 0.8 | 0.0 | 0.5 + | 0.0 |
| Bar | 0.4 | 0.6 | 0.3 | 0.0 | 0.6 | 0.2 | 0.3 | 0.0 |
| Budva | 0.0 | 0.0 | 0.5 + | −0.5 | 0.0 | 0.0 | 0.7 + | 0.0 |
| Tivat | 0.8 | 0.4 | 0.8 * | 0.0 | 0.8 | 0.6 | 1.1 ** | 0.0 |
| H. Novi | 0.9 | 0.0 | 0.5 | 0.0 | 0.9 | 0.3 | 0.6 | 0.3 |
| Golubovci | 0.5 | 0.0 | 0.4 | −0.2 | 0.5 | 0.0 | 0.5 | 0.0 |
| Podgorica | 0.5 | 0.0 | 0.2 | −0.2 | 0.7 | 0.3 | 0.6 | 0.0 |
| Cetinje | 0.2 | 0.3 | 0.7 + | 0.3 | 0.7 | 0.0 | 0.6 | 0.2 |
| Crkvice | 0.0 | 0.0 | 0.7 + | 0.0 | 0.5 | 0.0 | 0.9 + | 0.0 |
| Nikšić | 0.3 | 0.4 | 0.7 + | 0.0 | 0.6 | 0.0 | 1.0 * | 0.2 |
| Krstac | −0.3 | −0.4 | −0.3 | 0.0 | −1.2 | −1.2 * | −0.7 | −0.6 |
| Plav | −0.3 | −1.5 ** | −0.7 | −0.7 + | −0.4 | −1.2 ** | −0.6 | −1.1 * |
| Kolašin | 0.6 | 0.0 | 1.0 * | 0.4 | 0.5 | 0.0 | 0.9 + | 0.3 |
| Žabljak | 0.5 | −0.3 | 0.6 | 0.0 | 0.9 | 0.0 | 0.6 | 0.3 |
| Rožaje | 0.0 | −0.5 + | 0.0 | −0.2 | 0.0 | −0.6 + | 0.0 | 0.0 |
| Berane | 0.6 | 0.0 | 0.9 * | 0.2 | 0.7 | 0.2 | 1.1 * | 0.5 |
| B. Polje | 0.0 | −0.4 | 0.2 | 0.0 | 0.4 | −0.4 | 0.0 | 0.0 |
| Pljevlja | 0.0 | −0.8 ** | 0.0 | 0.0 | 0.4 | −0.6 | 0.1 | 0.0 |
Publisher’s Note: MDPI stays neutral with regard to jurisdictional claims in published maps and institutional affiliations. |
© 2022 by the authors. Licensee MDPI, Basel, Switzerland. This article is an open access article distributed under the terms and conditions of the Creative Commons Attribution (CC BY) license (https://creativecommons.org/licenses/by/4.0/).
Share and Cite
Burić, D.; Doderović, M. Trend of Percentile Climate Indices in Montenegro in the Period 1961–2020. Sustainability 2022, 14, 12519. https://doi.org/10.3390/su141912519
Burić D, Doderović M. Trend of Percentile Climate Indices in Montenegro in the Period 1961–2020. Sustainability. 2022; 14(19):12519. https://doi.org/10.3390/su141912519
Chicago/Turabian StyleBurić, Dragan, and Miroslav Doderović. 2022. "Trend of Percentile Climate Indices in Montenegro in the Period 1961–2020" Sustainability 14, no. 19: 12519. https://doi.org/10.3390/su141912519
APA StyleBurić, D., & Doderović, M. (2022). Trend of Percentile Climate Indices in Montenegro in the Period 1961–2020. Sustainability, 14(19), 12519. https://doi.org/10.3390/su141912519