Article

Fertilization Regulates Grape Yield and Quality in by Altering Soil Nutrients and the Microbial Community

1
National Soil Quality Aksu Observation and Experimental Station, Baicheng 842300, China
2
Research Institute of Soil, Fertilizer and Agricultural Water Conservation, Xinjiang Academy of Agricultural Sciences, Urumqi 830091, China
*
Author to whom correspondence should be addressed.
These authors contributed equally to this work.
Sustainability 2022, 14(17), 10857; https://doi.org/10.3390/su141710857
Submission received: 13 July 2022 / Revised: 19 August 2022 / Accepted: 27 August 2022 / Published: 31 August 2022

Abstract

:
Rational fertilization is a win-win strategy for rural incomes and environmental restoration in ecologically fragile regions. However, the long-term cumulative grape productivity response to soil fertility has rarely been quantified. Here, long-term fertilization experiments (over 15 years) in the desert–oasis transitional zone of Sinkiang, China, were used to evaluate the interactions among grape yield, quality, fertilization, soil nutrients, and microbial communities. There were five treatments, as follows: CK0 (no planting and no fertilizing); NP (synthetic nitrogen and phosphorus); M (manure only); NPM1 (0.25 times NP and 0.33 times M); and NPM2 (NP and 0.5 times M). The grape yield increased with the application of total nitrogen. The soluble solids and reducing sugar contents had significant positive linear correlations with grape yield, but the opposite trend was found between grape yield and titratable acidity and tannin contents. The redundancy analysis showed that fertilization, soil nutrients (soil organic carbon, available nitrogen, and dissolved organic nitrogen), and microbial communities (ratio of fungi to bacteria, ratio of Gram-negative bacteria to Gram-positive bacteria, and total phospholipid fatty acids) accounted for 31.9%, 19.7%, and 26.8% of the grape yield and nutritional ingredients, respectively. The path analysis identified that fertilization, soil nutrients, and the microbial communities were significantly positively associated with the grape yield, soluble solids, and reducing sugars, while their associations with titratable acidity, tannins, and phenols were significantly negative. These results suggested that fertilization is a viable strategy for regulating grape yields and grape quality because it alters soil fertility in ecologically fragile regions.

1. Introduction

The demand for fruit production is continuously increasing with improvements to human living standards. Globally, fruit production increased from 0.48 billion tons in 2000 to 0.72 billion tons in 2017, with an annual increase rate of 2.56% [1]. Grapes, as the second most produced fruit, are becoming increasingly popular due to their nutritional and medicinal values [2,3]. Another major use of grapes is in making wine, especially in Europe, Australia, and America. Wine is considered to be a healthy and hygienic drink [3], and the nutritional ingredients of grapes, including reducing sugars, titratable acidity, and tannin contents, determine the composition and quality of the wine [4]. Obtaining high yields and superior nutritional ingredients requires large temperature differences, the avoidance of rain and dew, and a fine sandy loam soil, but regions with these characteristics are considered to be ecologically fragile [4,5]. Furthermore, these regions are not suitable for grape growth without human interventions. Therefore, it is important to understand how to achieve high grape yields and good nutritional ingredients in ecologically fragile regions.
Rational fertilization is a win-win strategy that achieves high crop productivity and improves the soil quality in ecologically fragile regions [6]. Fertilization with respect to crop requirements not only directly provides extra nutritional matter but also indirectly improves soil properties for better crop growth [7,8]. Many researchers have explored the response of grape productivity to different fertilizers based on short-term experiments. For instance, Martínez, Ortega, Janssens, and Fincheira [8] reported that a combination of organic and synthetic fertilizers was better at increasing grape yields than no fertilizer, synthetic fertilizer, or organic fertilizer applications alone. Brunetto, et al. [9] showed that synthetic nitrogen fertilizer did not influence the nutritional contents of grapes, while manure decreased the soluble solids content and increased the total acidity content of grapes. Although the short-term responses of grape yields and nutritional ingredients to different fertilizers are well-known, the long-term cumulative grape productivity responses to different fertilizers may be complicated. To achieve high grape yields, a large amount of fertilizer is often applied [10]. However, it is not clear whether grape yield increases are synchronized with an increase in nutritional ingredients over the long-term.
Fertilization can improve soil productivity, such as soil nutrients and microbial communities, which both play a vital role in determining crop productivity [11,12]. For example, a combination of organic and synthetic fertilizer significantly increased the soil carbon (C) and nitrogen (N) concentrations compared to using a synthetic fertilizer or no fertilizer [7]. The soil C and N concentrations represent the soil’s ability to supply utilizable nutrients, and many studies have shown that high soil organic carbon (SOC) and N concentrations lead to high crop yields and quality [11,13]. Soil biological fertility is a good indicator of the soil microbial parameter responses to different fertilizers and has been widely studied [12,14]. A global meta-analysis reported that N addition significantly inhibited soil microbial growth, composition, and function based on 1408 paired observations [15]. The ratio of fungi to bacteria usually decreased with N fertilization due to the low N demands of fungi [14]. Compared to synthetic fertilizer, organic fertilizer affects soil microbial communities by providing C-rich organic compounds to the C-limited microbial communities in ecologically fragile regions. It also directly supplies nutrients [16]. Bacteria and fungi are readily affected by available and complex C compounds, respectively [17,18]. Furthermore, reducing C inputs could decrease Gram-negative and increase Gram-positive bacterial abundance [17,19]. Soil fertility is associated with soil microbial communities because the mineralized nutrients at different soil fertility levels can actively change soil microbial communities [20]. Overall, the combination of fertilization, soil nutrients, and soil microbial communities has complex effects (direct, indirect, and interacting) on crop productivity. Therefore, an increased understanding of how these variables directly and/or indirectly affect crop productivity is urgently needed if crop growth is to improve.
Sinkiang, China, is located in the hinterland of the Eurasian continent and is in a desert–oasis transitional zone. This area is vulnerable to damage and has difficulty recovering due to the large temperature differences, high sunshine time, and low precipitation that are characteristic of the area. To prevent environmental degradation and ensure sustainable livelihoods, this natural and fragile ecological region was transformed into an area for growing grapes. Therefore, the objectives of this study were to (1) quantify the long-term cumulative responses of grape yields and nutritional ingredients to different fertilization treatments and (2) identify the links among grape productivity, soil nutrients, and soil microbial communities under different fertilization treatments.

2. Materials and Methods

2.1. Experimental Site

The research was conducted at the Shanshan monitoring site (43°06′ N, 90°33′ E), Sinkiang, China. The region is a desert–oasis transitional zone with an average temperature of 11.3 °C, an effective accumulated temperature of 5035 °C (>10 °C), and 3100 h of sunshine. The average annual precipitation is 25 mm and the evaporation is 3200 mm. The soil type is Haplic Cambisol and irrigation desert soil according to the Food and Agriculture Organization (FAO) [21] and the Chinese soil classification system, respectively. The initial (1987) topsoil (0–20 cm) at the Shanshan site had an SOC level of 7.88 g kg−1, a bulk density of 1.15 kg m−3, a soil pH of 8.10, and soil available N (AN), phosphorus (AP), and potassium (AK) levels of 78, 12.7, and 178 mg kg−1, respectively.

2.2. Experimental Design

To determine differences in grape yields, grape nutritional ingredients, soil nutrients, and soil microbial communities, five different long-term fertilization regimes were established using a random design, as follows: (1) CK0 (no planting and no fertilizing); (2) NP (synthetic nitrogen and phosphorus); (3) M (manure only); (4) NPM1 (0.25 times NP and 0.33 times M); and (5) NPM2 (NP and 0.5 times manure). The synthetic N and P were from urea and diammonium phosphate, respectively. The manure was pure sheep manure, with average C, N, and P contents (during the experiment) of 336, 20.1, and 4.96 g kg−1 dry weight, respectively. The CK0 regime involved no planting and no fertilizing; NP was first applied in 1991, with synthetic N of 540 kg ha−1 year−1 and synthetic P of 300 kg ha−1 year−1; NPM1 was first applied in 1996, with 0.25 times more synthetic fertilizer than of the NP treatment and manure at 12 × 103 kg ha−1 year−1; M was first applied in 2000, with 36 × 103 kg ha−1 year−1; and NPM2 was first applied in 2001, with one application of synthetic NP fertilizer and manure at 15 × 103 kg ha−1 year−1. This information is shown in Table 1.
These experimental treatments were on land that had previously been a natural grape ecosystem (CK0). Three years before the start of fertilization, the field was cleared to ensure uniform soil nutrients and microbial communities. The grape variety Thompson Seedless was planted at a density of 7500 plants per hectare (row spacing of 0.8 m × 1.7 m) and harvested in mid-August every year. Irrigation was applied because of the substantial evaporation and low amounts of precipitation. Flood irrigation was applied seven times during the germination, flowering, and berry expansion stages and during four periods after harvest (total irrigation amount was 27 × 103 m3 per hectare). Lime sulfur was applied to prevent powdery mildew, and no herbicide was applied. The grapes were harvested manually and pruned in summer to leave 1–2 spikes on the fruiting branches.

2.3. Sample Collection

Samples were collected from the topsoil (0–20 cm) and subsoil (20–40 cm) in July, 2016. Five to ten random soil core samples were collected using the “S” curve method. Plant residues and rocks were removed to ensure the accuracy of the analysis indicators. Then, the soil samples were thoroughly mixed and divided into three parts. The first part was air-dried and crushed to pass through a 0.25 mm sieve to measure the soil nutrients, the second part was stored at 4 °C for the soil microbial biomass carbon (MBC) and nitrogen (MBN) analyses, and the third part was freeze-dried and stored at −70 °C for the soil microbial community analysis.

2.4. Sample Analysis

The SOC and TN were measured by the H2SO4-K2Cr2O7 oxidation method [22] and Kjeldahl procedure [23], respectively. The soil AN, AP, and AK concentrations were measured according to Lu [24,25], and Page et al. [26], respectively. The soil dissolved organic carbon (DOC) and nitrogen (DON) were extracted according to Jones and Willett [27] and quantified using a continuous-flow analyzer. The soil samples that had been stored at 4 °C were used for the subsequent MBC and MBN measurements after chloroform fumigation and potassium sulfate extraction, respectively. They were then measured using a continuous-flow analyzer. The detected total phosphatidic acid content represented the total phospholipid fatty acid (PLFA) content; and Gram-negative, Gram-positive, 14:0, 15:0, 16:0, and 17:0 microbes represented the bacteria [28]. Microbes I14:0, i15:0, i16:0, i17:0, and 17:0 represented the Gram-positive bacteria (G+) [28]; 16:1w7c, 16:1w9c, cy17:0, 18:1w5c, 18:1w7c, and cy19:0w8c represented the Gram-negative bacteria (G−) [29]; 10Me16:0, 10Me17:0, and 10Me18:0 represented the actinomycetes (ACT) [30]; 16:1w5c represented the arbuscular mycorrhizal fungi (AMF) [29]; 18:1w9c, 18:2w6c, 18:2w9c, and 18:3w6c (6, 9, and 12) represented the other fungal types [28].
Additionally, five major nutritional ingredients in grapes were measured to represent grape quality. The soluble solids, reducing sugars, titratable acidity, tannins, and total phenols were measured using a refractometer, Fehling’s reagent, point titration, potassium permanganate oxidation, and the Folin–Ciocalteu method, respectively.
The annual relative change rates method (ARs, %) for soil nutrients and the microbial communities was adopted to allow the datasets, which had different experimental durations, to be compared. The AR was calculated as follows:
AR = ( S treatment   S control )   /   ( S control × T ) × 100 %
where Streatment represents the soil nutrients and microbial communities under the fertilization treatments, Scontrol represents the soil nutrients and microbial communities under the CK0 treatment, and T is the experimental duration (years).

2.5. Data Analyses

One-way ANOVA was used to explore the differences in grape yield, soil nutrients, and the microbial communities under the different fertilization treatments. A redundancy analysis (RDA) by Canoco 5 was used to select and quantify the factors driving the soil nutrients (SOC, TN, AN, AP, AK, DOC, and DON) and microbial communities (MBC, MBN, fungi, bacteria, ratio of fungi to bacteria, AMF, ACT, G+, G−, ratio of G−/G+, and PLFAs) effects on grape yield and nutritional ingredients. A path analysis using the Amos 17.0 package was employed to identify the relationships among yield, nutritional ingredients, soil nutrients, and the microbial communities. The driving factors and grape nutritional ingredients were divided into the following four latent variables: soil nutrients (SOC, AN, and DON), microbial communities (ratio of fungi to bacteria, G−/G+, and PLFAs), grape quality 1 (soluble solids and reducing sugars), and grape quality 2 (titratable acidity, tannins, and phenols). The following hypothetical paths were developed. First, fertilization, soil nutrients, and the microbial communities had a direct effect on the grape yield and quality, and second, fertilization indirectly affected the grape yield and quality via its effects on soil nutrients and the microbial communities. Finally, the soil nutrients that indirectly affected the grape yield and quality through their effects on the microbial communities were measured.

3. Results

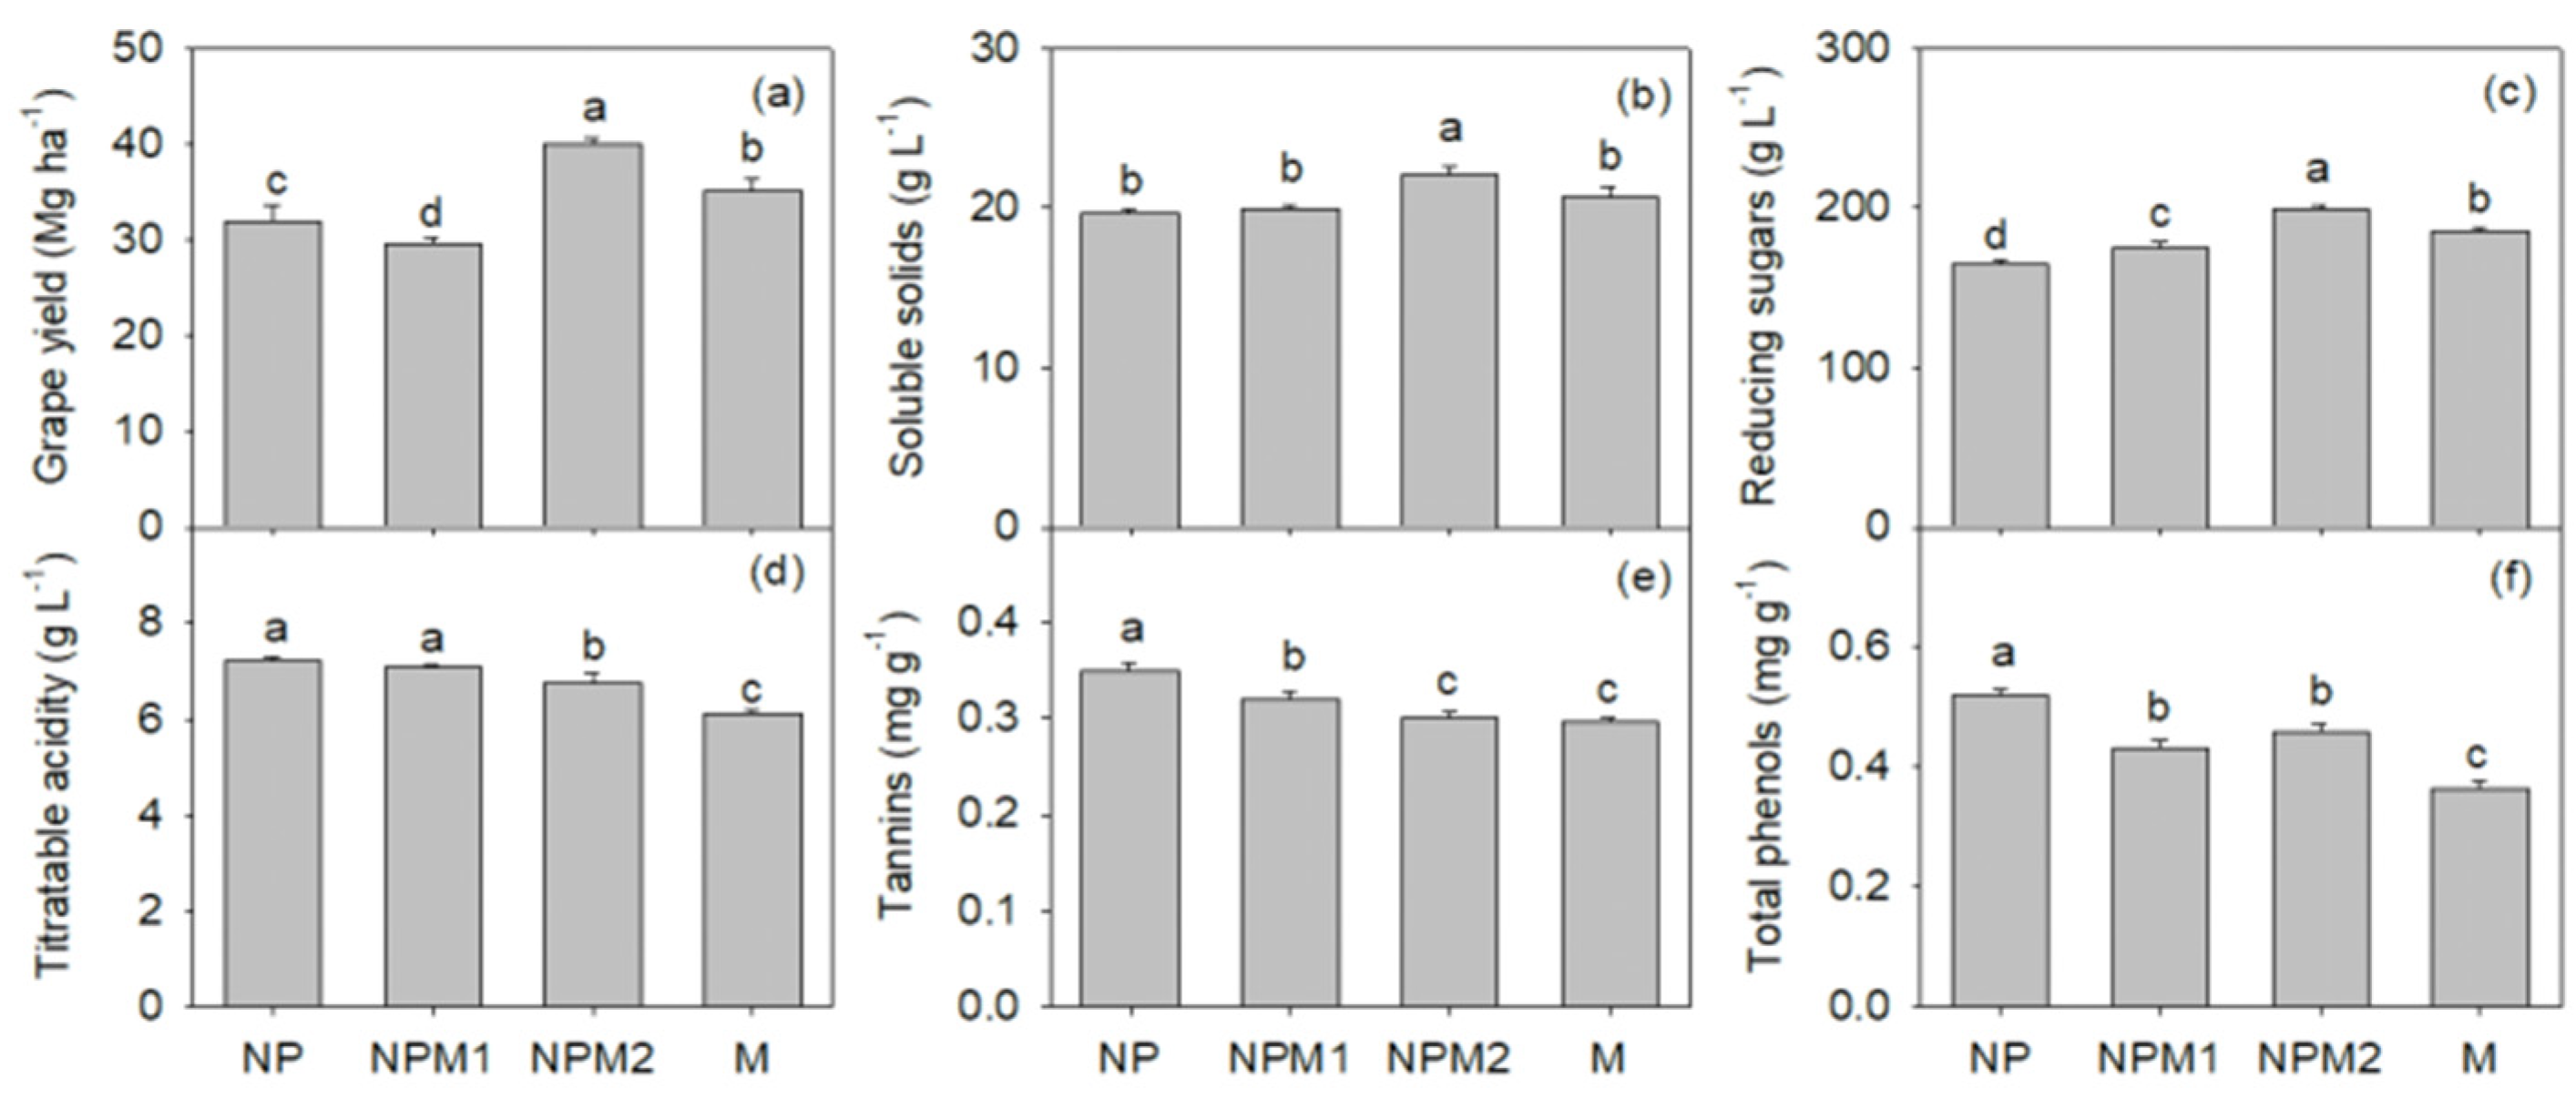
3.1. Grape Yield and Nutritional Ingredient Responses to Long-Term Fertilization

The grape yield increased with the application of TN (inorganic and organic) (NPM2 > M > NP > NPM1, Figure 1). Significantly higher soluble solids and reducing sugar contents were recorded in the NPM2 treatment (22 g L−1 and 199 g L−1, respectively). A comparison of the M, NP, and NPM1 treatments showed that NP led to the highest titratable acidity (7.20 g L−1), tannin (0.35 g L−1), and total phenol (0.52 g L−1) contents. The lowest titratable acidity, tannin, and total phenol contents occurred in the M treatment. The soluble solids and reducing sugar contents had a significant positive linear correlation with grape yield (Figure 2), but the titratable acidity and tannin contents significantly decreased with increasing grape yield. There was no significant linear relationship between grape yield and total phenol content.

3.2. Changes in Soil Nutrients under Long-Term Fertilization

The soil nutrient levels under the CK0 treatment and the ARs under the NP, NPM1, NPM2, and M treatments are shown in Table 2. The different fertilization treatments improved the SOC, TN, AN, AP, DOC, and DON concentrations in the topsoil (0–20 cm) compared to those in the CK0 treatment, except for the DOC and DON concentrations using the NPM1 treatment. Compared to the NPM1 treatment, the M treatment significantly increased the SOC (18.05%), TN (31.48%), AN (3.91%), DOC (19.06%), and DON (12.03%) ARs. The ARs for AP and AK were not significantly different among the NP, NPM1, NPM2, and M treatments. The ARs of all soil nutrients in the subsoil (20–40 cm) were lower than in the topsoil. Compared to the CK0 treatment, the NP and NPM1 treatments improved the SOC, TN, AN, and AP concentrations, but reduced the AK, DOC, and DON concentrations. The ARs for SOC and TN did not significantly differ between the NPM2 and M treatments, but did significantly increased compared to the NP and NPM1 treatments. The AN (2.64–3.55%) AR under the NP, NPM2, and M treatments was higher than that under the NPM1 treatment. Finally, the NPM2 and M treatments improved the DOC and DON concentrations compared to the CK0 treatment, with AR values of 2.86–6.97% (DOC) and 2.29–4.29% (DON).

3.3. Changes in the Microbial Communities with Long-Term Fertilization

The soil microorganisms with the different treatments showed significant variations in both the topsoil (0–20 cm) and subsoil (20–40 cm) (Table 3). Fertilization improved the MBC, MBN, fungi, bacteria, F/B, AMF, ACT, G+, G−, G−/G+, and PLFA contents in the topsoil compared with those in CK0, except for the bacteria, ACT, G+, and G− contents with the M treatment. The bacteria, ACT, G+, and G− contents with the M treatment decreased by 0.25%, 0.83%, 0.33%, and 0.15%, respectively. There were no significant differences in the fungi and bacteria among the NP, NPM1, and NPM2 treatments. The F/B ARs in the NPM2 (0.71%) and M (0.64%) treatments were higher than those in the NP (0.44%) and NPM1 (0.25%) treatments. The highest ARs for G−/G+ (0.53%) and PLFAs (1.34%) were found with the NPM2 treatment. The NP, NPM1, NPM2, and M treatments annually increased the fungi in the subsoil by 1.23%, 2.01%, 0.78%, and −0.31%, respectively, and the bacteria by 2.07%, 2.08%, 2.13%, and 0.45%, respectively, but decreased the F/B by 0.47%, 0.20%, 0.37%, and 0.29%, respectively, relative to the CK treatment. The G+ (−0.43%) and G− (−0.62%) ARs in the M treatment were lower than those in the NP, NPM1, and NPM2 treatments. The PLFAs did not significantly differ among the NP, NPM1, and NPM2 treatments, but significantly decreased under the M treatment.

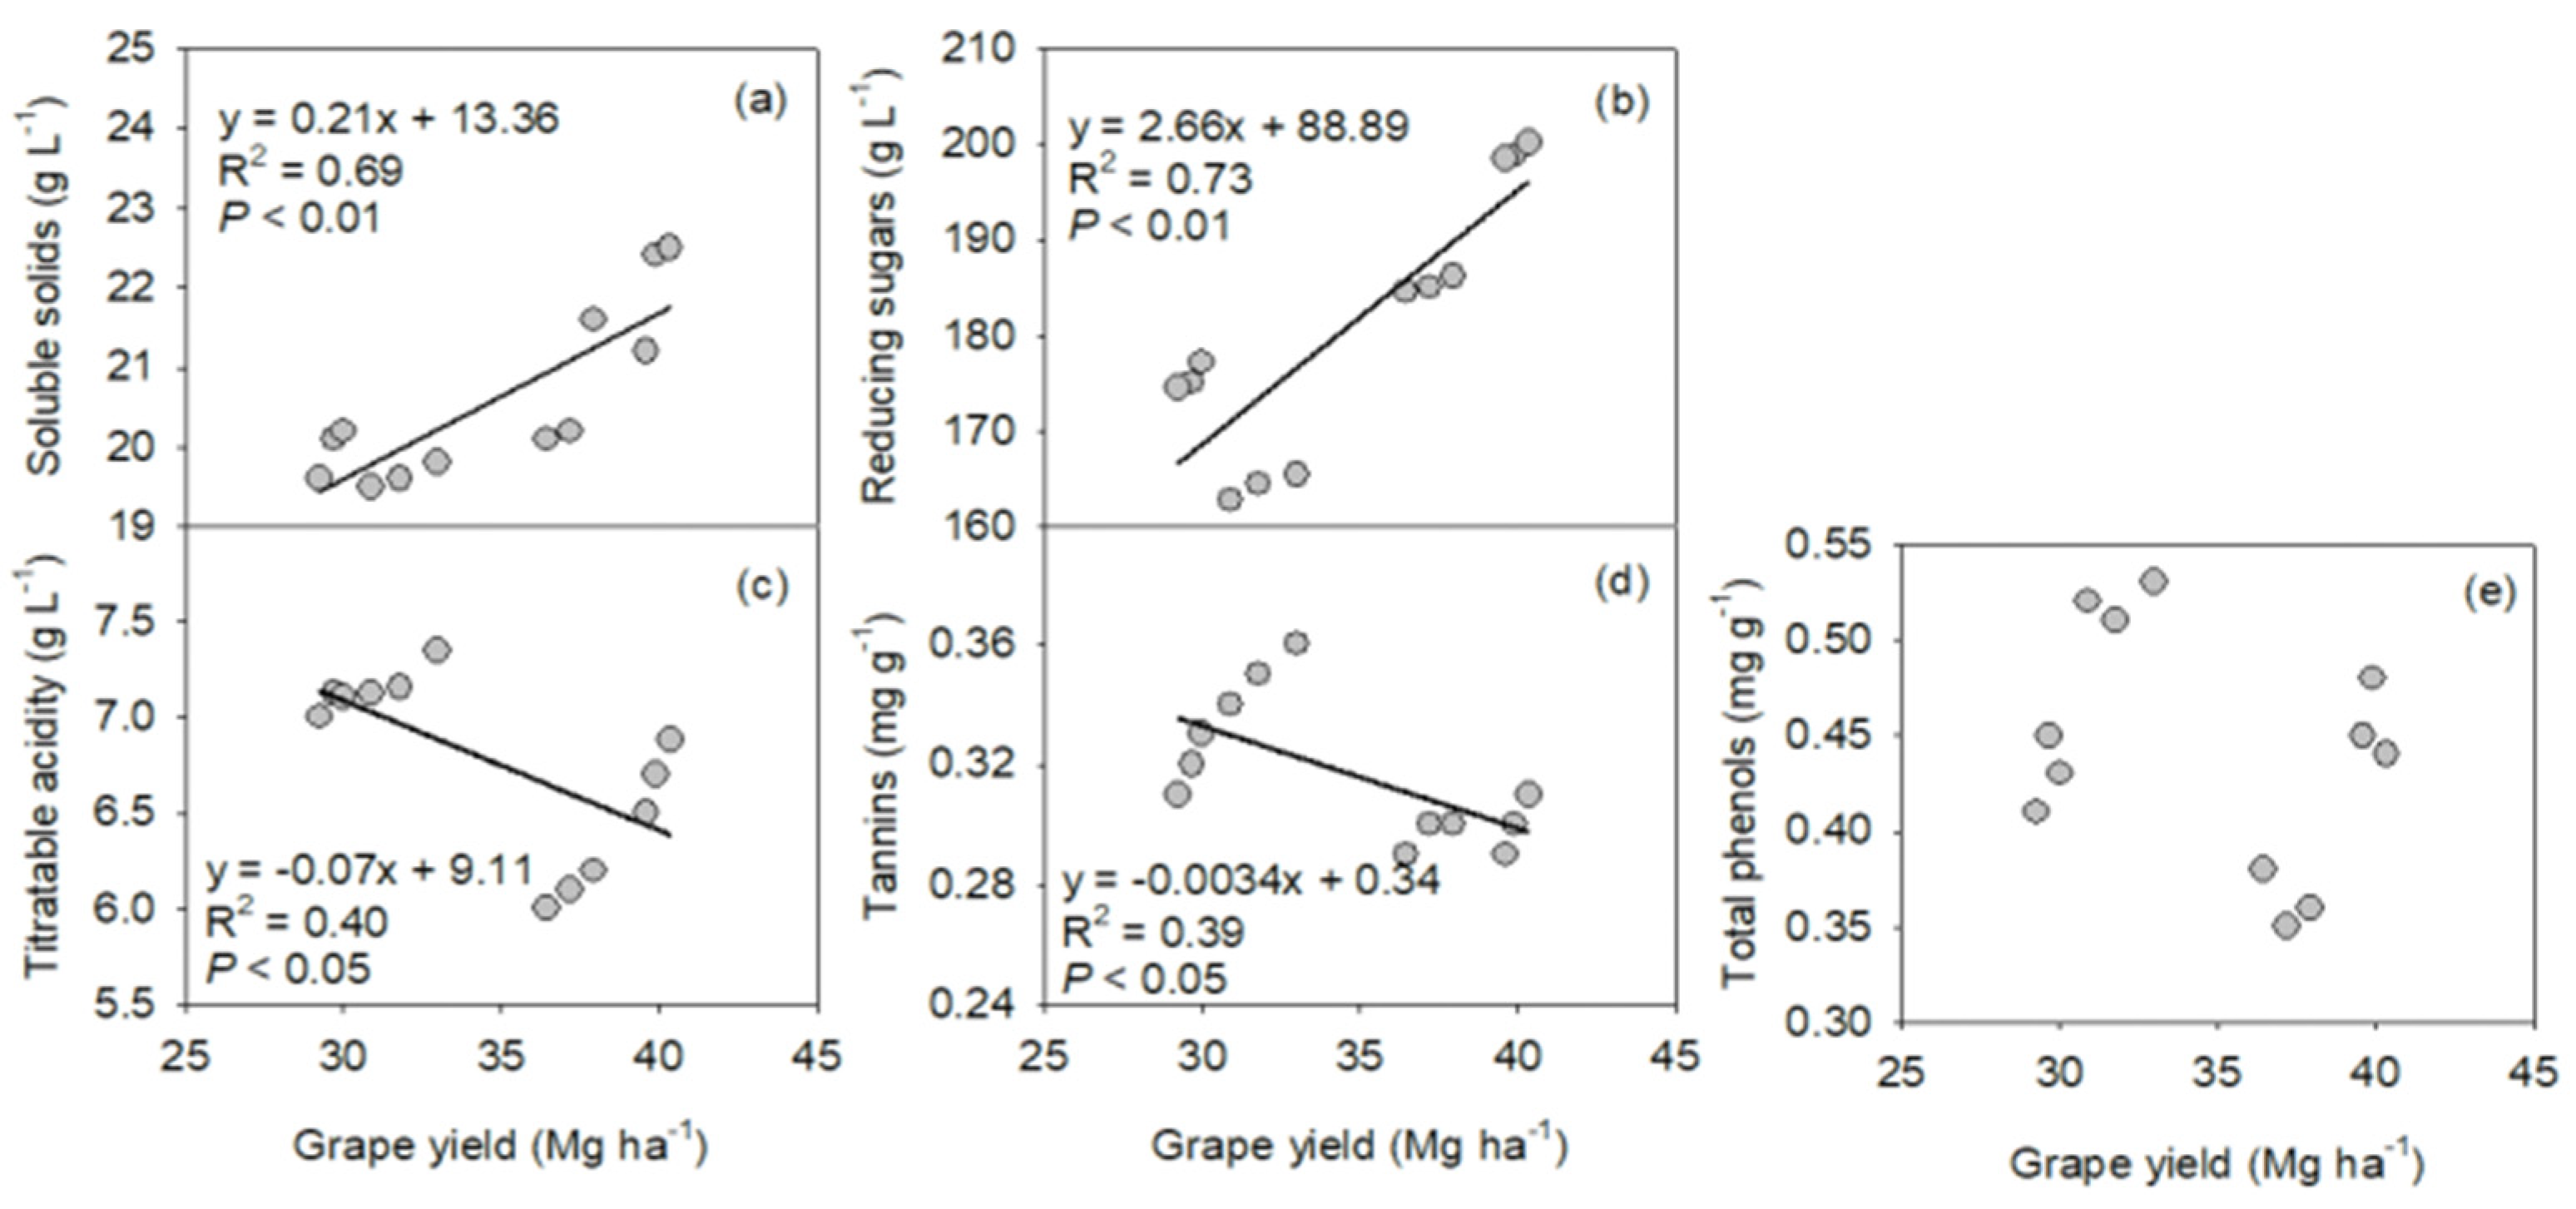
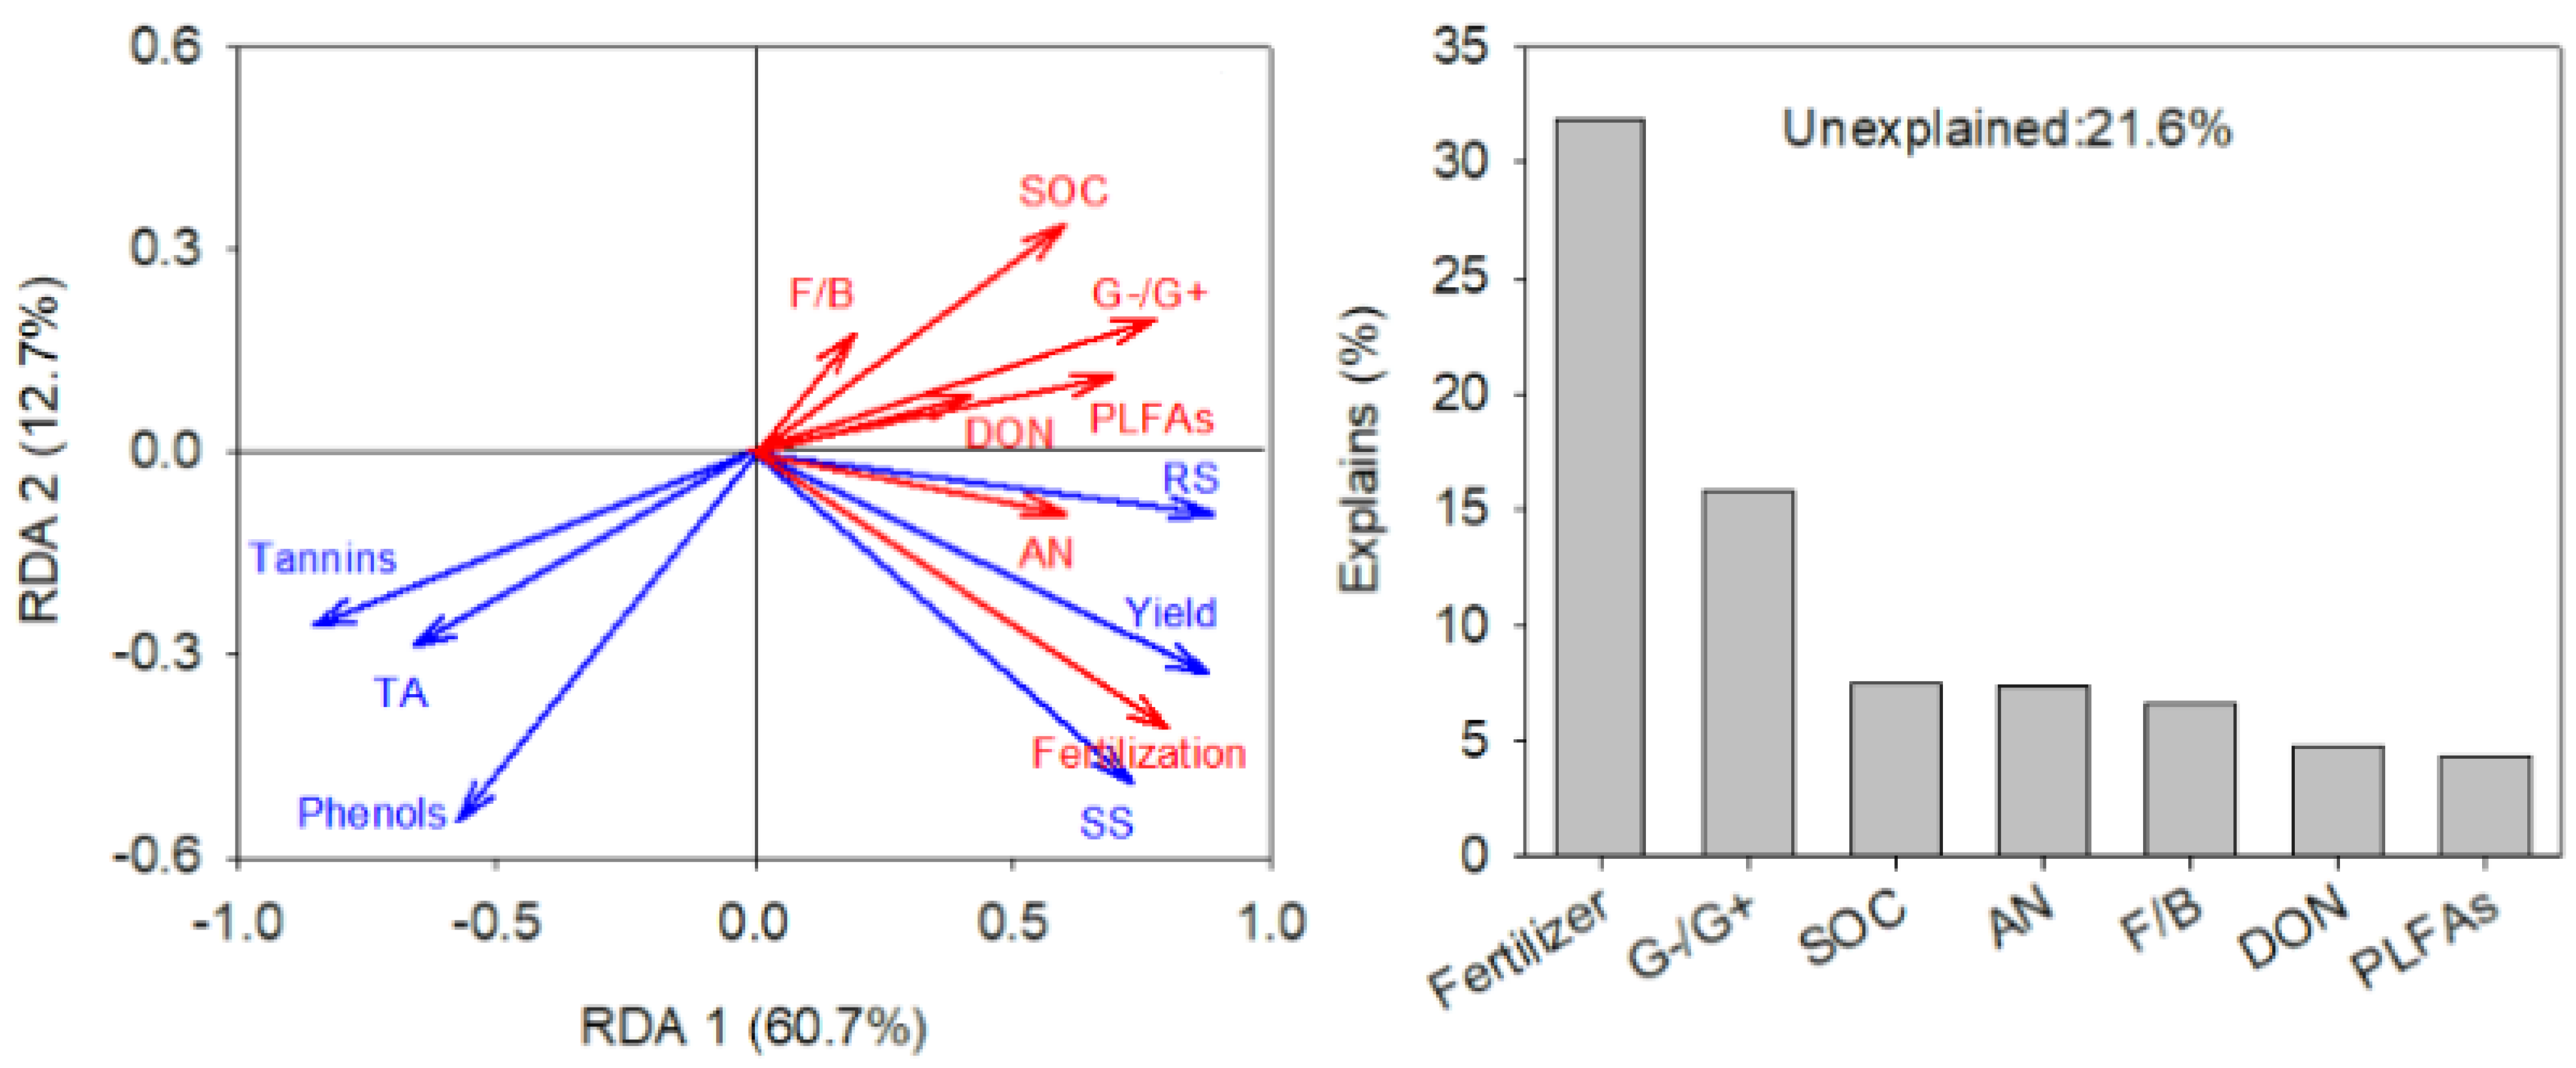
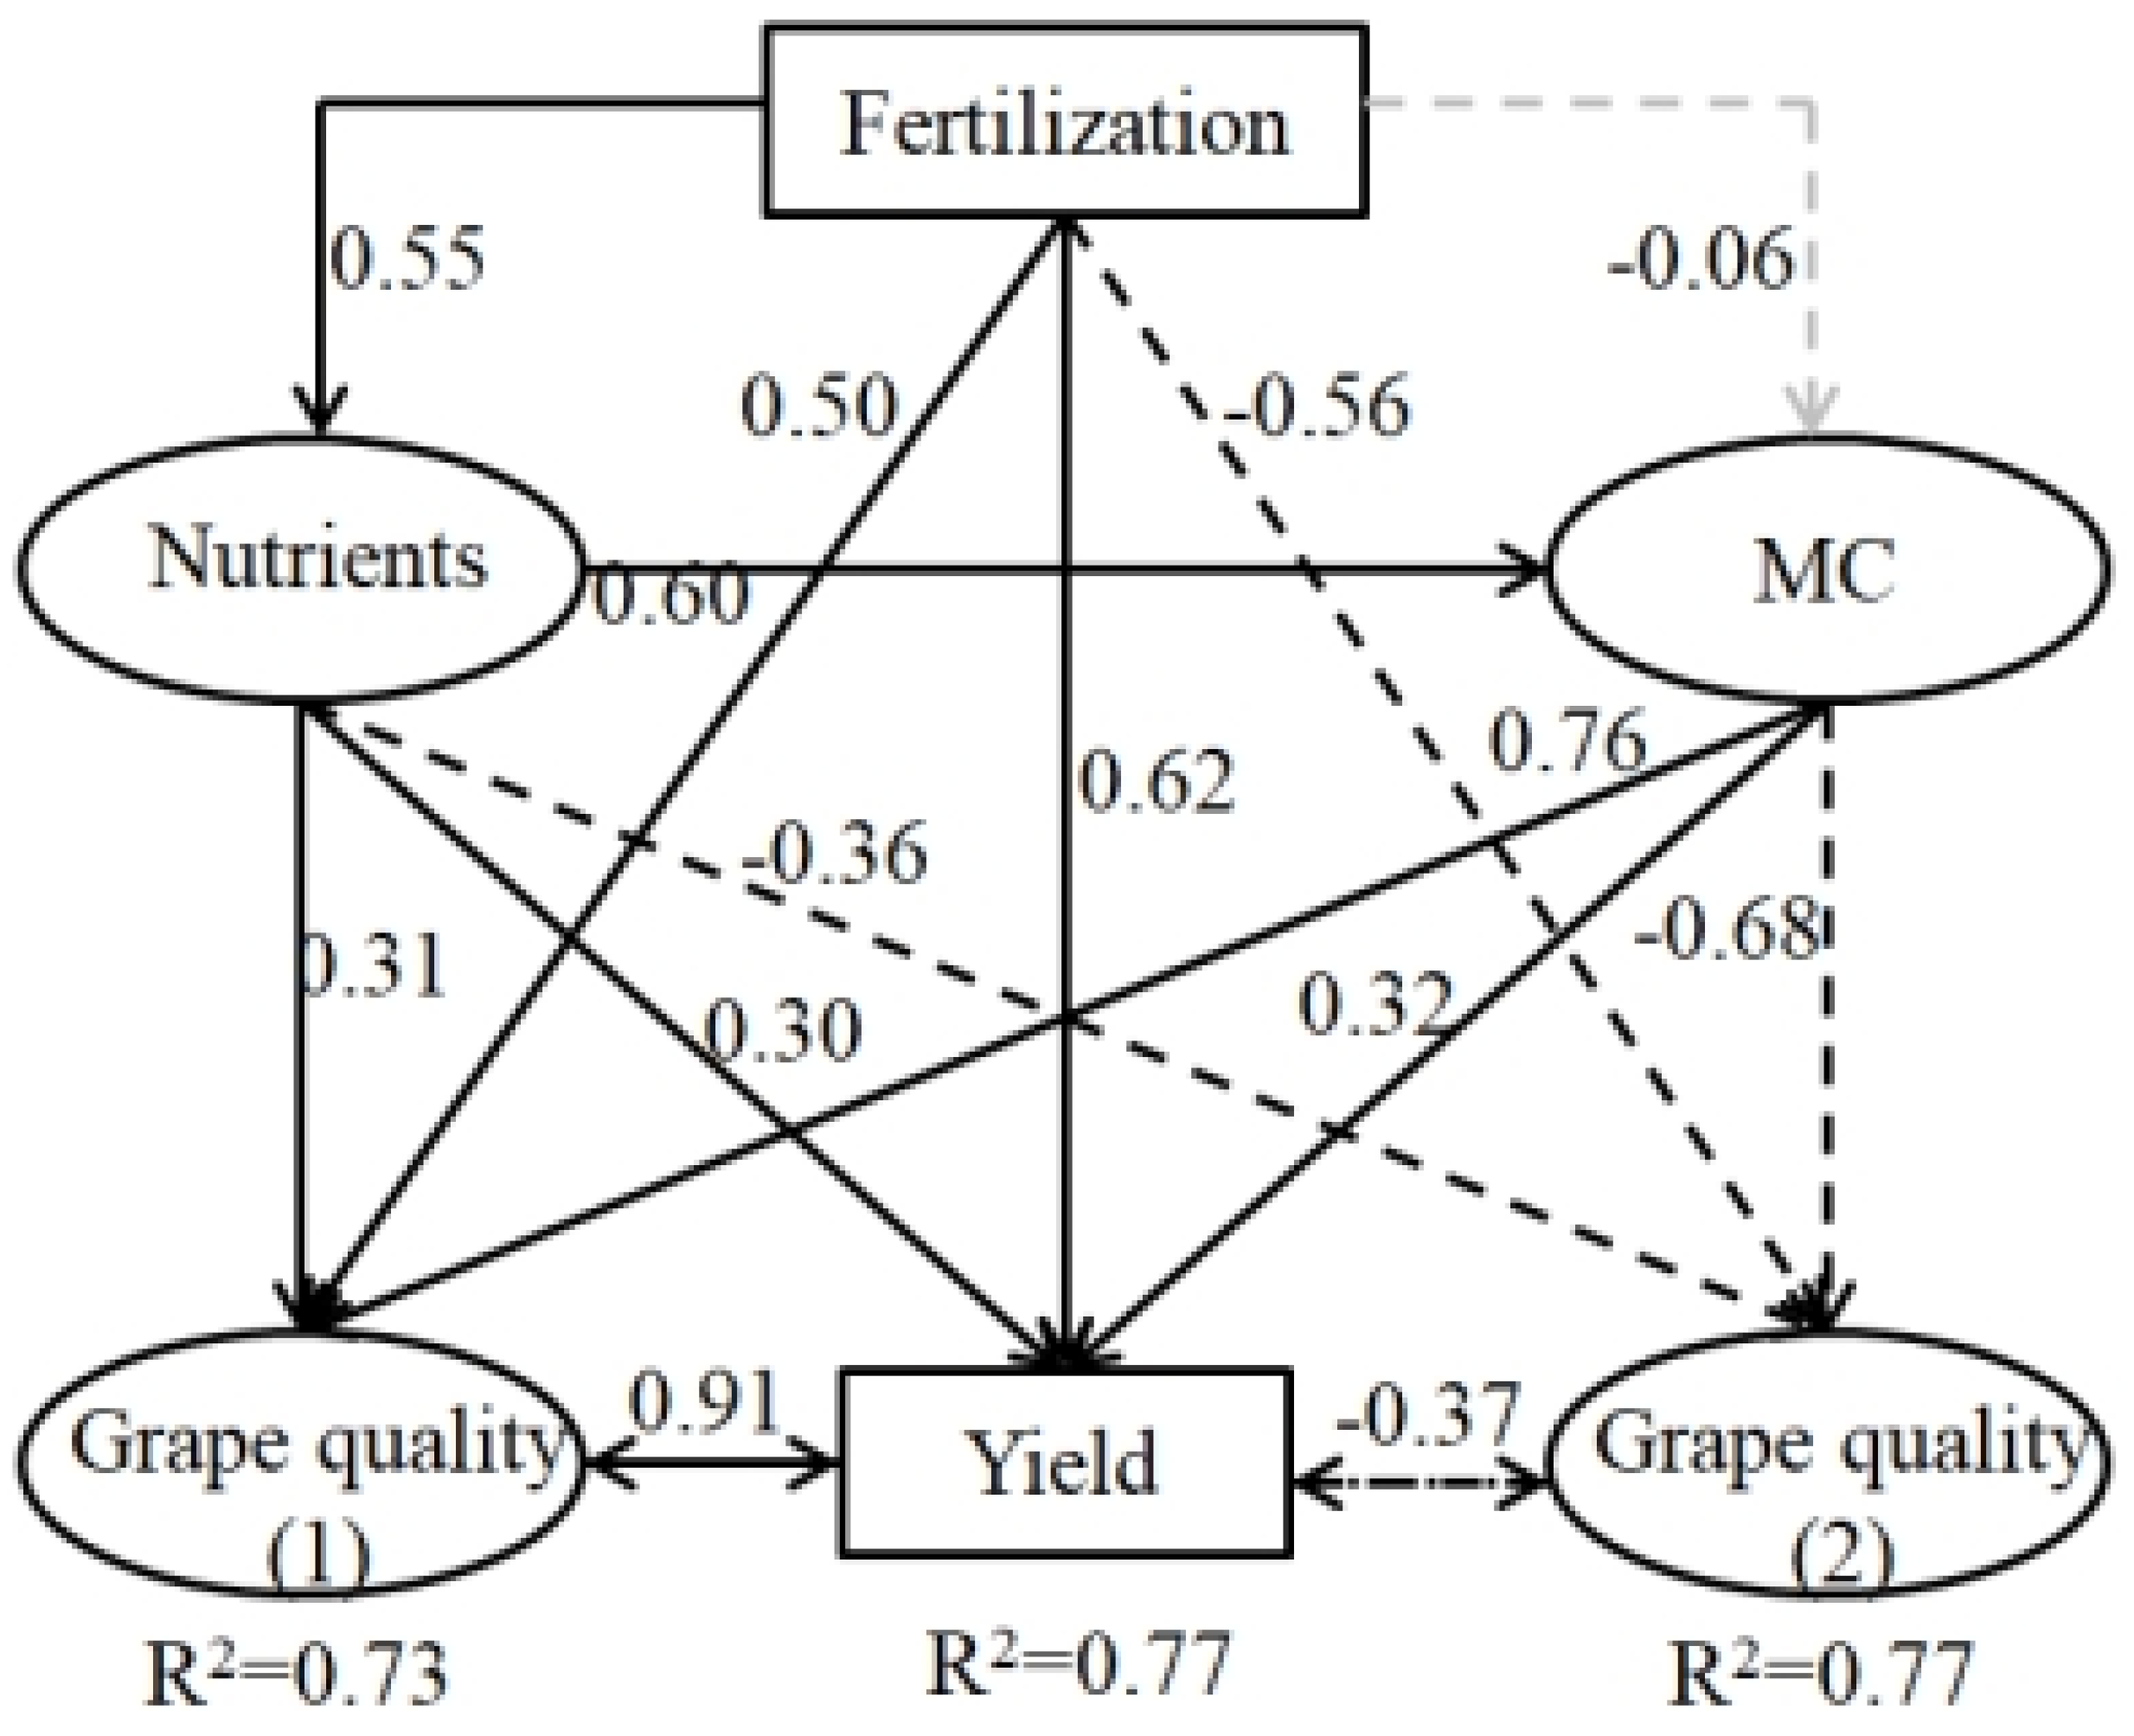
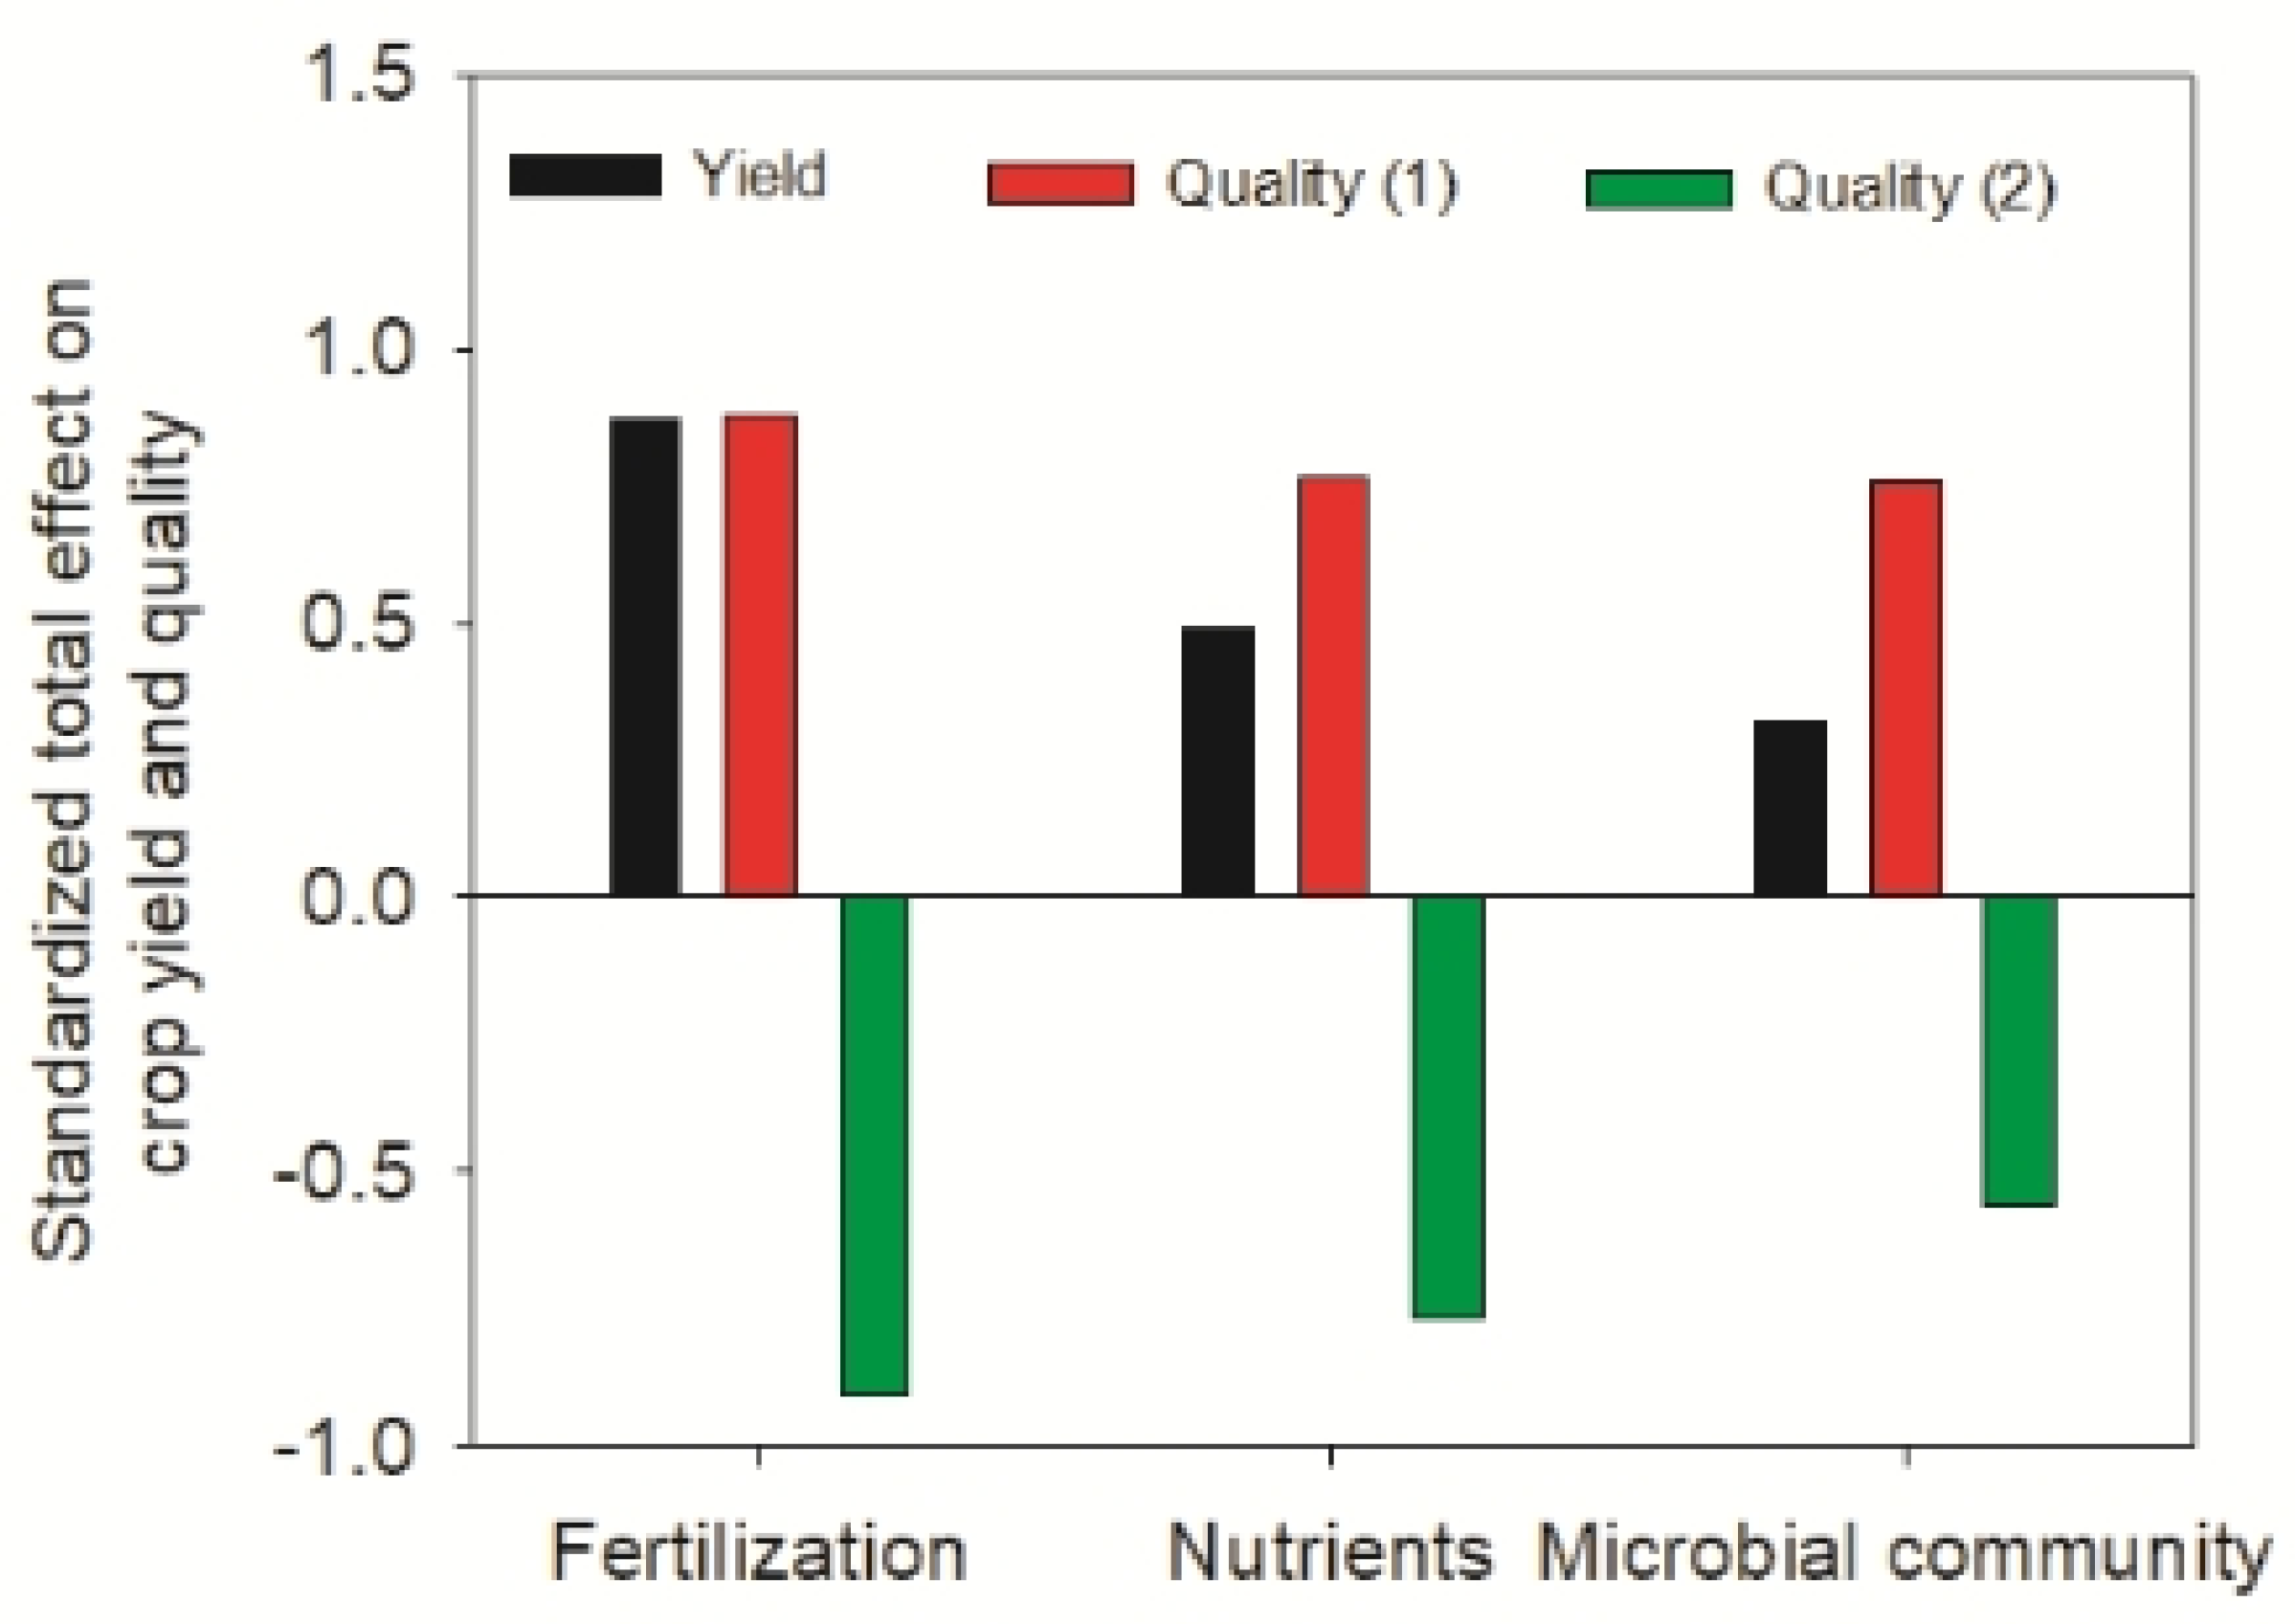
3.4. Mechanisms Driving Grape Yield and Quality

The RDA suggested that fertilization, SOC, AN, DON, F/B, G−/G+, and PLFAs were the driving factors regulating grape yield and nutritional ingredients (Figure 3). Fertilization had the most influential impact on grape yield and nutritional ingredients among the selected seven variables (31.9%). In addition, soil nutrients (SOC, AN, and DON) and the microbial communities (F/B, G−/G+, and PLFA) accounted for 19.7% and 26.8%, respectively. The driving factors and grape nutritional ingredients were divided into four latent variables (soil nutrients, microbial communities, grape quality 1, and grape quality 2; see Figure 4). The standardized loading scores suggested that SOC and G−/G+ were more powerful indicators of soil nutrients and the microbial communities, which was consistent with the RDA results. The path analysis explained 73–77% of the variance in grape yield and nutritional ingredients (Figure 5). Fertilization, soil nutrients, and the microbial communities directly affected grape yield and nutritional ingredients, and fertilization strongly, and positively affected soil nutrients. Soil nutrients directly affected grape yield and nutritional ingredients via their effects on microbial communities. Overall, fertilization, soil nutrients, and the microbial communities were significantly and positively associated with grape yield and quality 1, while their association with grape quality 2 was significantly negative. The standardized total effects on grape yield and quality occurred in the following order: fertilization > soil nutrients > microbial communities (Figure 6).

4. Discussion

4.1. Effect of Long-Term Fertilization on Grape Yield and Quality

Fertilization provides nutrients for plant growth when the existing soil nutrients are not sufficient, especially in ecologically fragile regions. Our results showed that grape yield was higher in the NPM2 treatment and M treatment than in the NP treatment and NPM1 treatment. One potential reason was the different amount and type of N input (Fertilizer TN:NPM2 (842 kg ha−1 year−1) > M (624 kg ha−1 year−1) > NP (540 kg ha−1 year−1) > NPM1 (kg ha−1 year−1) (Table 1). Another important potential reason may be that the manure also indirectly enhanced the soil properties, which led to improved crop growth, as the extent of soil quality improvement largely depended on the type of fertilizer used (Figure 5) [7,19]. The grape yield increased with the application of TN (inorganic and organic) (Figure 1 and Table 2). Nitrogen is the main component of phospholipids, nucleic acids, and protein in plant tissues. Therefore, N additions have a strong effect on grape yields [19]. Interestingly, there was a different relationship between grape yield and the nutritional ingredients, which meant that fertilization not only impacted the grape yield but also had a considerable effect on the grape nutritional ingredients. Reducing sugars, titratable acidity, soluble solids, tannins, and total phenols are the main nutritional ingredients in grapes [4]. The short-term effects of different fertilization schemes on grape nutritional ingredients have been extensively studied. For example, Thomidis et al. [31] reported a large sugar content with high N input treatments, and the soluble solids content with a manure treatment was higher than that with a synthetic fertilizer treatment [9]. These results were consistent with our findings. However, Brunetto, Ceretta, Melo, Miotto, Ferreira, Couto, Silva, Garlet, Somavilla, Cancian, and Ambrosini [9] found that a manure treatment produced a higher titratable acidity content than a synthetic fertilizer treatment. The tannin and total phenolic contents were also significantly higher under a manure treatment [32]. This result is inconsistent with our findings and this difference was probably due to the amount of N fertilizer and different accumulative effects (short-term and long-term). Overall, the soluble solids and reducing sugar contents had significant positive correlations with grape yield, but the opposite trend was found between grape yield and the titratable acidity and tannin contents in the different experimental fertilization treatments. Therefore, achieving higher grape yields can also lead to reductions in some nutritional ingredients.

4.2. Effects of Long-Term Fertilization on Soil Nutrients and Microbial Communities

Soil fertility is a well-studied subject that affects human living standards and environmental quality. Fertilization is the most effective management method for improving soil fertility, especially soil nutrients and microbial communities. Previous studies have shown that synthetic fertilizer and manure increased the SOC and AN concentrations compared to CK0, and that this was due to exogenous nutrients and C inputs [33,34]. The SOC, AN, and DON under the NPM1 treatment were lower than those under the NP, NPM2, and M treatments (Table 1 and Table 2). The fertilizer types were as follows: NPM2 (Sy-N 540, Or-N 302), M (Sy-N 0, Or-N 624), NP (Sy-N 540, Or-N 0), and NPM1 (Sy-N 135, Or-N 240) (kg ha−1 year−1). A large amount of synthetic fertilizer could promote the growth of plant roots, bringing more root exudates to the soil [35]. Although manure can directly add exogenous substances to soil, the effect of a small amount of manure on soil fertility was not as significant as adding a large amount of synthetic fertilizer. Several studies have explored the effects of N addition on soil microbial communities at local and global scales [15,36]. Most studies have reported that excessive application of nitrogen fertilizer (urea) will reduce the number of soil microorganisms, which may be related to the toxicity of ammonia and excess microbial nutrition [14,15]. Previous studies have suggested that the ratio of fungi to bacteria decreased with the application of N fertilizer because the N requirement of bacteria is higher than that of fungi [37]. However, our results were inconsistent with this finding. Two potential reasons are possible. First, our experiment was carried out using gray desert soil, which has a high sand content [38]. Most nitrogen fertilizer is leached and lost when external irrigation is applied, which also meant that there were no toxic effects on the microorganisms [39]. Another reason is that our site was located in a desert–oasis transitional zone that is extremely deficient in soil nutrients and has a low soil microbial biomass [40]. Following soil N enrichment, the lower N requirement of plants reduced the AMF content (Table 3). Furthermore, a high AMF content promoted more C to be transferred from plant roots to soil, which increased the G+ bacterial abundance (Table 3) [41,42]. Overall, the effects of fertilization on soil nutrients and microbial communities depended on the amount and type of fertilization.

4.3. Grape Yield and Quality Responses to Soil Nutrient, Microbial Community and Soil Fertility

The standardized loading scores suggested that SOC and G−/G+ were powerful indicators of soil fertility (Figure 4). The SOC content represents the capacity of soil to improve nutrient levels [16]. Furthermore, G− and G+ bacteria rely on readily available and recalcitrant C sources [43]. Therefore, the G−/G+ ratio indicates the level of newly formed SOC, namely soil fertility. As expected, fertilization significantly influenced grape yield and nutritional ingredients compared to soil nutrients and microbial communities (Figure 3). Fertilization not only directly provides extra nutritional matter but also indirectly improves the soil properties, soil microbial communities, and soil microenvironment, which regulate plant growth [44]. For example, based on a 25 year fertilization experiment, Cai, Xu, Wang, Zhang, Liang, Hou, and Luo [7] reported that fertilization increased the crop yield by enhancing soil nutrients. Using 223 Arctic and Antarctic soil samples, Siciliano, Palmer, Winsley, Lamb, Bissett, Brown, van Dorst, Ji, Ferrari, Grogan, Chu, and Snape [20] found that soil nutrients were associated with soil microbial communities. Based on previous studies, a relationship among grape yields and nutritional ingredients, fertilization, soil nutrients, and soil microbial communities has been hypothesized. Our results showed that fertilization, soil nutrients, and the microbial communities were significantly and positively associated with grape yield, soluble solids, and reducing sugars, while their association with titratable acidity, tannins, and phenols was significantly negative. Soil nutrients directly affect grape yield and nutritional ingredients via microbial communities. Soil nutrients provide energy for soil microbial activity and determine the microbial composition, and this might be an important mechanism by which soil fertility regulates grape productivity [20]. Additionally, there was a greater direct effect between the soil microbial communities and grape nutritional. Overall, our results further verified that the interplay among fertilization, soil nutrients, and soil microbial communities, and their interaction jointly affected grape yield and nutritional ingredients (Figure 5). These results suggested that fertilization was a viable strategy for regulating grape yields and grape quality because it altered soil fertility in ecologically fragile regions.

5. Conclusions

Significantly different grape yields, nutritional ingredients, soil nutrients, and soil microbial communities were found among the long-term different fertilization treatments. The soluble solids and reducing sugar contents had a significantly positive linear correlation with grape yield, but the opposite trend was found between grape yield, and titratable acidity and tannin contents. The effects of fertilization on soil nutrients and the microbial communities depended on the amount of fertilization. Fertilization accounted for 31.9% of the variance in grape yield and nutritional ingredients, followed by microbial communities at 26.8% and soil nutrients at 19.7%. Fertilization, soil nutrients, and the microbial communities were significantly and positively associated with grape yield, soluble solids, and reducing sugars, while their association with titratable acidity, tannins, and phenols was significantly negative. Our results suggested that fertilization was a viable strategy for regulating grape yields and quality because it alters soil fertility. The results also showed that a high grape yield implied that all nutritional ingredients would also be high.

Author Contributions

Q.Z., X.X. and Y.X. conceived and designed the experiments. Q.Z., Y.X. and X.X. analyzed the data. Q.Z. wrote and revised the paper. All authors have read and agreed to the published version of the manuscript.

Funding

This work was financially supported by the National Natural Science Foundations of China (Grant No. 41561070).

Institutional Review Board Statement

Not applicable.

Informed Consent Statement

Not applicable.

Data Availability Statement

Not applicable.

Acknowledgments

Financial support from Research Institute of Soil, Fertilizer and Agricultural Water Conservation, Xinjiang Academy of Agricultural Sciences and National Soil Quality Aksu Observation and Experimental Station is gratefully acknowledged. We thank all of our colleagues who were involved in these long-term trials and helped maintain these unique experiments. We thank International Science Editing (http://www.internationalscienceediting.com (accessed on 1 January 2022)) for editing this manuscript.

Conflicts of Interest

The authors declare no competing interests.

References

  1. FAO. Food and Agriculture Data. 2019. Available online: http://www.fao.org/faostat/en/#data/EP/visualize (accessed on 1 January 2022).
  2. Kubyshkin, A.V.; Avidzba, A.M.; Borisyuk, V.S.; Stoyanov, V.S.; Shramko, Y.I. Polyphenols of red grapes in wine and concentrates for use in rehabilitation technologies. Agrobiology 2017, 52, 622–630. [Google Scholar] [CrossRef]
  3. Copetti, C.; Franco, F.W.; Machado, E.d.R.; Soquetta, M.B.; Quatrin, A.; Ramos, V.d.M.; Moreira, J.C.F.; Emanuelli, T.; Sautter, C.K.; Penna, N.G. Acute consumption of bordo grape juice and wine improves serum antioxidant status in healthy individuals and inhibits reactive qxygen species production in human neuron-like cells. J. Nutr. Metab. 2018, 2018, 4384012. [Google Scholar] [CrossRef]
  4. Wang, R.; Sun, Q.; Chang, Q. Soil Types Effect on Grape and Wine Composition in Helan Mountain Area of Ningxia. PLoS ONE 2015, 10, e0116690. [Google Scholar] [CrossRef] [PubMed]
  5. Liu, J.L. Study on the Delineation of Ecological Protection Red Line in Ecological Fragile Region of the West. Meteorol. Environ. Res. 2018, 9, 19–23,29. [Google Scholar]
  6. Aldanondo-Ochoa, A.M.; Casasnovas-Oliva, V.L.; Arandia-Miura, A. Environmental efficiency and the impact of regulation in dryland organic vine production. Land Use Policy 2014, 36, 275–284. [Google Scholar] [CrossRef]
  7. Cai, A.; Xu, M.; Wang, B.; Zhang, W.; Liang, G.; Hou, E.; Luo, Y. Manure acts as a better fertilizer for increasing crop yields than synthetic fertilizer does by improving soil fertility. Soil Tillage Res. 2019, 189, 168–175. [Google Scholar] [CrossRef]
  8. Martínez, M.M.; Ortega, R.; Janssens, M.; Fincheira, P. Use of organic amendments in table grape: Effect on plant root system and soil quality indicators. J. Soil Sci. Plant Nutr. 2018, 18, 100–112. [Google Scholar] [CrossRef]
  9. Brunetto, G.; Ceretta, C.A.; de Melo, G.W.B.; Miotto, A.; Ferreira, P.A.A.; Couto, R.D.R.; da Silva, L.O.S.; Garlet, L.P.; Somavilla, L.M.; Cancian, A.; et al. Grape yield and must composition of ‘Cabernet Sauvignon’ grapevines with organic compost and urea fertilization. Rev. De Ciências Agroveterinárias 2018, 17, 212–218. [Google Scholar] [CrossRef]
  10. Gatti, M.; Squeri, C.; Garavani, A.; Frioni, T.; Dosso, P.; Diti, I.; Poni, S. Effects of Variable Rate Nitrogen Application on cv. Barbera Performance: Yield and Grape Composition. Am. J. Enol. Vitic. 2019, 70, 188–200. [Google Scholar] [CrossRef]
  11. Cai, A.; Zhang, W.; Xu, M.; Wang, B.; Wen, S.; Shah, S.A.A. Soil fertility and crop yield after manure addition to acidic soils in South China. Nutr. Cycl. Agroecosystems 2018, 111, 61–72. [Google Scholar] [CrossRef]
  12. Liang, G.; Cai, A.; Wu, H.; Wu, X.; Houssou, A.A.; Ren, C.; Wang, Z.; Gao, L.; Wang, B.; Li, S.; et al. Soil biochemical parameters in the rhizosphere contribute more to changes in soil respiration and its components than those in the bulk soil under nitrogen application in croplands. Plant Soil 2018, 435, 111–125. [Google Scholar] [CrossRef]
  13. Yang, J.; Gao, W.; Ren, S. Long-term effects of combined application of chemical nitrogen with organic materials on crop yields, soil organic carbon and total nitrogen in fluvo-aquic soil. Soil Tillage Res. 2015, 151, 67–74. [Google Scholar] [CrossRef]
  14. Geisseler, D.; Scow, K.M. Long-term effects of mineral fertilizers on soil microorganisms—A review. Soil Biol. Biochem. 2014, 75, 54–63. [Google Scholar] [CrossRef]
  15. Zhang, T.; Chen, H.Y.H.; Ruan, H. Global negative effects of nitrogen deposition on soil microbes. ISME J. 2018, 12, 1817–1825. [Google Scholar] [CrossRef] [PubMed]
  16. Montiel-Rozas, M.M.; Dominguez, M.T.; Madejón, E.; Madejón, P.; Pastorelli, R.; Renella, G. Long-term effects of organic amendments on bacterial and fungal communities in a degraded Mediterranean soil. Geoderma 2018, 332, 20–28. [Google Scholar] [CrossRef]
  17. Yang, L.; Tan, L.; Zhang, F.; Gale, W.J.; Cheng, Z.; Sang, W. Duration of continuous cropping with straw return affects the composition and structure of soil bacterial communities in cotton fields. Can. J. Microbiol. 2018, 64, 167–181. [Google Scholar] [CrossRef]
  18. Chen, Y.; Ma, S.; Jiang, H.; Hu, Y.; Lu, X. Influences of litter diversity and soil moisture on soil microbial communities in decomposing mixed litter of alpine steppe species. Geoderma 2020, 377, 114577. [Google Scholar] [CrossRef]
  19. Yao, R.J.; Yang, J.S.; Zhu, W. Impact of crop cultivation, nitrogen and fulvic acid on soil fungal community structure in salt-affected alluvial fluvo-aquic soil. Plant Soil 2021, 464, 539–558. [Google Scholar] [CrossRef]
  20. Siciliano, S.D.; Palmer, A.S.; Winsley, T.; Lamb, E.; Bissett, A.; Brown, M.V.; van Dorst, J.; Ji, M.; Ferrari, B.C.; Grogan, P.; et al. Soil fertility is associated with fungal and bacterial richness, whereas pH is associated with community composition in polar soil microbial communities. Soil Biol. Biochem. 2014, 78, 10–20. [Google Scholar] [CrossRef]
  21. Food and Agriculture Organization of the United Nations. World Reference Base for Soil Resources 2014: International Soil Classification System for Naming Soils and Creating Legends for Soil Maps; World Soil Resources Report 2014; Food and Agriculture Organization of the United Nations: Rome, Italy, 2015; Volume 106, pp. 12–21. [Google Scholar]
  22. Nelson, D.W.; Sommers, L.E. Total carbon, organic carbon, and organic matter. Methods Soil Anal. Part 3—Chem. Methods 1996, 9, 961–1010. [Google Scholar]
  23. Gallaher, R.N.; Weldon, C.O.; Boswell, F.C. A Semiautomated Procedure for Total Nitrogen in Plant and Soil Samples. Soil Sci. Soc. Am. J. 1976, 40, 887–889. [Google Scholar] [CrossRef]
  24. Lu, R.K. Analytical Methods of Soil Agricultural Chemistry; China Agricultural Science and Technology Press: Beijing, China, 2000. (in Chinese) [Google Scholar]
  25. Pansu, M.; Gautheyrou, J. Handbook of Soil Analysis: Mineralogical, Organic and Inorganic Methods; Springer: New York, NY, USA, 2003. [Google Scholar]
  26. Page, A.L.; Miller, R.H.; Dennis, R.K. Methods of Soil Analysis: Part 2. Chemical and Microbiological Properties, 2nd ed.; ASA, SSSA Publishing: Madison, WI, USA, 1982; Volume 9, p. 1159. [Google Scholar]
  27. Jones, D.; Willett, V. Experimental evaluation of methods to quantify dissolved organic nitrogen (DON) and dissolved organic carbon (DOC) in soil. Soil Biol. Biochem. 2006, 38, 991–999. [Google Scholar] [CrossRef]
  28. Frostegard, A.; Baath, E. The use of phospholipid fatty acid analysis to estimate bacterial and fungal biomass in soil. Biol. Fert. Soils 1996, 22, 59–65. [Google Scholar] [CrossRef]
  29. Olsson, P.A.; Bååth, E.; Jakobsen, I.; Söderström, B. The use of phospholipid and neutral lipid fatty acids to estimate biomass of arbuscular mycorrhizal fungi in soil. Mycol. Res. 1995, 99, 623–629. [Google Scholar] [CrossRef]
  30. Zelles, L. Phospholipid fatty acid profiles in selected members of soil microbial communities. Chemosphere 1997, 35, 275–294. [Google Scholar] [CrossRef]
  31. Thomidis, T.; Zioziou, E.; Koundouras, S.; Karagiannidis, C.; Navrozidis, I.; Nikolaou, N. Effects of nitrogen and irrigation on the quality of grapes and the susceptibility to Botrytis bunch rot. Sci. Hortic. 2016, 212, 60–68. [Google Scholar] [CrossRef]
  32. Ozdemir, G.; Kitir, N.; Turan, M.; Ozlu, E. Impacts of organic and organo-mineral fertilizers on total phenolic, flavonoid, anthocyanin and antiradical activity of okuzgozu (Vitis vinifera L.) grapes. Acta Sci. Pol. Hortorum Cultus 2018, 17, 91–100. [Google Scholar] [CrossRef]
  33. Struijk, M.; Whitmore, A.P.; Mortimer, S.R.; Sizmur, T. Obtaining more benefits from crop residues as soil amendments by application as chemically heterogeneous mixtures. Soil 2020, 6, 467–481. [Google Scholar] [CrossRef]
  34. Kuzyakov, Y.; Blagodatskaya, E. Microbial hotspots and hot moments in soil: Concept & review. Soil Biol. Biochem. 2015, 83, 184–199. [Google Scholar] [CrossRef]
  35. Kang, B.G.; Kim, W.T.; Yun, H.S.; Chang, S.C. Use of plant growth-promoting rhizobacteria to control stress responses of plant roots. Plant Biotechnol. Rep. 2010, 4, 179–183. [Google Scholar] [CrossRef]
  36. Zhou, Z.; Wang, C.; Zheng, M.; Jiang, L.; Luo, Y. Patterns and mechanisms of responses by soil microbial communities to nitrogen addition. Soil Biol. Biochem. 2017, 115, 433–441. [Google Scholar] [CrossRef]
  37. Zechmeister-Boltenstern, S.; Keiblinger, K.M.; Mooshammer, M.; Penuelas, J.; Richter, A.; Sardans, J.; Wanek, W. The application of ecological stoichiometry to plant–microbial–soil organic matter transformations. Ecol. Monogr. 2015, 85, 133–155. [Google Scholar] [CrossRef] [Green Version]
  38. Jiang, G.; Xu, M.; He, X.; Zhang, W.; Huang, S.; Yang, X.; Liu, H.; Peng, C.; Shirato, Y.; Iizumi, T.; et al. Soil organic carbon sequestration in upland soils of northern China under variable fertilizer management and climate change scenarios. Glob. Biogeochem. Cycles 2014, 28, 319–333. [Google Scholar] [CrossRef]
  39. Peng, S.; He, Y.; Yang, S.; Xu, J. Effect of controlled irrigation and drainage on nitrogen leaching losses from paddy fields. Paddy Water Environ. 2014, 13, 303–312. [Google Scholar] [CrossRef]
  40. Yong-Zhong, S.; Xue-Fen, W.; Rong, Y.; Xiao, Y.; Wen-Jie, L. Soil Fertility, Salinity and Nematode Diversity Influenced by Tamarix ramosissima in Different Habitats in an Arid Desert Oasis. Environ. Manag. 2012, 50, 226–236. [Google Scholar] [CrossRef]
  41. Widdig, M.; Heintz-Buschart, A.; Schleuss, P.-M.; Guhr, A.; Borer, E.T.; Seabloom, E.W.; Spohn, M. Effects of nitrogen and phosphorus addition on microbial community composition and element cycling in a grassland soil. Soil Biol. Biochem. 2020, 151, 108041. [Google Scholar] [CrossRef]
  42. Shen, F.; Wu, J.; Fan, H.; Liu, W.; Guo, X.; Duan, H.; Hu, L.; Lei, X.; Wei, X. Soil N/P and C/P ratio regulate the responses of soil microbial community composition and enzyme activities in a long-term nitrogen loaded Chinese fir forest. Plant Soil 2018, 436, 91–107. [Google Scholar] [CrossRef]
  43. Spohn, M.; Klaus, K.; Wanek, W.; Richter, A. Microbial carbon use efficiency and biomass turnover times depending on soil depth—Implications for carbon cycling. Soil Biol. Biochem. 2016, 96, 74–81. [Google Scholar] [CrossRef]
  44. Gautam, A.; Sekaran, U.; Guzman, J.; Kovács, P.; Hernandez, J.L.G.; Kumar, S. Responses of soil microbial community structure and enzymatic activities to long-term application of mineral fertilizer and beef manure. Environ. Sustain. Indic. 2020, 8, 100073. [Google Scholar] [CrossRef]
Figure 1. Grape yields (a), soluble solids (b), reducing sugars (c), titratable acidity (d), tannins (e), and total phenols (f) under the various fertilization treatments based on four fertilization experiments. Notes: See Table 1 for the abbreviations of the fertilization treatments; bars represent standard deviations; and different letters indicate significant differences (p < 0.05) among the various fertilization treatments.
Sustainability 14 10857 g001
Figure 2. Relationship between the grape yield and grape quality in terms of soluble solids (a), reducing sugars (b), titratable acidity (c), tannins (d), and total phenols (e).
Sustainability 14 10857 g002
Figure 3. Redundancy analysis (RDA) for the multivariate effects of fertilization, soil nutrients, and the soil microbial community on the grape yield and quality. The soil nutrients included soil organic carbon (SOC), soil available nitrogen (AN), and dissolved organic nitrogen (DON); the soil microbial community included phospholipid fatty acids (PLFAs), the ratio of fungi to bacteria (F:B), and the ratio of Gram–positive to Gram–negative bacteria (G−:G+); the grape quality included soluble solids (SS), reducing sugars (RS), titratable acidity (TA), tannins, and phenols.
Sustainability 14 10857 g003
Figure 4. Latent variables with their indicators that were considered in the path analysis. The numbers in parentheses show the loading scores. (a) The soil nutrients included soil organic carbon (SOC), soil available nitrogen (AN), and dissolved organic nitrogen (DON); (b) the soil microbial community (MC) included the phospholipid fatty acids (PLFAs), ratio of fungi to bacteria (F:B), and ratio of Gram–positive to Gram–negative bacteria (GP:GN); (c) grape quality 1 included soluble solids (SS) and reducing sugars (RS); (d) and grape quality 2 included titratable acidity (TA), tannins, and phenols. The data of DON were logarithmically converted.
Sustainability 14 10857 g004
Figure 5. Path analysis results regarding the direct and indirect effects of fertilization, soil nutrients, and the soil microbial community (MC) on the grape yield and quality (chi/df = 1.3, p = 0.43). The numbers show the path coefficients. The gray path and number indicate that the effect is statistically significant, and the dashed paths and associated numbers indicate that the effect is negative. See Figure 4 for the indicators of the four latent variables (nutrients, microbial community, quality 1, and quality 2).
Sustainability 14 10857 g005
Figure 6. Standardized total effects of fertilization, soil nutrients, and the microbial community on the grape yield and quality. See Figure 4 for the indicators of the four latent variables (nutrients, microbial community, quality 1, and quality 2).
Sustainability 14 10857 g006
Table 1. Description of the site information and the annual rates (kg ha−1) of synthetic nitrogen (Sy-N) with phosphorus (Sy-P) fertilizer additions and organic nitrogen (Or-N) with phosphorus (Or-P) fertilizer applied under the various fertilization treatments. Notes: CK0, no fertilizer and crops; NP, synthetic nitrogen and phosphorus; M, manure; NPM1, 0.25 times NP and 0.33 times M; NPM2, NP and 0.5 times manure; Sy-N was added as urea and diammonium phosphate, and Sy-P was added as diammonium phosphate.
TreatmentReclaimed YearSynthetic Fertilizer
(kg ha−1 Year−1)
Sheep Manure
(kg ha−1 Year−1)
Total Nutrients
(kg ha−1 Year−1)
Sy-NSy-PManureOr-NOr-PNP
CK000000000
NP25540300000540300
NPM1201357512,00024060375135
M160036,000624180624180
NPM21554030015,00030272842372
Table 2. Concentrations (CK0) and annual relative change rates (%; NP, NPM1, NPM2, and M) in soil nutrients for the topsoil (0–20 cm) and subsoil (20–40 cm) under the various fertilization treatments. Notes: See Table 1 for the abbreviations of the fertilization treatments; SOC, soil organic carbon (g kg1); TN, total nitrogen (g kg1); AN, available nitrogen (mg kg1); AP, available phosphorus (mg kg1); AK, available potassium (mg kg1); DOC, dissolved organic carbon (mg kg1); and DON, dissolved organic nitrogen (mg kg1); different letters in the same soil depth indicate significant differences (p < 0.05) among the various fertilization treatments.
Soil Depth (cm)TreatmentSOCTNANAPAKDOCDON
0–20CK04.340.36611544820736
NP9.50 b20.05 b6.06 a12.11 a−1.89 a12.31 c6.75 b
NPM14.36 c14.21 c1.03 b10.66 a−3.24 a−0.82 d−1.73 c
NPM211.21 b31.01 a4.64 a11.14 a−3.59 a16.02 b11.40 a
M18.05 a31.48 a3.91 a7.06 a−3.33 a19.06 a12.03 a
20–40CK04.110.36592336621735
NP3.64 b5.25 b2.64 a4.85 a−1.15 a−0.34 c−0.14 c
NPM10.68 c0.73 c0.58 b4.86 a−2.50 b−2.12 d−1.94 d
NPM25.39 a12.04 a3.06 a2.25 b−3.79 c2.86 b2.29 b
M8.60 a11.01 a3.55 a0.45 c−3.03 bc6.97 a4.29 a
Table 3. Contents (CK0) and annual relative change rates (%; NP, NPM1, NPM2, and M) of soil microorganisms in the topsoil (0–20 cm) and subsoil (20–40 cm) under the various fertilization treatments. Notes: see Table 1 for the abbreviations of the fertilization treatments; the soil microbial parameters include microbial biomass carbon (MBC, mg kg−1), microbial biomass nitrogen (MBN, mg kg−1), fungi (F, nmol g−1), bacteria (B, nmol g−1), ratio of F/B, arbuscular mycorrhizal fungi (AMF, nmol g−1), actinomycetes (ACT, nmol g−1), Gram–positive bacteria (G+, nmol g−1), Gram–negative bacteria (G−, nmol g−1), ratio of G−/G+, and total phospholipid fatty acids (PLFAs, nmol g−1), respectively; different letters in the same soil depth indicate significant differences (p < 0.05) among the various fertilization treatments.
Soil Depth (cm)TreatmentMBC
(mg kg−1)
MBN
(mg kg−1)
F
(nmol g−1)
B
(nmol g−1)
F/BAMF
(nmol g−1)
ACT
(nmol g−1)
G+
(nmol g−1)
G−
(nmol g−1)
G−/G+PLFAs
(nmol g−1)
0–20CK02973813870.155.912535330.93160
NP3.42 b3.13 b0.90 a0.44 a0.44 b1.04 a0.07 b0.06 b0.51 a0.46 a0.86 bc
NPM10.31 c0.27 c0.85 a0.57 a0.25 c0.56 bc0.16 a0.58 a0.75 a0.07 c1.05 b
NPM29.70 a9.10 a1.05 a0.30 a0.71 a0.81 b0.04 b0.14 b0.68 a0.53 a1.34 a
M8.97 a8.45 a0.38 b−0.25 b0.64 a0.32 c−0.83 d−0.33 c−0.15 b0.18 b0.49 c
20–40CK02563410600.185.162027260.97137
NP0.29 b0.17 b1.23 ab2.07 a−0.47 b1.22 a0.68 a1.01 a1.09 ab0.05 b1.12 a
NPM1−2.46 b−2.63 b2.01 a2.08 a−0.20 a1.36 a0.63 a1.33 a1.73 a0.20 a1.50 a
NPM20.20 b−0.01 b0.78 b2.13 a−0.37 ab0.03 b−0.17 ab0.82 a0.62 b−0.15 c1.17 a
M6.19 a5.41 a−0.31 c0.54 b−0.29 a−0.86 c−0.97 b−0.43 b−0.62 c−0.04 b−0.08 b
Publisher’s Note: MDPI stays neutral with regard to jurisdictional claims in published maps and institutional affiliations.

