Article

The Environment in the Lead: A Scorecard System to Assess Adaptation Measures and Score Ecosystem Services at the Street Level

1
Faculty of Water Management, Rotterdam University of Applied Sciences, G.J. de Jonghweg 4–6, 3015 GG Rotterdam, The Netherlands
2
Centre of Expertise Social Innovation (EMI) Rotterdam, Rotterdam University of Applied Sciences, Hillevliet 90, 3074 KD Rotterdam, The Netherlands
3
RDM Centre of Expertise, Rotterdam University of Applied Sciences, Heijplaatstraat 23, 3089 JB Rotterdam, The Netherlands
4
NoorderRuimte, Centre of Applied Research and Innovation on Area Development, Hanze University of Applied Sciences, Zernikeplein 7, 9701 DA Groningen, The Netherlands
5
Global Center on Adaptation, Energy Academy Europe, Nijenborgh 6, 9747 AG Groningen, The Netherlands
*
Author to whom correspondence should be addressed.
Sustainability 2022, 14(19), 12425; https://doi.org/10.3390/su141912425
Submission received: 30 August 2022 / Revised: 20 September 2022 / Accepted: 20 September 2022 / Published: 29 September 2022
(This article belongs to the Special Issue Sustainable Cities and Regions – Statistical Approaches)

Abstract

:
Currently, there is no method available that can systematically score the available ecosystem services in streets or street segments in suburban districts. In this study, different climate adaptation measures and their ecosystem services were categorized into green, blue, and grey categories and weight was given to each category based on their impact on the microclimate. This study took place in the Hillesluis district in the city of Rotterdam and the Paddepoel district in the city of Groningen. In Rotterdam, 21 streets, composed of 42 street segments, were assessed. In Groningen, 17 streets, composed of 45 street segments, were assessed. The available ecosystem services of each street segment were scored from 0–100. The scorecard method that was developed and tested during this study provided insight in the variation of available ecosystem services of streets and street segments. Individual street scores were very low in the city of Rotterdam and ranged between 3 and 50, with the average score for the street segments of 29. In Groningen, the scores were considerably higher with a range between 23 and 70, with an average score of 47 per street segment. The presence of larger green trees, front yards, and façade gardens in the green category are the most distinctive variable, while adaptation measures in the blue category were absent in both cities. The scorecard proved to be very useful in the adaptation labeling of street segments and entire streets. After assessing a neighborhood, the least adaptive streets can be identified relatively easy. Based on the score a label can be given between A+++ and G. The scorecard informs residents and decision makers about which streets are most adaptive and which streets have an adaptation potential. The method can easily be duplicated and used by local governments and community groups to have better insight in the level of climate adaptation of their street. Labels for entire streets can be used to create awareness and encourage residents to take action and expand the number of climate adaptation measures in their street.

1. Introduction

Human-induced climate change is causing dangerous and widespread disruption in nature and is affecting the lives of billions of people around the world, despite efforts to reduce the risks. The people and ecosystems least able to cope are being hardest hit, according to scientists in the latest Intergovernmental Panel on Climate Change report [1]. For cities, some aspects of climate change may be amplified, including heat, flooding from heavy precipitation events, and sea level rise in coastal cities [2]. The world has recorded the hottest decade on record (2010–2020) with 2019 being the second warmest year on record [3]. Implementing nature-based solutions on a larger scale would increase climate resilience and contribute to multiple Green Deal objectives. Blue green (as opposed to grey) infrastructures are “no regret” solutions and provide environmental, social, and economic benefits and help build climate resilience [4]. According to the European Environment Agency, cities have the potential to become a major driving force for a green and just recovery after the COVID-19 pandemic [5]. The challenge is now how to integrate these measures in our cities and to assume directive roles in their implementation [6].
In 2018, an estimated 55.3% of the world’s population lived in urban settlements. By 2030, urban areas are projected to house 60% of people globally [7]. All these people will be directly affected by the impacts of climate change. One of the solutions that has been suggested to make cities more resilient is the urban green infrastructure (UGI) [8]. Urban green and blue spaces and green infrastructure are very effective to combat the effects of climate change and to tackle water and heat risks. A common method to evaluate such contributions is to measure the ecosystem services (ES) provided by the vegetation or water bodies present in urban green and blue spaces (UGBS) that constitute the UGI [9]. Examples of urban ecosystem services are air purification, carbon storage, noise reduction, run-off retention, cooling, and recreation [10].
Urban communities are the most affected by changes in the microclimate as a result of climate change. There are examples resilience scorecards that help communities to become resilient [11], or scorecards that aim to assess disaster resilience on the city scale, such as the he United Nations Office for Disaster Risk Reduction (UNDRR) Scorecard [12], or scorecards with sets of indicators that assist communities to perform a self-evaluation, such as the Resilience Performance Scorecard [13]. Labdaoui et al. developed the Street Walkability and Thermal Comfort index (SWTCI) [14], which includes shade.
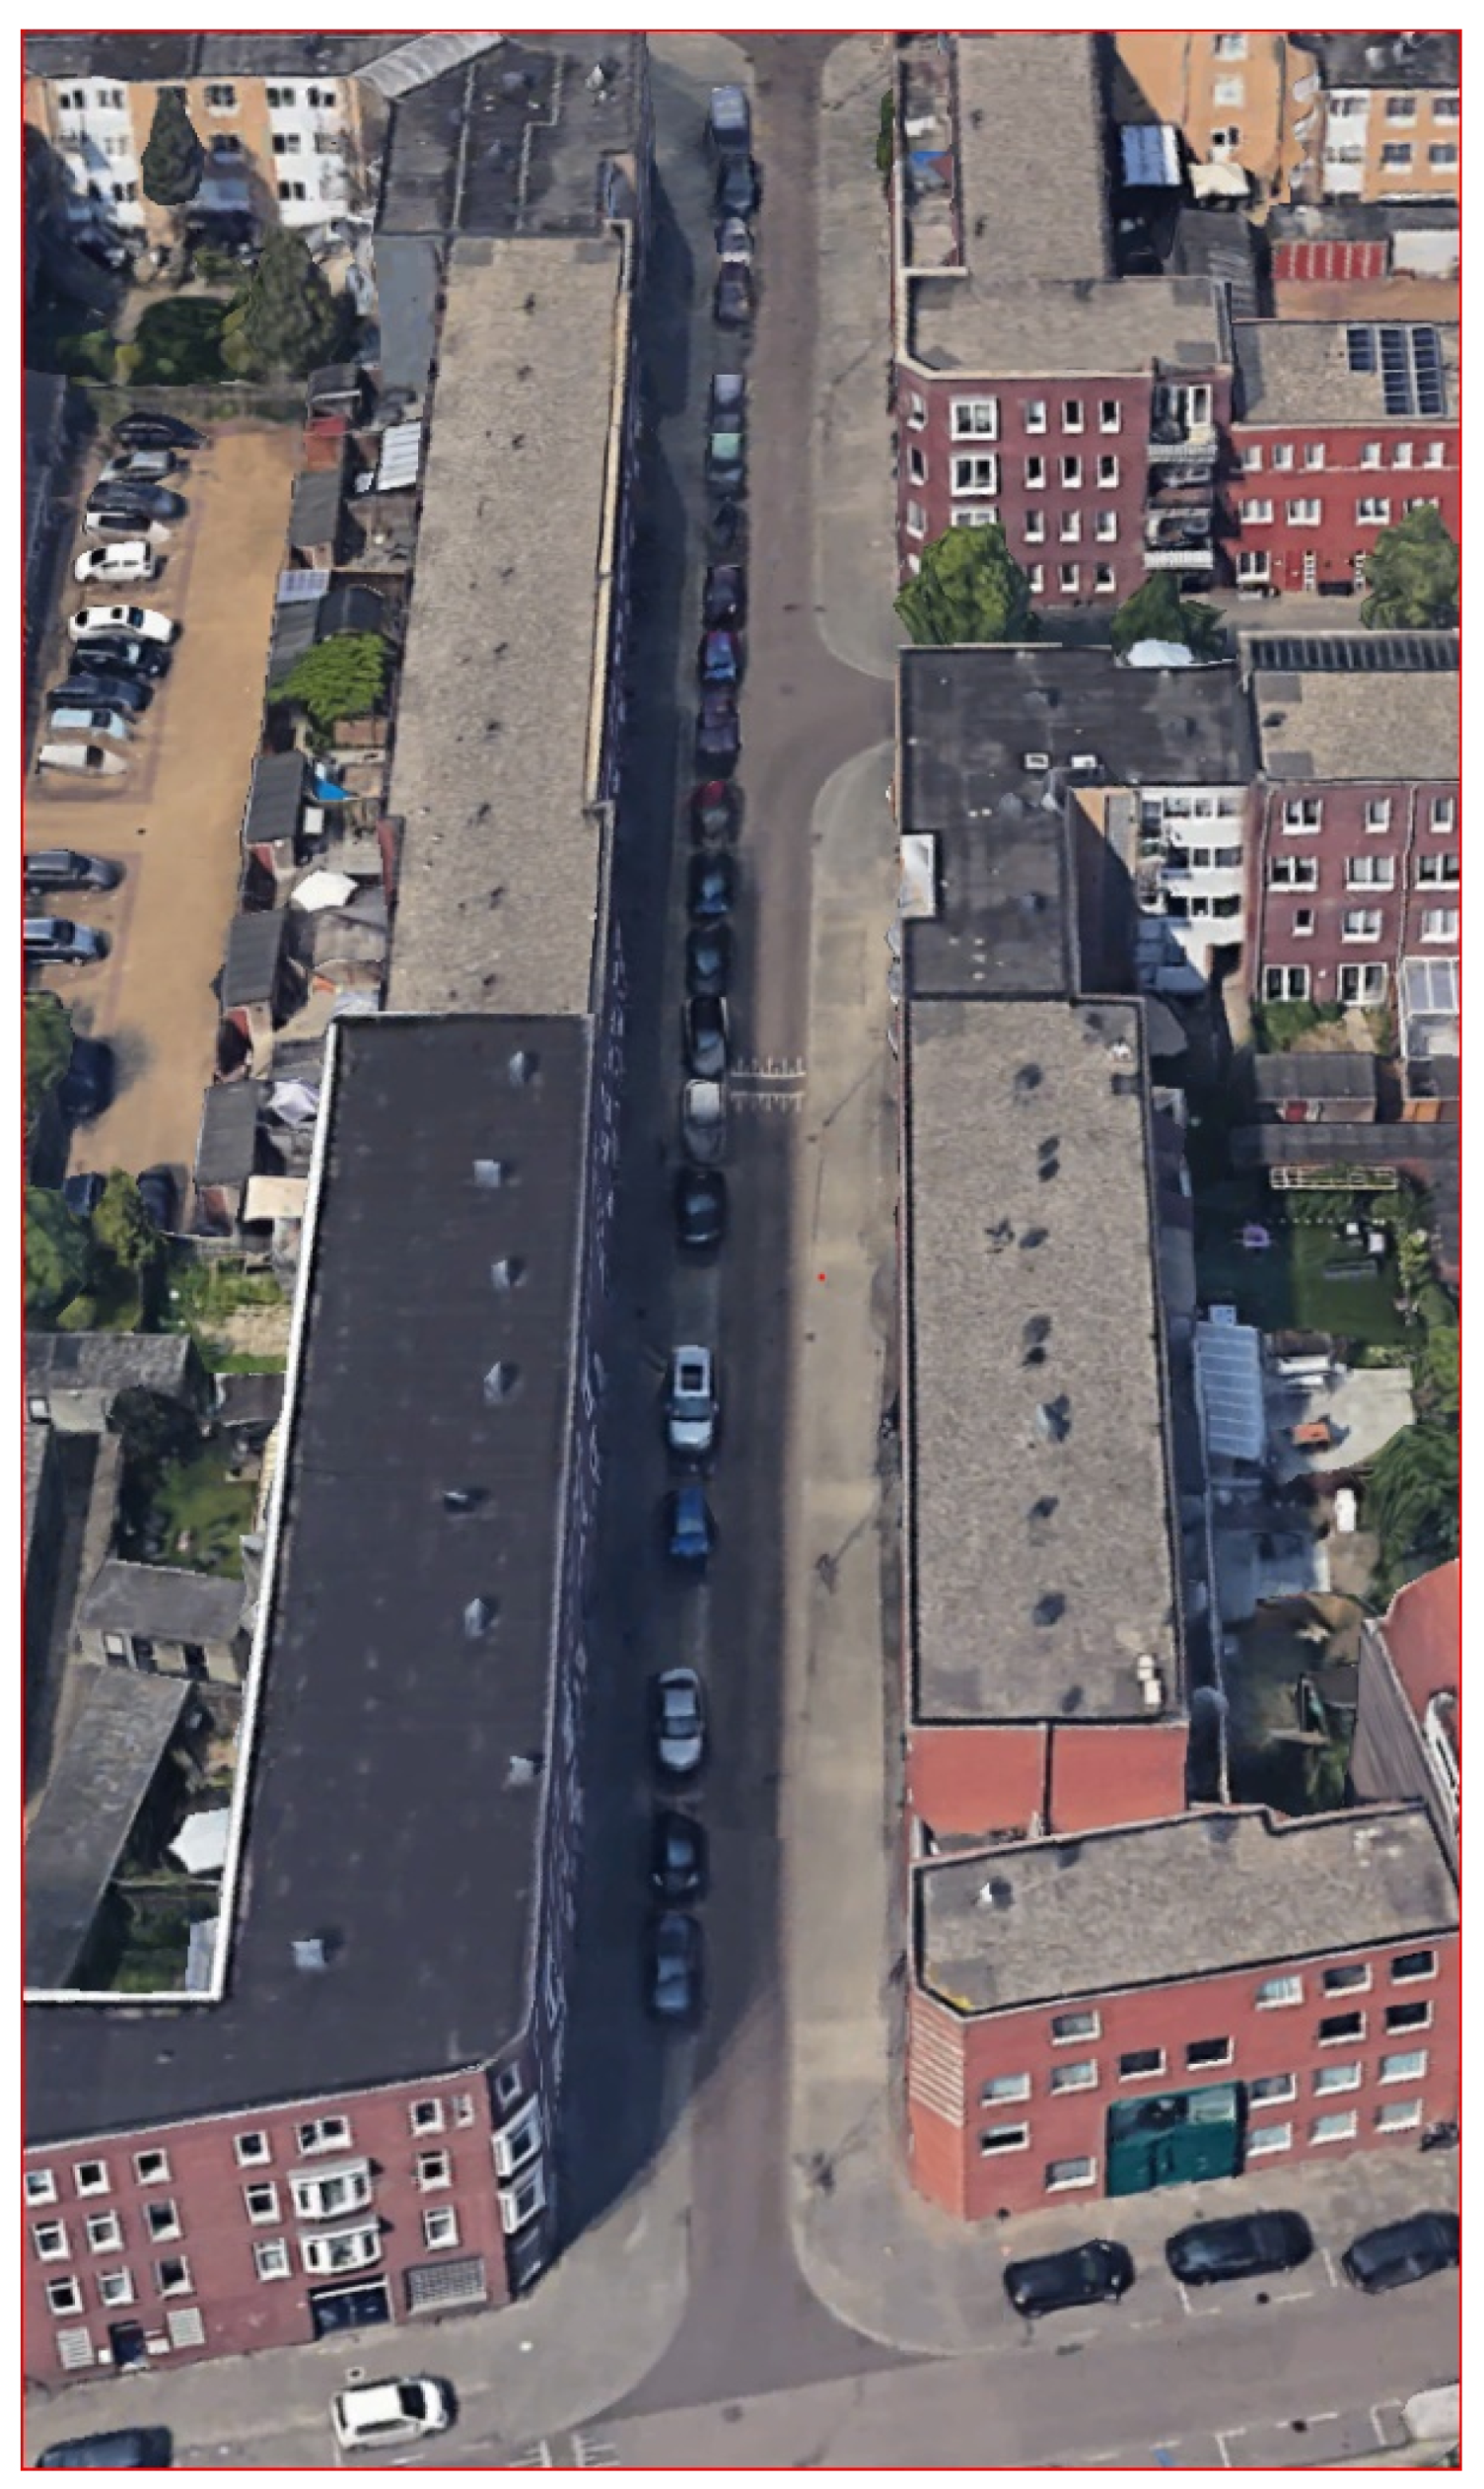
Most cities do know, on a city scale, which neighborhoods have less trees, are densely populated, have less parks, and are less green, or in which neighborhoods lush front yards and an abundance of urban green spots are present. At the level of the street, cities in general do not have much insight regarding which climate adaptation measures are present. In a changing climate that more often causes heat waves, for example, it would be crucial to know in which street the climate adaptation measures are present and are more or less ready for the impacts of climate change, and which streets are not. In the streets that do not have climate adaptive measures, local government should invest in the implementation of climate adaptation measures.
An instrument such as a scorecard that assesses the climate adaptive measures at the street level and attaches climate adaptation labels to street segments and streets, is accurate and is easy to use by residents and communities to self-assess streets and neighborhoods, would be very valuable to identify the least adaptive streets and raise awareness about climate adaptation among the members of the community. In the literature, no such scorecard or instrument was found that systematically assess the presence of climate adaptation measures at street segments or entire streets. This paper therefore proposes a new method to assess climate adaptation measures at the street level, which has been proven to be very successful in scoring measures and labeling streets after testing in two districts in two different Dutch cities. With this method, we hope to equip communities and local government units with a new method to assess climate adapttationmeasures in their locality.

2. Methods

To be able to compare streets in different districts, street segments were chosen as units of comparison. Streets are composed of one or more street segments and street segments are used in the virtual street audit of front yards [15] or in streetscapes studies [8,16], or in studies related to crime behavior [17] or walking speed [18]. A street segment is typically defined as the portion of a public or private street, between its intersections with two other public or private streets [19] (see Figure 1).
For this study, two different urban districts in the cities of Groningen and Rotterdam were selected by the civil servants of the two cities that were involved in the project “Citizen participation in climate adaptation”. The two districts were selected based on the fact that the districts are considered as particularly vulnerable to climate change [19]. In order to make the assessment comparable, observations of specific street features and measures both in the street and the housing units at both sides of the street were included in the assessment, and observations were converted into a 100 m street length value. Google street view was used in the field to measure the length of the street segment, then a conversion factor was determined for each street, e.g., divide by 1.2 for a street length of 120 m, and the values were converted into a score for a length of 100 m of street length. In order to be able to score the microclimate adaptation facilities or measures at street level, a literature review was undertaken and a selection of scoreable adaptation facilities or measures was identified. These were divided into three main categories—the green, blue, and grey categories. Each category is a combination of a number of scorable measures at street level. Field visits were undertaken to the two cities for ocular inspection and assessment of the selected streets. In order to make the results of the assessments and the ocular inspection unambiguous, a reference card was made for easy reference. The QR code on the reference card can be opened with a mobile phone and opens an excel file, where the observations can be directly tabulated in excel.

2.1. Scoring and Labelling

The scorable adaptation measures at the street level were calculated per street segment. In total, a street segment could be awarded a score of 100 points (Figure 2). The scores of 1–100 for each street segment were divided into 10 climate adaptation labels with different colors. The presence of many adaptation measures translated into a high score and corresponded with a dark green color. Street segments with few or no adaptation measures translated into a low score and the corresponding color was dark red. A deduction of score points was applied in the grey category. The scoring was composed of three categories, and each category contained one or more measures. For each category, weight was given. The highest weight was given to measures that were most common with the highest chance to be present in a street, and at the same time provided a combination of ecosystem services. Large urban trees and (green) front yards were the most common and provide shade, coolness, and increase infiltration capacity, among other ecosystem services. After testing different measures with different weights totaling 100 points, it was decided to do a full test in two districts with the measures and weights presented in Table 1, divided over three categories.
As awareness among community members was an important objective of the scorecard, reference cards were designed that showed examples of the measure, complementary to the excel file, and supported the researcher in the field while doing the assessment in the field. The front and the back of the reference card are presented in Figure 3 and Figure 4.

2.2. Green Category Climate Adaptation Facilities and Measures

The green measures are the combined value of the following adaptation facilities or measures, namely trees, green walls, façade gardens, green strips, climate-adaptive roofs, and green parking spaces.

2.2.1. Urban Trees

Urban trees represent a large portion of the urban tree canopy and provide a significant amount of ecosystem services for mitigation of the negative environmental impact [20]. The World Health Organization has described in detail the beneficial aspect of urban green spaces [21], such as reduced exposure to air pollution and a reduction of the heat island effect. Trees planted along streets and roads may dampen noise and air pollution levels in residential houses and mitigate the adverse health effects of proximity to busy roads. Wang showed that [22] in the urban green infrastructure, the outdoor human thermal comfort and indoor environment improves [23].
The trees category is divided into three subcategories, namely 0–10 m, 10–15 m, and above 15 m, so as to make the indicator trees scorable. The average floor height in the Netherlands is between 2.4–2.6 according to article 4.28 of the National Building Code [24]. Including the floor material itself, average floor is about 3 m high. A tree with a height that is just slightly higher than the height of a typical Dutch single-family dwelling, up to 10 m in height, will be tagged as a category 1 tree, with a value of 2. A tree between 10–15 m in height will be tagged as a category 2 tree, with a value of 3, and very tall and older trees that are above 15 m in height will be tagged as a category 3 tree, with a value of 4. The categorization of trees into different categories of 0–10 m, 10–15 m, and above 15 m was chosen so that the three categories could easily be assessed through ocular observation. This categorization was not presented in other studies, but proved to be very efficient for easy analysis. The number of trees on both sides of the street segment was counted, categorized, and tabulated. The maximum score for the urban trees measure was set at 40.

2.2.2. Green Walls

Wall shrubs and climbing plants provide significant thermoregulation around brick walls and appear to be a feasible green wall system for retrofitting existing housing stock in temperate climates [25]. Green wall installation can simultaneously provide multiple benefits such as noise reduction, contribute to urban ecosystems, pollutant removal, and cooling. The green wall had potential to mitigate daytime air temperature in the cooler seasons in all of the investigated climate zones, except in Csb, where a slight increase was found. Such a decrease could be as high as ~5 °C and it might be decisive for mitigating UHI in some cities [26]. Because of the thermal resistance effect of green walls, the temperature reduction at the pedestrian level of the canyon center was 1.16 °C in the flat street canyon, such as residential areas, in a situation where streets are composed of mainly green walls [27]. Streets that do not have green walls represent a value of 0. Streets that are composed of 1–25% green roofs represent a value of 2, 25–50% a value of 2, 51–75% a value of 3, and 76–100% a value of 4.

2.2.3. Façade Gardens/Front Yards

Paving over of front yards (soil sealing) reduces the environmental and social benefits of front yards and trees. Front yards in private residence play an important role in the soil sealing problem of cities worldwide [15]. The impervious cover of front yards contributes to the problems of the urban heat island effect and urban floods, and makes urban neighborhoods less pleasant. Private gardens play an important role as urban green space and can improve microclimate and address the impacts of climate change—specifically the urban heat island (UHI) effect. Paving over front yards, thus soil sealing, reduces the environmental benefit of front yards. Residential (front) yards comprise a considerable portion of land and green space in the suburbs of cities. A recent study in Rotterdam shows that in an older district, most front yards are soil sealed [18]. The European commission formulated a green infrastructure (GI) strategy to enhance Europe’s natural capital [28]. Ecosystem-based approaches are strategies and measures that harness the adaptive forces of nature [29]. Cities are encouraging private citizens more and more to involve citizens, municipalities, and other stakeholders in replacing pavements with vegetation [30]. Cities even provide grants and subsidies to citizens for unhardening private gardens, such as in the city of Rotterdam, which has a subsidy of €10 per m2 for realized green space, to €500 per m3 water storage up to €1500 [31]. Unsealed urban gardens provide patches of natural surfaces that help reduce run-off, reducing the likelihood of urban flooding and replenishing groundwater by allowing rainwater to infiltrate. Small changes households make to their gardens over an extended period of time can add up to major environmental impacts. Adding more paved areas to gardens increases the risk of urban flooding: rainfall cannot seep into the ground and, instead, water runs off the paved surfaces into storm water and sewage systems [32]. It contributes to the development of “sponge cities”, where cities are designed as sponges and are designed to absorb and capture rainwater for reducing flooding worldwide [33]. Cities should also invest in nature-based solutions to tackle water and heat risks [34]. In addition to this, urban gardens as a form of urban greenspace are an important resource for the psychosocial restoration of urban dwellers [35], and private gardens are important in terms of the ecological value of cities in complementing public green areas [36]. Not all houses are constructed with (space for) front yards. In order to reduce the temperature and heat stress during a heat wave, residents in Rotterdam are encouraged by the local government to create façade gardens and green facades, which have proven to be effective tools [26]. An example of this is the thousand façade gardens initiative in Rotterdam [37]. Street segments that do not have any façade gardens or front yards are given no points. Streets that have façade gardens in 1–50% of the houses in the street segment represent 5 points, streets with façade gardens in 50–100% of the houses represent 6 points. Houses that have front yards in 1–25% of the housing units represent a value of 10 points, 25–50% represent 12 points, 50–75% represent 14 points, and 75–100% represent 16 points.

2.2.4. Green Strips

Green strips constitute similar benefits as front yards. Green strips could be larger in size than front yards. Green strips are often provided as a beautification project or as a place for dogs in densely populated urban areas. In order to provide water storage or to increase the infiltration capacity, green strips should be placed lower than street level. Street segments that have green strips of max 25 sqm represent a value of 9 points, 25–100 m represent a value of 11 points, and more than 100 sqm represent a value of 13 points.

2.2.5. Climate-Adaptive Roofs

The presence of climate-adaptive roofs can be established by using Google Maps (satellite view). Examples of climate-adaptive roofs are green roofs, roofs with a high albedo (highly reflective roofs, which absorb less heat [38], and blue roofs. Green roofs can easily be recognized on Google Maps, because from above plants/grass and other greenery can be spotted. A high albedo roof is easy to spot because it is often bright white. Houses in the street segment that do have climate-adaptive roofs in 1–50% of the houses represent 1 point, and if more than 50% of the houses in the have climate-adaptive roof, they represent a value of 2.

2.2.6. Green Parking Spaces

Green parking spaces differ from regular parking spaces because they allow the water to infiltrate, and they contribute significantly to reducing runoff [39]. If the parking lots are made of porous paving materials, between the tiles of parking spots, there are often patches of grass [40]. Houses in the street segment that do have green parking spaces in 1–50% of the houses represent 1 point, and if more than 50% of the houses have green parking spaces, they represent a value of 2.

2.3. Blue Category Climate-Adaptation Facilities and Measures

2.3.1. Rain Barrels

Rain barrels or rainwater tanks store water and relieve some stress on the sewage system during heavy precipitation. Rain barrels delay the time that it takes for water to flow into the system. Water from a roof connected to a rain barrel does not flow immediately into the sewage system, and rainwater harvesting can be used as a remedial measure and can help in flood reduction [41]. If one or more rain barrels are present in the street segment, the segment represents a value of 1.

2.3.2. Permeable Pavement

Water-permeable pavements are porous or are laid to allow voids, have an open structure, or are made of partially pervious materials. They allow water to pass through or around them into the soil. This has various advantages: rainwater can infiltrate into the ground, groundwater is replenished, and sewerage systems are relieved [40]. If there is permeable pavement in the street, on the sidewalk, or both, they represent a value of 1, 2, or 3, respectively.

2.3.3. Bioswale

A bioswale is an adaptive measure that has the ability to store water during heavy rain and it redirects surface water to groundwater. It also aids in infiltration and often looks aesthetically pleasing [40,42]. If a bioswale is located within 50 m of the street segment, it represents a value of 6.

2.3.4. Surface Water

Surface water nearby functions as natural water storage. If the surface water is located nearby and is lower than the street level, water can be channeled into the surface water with natural gravity. If the surface water is located within 50 m of the street segment, it represents a value of 6.

2.4. Grey Category Climate-Adaptation Facilities and Measures

2.4.1. Shaded Areas (Canopy)

Bonus points can be earned for shaded areas. Shade is beneficial for heat stress relief [43]. Shade may be provided through canopy, natural shadows from trees, or by artificial shadow facilities. If natural canopy is present or there is artificial shade provision, it represents a value of 1 or 2 respectively.

2.4.2. Unpaved Surfaces

If unpaved areas are present, they provide an additional storage capacity for precipitation and may provide cooling facilities through natural vegetation. If unpaved surfaces are located lower than the street level, they represent a value of 2.

2.4.3. Grey Parking Spaces

Paved surfaces, especially parking lots, occupy a significant proportion of the horizontal surface area in cities. The low albedo of many of these parking lots contributes to the urban heat island (UHI) and affects the local microclimate around them. Parking spaces heat up during the day and contribute to a higher temperature. At night, these warm surfaces contribute to the urban heat island effect [44]. If the cars are parked on the driving lane, without additional parking places, the street segments represent a value of 2. If additional designated parking places are present, the segments represent a deduction of 2 points.

2.4.4. Driving Lane

Impermeable “grey” driving lanes with a low permeability similarly to the grey parking spaces occupy a significant proportion of the horizontal surface area in cities. The low albedo of many of these driving lanes contributes to the urban heat island (UHI) and affects the local microclimate around them. Driving lanes heat up during the day and contribute to a higher temperature. At night, these warm surfaces contribute to the urban heat island effect [44]. For sustainable urban development, permeable pavement promotes urban water management [40]. If the street segment is a car free street, without soil sealed driving lanes, it represents a value of 2. For each soil sealed driving lane, one point will be deducted.

3. Results

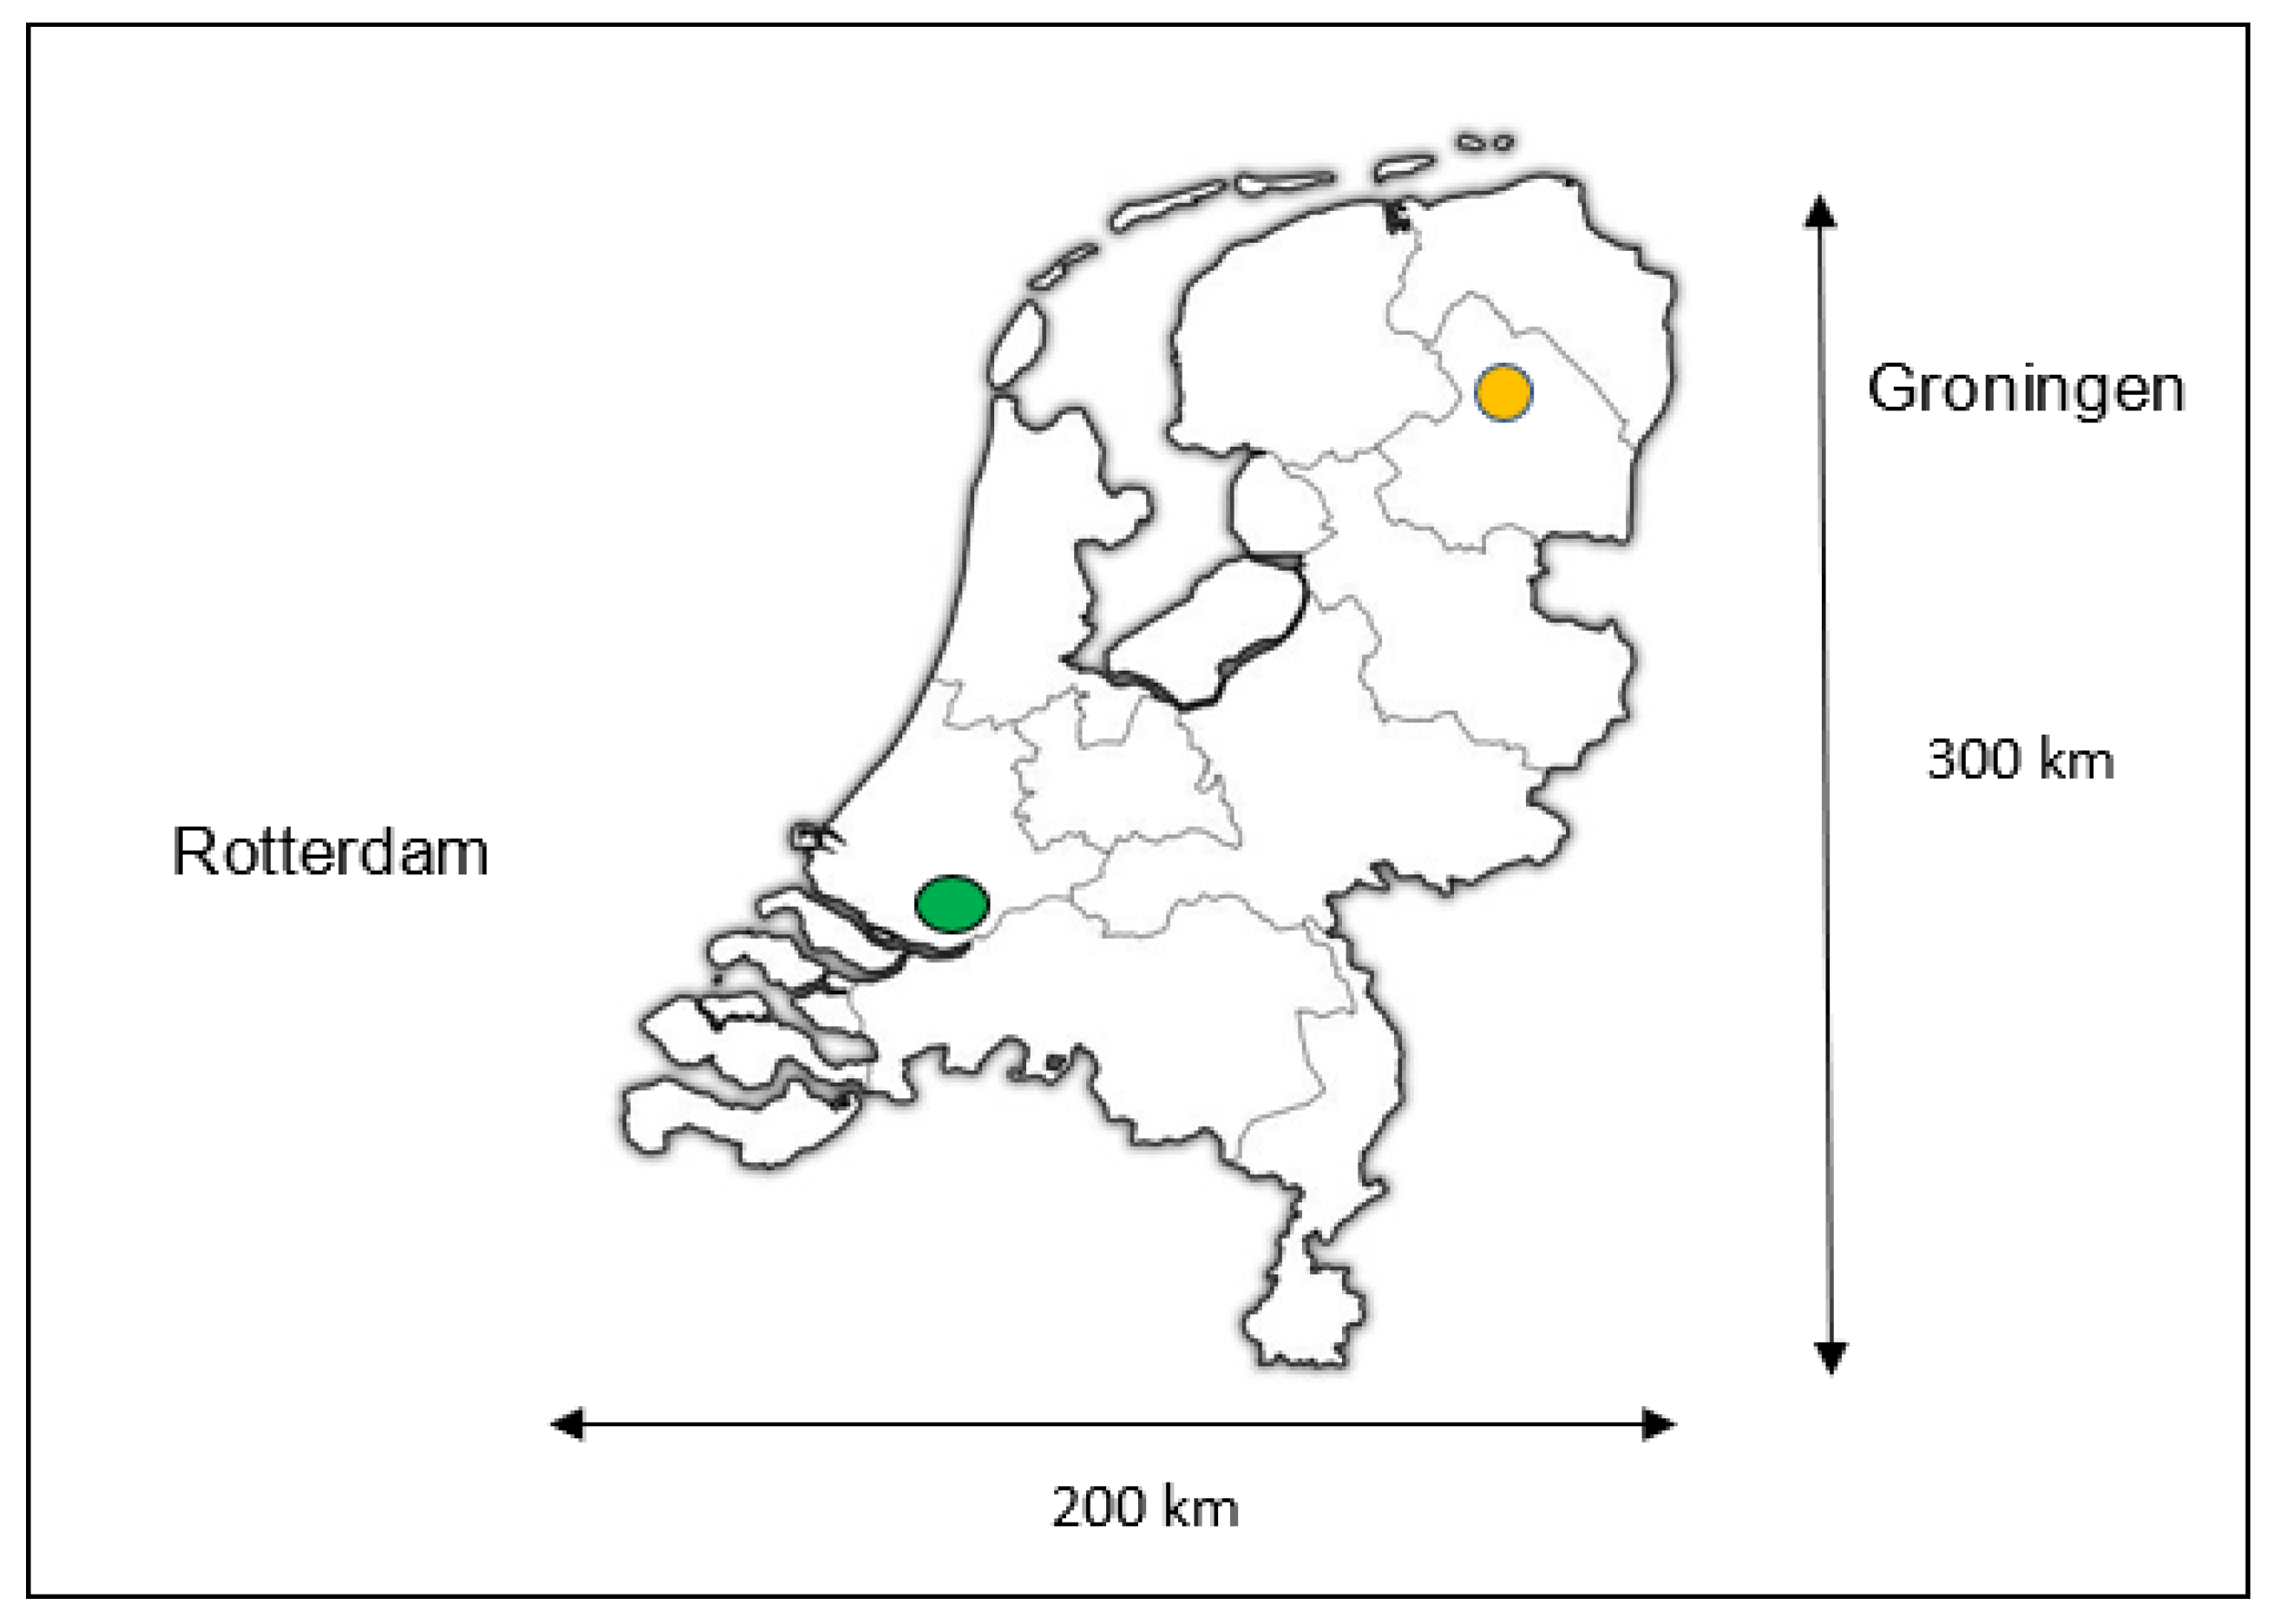
Two districts in two Dutch cities were selected as the pilot area, namely the Hillesluis district in the city of Rotterdam and the Paddepoel district in the city of Groningen (Figure 5). The cities are located at a distance of 245 km with the same level of development. The two districts were both living labs in the project Citizen Participation in climate adaptation. Both neighborhoods were selected by officers from the local government because they can both be characterized as vulnerable to the effects of climate change and are also socio-economic vulnerable areas. The Paddepoel district was also chosen by the IMPETUS project as a pilot area to conduct measurements. The two cities differ from each other in both size, location, and population characteristics. Rotterdam is an important port city and the second largest city in the Netherlands with a population of around 655,000, located in the Randstad urban area in the Western part of the country. The Hillesluis district is located at the South Bank of the river Maas, which cuts the city in half. In Hillesluis, blue-collar workers that were employed in the port, before containerization created a lot of unemployment, used to live. Since the 1970s, migration changed the population district. Today, Hillesluis has a number of socio-economic problems and city data show that the area is vulnerable to the effects of climate change because the neighborhood is densely populated and lacks green spaces. The city of Groningen is much smaller and is the seventh largest city, and is located in the Northern part of the country. The city of Groningen is the capital of the Province of Groningen, which is characterized by less densely populated neighborhoods. Both neighborhoods consist of about 50% social housing units, 25% private landlords, and 25% owner-occupied. The Paddepoel district was constructed in 1950–1980 with mostly single-family dwellings, while Hillesluis was constructed in 1920–1930, and the area is characterized by multifamily dwellings.

3.1. Rotterdam, Hillesluis District

The Hillesluis district is located on the southern part of the city of Rotterdam and has a population of around 12,050 residents with a population density of 14,433 [45] residents per square kilometer in 2020. The district is characterized by small streets and a high population density. The narrow streets are alternated by green spaces. The district was constructed between 1920 and 1930 for workers in the port of Rotterdam. Renovation projects have replaced some of the older apartment blocks with newer housing units, but around 70 % of the housing stock date back before 1945.
The districts consists mostly of multifamily dwellings and are predominantly social housing (47%) or rental units (27%), with 25% owner-occupied. The population is relatively younger and lower educated compared with other parts of the city with a lower average household income. Around 73% of the population has a non-Western background. About half of the households (47%) are single-person households [46].
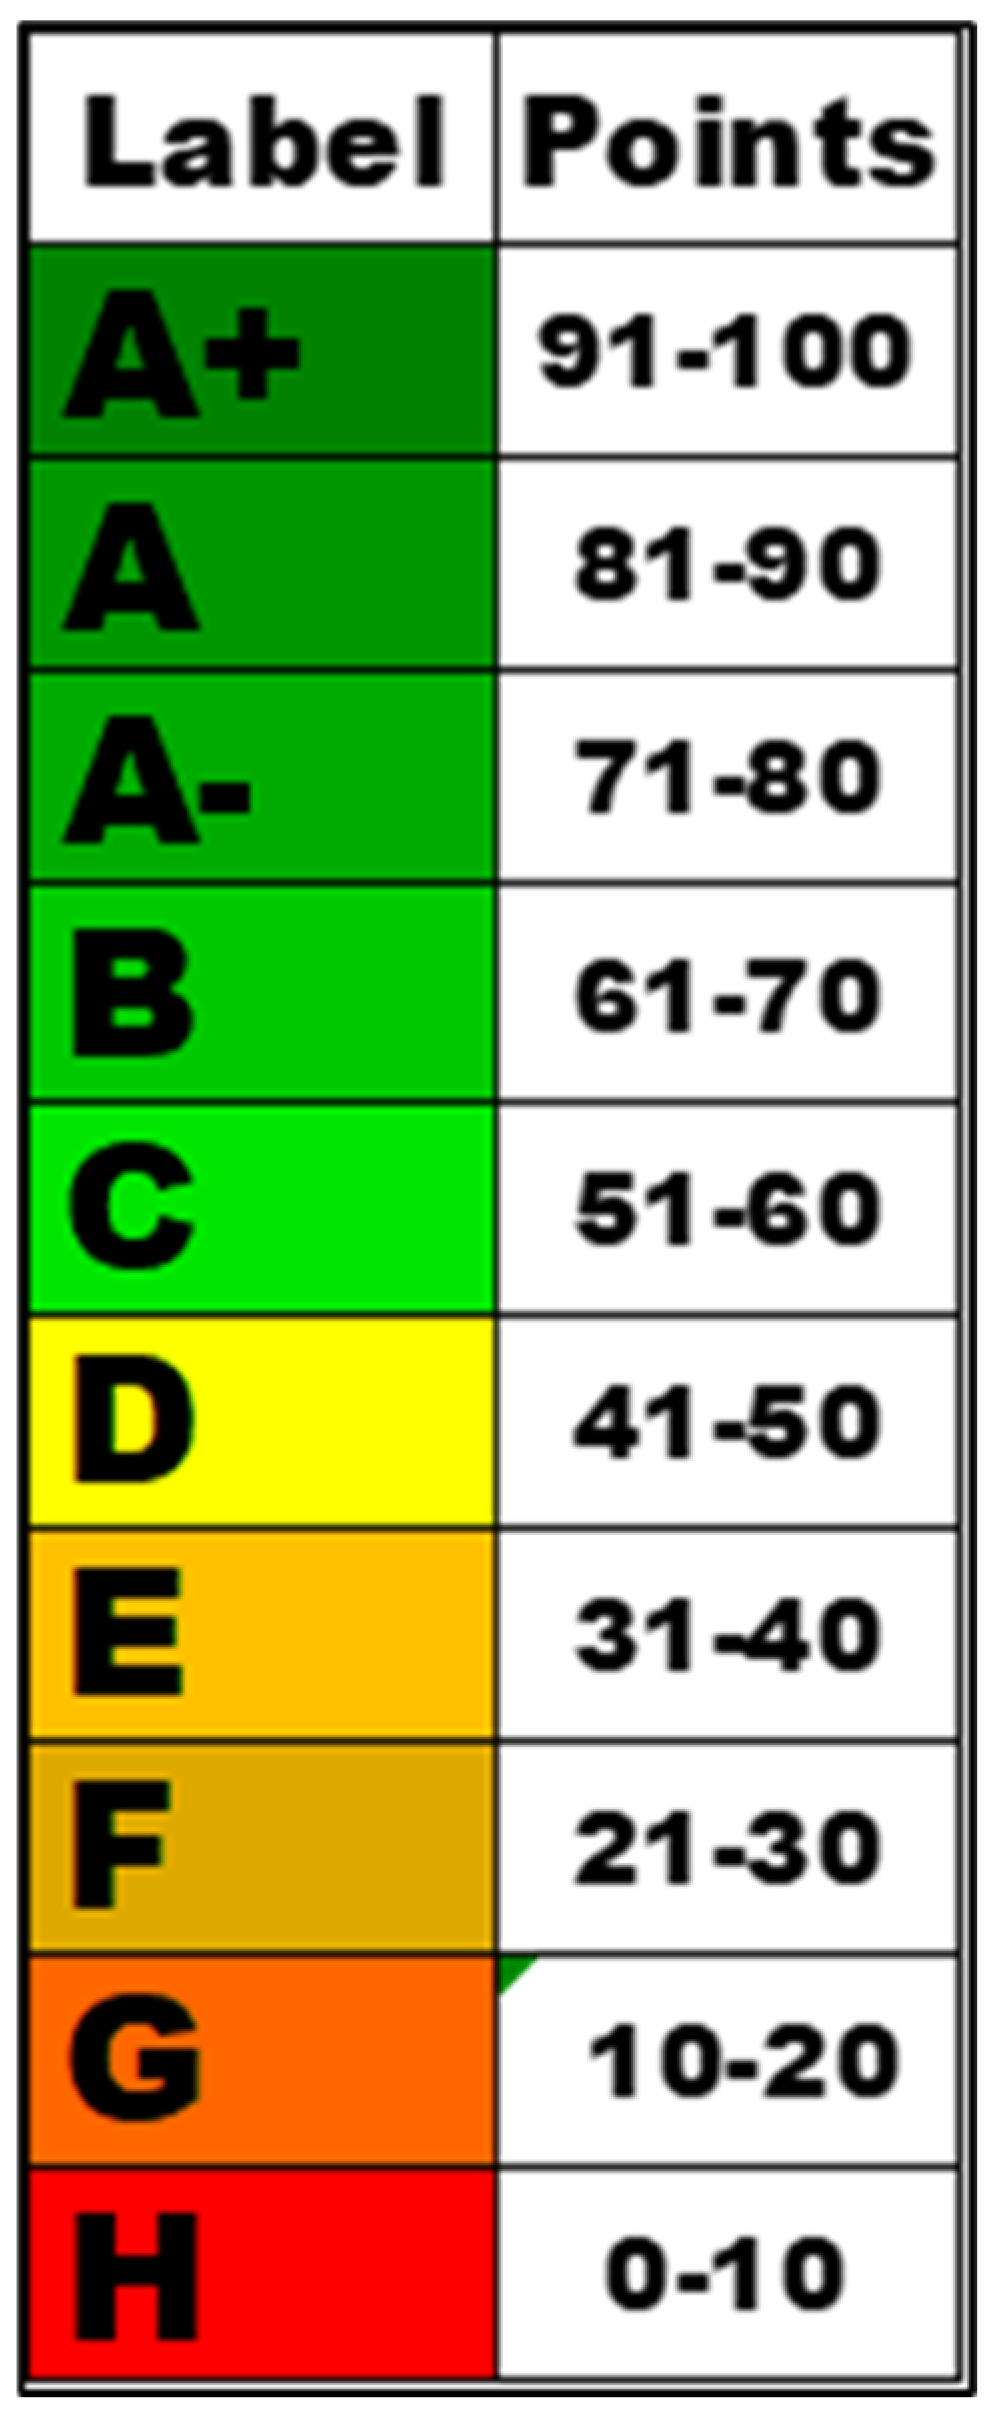
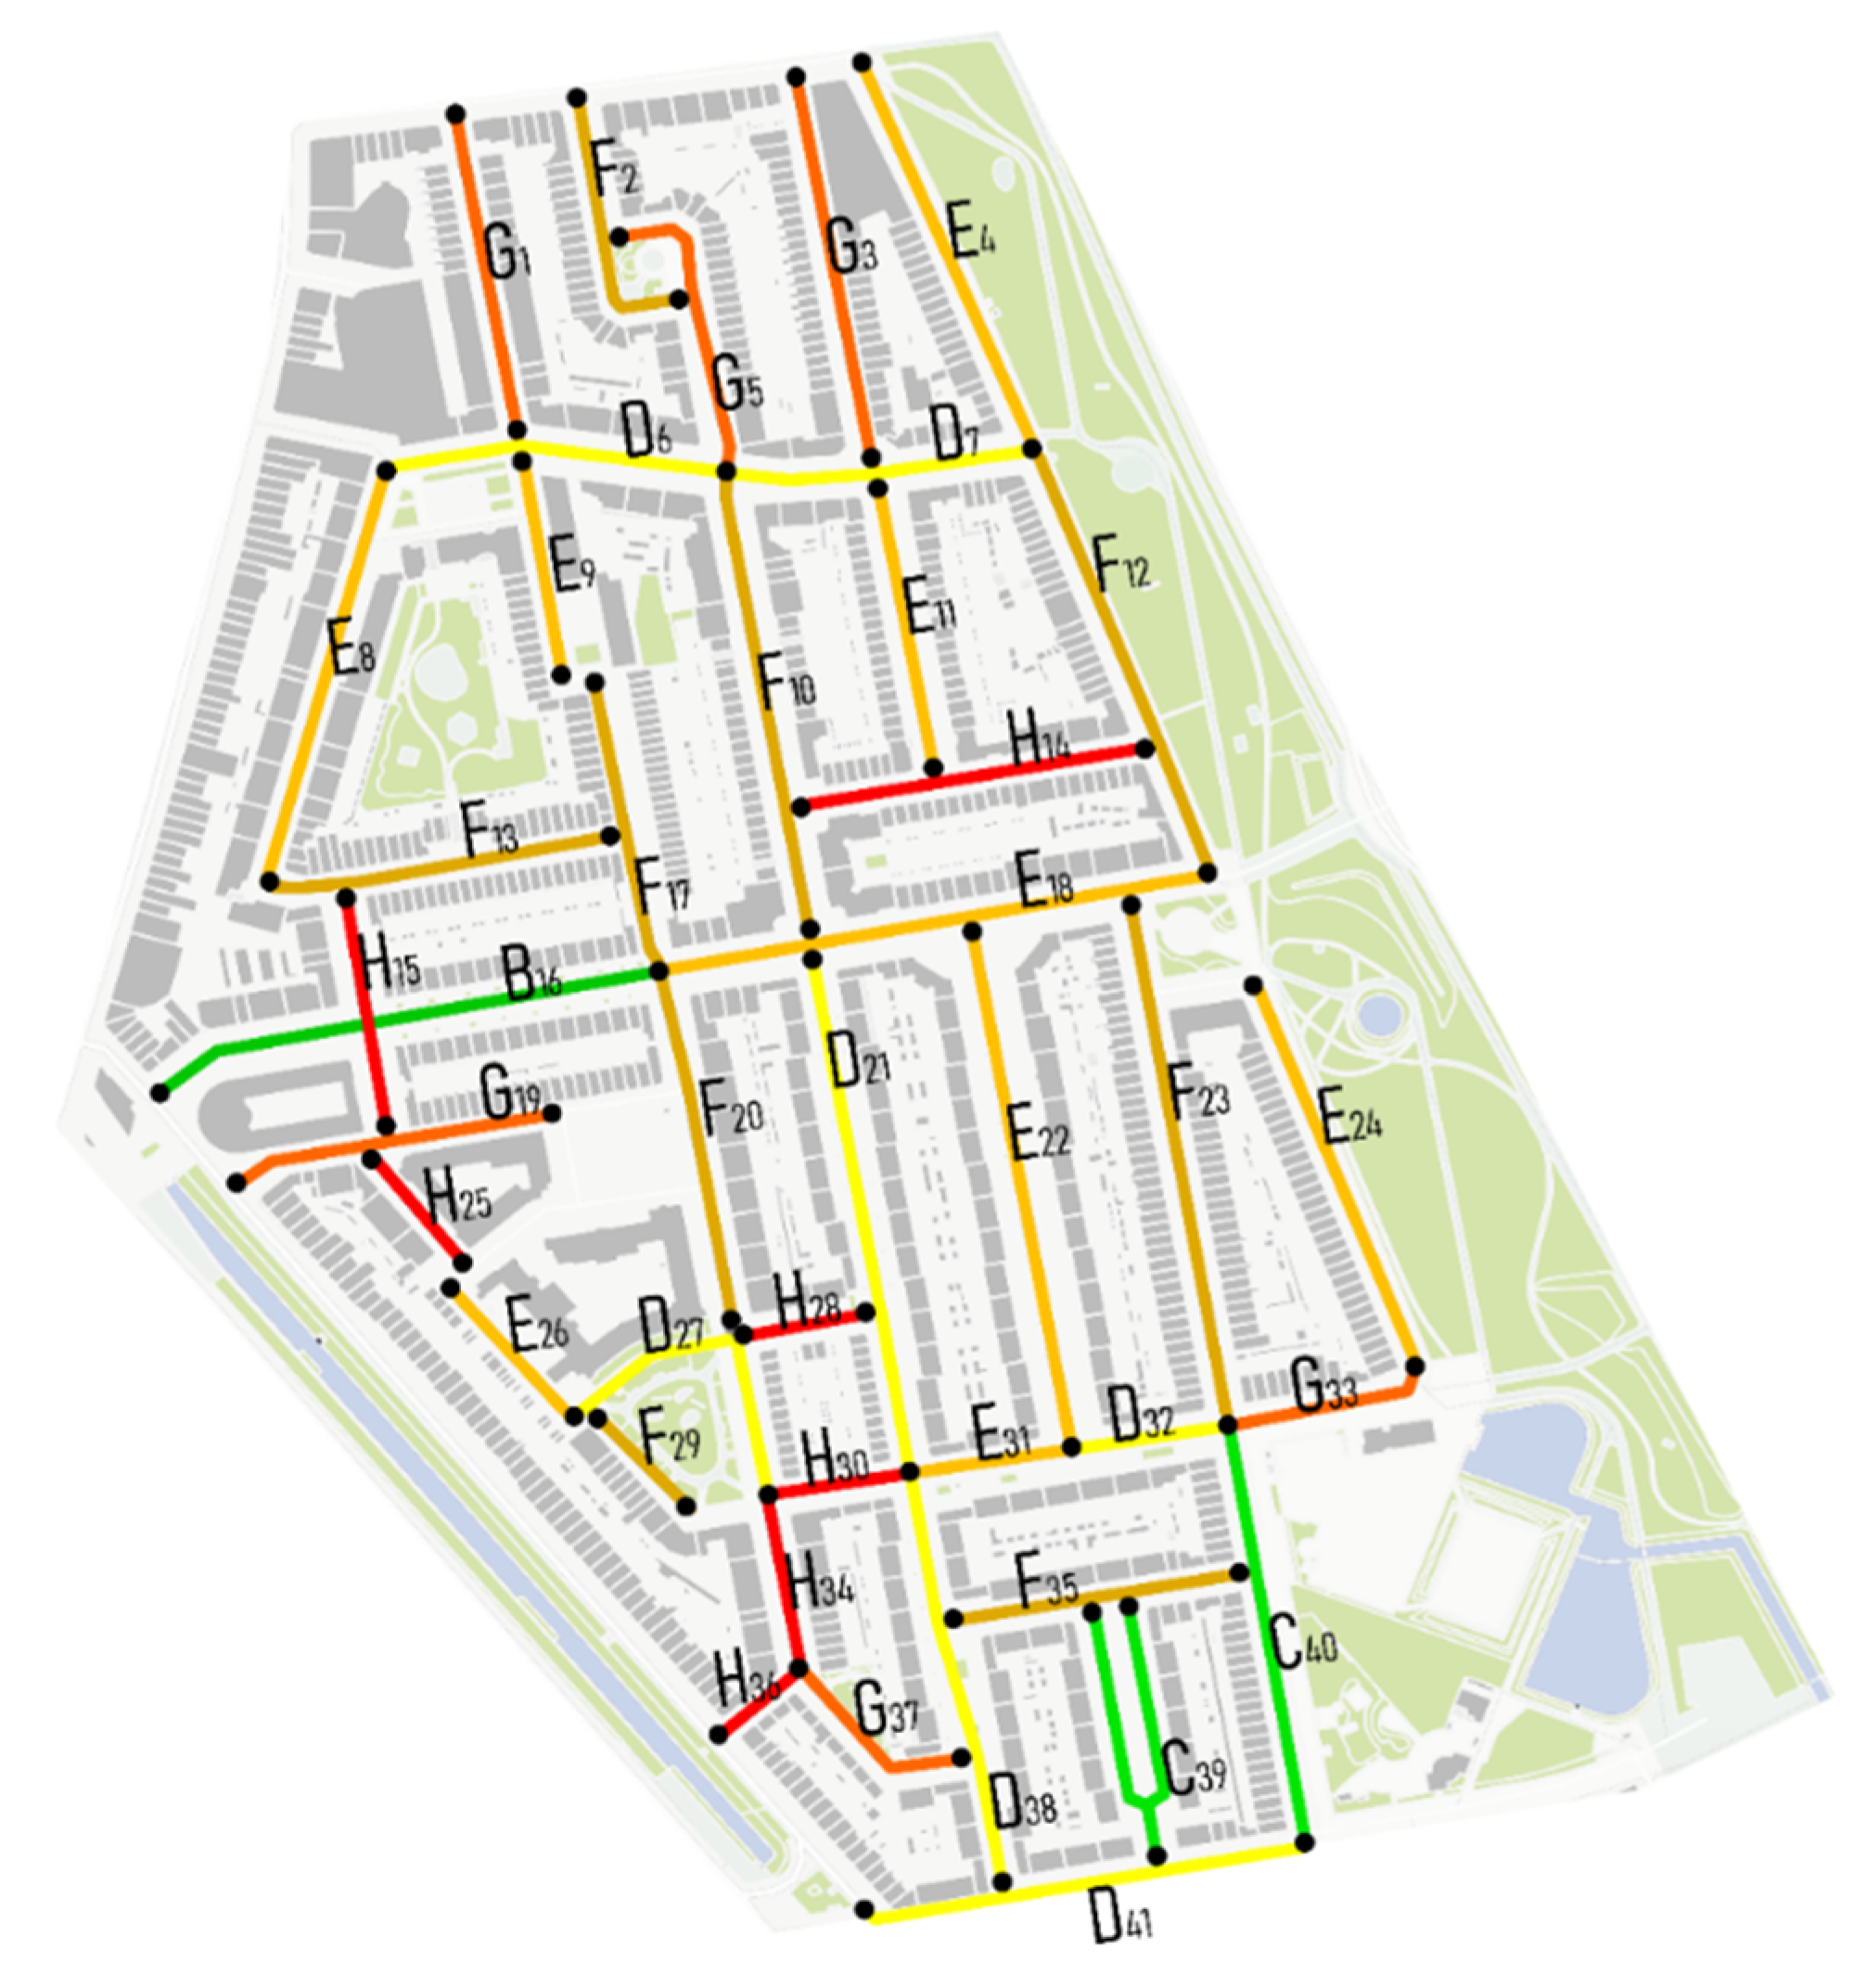
In the Hillesluis district, 21 streets were assessed with a total of 42 street segments. The scores per street segment were categorized and a corresponding label (Figure 2) was given to each street segment and is visualized in Figure 6. The span of the distribution ranges between the lowest score of 3, which corresponds with the lowest climate-adaptiveness label H, and the highest score of 63, which corresponds with climate-adaptiveness label B. The average segment score in Paddepoel was 42, which corresponds to label climate-adaptiveness label D in Table 2.

3.2. Hillesluis District Green Category Climate Adaptation Facilities and Measures

In total, 21 streets in the Hillesluis district were assessed with a total of 42 street segments. The scores of the green category of each street segment are presented in Table 3.
The assessment of the streets shows that all streets in the Hillesluis district had trees, except for three street segments. Just four street segments in the Hillesluis district scored the highest score for trees. The average score for trees was 20, which is half of the maximum score of 40. When we look at the green walls score, just five street segments fall in the lowest 1–25% green walls category.
In the façade garden/front yard category, nine street segments did not have any façade garden and/or front yard. Out of the remaining 43 street segments, 20 segments fell into the category of 1–50% façade garden and two street segments fell into the category of 50–100% façade garden. In 10 street segments, front yards were present, although six fell in the lowest category of 1–25% front yard and only four street segments fell in the category 50–75% green front yards.

3.3. Hillesluis District Blue Category

The scores of the blue category of each street segment are presented in 
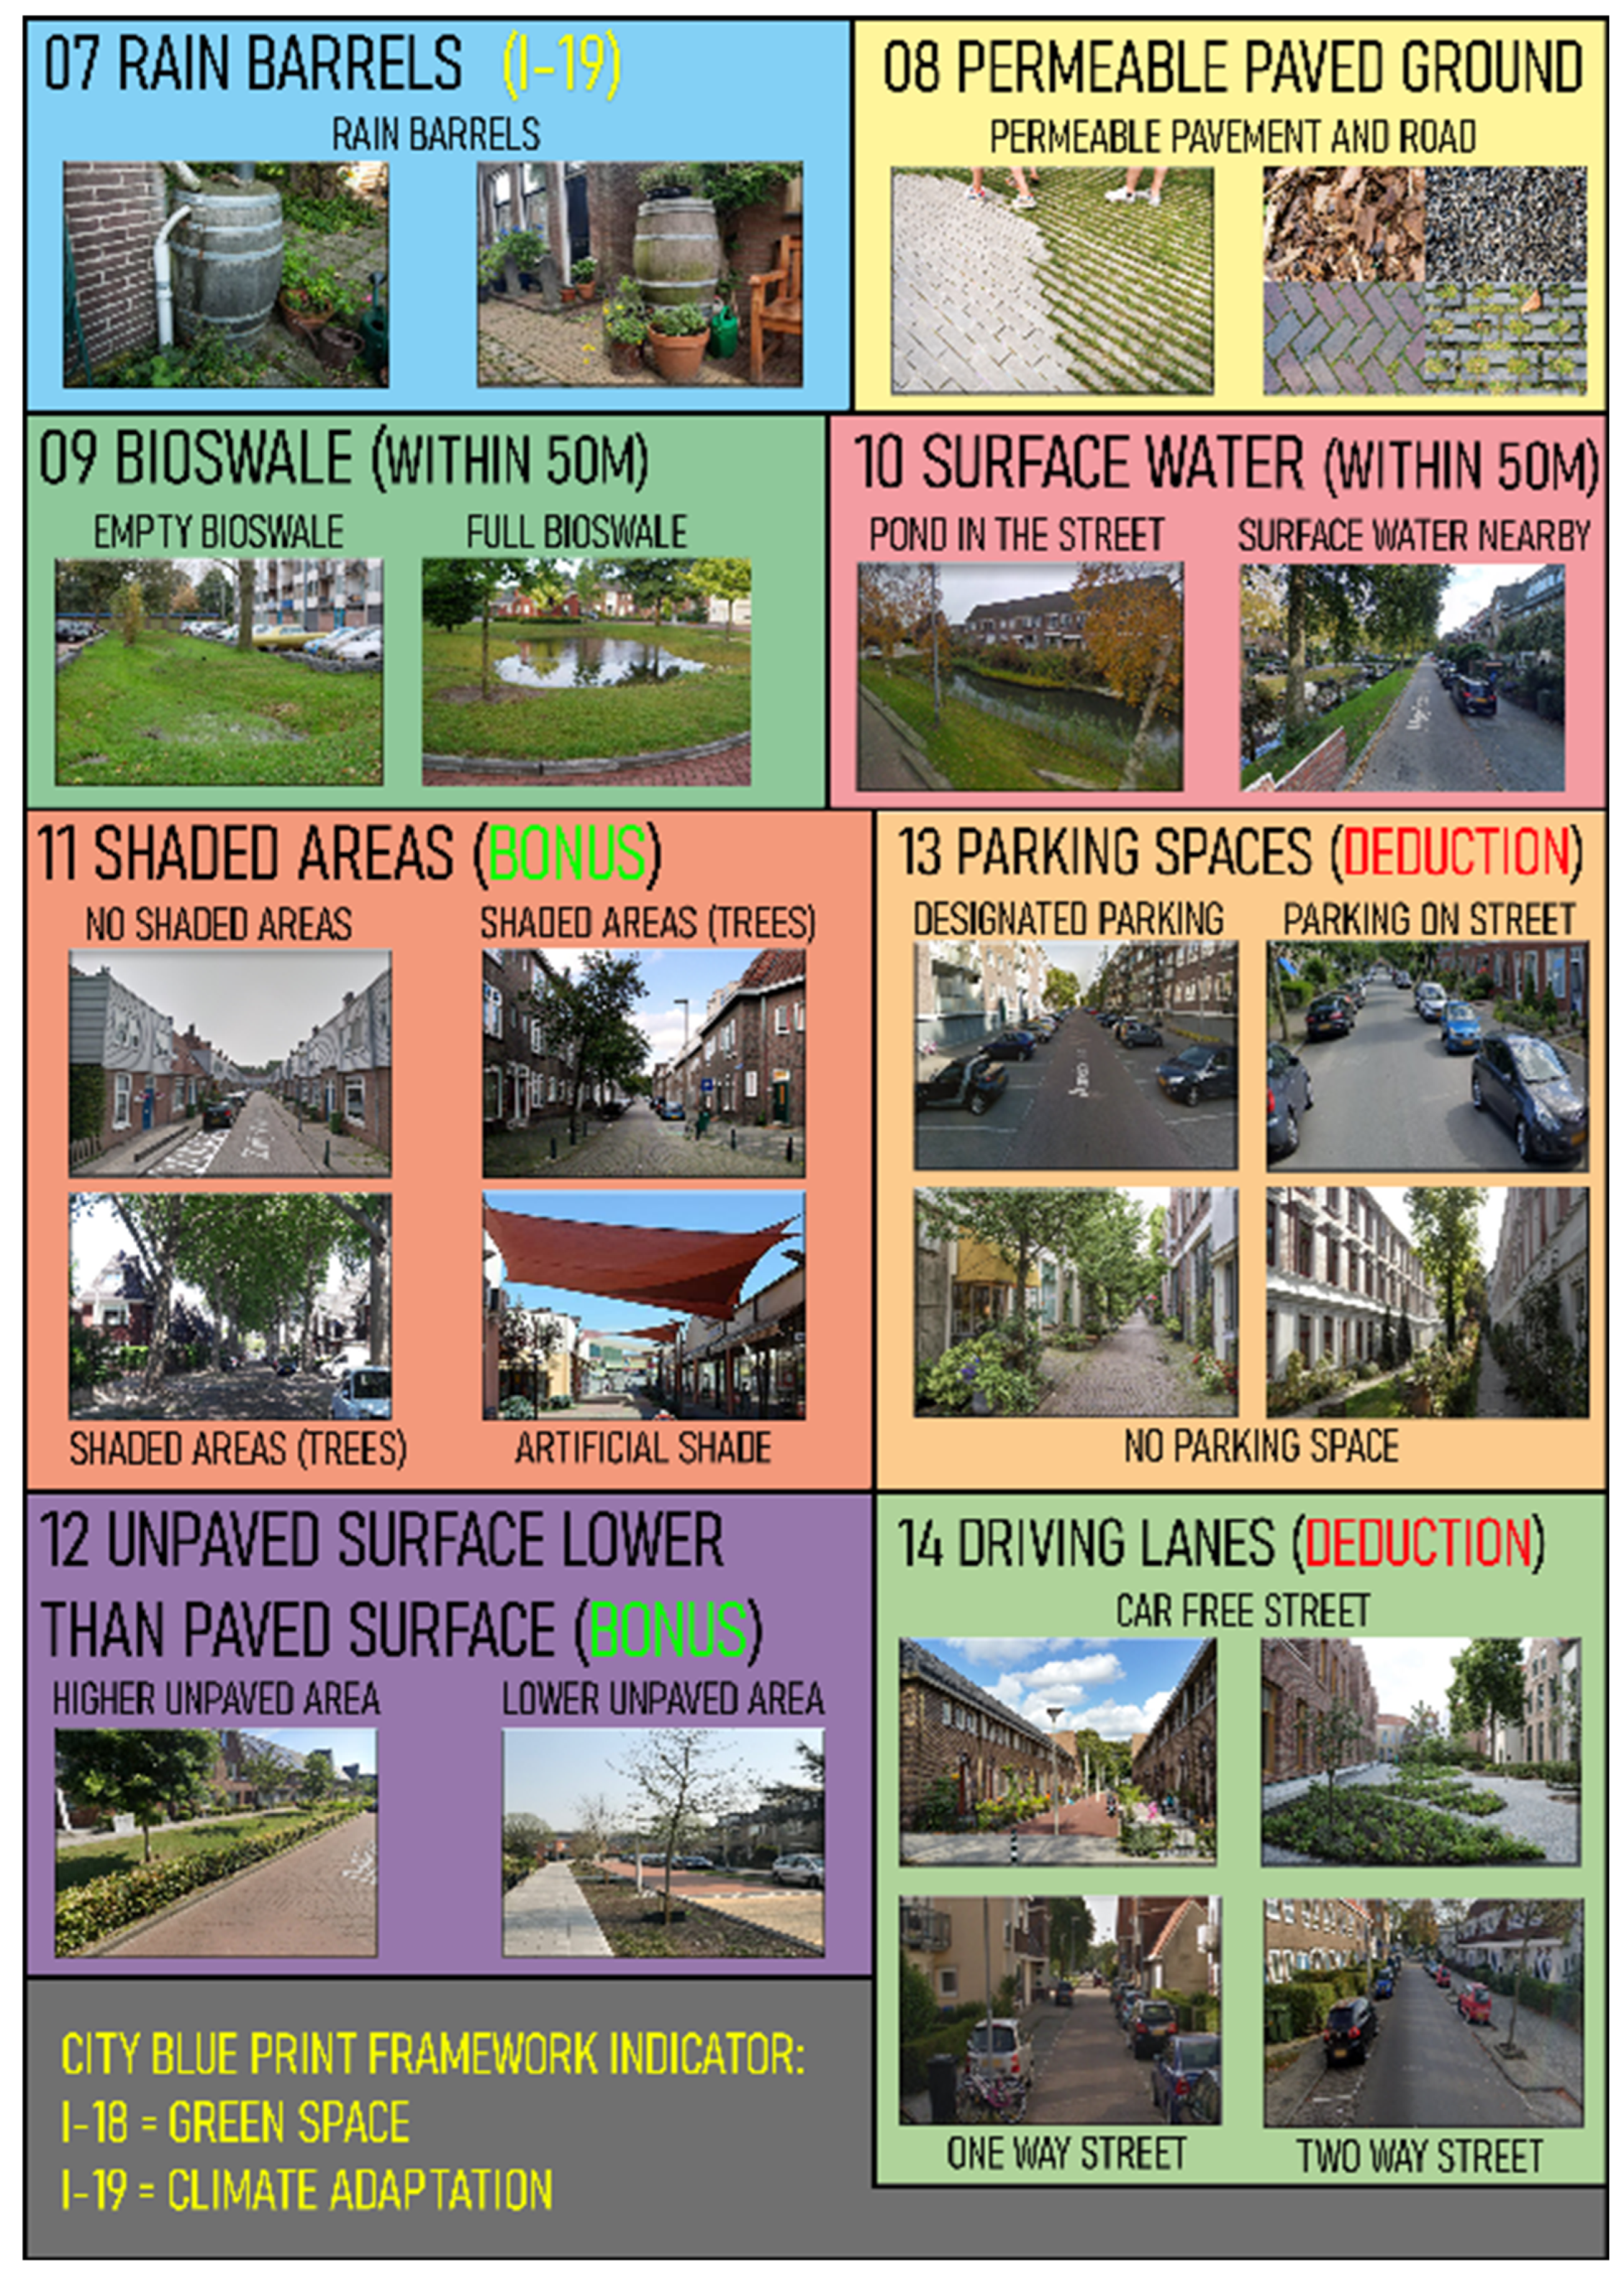
Table 4. No rain barrels were observed in the Hillesluis district at all, and no permeable pavement in the street or sidewalk was observed. No bioswales were present either. Just three street segments had surface water within 50 m distance away from the street segment. Only three street segments scored 6 points out of a total of a maximum of 16 points.

3.4. Hillesluis District Grey Category

The scores of the grey category of each street segment are presented in Table 5. Most of the street segments had shaded areas from trees (one point), but none of the streets had artificial shaded areas (two points). Only 9 segments out of 42 segments did not have any shade at all.
In none of the streets were open unpaved (green) areas observed that were located lower than the level of the paved areas so as to provide infiltration capacity. Neither were unpaved areas observed that were located higher than street level.
In all 42 street segments, designated parking spaces were present (deduction of two points), contributing to urban heat stress.
In 26 street segments, one driving lane was present while in 16 street segments, two way driving lanes were present (deduction of one point per driving lane).
None of the streets scored the maximum 7 points. In total, 18 street segments scored two deduction points, 20 streets scored three deduction points, and 4 street segments scored four deduction points.

3.5. Total Score Hillesluis District

When we look closer at the total score of the individual street segments in the Hillesluis district, it can be seen that the maximum score is 58 in Westerbeekstraat, segment 2, and the lowest score in Zaadakkerstraat, segment 1 (see Table 6).
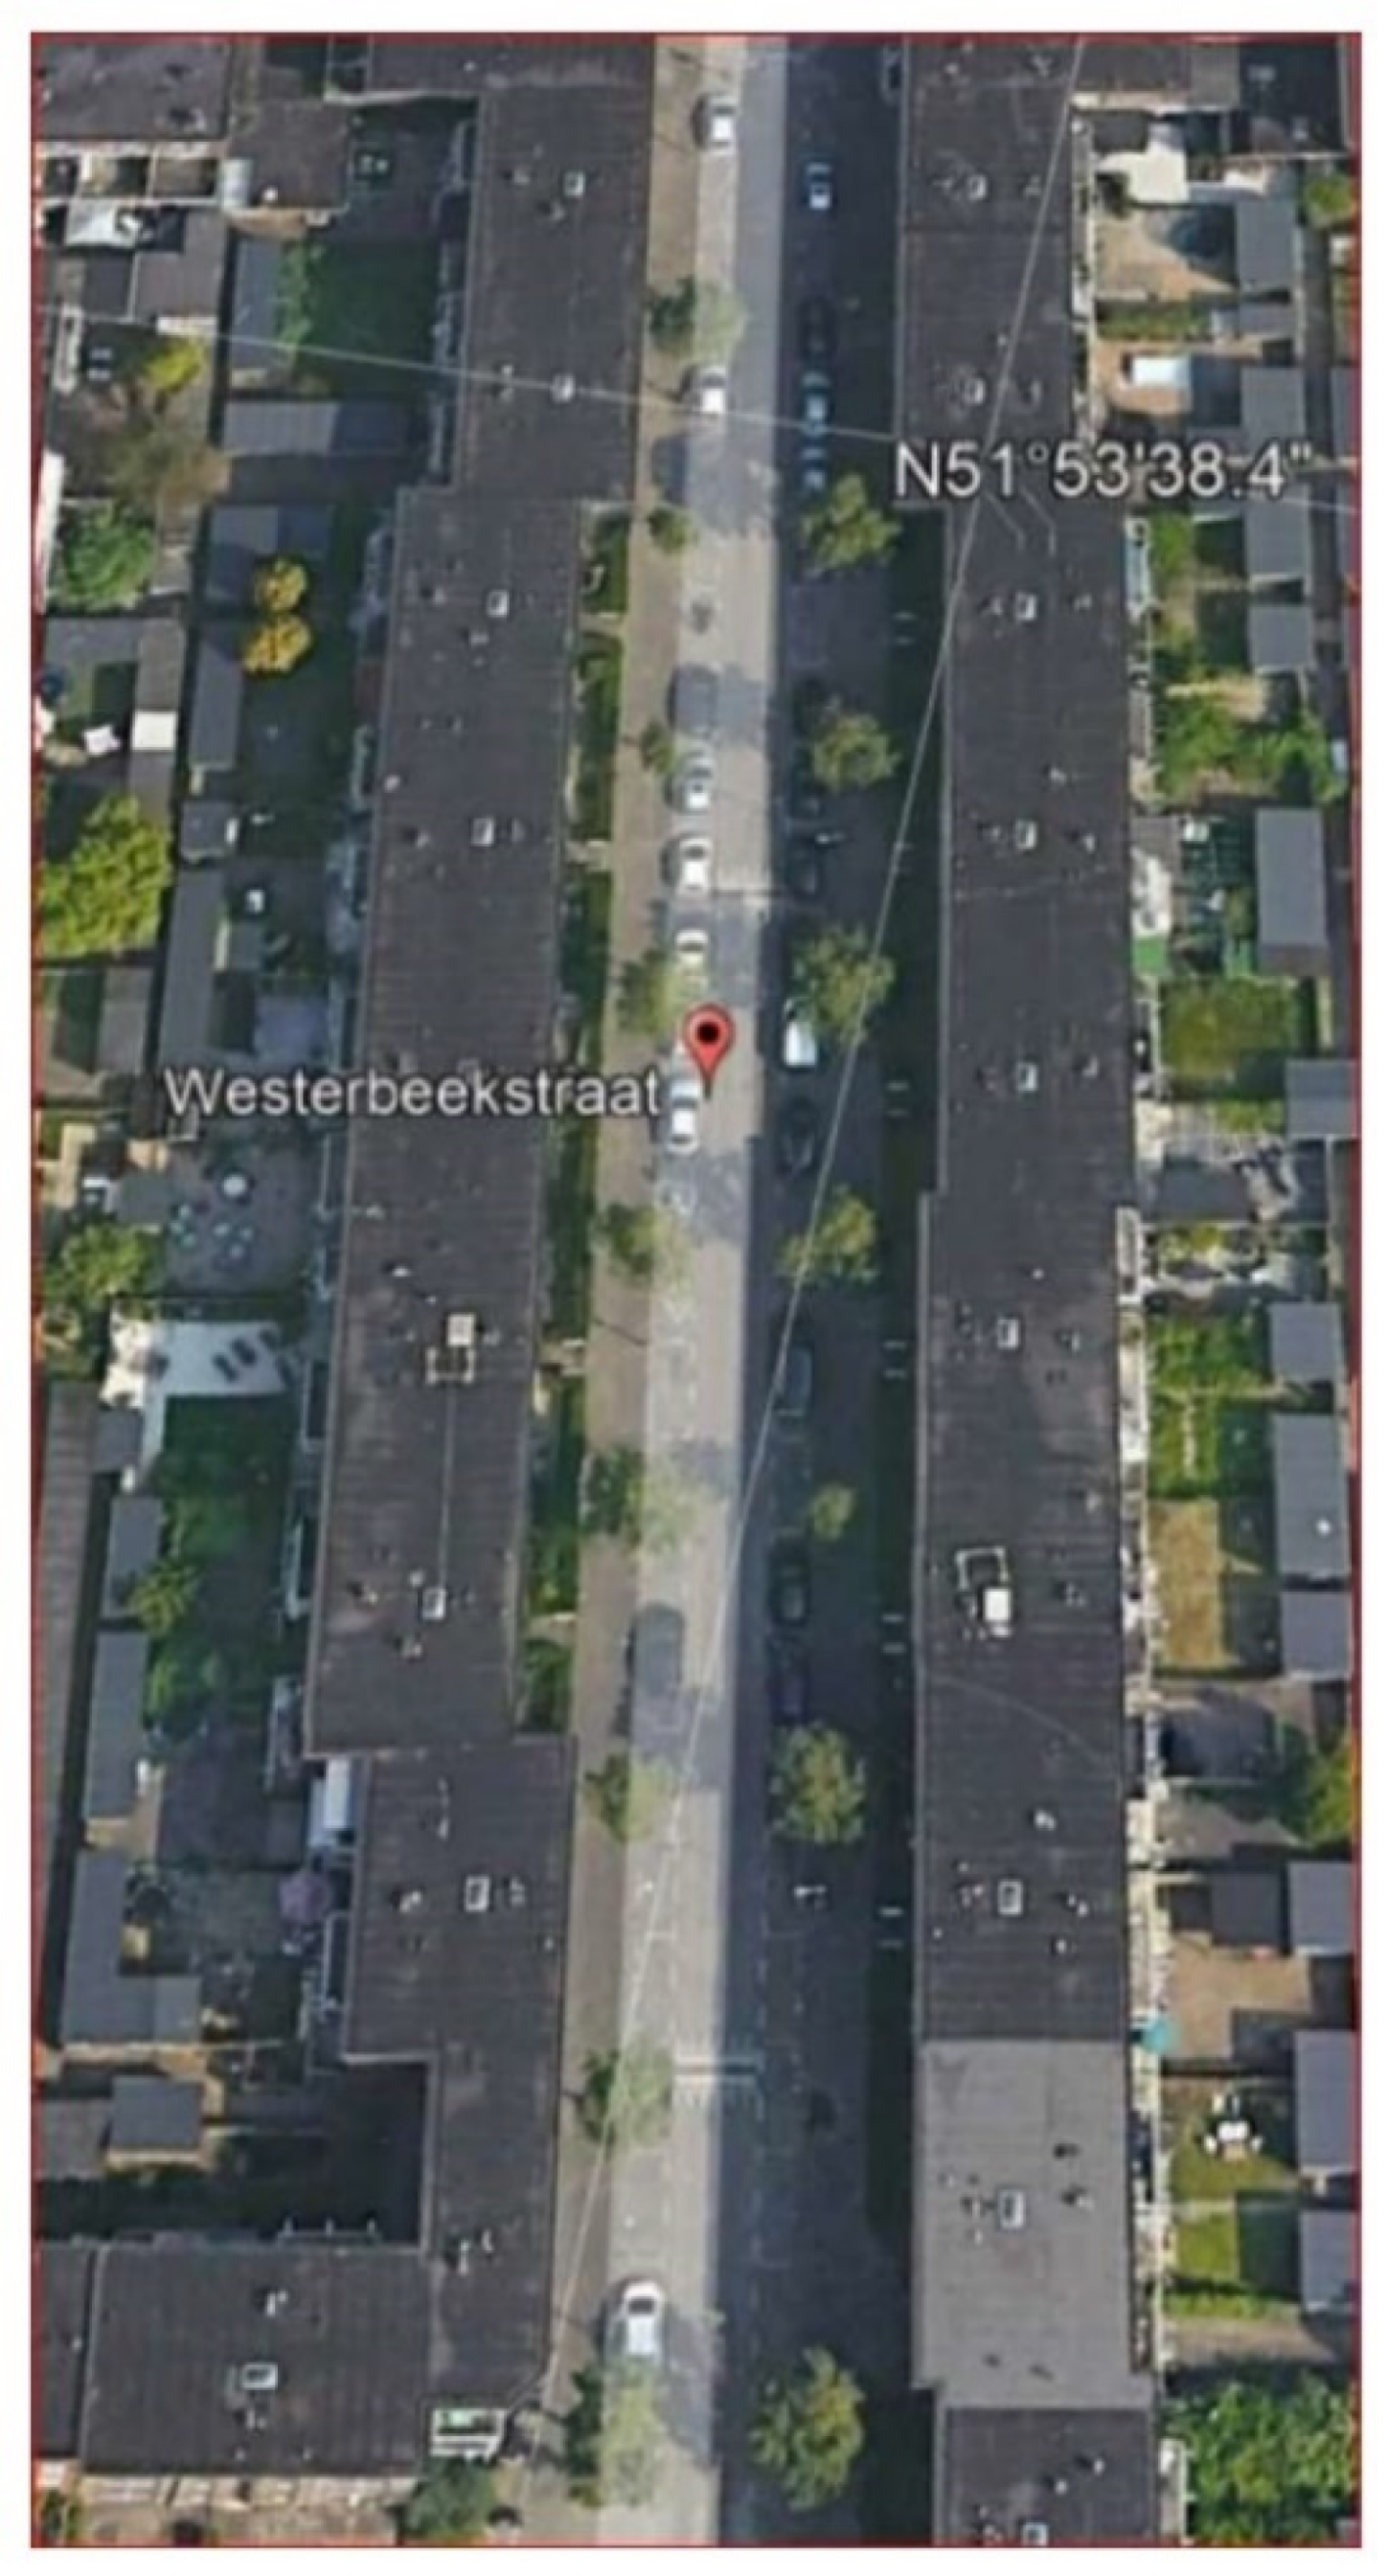
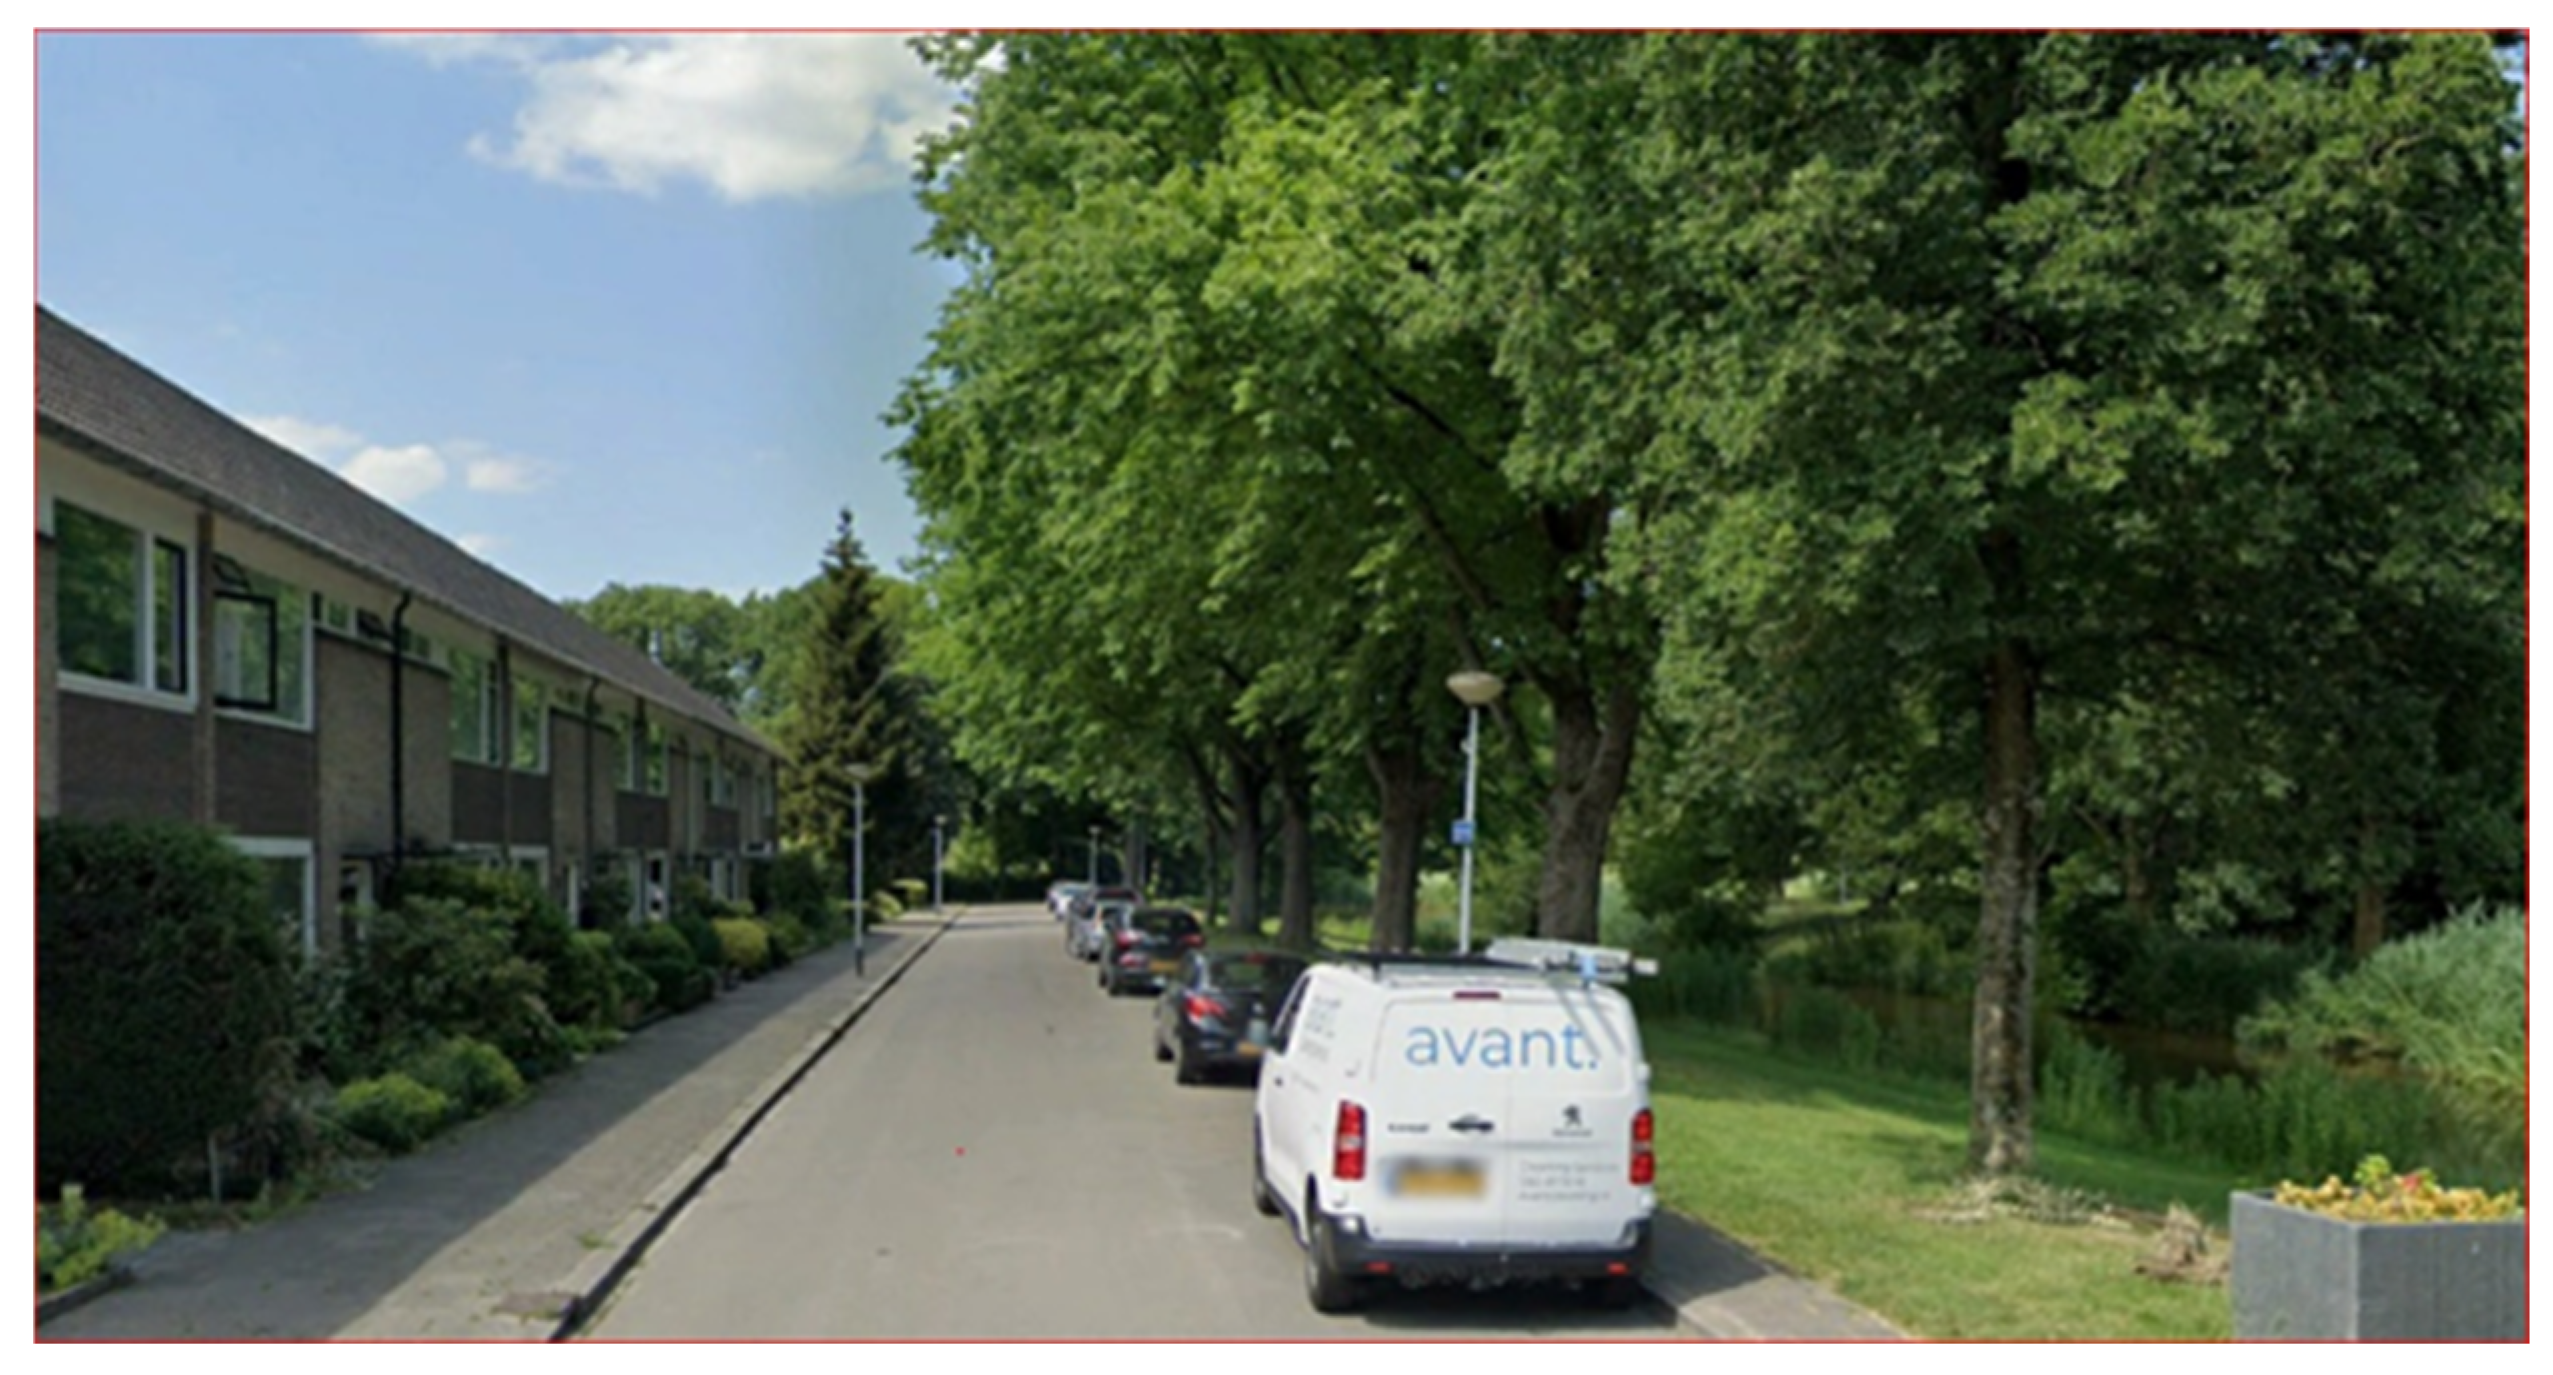
The highest score in the Hillesluis district was observed in Westerbeekstraat, segment 2 (Figure 7 and Figure 8). Westerbeekstraat segment 2, scored 58 points for trees, which is just below the maximum of 40 points, as well as zero points for green walls, fourteen points for green front yards (75–100%), zero points for green strips, zero points for climate adaptive roofs, and zero points for green parking lots. In the blue category, Westerbeekstraat, segment 2, does not score any points for the presence of rain barrels, permeable streets or pavements, or nearby surface water. In the grey category, Westebeekstraat, segment 2, scored one point for shadows from canopy, zero points for green areas, and a deduction of two points for the presence of (soil-sealed) parking spaces and a deduction of 1 point for a (soil-sealed) driving lane.
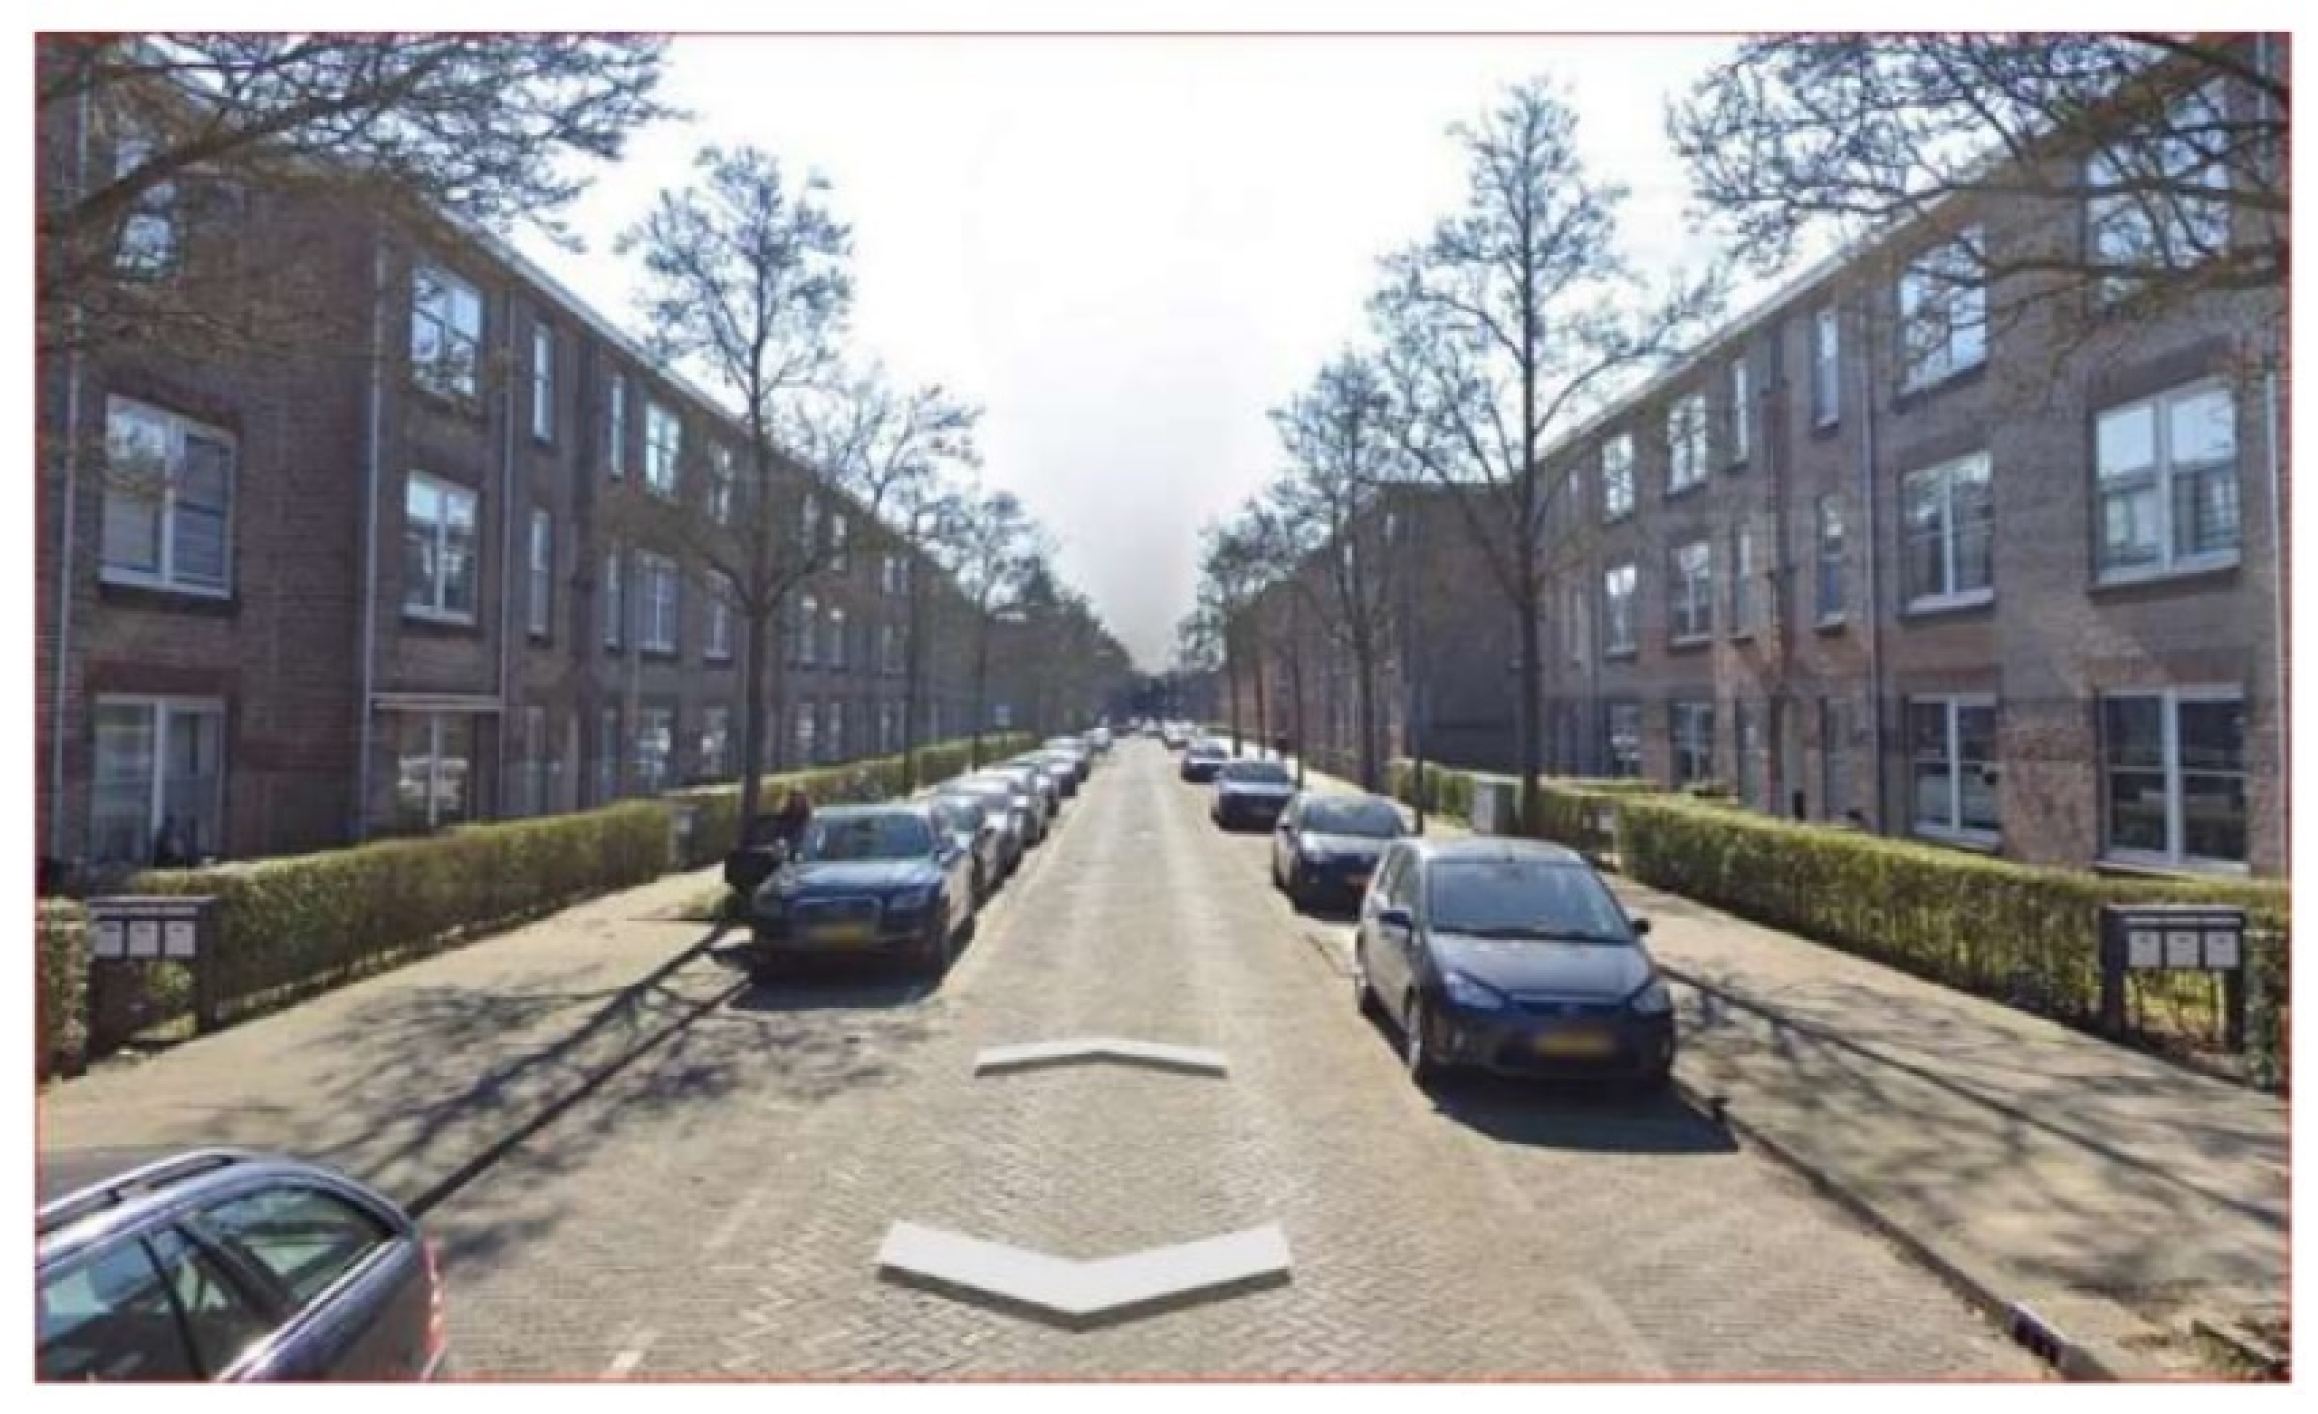
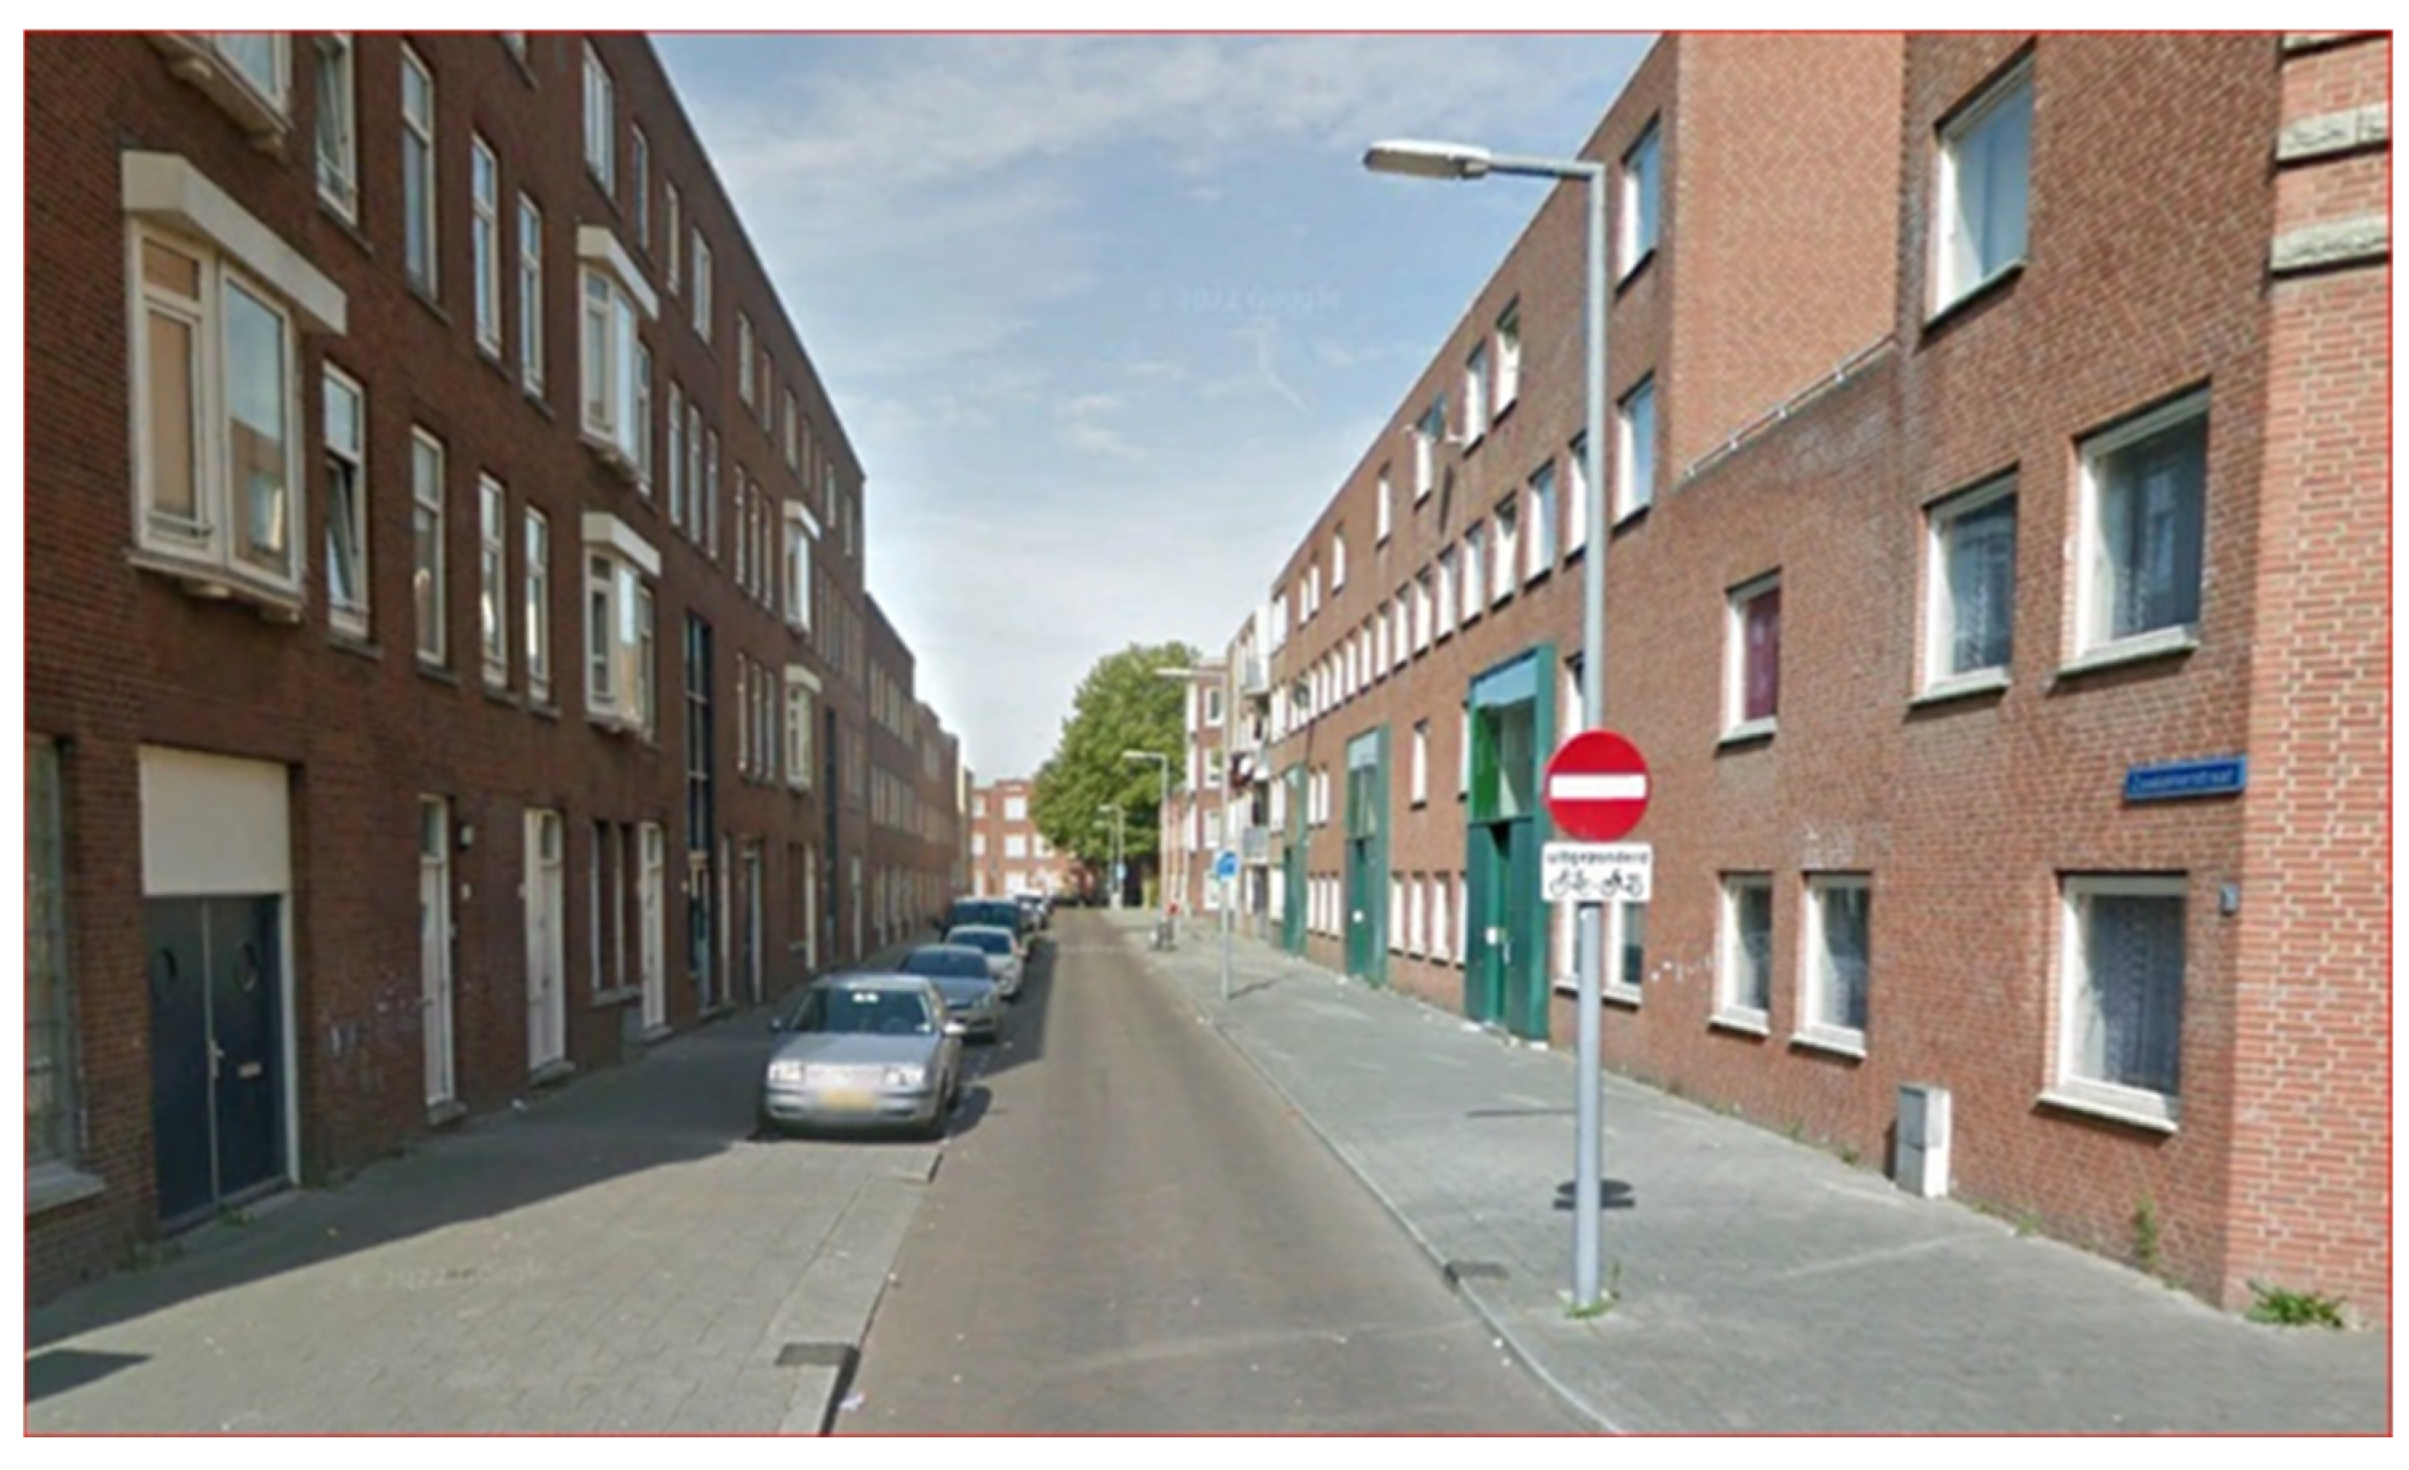
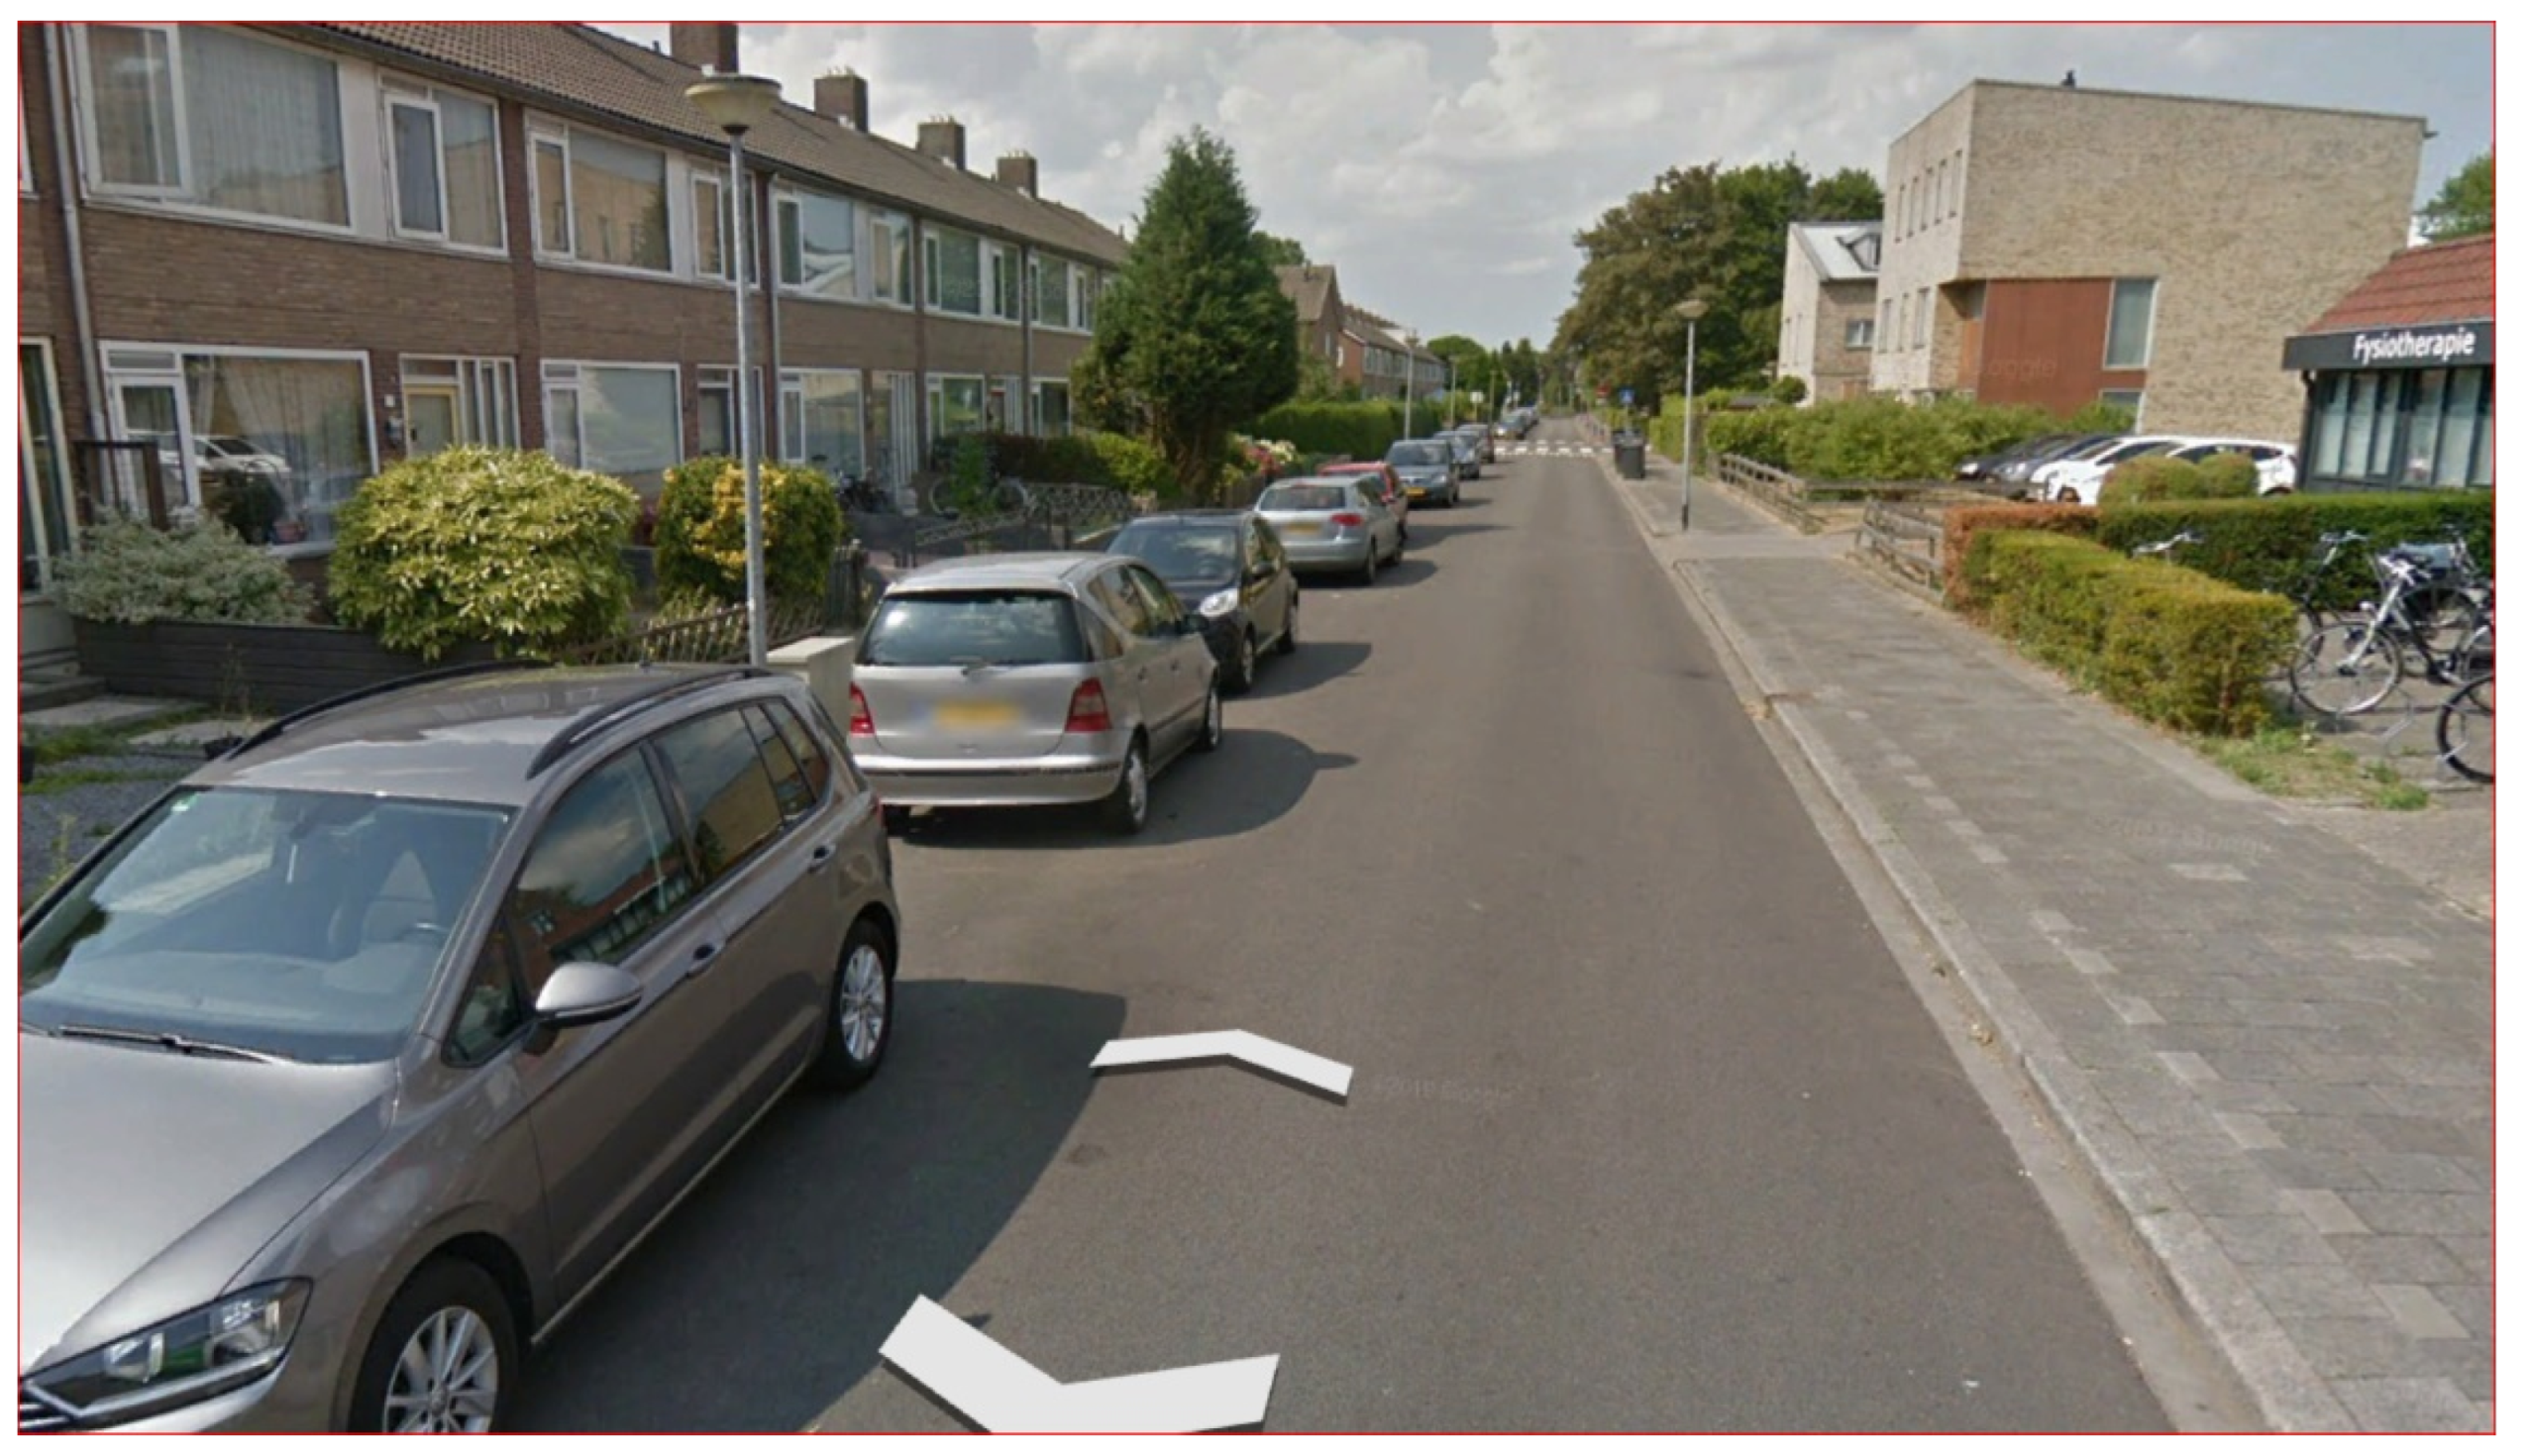
The lowest score in the Hillesluis district, of three points, was Zeeuwsestraat, but as this street was very short, about 35 m, with only four housing units, the next street with the lowest score will be discussed here. The street with the second lowest score, of five points, was observed in Zaadakkerstraat (Figure 9 and Figure 10).
Zaadakkerstraat scored just three points for trees. Zero points for green walls, five points for façade gardens (1–50%), zero points for green strips, zero points for climate adaptive roofs, and zero points for green parking lots.
In the blue category, Zaadakkerstraat did not score any points for the presence of rain barrels, permeable streets or pavements, or nearby surface water.
In the grey category, Zaadakkerstraat scored zero points for shadows from canopy, zero points for green areas, and a deduction of two points for the presence of (soil-sealed) parking spaces and a deduction of one point for one (soil-sealed) driving lane.

3.6. Groningen, Paddepoel North District

The Paddepoel North district is located in the northern part of the city of Groningen and had a population of about 6000 persons in 2020 and a population density of 9009 residents per square kilometer [49]. The district is characterized by 30% single family dwellings and 70 % multifamily dwellings [49]. The district is characterized by single family dwellings with front yards, typical Dutch row houses, and green and multifamily dwellings of up to typically four floors with green lawns. Most of the district was constructed between 1950–1980 and a small portion of the housing units were constructed in the recent years of 2010–2020 [50].
About half of the total housing stock is owned by a social housing corporation (53%), a quarter is owner occupied, and (25%) and a quarter of the housing stock is rented out by private owners (22%) [50]. Around 22% of the population has a non-Western background. About 70% of the households are single-person households [49].
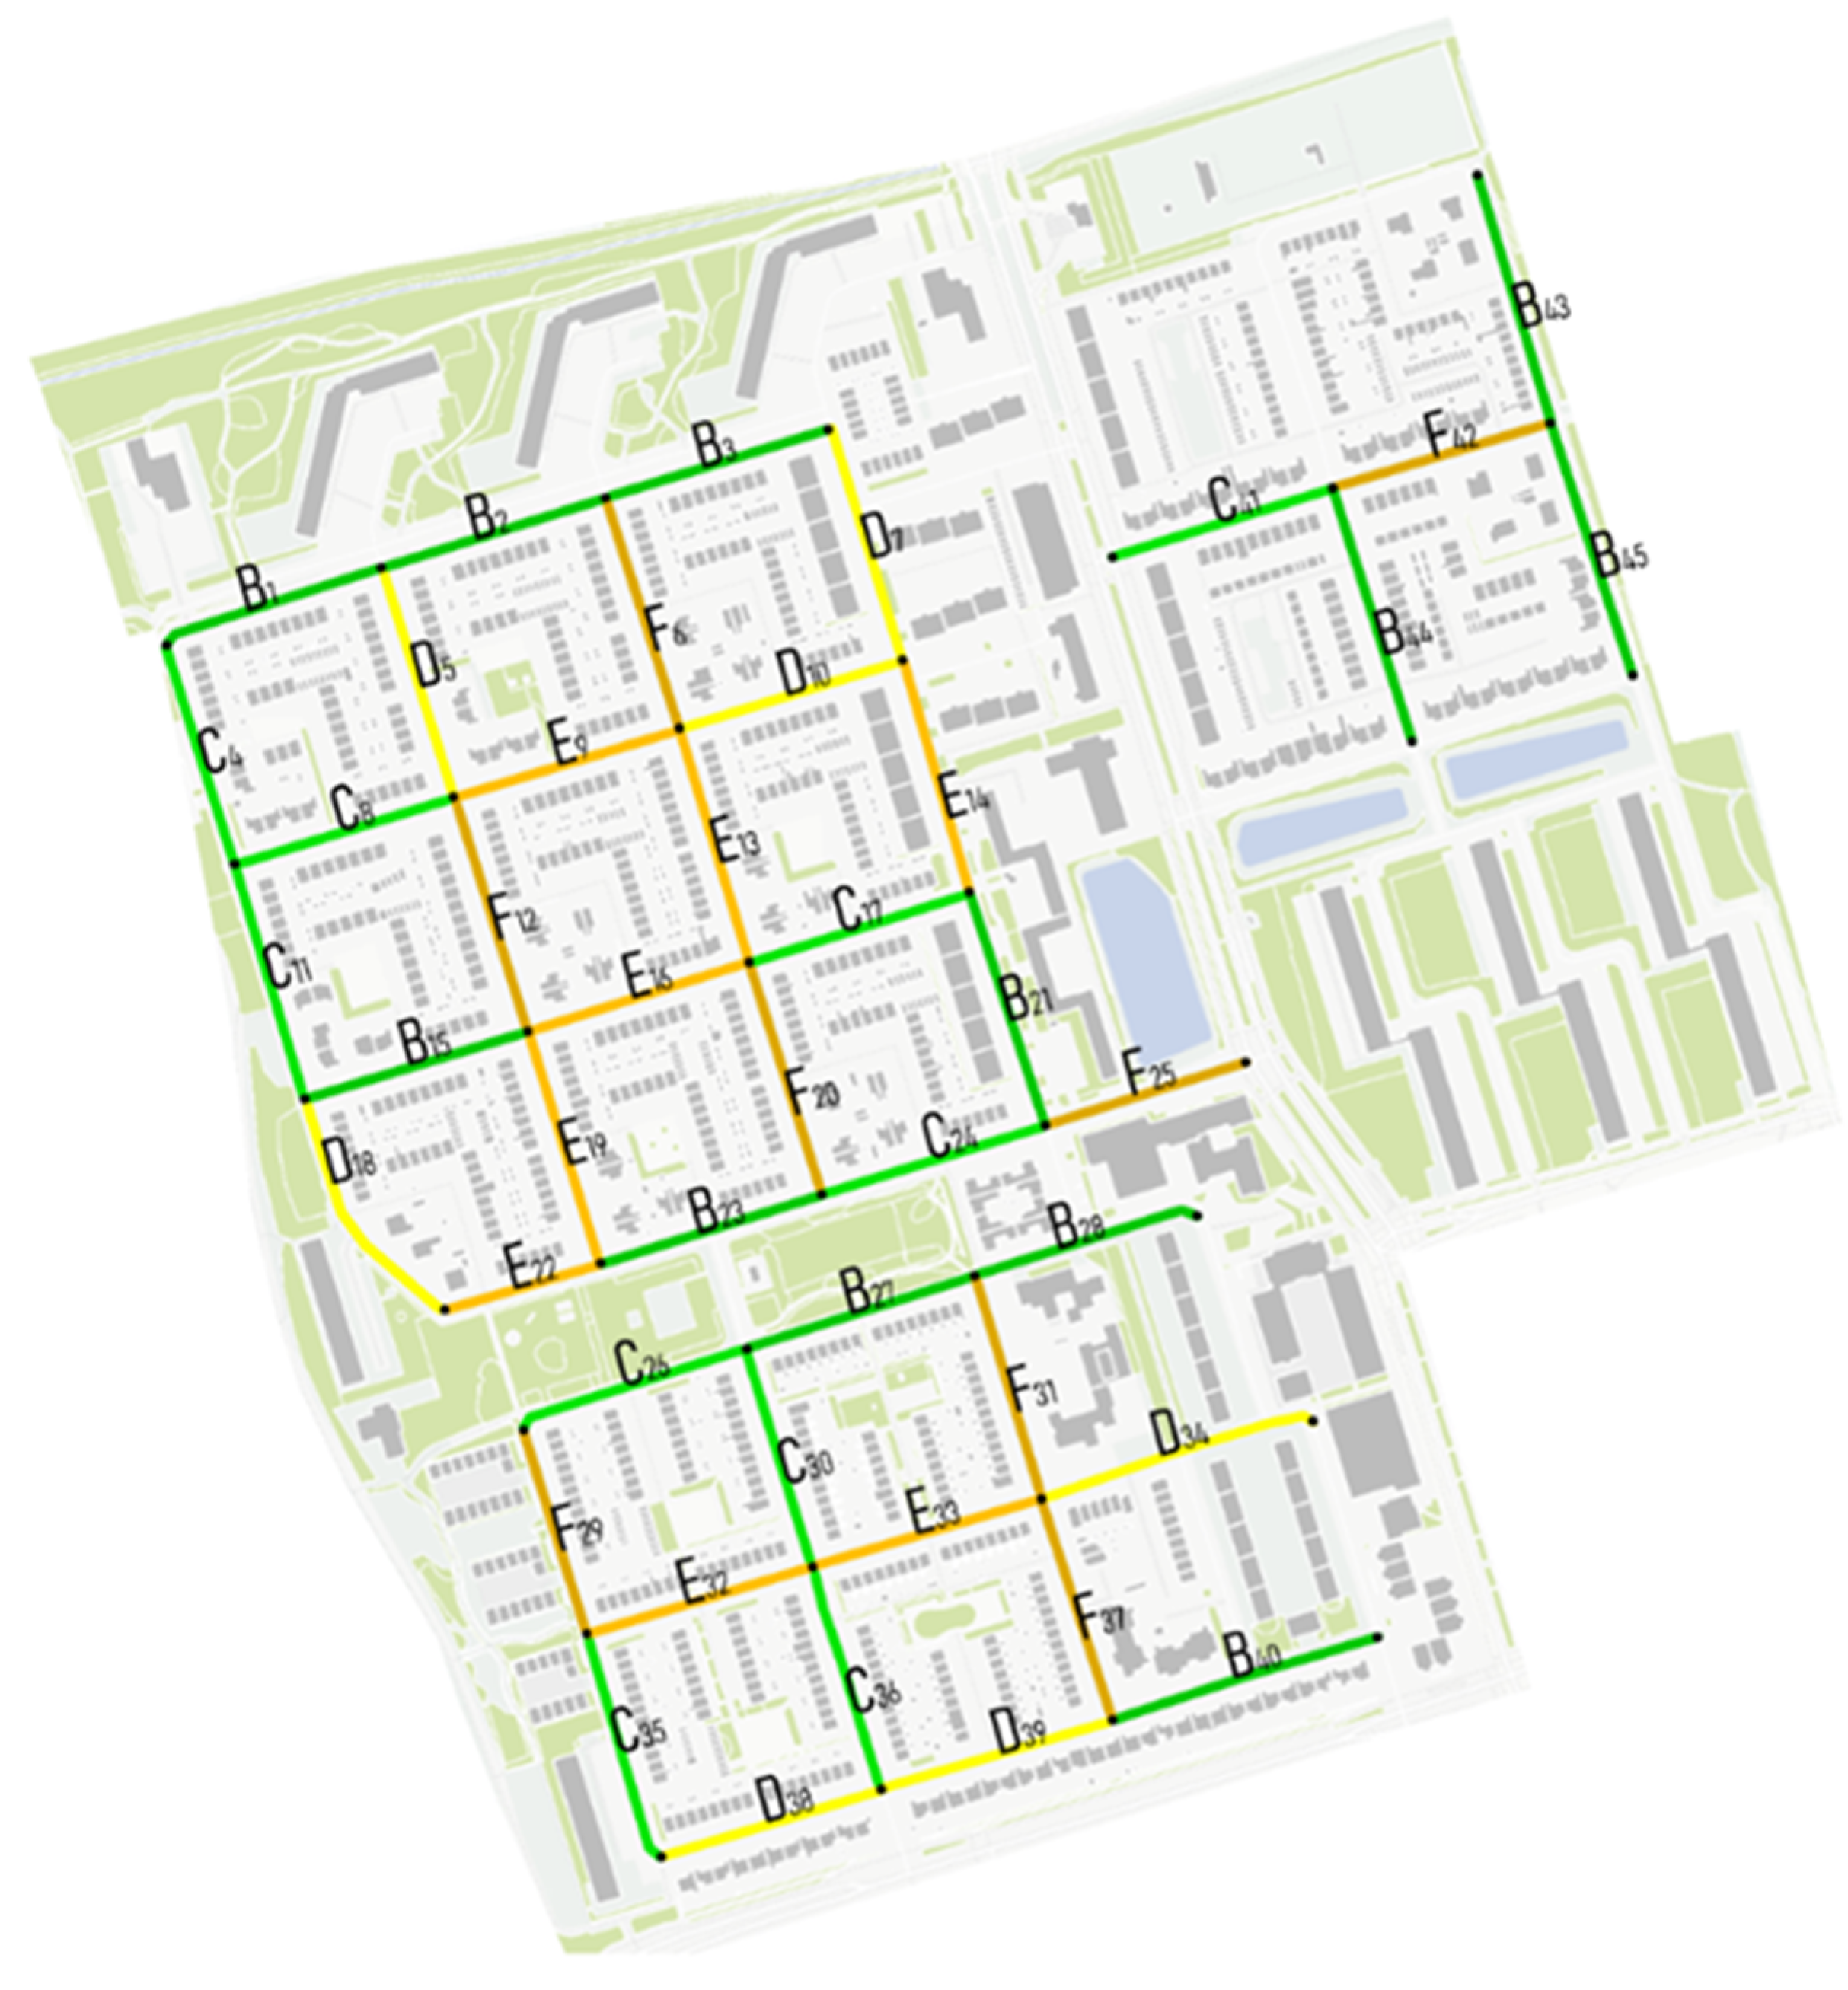
In the Paddepoel North district, 21 streets were assessed with a total of 45 street segments. The average score per segment was 47. The results of the segments are presented in Table 7. The scores per street segment were categorized and a corresponding label (Figure 2) was given to each street segment and was visualized in a map.
In the Paddepoel district, 17 streets were assessed with a total of 45 street segments. The results of the assessment are presented in Map 2.
The span of the distribution ranged between the lowest score of 22, which corresponds with climate adaptiveness label F, and the highest score of 70, which corresponds with climate adaptiveness label B. The average segment score in Paddepoel is 47, which corresponds with label climate adaptiveness label D. The total scores for each segment are presented in Table 7 and are visualized in Figure 11.

3.7. Paddepoel District Green Category

In total, 17 streets were assessed in the Paddepoel North district, with a total of 45 street segments. The scores of the green category of each street segment are presented in Table 8.
The assessment of the streets show that all streets in the Paddepoel North district had trees, except for one street segment, Capellastraat segment 2. Eleven street segments in the Paddepoel North district scored the highest score for trees. The Paddepoel North district scored on average 26 points, which is about 65% of the maximum score of 40. When we look at the green walls score, just two street segments fell in the lowest 1–25% green walls category.
In the façade garden/front yard category, one street segment had a 1–50% score for the façade garden. All other streets in the Paddepoel North district had front yards; 22 out of 45 street segments had a 75–100% score for front yards, indicating that the front yard potential was fully used.

3.8. Paddepoel District Blue Category

The scores of the blue category of each street segment are presented in Table 9. One rain barrel was observed in Kometenstraat, segment 2. No permeable pavement in the street or sidewalk was observed. No bioswales were present as well. Nine street segments had surface water within 50 m away from the street segment. Eight street segments scored six points out of a total of maximum 16 points, and one street segment scored seven 7 points.

3.9. Paddepoel District Grey Category

The scores of the grey category of each street segment are presented in Table 10. Most of the street segments had shaded areas from trees (one point), but none of the streets had artificial shaded areas (two points). Only 7 segments out of 45 segments did not have any shade at all.
In only two street were segments of open unpaved (green) areas observed, which were located lower than the level of the paved areas to provide infiltration capacity. No unpaved areas were observed that located higher than the street level.
In only nine street segments were designated parking spaces present (deduction of two points), contributing to urban heat stress. While in the other 36 street segments, no parking lots were observed in the street itself. In all 45 street segments, two driving lanes were observed (deduction of one point per driving lane).
None of the streets scored the maximum of seven points. In total, 32 street segments scored 1 deduction point, 6 streets scored 2 deduction points, and 5 street segments scored 3 deduction points.

3.10. Total Score Paddepoel District

When we looked closer at the total score of the individual street segments in the Paddepoel North district, we could see that the maximum score was 70, for Morgensterlaan, segment 2, and the lowest score was in Capellastraat, segment 1 (see Table 11).
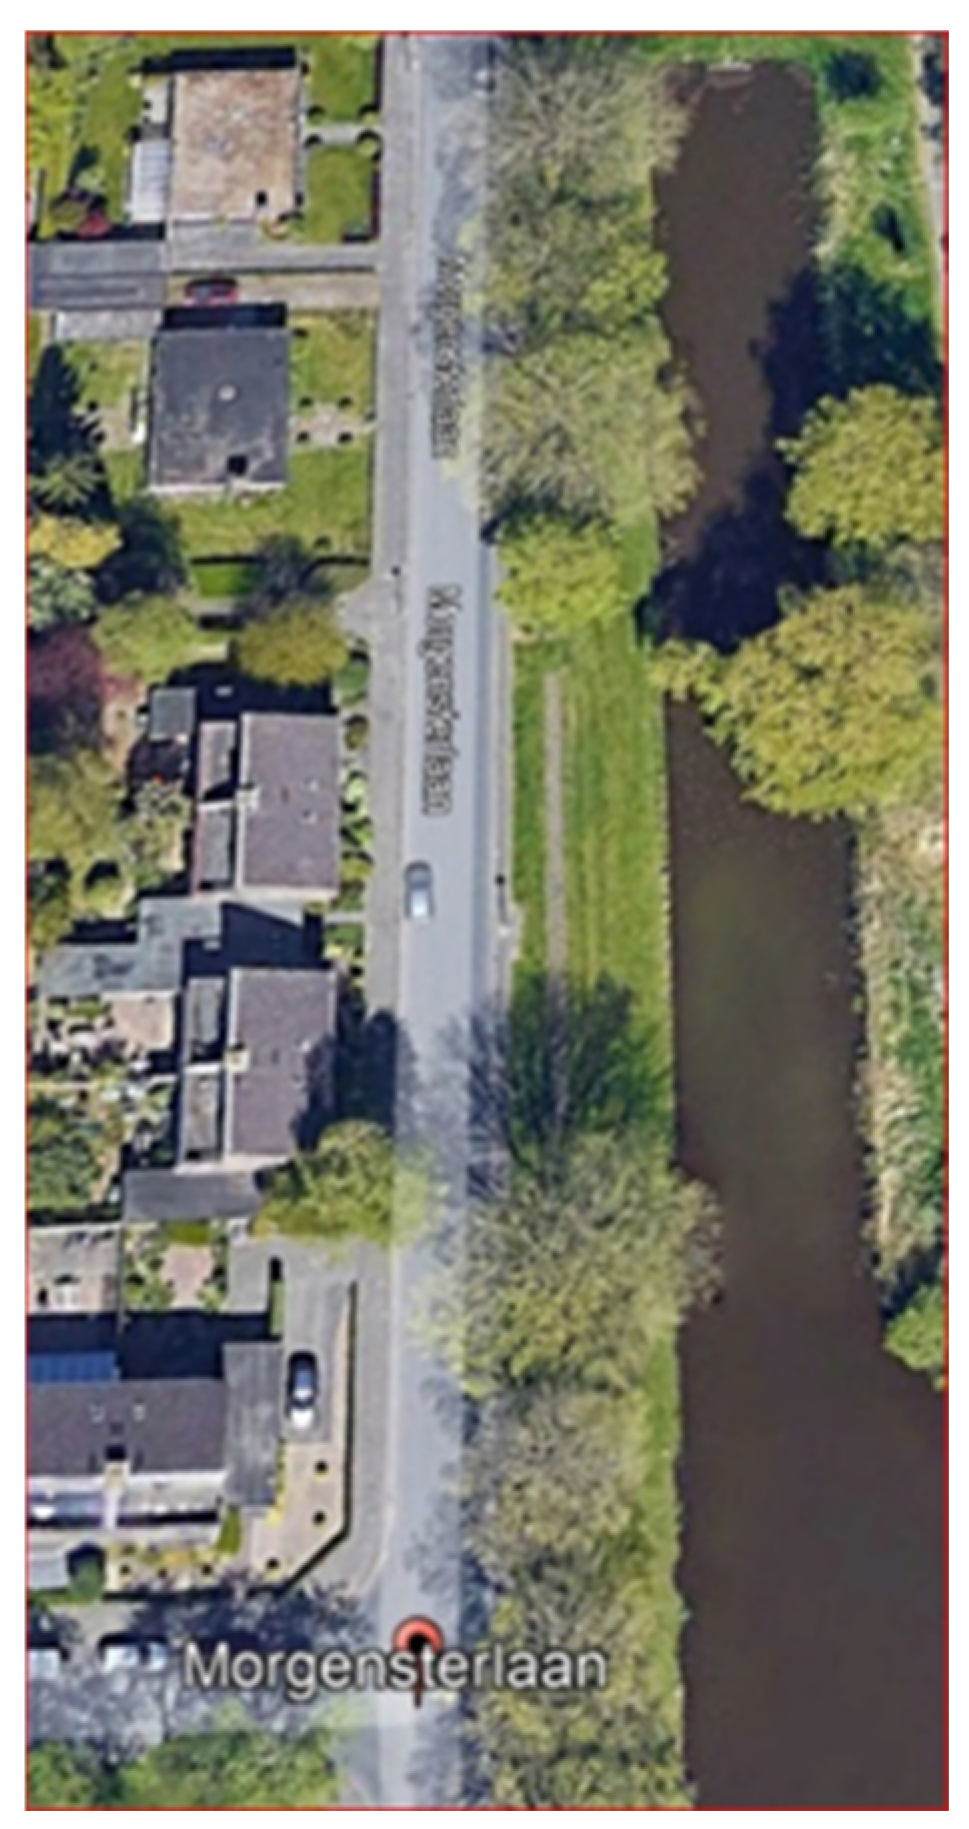
The highest score in the Paddepoel North district was observed in Morgensterlaan, segment 2. Morgensterlaan, segment 2, scored 35 points for trees, which was just below the maximum of 40 points. There were 0 points awarded for green walls, 16 points for green front yards (75–100%), 13 points for green strips, 1 point for climate adaptive roofs, and 0 points for green parking lots.
In the blue category, Morgensterlaan, segment 2, did not score any points for the presence of rain barrels, permeable streets, or pavement. The street scored six points for nearby surface water within 50 m.
In the grey category, Morgensterlaan, segment 2, scored one point for shadow from canopy and zero points for green areas. No deduction for the presence of (soil-sealed) parking spaces and a deduction of two points for the presence of two (soil-sealed) driving lanes were scored (Figure 12 and Figure 13).
The lowest score in the Paddepoel North district, of 22 points, was in Capellastraat segment 1. Capellastraat segment 1, scored only nine points for trees, and zero points for green walls, fourteen points for green front yards (50–75%), zero points for green strips, zero points for climate adaptive roofs, and zero points for green parking lots.
In the blue category, Capellastraat, segment 1, did not score any points for the presence of rain barrels, permeable streets or pavements, or nearby surface water.
In the grey category, Capellastraat, segment 1, scored 1 point for shadow from a canopy, zero points for green areas, no deduction for the presence of (soil-sealed) parking spaces, and a deduction of two point for each (soil-sealed) driving lane (Figure 14).

4. Discussion

The aim of the study was to create a tool, a score card, that was relatively easy to use by community members and stakeholders that could assess the presence of climate adaptive measures in streets and give insight into the level of climate adaptation for a street segment or an entire street. At the neighborhood level, studies have already shown that there is a mismatch between demand and supply of ecosystem services in neighborhoods and values for different ecosystem services for cooling and run-off retention and air purification [9]. These studies do not assess and score climate adaptation measures for an entire street. The objective was therefore to come up with a scorecard that can label a street segment or an entire street with a score of 1–100 and a label from A+++ to G, similar to the new EU energy labels for selected appliances, which were effective as of 1 March 2021 [53].
The method that was used in this research enabled the assessment of the presence of climate adaptive measures in different street segments. The results show that the scorecard method generated a clear numerical distinction between streets and street segments that contain climate adaptive measures and streets that do not have such climate adaptive measures.
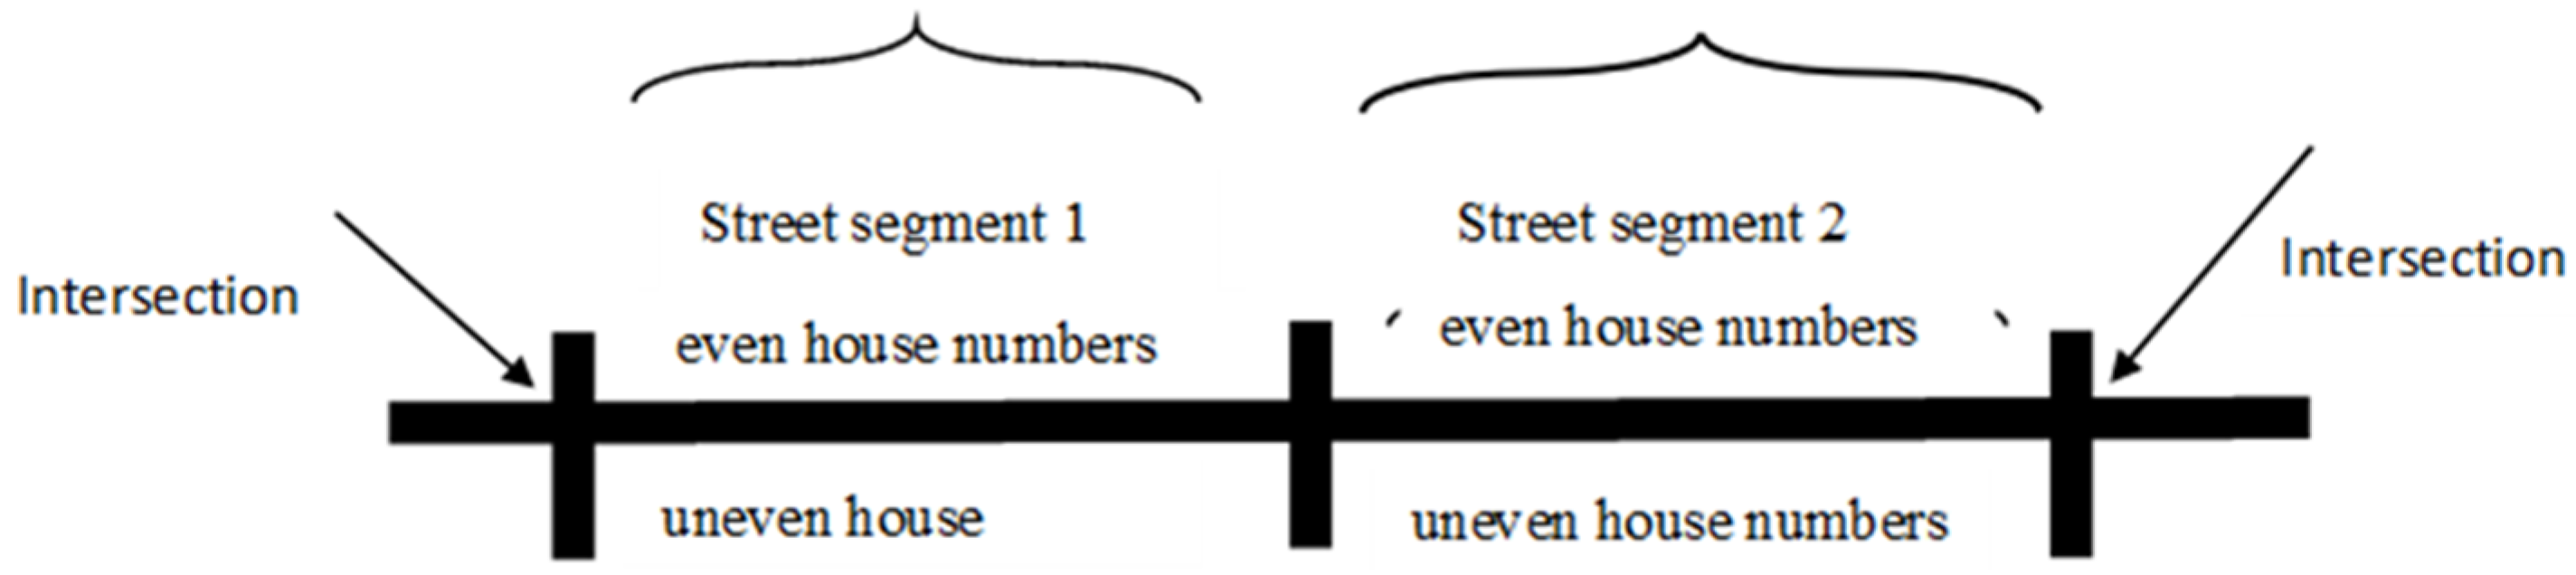
As streets vary in length and longer streets tend to differ in terms of the date of construction for the housing units and building style, it is more effective to work with street segments as the unit of analysis. Other research in other fields of study also use street segments as units of analysis, such as virtual street audits of front yards [18] or streetscapes studies [8,16], or studies related to crime behavior [17] or walking speed [18]. To make the analysis of different streets segments comparable, a conversation factor was used to recalculate the values for a 100 m street length. This recalculation of values for 100 m of street length was not discussed in other literature, but it was effective to compare the street segments.
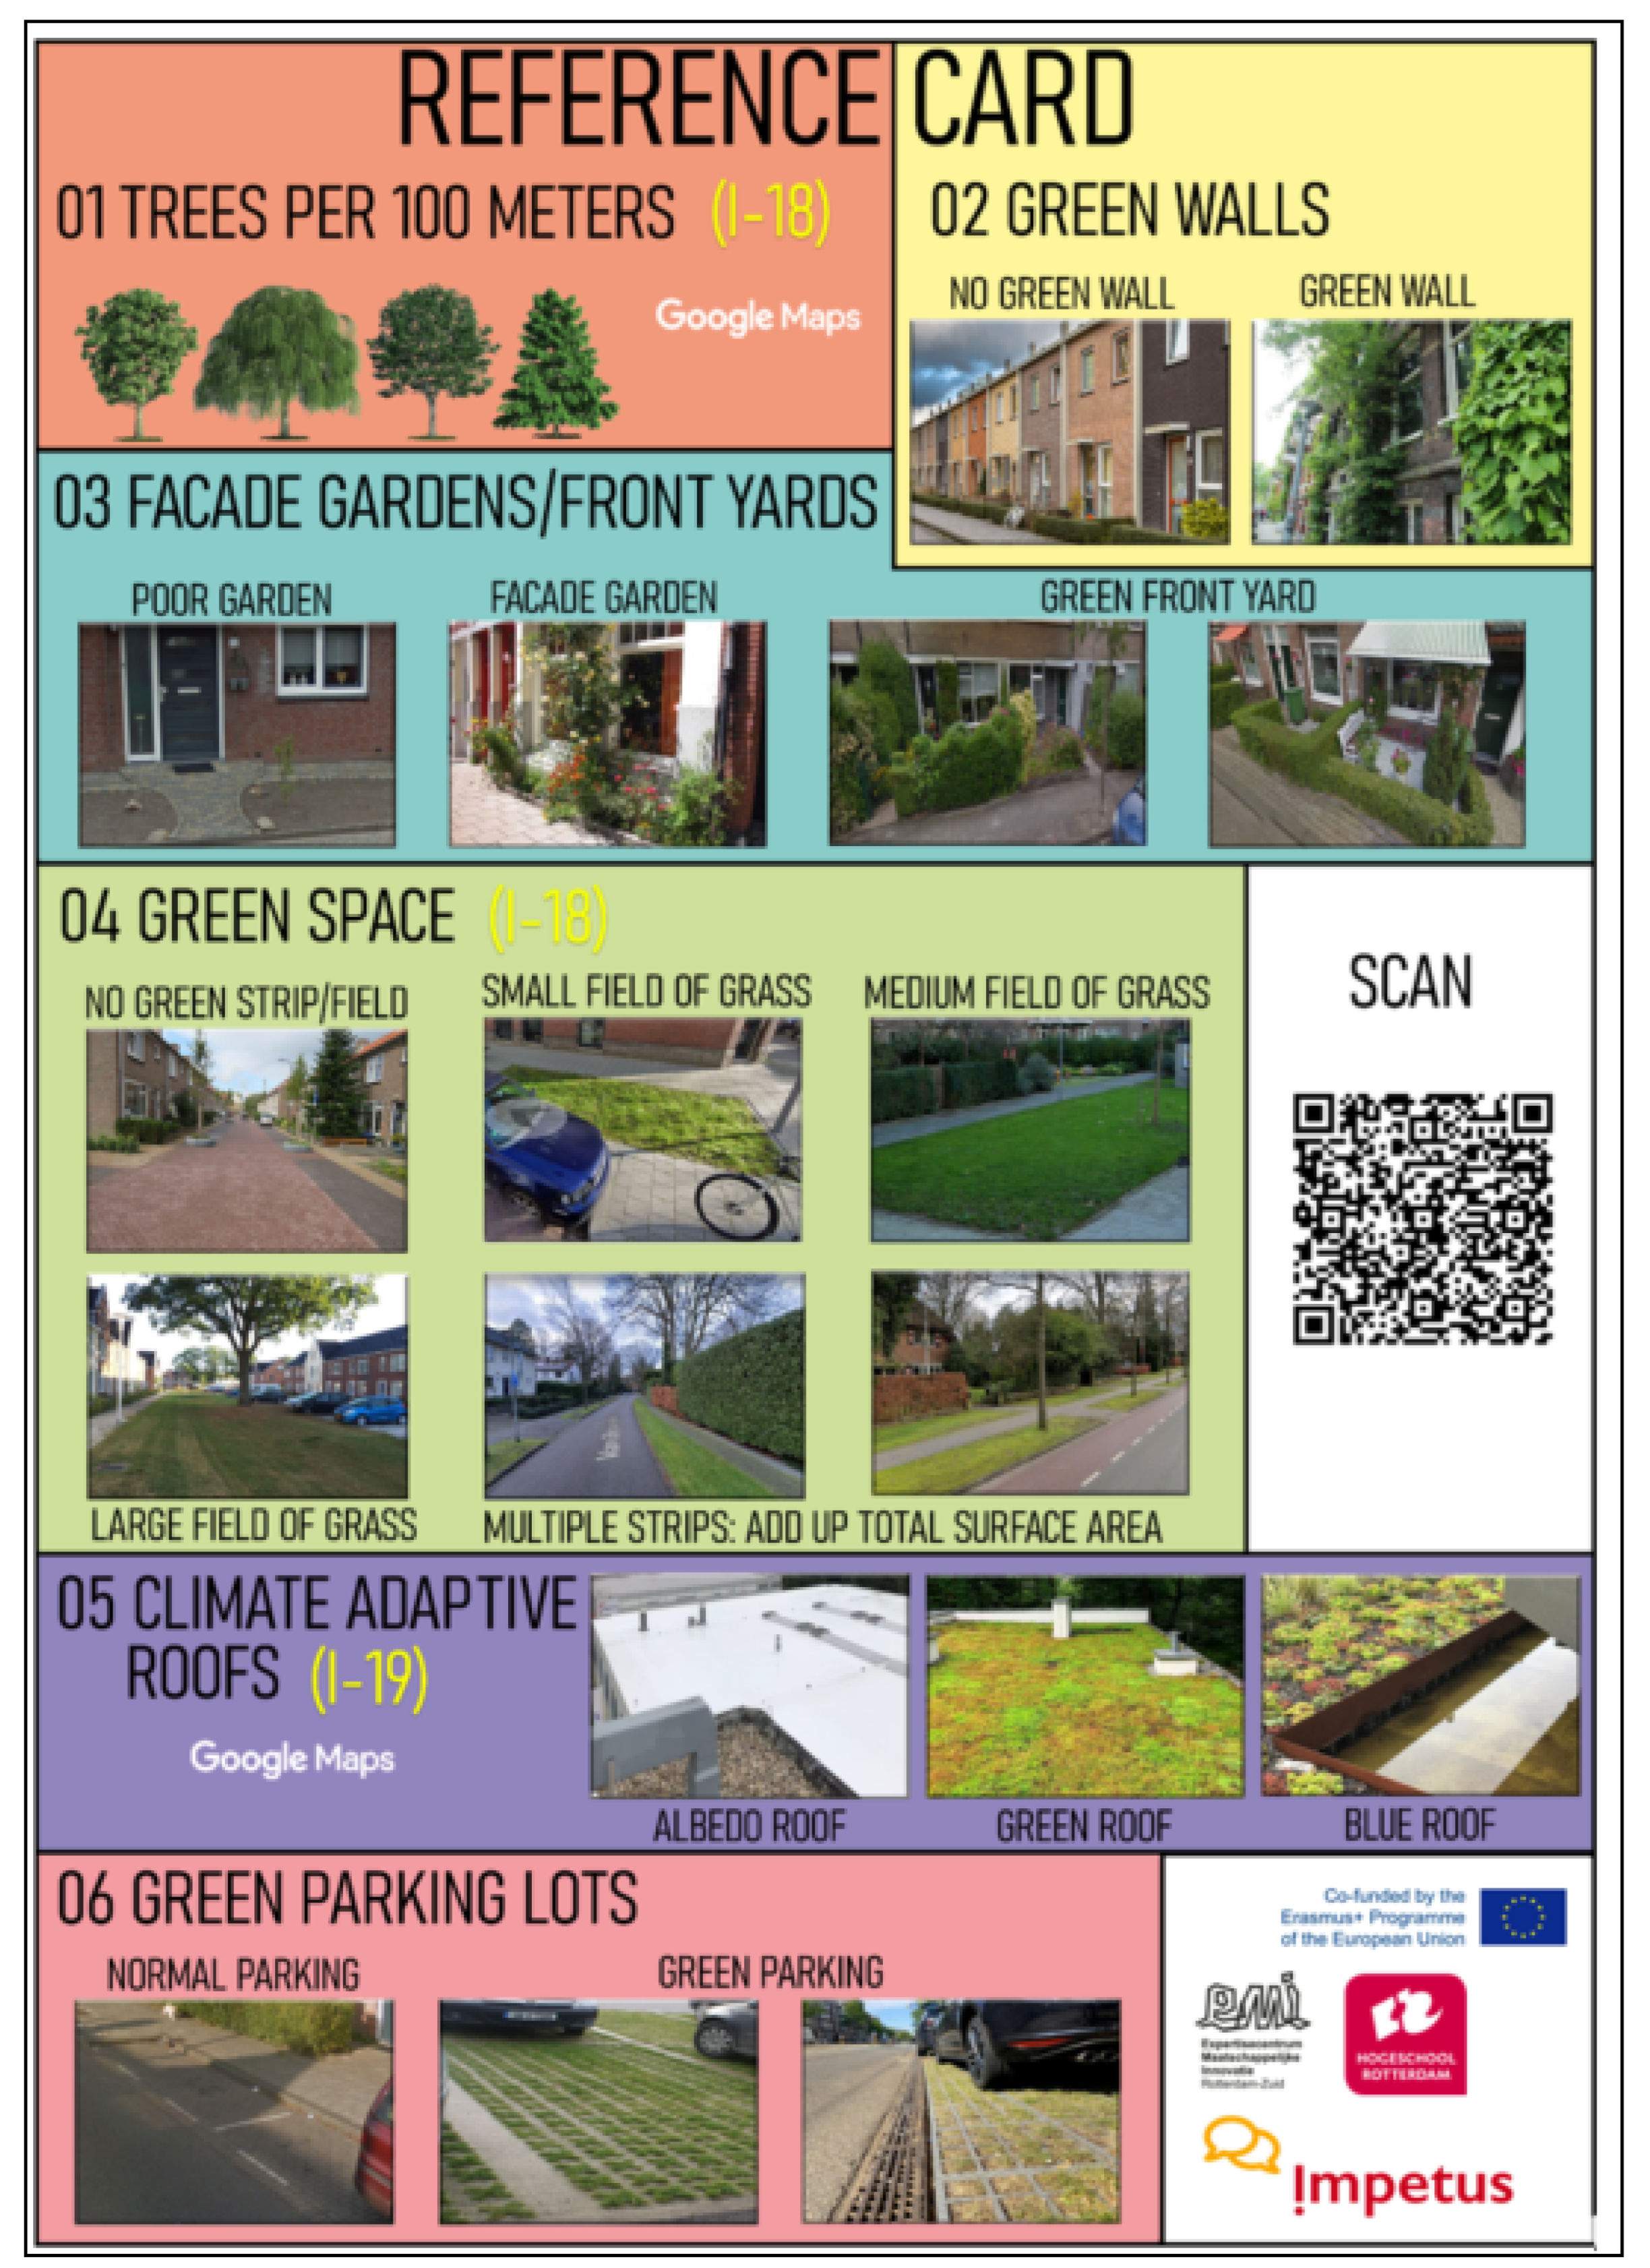
A literature review was undertaken and the most important climate adaptation measures were selected. The selected measures are not complete as many other climate adaptation measures were found in the literature and on websites about green and blue measures 6. The selection of climate adaptation measures was based on the most common measures that are present in Dutch streets and cities. The contribution of urban green infrastructure (UGI) to human well-being has been demonstrated in several studies.
The first selected climate adaptation measure was urban trees, as they represent a large portion of urban tree canopy and provide a significant amount of ecosystem services for mitigation of the negative environmental impact [20], and they improve the outdoor human thermal comfort and indoor environment [23]. Front yards in private residence play an important role in the soil sealing problem of cities worldwide [27]. The impervious cover of front yards contributes to the problems of the urban heat island effect and urban floods, and makes urban neighborhoods less pleasant. Private gardens play an important role as urban green spaces, and can improve the microclimate and address the impacts of climate change—specifically the urban heat island (UHI) effect. Green strips constitute similar benefits as front yards.
Climate adaptive roofs are green roofs, roofs with a high albedo (highly reflective roofs, which absorb less heat [38]), and blue roofs. Green roofs were chosen as an upcoming adaptive measure that can easily be recognized on Google maps, because, from above, plants/grass and other greenery can be spotted. Green parking spaces are an upcoming climate adaptive measure and they differ from regular parking spaces because they allow the water to infiltrate and contribute significantly to reducing runoff [39]. If parking lots are made of porous paving materials, between the tiles of parking spots there are often patches of grass [44]. Rain barrels or rain water tanks store water and relieve some stress on the sewage system during heavy precipitation. Rain barrels delay the time that it takes for water to flow into the system. Water from a roof connected to a rain barrel does not flow immediately into the sewage system, and rain water harvesting can be used as a remedial measure and can help in flood reduction [41]. Water-permeable pavements are porous or laid so as to allow voids, have an open structure, or are made of partially pervious materials. They allow water to pass through or around them into the soil; rainwater can infiltrate into the ground, groundwater is replenished, and sewerage systems are relieved [44]. A bioswale is an adaptive measure that has the ability to store water during heavy rain and redirects surface water to groundwater [42]. The surface water nearby functions as natural water storage. If the surface water is located nearby and is lower than the street level, water can be channeled into the surface water with natural gravity, and is an important adaptive measure in times of heavy precipitation. If unpaved areas are present, they provide an additional storage capacity for precipitation and may provide cooling facilities through natural vegetation. Paved surfaces, however, especially parking lots, occupy a significant proportion of the horizontal surface area in cities. The low albedo of many of these parking lots contribute to the urban heat island (UHI) and affect the local microclimate around them. Parking spaces heat up during the day and contribute to a higher temperature. At night, these warm surfaces contribute to the urban heat island effect. Similarly, impermeable “grey” driving lanes with a low permeability similarly to the grey parking spaces occupy a significant proportion of the horizontal surface area in cities. At night, these warm surfaces contribute to the urban heat island effect [44].
The weight that was given to the different climate adaptive measures is based on their perceived impact to address the impacts of climate change and address heat stress and water management problems. After testing the scorecard with different weights, the maximum score for the urban trees measure was set at 40. Three different categories were given a different number of points. The maximum score for urban trees was 40 points, or 40% of the maximum score. Green walls is a less common adaptive measure and this was given a maximum of 4 points or 4% weight. Façade gardens/front yards were given a maximum of 16 points or 16% weight. Green strips were given 13 points, or 13% weight. Climate adaptive roofs were given 2 points, or 2% weight. Green parking places were given 2 points or 2% weight. Rain barrels were given one point or 1% weight. Permeable pavements were given 3 points, or 3% weight. Bioswale was given 6 points or 6% weight. Surface water was given 6 points or 6% weight. Shaded areas/artificial shade were given 2 points 2%. There was a deduction of 2 points for the presence of designated parking areas, or 2% weight, and a deduction of 1 point per soil sealed driving lane or 2% of the weight.
The weight that was given to the climate adaptation measures was mainly given after testing several times with different weights for each factor. An important criterium for the future successful application of the scorecard is easy assessment and the scorecard should be able to distinguish adaptive from none adaptive streets. (Large) Trees are an important factor for reducing heat stress and water storage in roots and leaves. After testing, the maximum score and weight for trees was set at 40%. Façade gardens and front yards are also an important factor in climate adaptation and provide a lot of ecosystem services. The weight was set at 16% after testing. Similarly, the weight for green strips was set at 13%. The other climate adaptive measures were set at lower weights.
The feedback from the community members that participated in the climate adaptation training in Rotterdam was that the scorecard method gave them insights into the lack of adaptation measures in their street and neighborhood, as well as the lack of ecosystem services in their outdoor living environment. The community members mentioned that the scorecard method enabled them to better understand climate change and the local effects, as well as the actions they could take themselves to address the effects of climate change in their locality with simple measures, such as green yards, more facade gardens, planting trees, and increasing the infiltration capacity. They could also see which streets are greener and are better prepared for the effects of climate change, which, according to the community members, puts them in a better position and leaves them better prepared to discuss these issues with the local government.
A weakness of this method is that after the comparative study between the two districts in Groningen and Rotterdam, it became clear that some measures were not present at all in the two districts. In the green category, these were climate adaptive roofs and green parking lots. In the blue category, these were rain barrels, permeable streets and sidewalks, bioswales, and surface water. For the scorecard 2.0, these adaptive measures could be left out of the scorecard. Bio swales and other climate adaptation measures can be linked to climatescan [53] during future climatecafes [54] and city scan activities [55]. The three categories, namely green, blue, and grey measures, could be omitted in scorecard 2.0 as the distinction between the categories was not relevant for the scorecard. Another weakness is that the weights of the different measures was not based on the geospatial data analysis, but through ocular inspection. Although, for the purpose of this scorecard, namely creating awareness and being easy to use by stakeholders in the community, this suffices.
The scores—numerical values—are non-dimensional and the scores are interpreted by the user. A reference card with reference pictures has been provided in order to reduce the chance of different interpretations. Different users of the method may interpret climate adaptive measures, for example the height of the trees, differently, which could lead to inaccurate scoring. However, as the scores were non-dimensional, and the scores were mainly used for comparing the different streets with each other in other to identify adaptation gaps, this might not impose a serious problem.

5. Conclusions

The objective of this study was to test a method that assesses the presence of climate adaptive measures in street segments and streets, and to provide a score between 1 and 100 that indicates to what degree the street is climate adaptive. Based on the score, a label can be given between A+++ and G, so that residents and decision makers are aware which streets are adaptive and which streets have an adaptation potential. In the Paddepoel North district in the city of Groningen, 17 streets were assessed, composed of 45 street segments with an average climate adaptiveness score of 47. In the Hillesluis district in the city of Rotterdam, 21 streets were assessed, composed of 21 streets with an average score of 29 points. The climate adaptive measures that were observed in the street segments were tabulated and each climate adaptive measure was given a weight based on the perceived ecosystem service of the measure. Based on the adaptive measures multiplied by the weight, a score for a street segment could be given. Each score corresponds with a climate adaptation label.
The results show that the method is useful to score street segments and to attach labels to streets segments and entire streets, so that residents that live in these communities are aware of the level of adaptation of their street. Similarly, local governments and other stakeholders know which streets score low and which streets have a larger adaptation “potential”.
The study developed and tested a new method to label the level of adaptation of street segments and entire streets, so that streets can be compared with each other. The method was proven to be relatively simple and useful for street assessments, as the assessment was done after a short training with several community groups in the Hillesluis district in Rotterdam. The method can easily be duplicated and used by local governments and community groups in order to have better insight into the level of climate adaptation of their street. Labels for entire streets can be used to encourage residents to take action and expand the number of climate adaptation measures in their own street.

Author Contributions

Conceptualization, R.H., P.d.R., E.O. and A.v.d.H.; Investigation, R.H., A.I. and P.d.R.; Methodology, R.H.; Supervision, R.H., E.O. and A.v.d.H.; Visualization, A.I.; Writing—original draft, R.H.; Writing—review & editing, F.B. All authors have read and agreed to the published version of the manuscript.

Funding

This study would not have been possible without funding from the Erasmus+ Programme of the European Union and collaboration within the IMPETUS project, “Innovative Measurement Tool towards Urban Environmental Awareness”, the SIA-RAAK grant from the Taskforce for Applied Research SIA within the project “Citizen Participation in Climate Adaptation” and without the support of the Centre of Expertise Social Innovation (EMI) in Rotterdam and the research atelier Urban Cool Island. We thank the municipality Rotterdam and municipality Groningen for support for this work. The European Commission’s, SIA RAAK’s and EMI’s support for the production of this publication does not constitute an endorsement of the contents, which reflect the views only of the authors, and the Commission or SIA RAAK cannot be held responsible for any use that may be made of the information contained therein.

Conflicts of Interest

The authors declare no conflict of interest.

References

  1. Intergovernmental Panel on Climate change (IPCC). Climate Change 2022, Impacts, Adaptation and Vulnerability; Cambridge University Press: Cambridge, UK; New York, NY, USA, 2022. [Google Scholar]
  2. Intergovernmental Panel on Climate change IPCC. Climate Change 2021, The Physical Science Basis; Cambridge University Press: Cambridge, UK, 2021. [Google Scholar]
  3. NASA. Analyses Reveal 2019 Second Warmest Year on Record 2020. Available online: https://climate.nasa.gov/news/2945/nasa-noaa-analyses-reveal-2019-second-warmest-year-on-record/ (accessed on 14 August 2021).
  4. European Commssion. Forging a Climate-Resilient Europe—The New EU Strategy on Adaptation to Climate Change. In European Tctt, Parliament Tc, The European Economic And Social, Regions Catcot; European Commission: Brussels, Belgium, 2021. [Google Scholar]
  5. European Environmental Agency. Urban Sustainability in Europe-Opportunities for Challenging Times 2021. 14 August 2021. Available online: https://www.eea.europa.eu/publications/urban-sustainability-in-europe/urban-sustainability-in-europe (accessed on 19 September 2022).
  6. Urban Green Blue Grids for Resilient Cities. Green Facades n.d. Available online: www.urbangreenbluegrids.com (accessed on 7 July 2022).
  7. United Nations. World Urbanization Prospects, the 2018 Revision; United Nations: New York, NY, USA, 2019. [Google Scholar]
  8. Ki, D.; Lee, S. Analyzing the effects of Green View Index of neighborhood streets on walking time using Google Street View and deep learning. Landsc. Urban Plan. 2021, 205, 103920. [Google Scholar] [CrossRef]
  9. De Manuel, B.F.; Méndez-Fernández, L.; Peña, L.; Ametzaga-Arregi, I. A new indicator of the effectiveness of urban green infrastructure based on ecosystem services assessment. Basic Appl. Ecol. 2021, 53, 12–25. [Google Scholar] [CrossRef]
  10. Liu, O.Y.; Russo, A. Assessing the contribution of urban green spaces in green infrastructure strategy planning for urban ecosystem conditions and services. Sustain. Cities Soc. 2021, 68, 102772. [Google Scholar] [CrossRef]
  11. Berke, P.; Kates, J.; Malecha, M.; Masterson, J.; Shea, P.; Yu, S. Using a resilience scorecard to improve local planning for vulnerability to hazards and climate change: An application in two cities. Cities 2021, 119, 103408. [Google Scholar] [CrossRef]
  12. Dianat, H.; Wilkinson, S.; Williams, P.; Khatibi, H. Planning the resilient city: Investigations into using “causal loop diagram” in combination with “UNISDR scorecard” for making cities more resilient. Int. J. Disaster Risk Reduct. 2021, 65, 102561. [Google Scholar] [CrossRef]
  13. Khazai, B.; Anhorn, J.; Burton, C.G. Resilience Performance Scorecard: Measuring urban disaster resilience at multiple levels of geography with case study application to Lalitpur, Nepal. Int. J. Disaster Risk Reduct. 2018, 31, 604–616. [Google Scholar] [CrossRef]
  14. Labdaoui, K.; Mazouz, S.; Moeinaddini, M.; Cools, M.; Teller, J. The Street Walkability and Thermal Comfort Index (SWTCI): A new assessment tool combining street design measurements and thermal comfort. Sci. Total Environ. 2021, 795, 148663. [Google Scholar] [CrossRef] [PubMed]
  15. Heikoop, T. Assessing soil sealing and ecosystem services of urban front yards using Google Street View: A case study in Bloemhof district Rotterdam, the Netherlands. IOP Conf. Ser. Earth Environ. Sci. 2022, 955, 012019. [Google Scholar] [CrossRef]
  16. Hanibuchi, T.; Nakaya, T.; Inoue, S. Virtual audits of streetscapes by crowdworkers. Health Place 2019, 59, 102203. [Google Scholar] [CrossRef] [PubMed]
  17. Weisburd, D.; Bushway, S.; Lum, C.; Yang, S.M. Trajectories of crime at places: A longitudinal study of street segments in the city of Seattle. Criminology 2004, 42, 283–322. [Google Scholar] [CrossRef]
  18. Forde, A.; Daniel, J. Pedestrian walking speed at un-signalized midblock crosswalk and its impact on urban street segment performance. J. Traffic Transp. Eng. 2020, 8, 57–69. [Google Scholar] [CrossRef]
  19. Buijs, J.M.; Terpstra, T.; van den Heuvel, J.; Roest, A.; Boogaard, F.; van der Maas, P.M.F.; Fliervoet, J.M.; Witteveen, L.M.; Baan, F.; Heikoop, R.; et al. Burgerparticipatie in Klimaatadaptatie, Praktijkgericht Onderzoek over Hittemetingen in Wijken, Beleving van Extreem Weer en Participatie in Klimaatadaptatie; HZ University of Applied Sciences: Vlissingen, The Netherlands, 2021. [Google Scholar]
  20. Klobucar, B.; Sang, N.; Randrup, T.B. Comparing ground and remotely sensed measurements of urban tree canopy in private residential property. Trees For. People 2021, 5, 100114. [Google Scholar] [CrossRef]
  21. World Health Organization, Regional Office for Europe. Urban Green Spaces and Health; WHO: Copenhagen, Denmark, 2016. [Google Scholar]
  22. Wang, Y.; Bakker, F.; de Groot, R.; Wortche, H.; Leemans, R. Effects of urban trees on local outdoor microclimate: Synthesizing field measurements by numerical modelling. Urban Ecosyst. 2015, 18, 1305–1331. [Google Scholar] [CrossRef]
  23. Wang, Y.; Bakker, F.; de Groot, R.; Wörtche, H. Effect of ecosystem services provided by urban green infrastructure on indoor environment: A literature review. Build. Environ. 2014, 77, 88–100. [Google Scholar] [CrossRef]
  24. Bouwbesluit. Nota van Toelichting op Bouwbesluit 2003. 2003. Available online: https://www.bouwbesluitonline.nl/docs/wet/bb2003_nvt/artikelsgewijs/hfd4/afd4-6 (accessed on 1 August 2022).
  25. Cameron, R.W.F.; Taylor, J.E.; Emmett, M.R. What’s ‘cool’ in the world of green façades? How plant choice influences the cooling properties of green walls. Build. Environ. 2014, 73, 198–207. [Google Scholar] [CrossRef]
  26. Li, H.; Zhao, Y.; Sützl, B.; Kubilay, A.; Carmeliet, J. Impact of green walls on ventilation and heat removal from street canyons: Coupling of thermal and aerodynamic resistance. Build. Environ. 2022, 214, 108945. [Google Scholar] [CrossRef]
  27. Laćan, I.; Moanga, D.; McBride, J.R.; Butsic, V. “Sealed in San José”: Paving of front yards diminishes urban forest resource and benefits in low-density residential neighborhoods. Urban For. Urban Green. 2020, 54, 126755. [Google Scholar] [CrossRef]
  28. European Commission. Communication from the Commission to the European Parliament, the Council, the European Economic and Social Committee and the Committee of the Regions. An EU Strategy On Adaptation to Climate Change; European Commission: Brussels, Belgium, 2013. [Google Scholar]
  29. European Commission. Green Infrastructure (GI)—Enhancing Europe’s Natural Capital; European Commission: Brussels, Belgium, 2013. [Google Scholar]
  30. Stobbelaar, D.J.; van der Knaap, W.; Spijker, J. Greening the City: How to Get Rid of Garden Pavement! The ‘Steenbreek’ Program as a Dutch Example. Sustainability 2021, 13, 3117. [Google Scholar] [CrossRef]
  31. Rotterdam, G. Subsidie klimaatadaptatie tot €1500. In Rotterdam Weather Word; Subsidie Klimaatadaptatie|Rotterdam.nl: Rotterdam, The Netherlands, 2021. [Google Scholar]
  32. European Commission. Soil Sealing In-Depth Report; European Commission: Brussels, Belgium, 2012. [Google Scholar]
  33. Chen, Y.-C.; Chen, Z.-A. Water retention capacity and runoff peak flow duration of the urban food garden: A city-based model and field experiment. Ecol. Eng. 2021, 159, 106073. [Google Scholar] [CrossRef]
  34. Global Commission on Adaptation. Adapt Now: A Global Call for Leadership on Climate Resilience; Global Commission on Adaptation: Rotterdam, The Netherlands, 2019. [Google Scholar]
  35. Young, C.; Hofmann, M.; Frey, D.; Moretti, M.; Bauer, N. Psychological restoration in urban gardens related to garden type, biodiversity and garden-related stress. Landsc. Urban Plan. 2020, 198, 103777. [Google Scholar] [CrossRef]
  36. Mimet, A.; Kerbiriou, C.; Simon, L.; Julien, J.-F.; Raymond, R. Contribution of private gardens to habitat availability, connectivity and conservation of the common pipistrelle in Paris. Landsc. Urban Plan. 2020, 193, 103671. [Google Scholar] [CrossRef]
  37. Rotterdam Make It Happen. A Thousand Facade Gardens in Rotterdam, n.d. Available online: https://rotterdammakeithappen.nl/en/rotterdam-zet-door/a-thousand-facade-gardens-in-rotterdam/ (accessed on 13 May 2021).
  38. Akbari, H.; Pomerantz, M.; Taha, H. Cool surfaces and shade trees to reduce energy use and improve air quality in urban areas. Sol. Energy 2001, 70, 295–310. [Google Scholar] [CrossRef]
  39. Yoders, J. The Cell’ ballpark in Chicago gets nation’s largest permeable parking lot. Build. Des. Constr. 2008, 49, 8. [Google Scholar]
  40. Liu, Q.; Liu, S.; Hu, G.; Yang, T.; Du, C.; Oeser, M. Infiltration Capacity and Structural Analysis of Permeable Pavements for Sustainable Urban: A Full-scale Case Study. J. Clean. Prod. 2021, 288, 125111. [Google Scholar] [CrossRef]
  41. Akter, A.; Tanim, A.H.; Islam, M.K. Possibilities of urban flood reduction through distributed-scale rainwater harvesting. Water Sci. Eng. 2020, 13, 95–105. [Google Scholar] [CrossRef]
  42. Veciana, J.M. SME’s: Internationalization, Networks, and Strategy; Avebury: Aldershot, UK; Brookfield, VT, USA, 1994; 717p. [Google Scholar]
  43. Speak, A.; Montagnani, L.; Wellstein, C.; Zerbe, S. The influence of tree traits on urban ground surface shade cooling. Landsc. Urban Plan. 2020, 197, 103748. [Google Scholar] [CrossRef]
  44. Sen, S.; Fernandèz, J.P.R.M.z.-R.; Roesler, J. Reflective Parking Lots for Microscale Urban Heat Island Mitigation. Transp. Res. Rec. 2020, 2674, 663–671. [Google Scholar] [CrossRef]
  45. Allecijfers.nl. Informatie Buurt Hillesluis. 2021. Available online: https://allecijfers.nl/buurt/hillesluis-rotterdam/ (accessed on 16 June 2022).
  46. Allecijfers.nl. Informatie Buurt Feijenoord. 2022. Available online: https://allecijfers.nl/buurt/feijenoord-rotterdam/ (accessed on 10 September 2022).
  47. Google Maps. “Westerbeekstraat”. 2022. Available online: https://www.google.nl/maps/place/Westerbeekstraat,+Rotterdam/@51.8936078,4.5142399,151m/data=!3m1!1e3!4m5!3m4!1s0x47c433078fd70a11:0x7eb9ed7ef8e14934!8m2!3d51.8936332!4d4.5142986?hl=en (accessed on 1 September 2022).
  48. Google Earth. “Zaadakkerstraat”. 2022. Available online: https://earth.google.com/web/search/zaadakkerstraat/@51.89511243,4.51552295,7.41969002a,175.06410479d,35y,-99.51456689h,44.99715762t,0r/data=CigiJgokCbr31b8N8klAEduWkjz28UlAGRDqjaYeERJAIfTY6xRVDxJA (accessed on 5 September 2022).
  49. AllCijfers.nl. Informatie Postcode 9742. 2021. Available online: https://allecijfers.nl/postcode/9742/#bouwjaar-woningen (accessed on 4 June 2022).
  50. Alle Cijfers. Paddepoel Noord Groningen. 2021. Available online: https://allecijfers.nl/buurt/paddepoel-noord-groningen/ (accessed on 4 June 2022).
  51. Google Earth Pro. “Morgensterlaan.”N53°”13’ 59.52 2020. Available online: https://earth.google.com/web/search/morgensterlaan/@53.23344987,6.5434176,8.05743311a,143.99594668d,35y,154.62278529h,44.99708789t,0r/data=CnkaTxJJCiUweDQ3YzljZDE2MGY5ZDk3Njk6MHg0YzBiMGFjM2ZhN2MxYzY1GeGJalvenUpAIfO6j-3GLBpAKg5tb3JnZW5zdGVybGFhbhgCIAEiJgokCT1EI6a28klAEdPxgPFi8klAGbRWX6PlEBJAIQlnIBKnDRJA (accessed on 19 September 2022).
  52. Google Maps. “Capellastraat”. 2022. Available online: https://www.google.nl/maps/place/Capellastraat,+9742+LK+Groningen,+Netherlands/@53.2295921,6.5347402,637m/data=!3m2!1e3!4b1!4m10!1m2!2m1!1scapellastraat!3m6!1s0x47c9cd3cefe69b39:0xdc413cba46129270!8m2!3d53.2295922!4d6.5392195!15sCg1jYXBlbGxhc3RyYWF0kgEFcm91dGXgAQA!16s%2Fg%2F1w6_n24k?hl=en (accessed on 6 June 2022).
  53. Restemeyer, B.; Boogaard, F.C. Potentials and Pitfalls of Mapping Nature-Based Solutions with the Online Citizen Science Platform ClimateScan. Land 2021, 10, 5. [Google Scholar] [CrossRef]
  54. Boogaard, F.C.; Venvik, G.; Pedroso de Lima, R.L.; Cassanti, A.C.; Roest, A.H.; Zuurman, A. ClimateCafé: An Interdisciplinary Educational Tool for Sustainable Climate Adaptation and Lessons Learned. Sustainability 2020, 12, 3694. [Google Scholar] [CrossRef]
  55. Heikoop, R.; Boogaard, F. City-Scan Rotterdam: A Method to Assess Climate Change Vulnerabilities at Street and Neighborhood Level. Paper Presented at the Adaptation Futures, Cape Town. 2018. Available online: https://openbooks.uct.ac.za/uct/catalog/download/20/27/925?inline=1 (accessed on 1 September 2022). [CrossRef]
Figure 1. Street segment.
Sustainability 14 12425 g001
Figure 2. Climate adaptation labels.
Sustainability 14 12425 g002
Figure 3. Reference card, front.
Sustainability 14 12425 g003
Figure 4. Reference card, back.
Sustainability 14 12425 g004
Figure 5. Location of case studies.
Sustainability 14 12425 g005
Figure 6. Visualization of labels for the Hillesluis district.
Sustainability 14 12425 g006
Figure 7. Westerbeekstraat [47].
Sustainability 14 12425 g007
Figure 8. Westerbeekstraat [47].
Sustainability 14 12425 g008
Figure 9. Zaadakkerstraat [48].
Sustainability 14 12425 g009
Figure 10. Zaadakkerstraat [48].
Sustainability 14 12425 g010
Figure 11. 2 Visualization of labels the Paddepoel North district.
Sustainability 14 12425 g011
Figure 12. Morgensterlaan [51].
Sustainability 14 12425 g012
Figure 13. Morgensterlaan [51].
Sustainability 14 12425 g013
Figure 14. Capellastraat [52].
Sustainability 14 12425 g014
Table 1. Climate adaptation measures and weight.
CategoryMeasureMaximum Score
Green categoryUrban trees+40
Green categoryGreen walls+4
Green categoryFaçade gardens/front yards+16
Green categoryGreen strips+13
Green categoryClimate adaptive roofs+2
Green categoryGreen parking spaces+2
Blue categoryRain barrels+1
Blue categoryPermeable pavement+3
Blue categoryBioswale+6
Blue categorySurface water+6
Grey categoryShaded areas, natural or artificial+2
Grey categoryAdditional grey parking spaces−2 to +2
Grey categoryUnpaved surfaces+2
Grey categorySoil sealed driving lanes+ 1 or −1 per lane
Table 2. Scores per segment in the Hillesluis district.
Name of the StreetSegment 1Segment 2Segment 3Segment 4Total Score
Imobilialaan51 51
Imobiliastraat24 24
Zeeuwsestraat3 3
Vlasakkerstraat10374214103
Drentsestraat487 55
Riederstraat35 35
Overijsselsestraat2750720104
Utrechtsestraat20 20
Hollandsestraat64372875
Donkerslootstraat2452 76
Riederlaan6337 100
Zaadakkerstraat5 5
Westerbeekstraat284543 116
Friesestraat24 24
Brabantsestraat32 32
Breeweg50 50
Beijerlandsestraat4541 86
West-Varkenoordseweg362933 98
Beukelaarsstraat1239 51
Blokweg2817 45
Beverstraat133824 75
Total number of segments:42
Total score:1228
Average segment score:29
Table 3. Hillesluis district green category results per street segment.
PointsBeverstraat Segment 1Beverstraat Segment 2Beverstraat Segment 3Blokweg Segment 1Blokweg Segment 2Beukelaarsstraat Segment 1Beukelaarsstraat Segment 2West-Varkenoordseweg Segment 1West-Varkenoordseweg Segment 2West-Varkenoordseweg Segment 3Beijerlandsestraat Segment 1Beijerlandsestraat Segment 2Breeweg Segment 1Brabantse Straat Segment 1Friesestraat Segment 1Westerbeek Segment 1Westerbeek Segment 2Westerbeek Segment 3Zaadakkerstraat Segment 1Riederlaan Segment 1Riederlaan Segment 2Donkerslootstraat Segment 1Donkerslootstraat Segment 2Hollandsestraat Segment 1Hollandsestraat Segment 2Hollandsestraat Segment 3Hollandsestraat Segment 4Utrechtsestraat Segment 1Overijsselsestraat Segment 1Overijsselsestraat Segment 2Overijsselsestraat Segment 3Overijsselsestraat Segment 4Riederstraat Segment 1Drentsestraat Segment 1Drentsestraat Segment 2Vlasakkerstraat Segment 1Vlasakkerstraat Segment 2Vlasakkerstraat Segment 3Vlasakkerstraat Segment 4Zeeuwsestraat Segment 1Imobiliastraat Segment 1Imobilialaan Segment 1
Trees per 100 m street length
No trees+0 0 0 0
Tree height 0–10 m+2 302102014 616 122241010 42 4 102 10 6 6 212
Tree height 10–15 m+3 3 243324321 15321366 3 6309 64232 38 9
Tree height 15+ meter, +48 244 36402828 281281563164927228164 24 12 8 4 128 464
Streetlength 228
factor 2,3
Maximum of 40 points 4053122111583121141831334019212033223403427311073317112040081940092227701240
Green wall
No green wall +0000 0000000000000 0000 0000000000000000
1–25% of walls+1 101 11 1
25–50% of walls+2
50–75% of walls+3
75–100% of walls+4
Facade garden/front yard
No facade garden/no front yard+0 0 0 0 00 0 0 0 0
1–50% facade garden+5 555 5555 55 5 5 5 5 5 5 55555
50–100% facade garden+6 6 6
1–25% green front yard+1010 10 10 10 10 10 10
25–50% green front yard+12
50–75% green front yard+14 1414 1414
75–100% green front yard+16
Green strips
No green strip +00 0 000 0 00 000000 00 00 0 00 0000
Green strip (1 m2–25 m2)+9 9 9
Green strip (25 m2–100 m2)+11 11 11 11 11
Green strip (>100 m2)+13 13 131313 13 13 13 13 13 1313
Climate adaptive roofs
No climate adaptive roofs +0000000000000 00000000000000000000000000000
Adaptive roofs 1–50% +1
Adaptive roofs 50–100% +2
Green parking lots
No green parking lots +0000000000000000000000000000000000000000000
1–50% green parking +1
50–100% green parking +2
Max possible points 77154027302015413932364743533526306036847402736237393016305310193351101440451252654
Table 4. Hillesluis district blue category scores per street segment.
PointsBeverstraat Segment 1Beverstraat Segment 2Beverstraat Segment 3Blokweg Segment 1Blokweg Segment 2Beukelaarsstraat Segment 1Beukelaarsstraat Segment 2West-Varkenoordseweg segment 1West-Varkenoordseweg segment 2West-Varkenoordseweg segment 3Beijerlandsestraat Segment 1Beijerlandsestraat Segment 2Breeweg Segment 1Brabantse Straat Segment 1Friesestraat Segment 1Westerbeek Segment 1Westerbeek Segment 2Westerbeek Segment 3Zaadakkerstraat Segment 1Riederlaan Segment 1Riederlaan Segment 2Donkerslootstraat Segment 1Donkerslootstraat Segment 2Hollandsestraat Segment 1Hollandsestraat Segment 2Hollandsestraat Segment 3Hollandsestraat Segment 4Utrechtsestraat Segment 1Overijsselsestraat Segment 1Overijsselsestraat Segment 2Overijsselsestraat Segment 3Overijsselsestraat Segment 4Riederstraat Segment 1Drentsestraat Segment 1Drentsestraat Segment 2Vlasakkerstraat Segment 1Vlasakkerstraat Segment 2Vlasakkerstraat Segment 3Vlasakkerstraat Segment 4Zeeuwsestraat Segment 1Imobiliastraat Segment 1Imobilialaan Segment 1
Blue category
Rain barrels present
No rain barrels +0000000000000000000000000000000000000000000
1 or more rain barrels+1
Permeable pavement (street or sidewalk)
No permeable pavement in the street+0000000000000000000000000000000000000000000
Permeable pavement sidewalk+1
Permeable pavement street+2
Permeable pavement sidewalk and street+3
Bioswale
There is no bioswale nearby+0000000000000000000000000000000000000000000
A biowale can be found within 50 m of the street+6
Surface water
There is no surface water nearby+00000000000000000000 00 0000 0000000000 000
Surface water can be found within 50 m of the street+6 6 6 6 6
Max possible points (Blue category) 16000000000000000000060060000600000000006000
Table 5. Hillesluis district grey category scores per street segment.
Bonus and DeductionPointsBeverstraat Segment 1Beverstraat Segment 2Beverstraat Segment 3Blokweg Segment 1Blokweg Segment 2Beukelaarsstraat Segment 1Beukelaarsstraat Segment 2West-Varkenoordseweg segment 1West-Varkenoordseweg segment 2West-Varkenoordseweg segment 3Beijerlandsestraat Segment 1Beijerlandsestraat Segment 2Breeweg Segment 1Brabantse Straat Segment 1Friesestraat Segment 1Westerbeek Segment 1Westerbeek Segment 2Westerbeek Segment 3Zaadakkerstraat Segment 1Riederlaan Segment 1Riederlaan Segment 2Donkerslootstraat Segment 1Donkerslootstraat Segment 2Hollandsestraat Segment 1Hollandsestraat Segment 2Hollandsestraat Segment 3Hollandsestraat Segment 4Utrechtsestraat Segment 1Overijsselsestraat Segment 1Overijsselsestraat Segment 2Overijsselsestraat Segment 3Overijsselsestraat Segment 4Riederstraat Segment 1Drentsestraat Segment 1Drentsestraat Segment 2Vlasakkerstraat Segment 1Vlasakkerstraat Segment 2Vlasakkerstraat Segment 3Vlasakkerstraat Segment 4Zeeuwsestraat Segment 1Imobiliastraat Segment 1Imobilialaan Segment 1
Shaded areas (canopy)
No shaded areas present+0 00 0 0 000 00
Shades from trees (canopy)+11111 1111111 1111 11110011111011 11 11
Artifical shade provision +2
Total value 1111 11111111 1111 1111 11111 11 11 11
If present, unpaved surface located lower than paved surface
Unpaved surface is located higher than paved surface+0000000000000000000000000000000000000000000
Unpaved surface is located lower than paved surface+2
Total value 000000000000000000000000000000000000000000
Parking spaces
Cars are parked in the street (no designated parking spaces) 0 0
Car free street+2
Designated parking spaces are present −2−2−2−2−2−2−2−2−2−2−2−2−2−2−2−2−2−2−2−2−2−2−2−2−2−2−2−2−2−2−2−2−2−2−2−2−2−2−2−2 −2−2
2−2−2−2−2−2−2−2−2−2−2−2−2−2−2−2−2−2−2−2−2−2−2−2−2−2−2−2−2−2−2−2−2−2−2−2−2−2−2−20−2−2
Driving lanes
Car free street+1
1 point deduction per driving lane −1−1−1−2−1−1−1−1−2−2−2−1−1−2−1−1−1−1−1−1−1−2−2−2−2−1−1−1−1−2−2−1−1−1−1−1−2−2−2−2−2−1−2
1−1−1−2−1−1−1−1−2−2−2−1−1−2−1−1−1−1−1−1−1−2−2−2−2−1−1−1−1−2−2−1−1−1−1−1−2−2−2−2−2−1−2
Max possible points (Grey category) 7−2−2−3−2−3−3−2−3−4−3−2−2−3−3−2−2−2−2−3−2−3−3−3−4−3−2−2−2−3−3−3−2−2−3−3−4−3−3−4−2−2−3
Table 6. Total score street segments in the Hillesluis district.
PointsBeverstraat Segment 1Beverstraat Segment 2Beverstraat Segment 3Blokweg Segment 1Blokweg Segment 2Beukelaarsstraat Segment 1Beukelaarsstraat Segment 2West-Varkenoordseweg Segment 1West-Varkenoordseweg Segment 2West-Varkenoordseweg Segment 3Beijerlandsestraat Segment 1Beijerlandsestraat Segment 2Breeweg Segment 1Brabantse Straat Segment 1Friesestraat Segment 1Westerbeek Segment 1Westerbeek Segment 2Westerbeek Segment 3Zaadakkerstraat Segment 1Riederlaan Segment 1Riederlaan Segment 2Donkerslootstraat Segment 1Donkerslootstraat Segment 2Hollandsestraat Segment 1Hollandsestraat Segment 2Hollandsestraat Segment 3Hollandsestraat Segment 4Utrechtsestraat Segment 1Overijsselsestraat Segment 1Overijsselsestraat Segment 2Overijsselsestraat Segment 3Overijsselsestraat Segment 4Riederstraat Segment 1Drentsestraat Segment 1Drentsestraat Segment 2Vlasakkerstraat Segment 1Vlasakkerstraat Segment 2Vlasakkerstraat Segment 3Vlasakkerstraat Segment 4Zeeuwsestraat Segment 1Imobiliastraat Segment 1Imobilialaan Segment 1Average
Total score 100133824281712393639334541503224285834551372439194372820275071731487103742143245129
Table 7. Scores per segment Paddepoel North district.
Name of the StreetSegment 1Segment 2Segment 3Segment 4Total Score
Morgensterlaan6970 139
Mercuriusstraat61 61
Kometenstraat5125 76
Capellastraat2223 45
Wegalaan465064 160
Siriusstraat363647 119
Spicastraat2851 79
Poolsterlaan596661 186
Plutolaan464066 152
Venuslaan40626029191
Regulusstraat5351 104
Jupiterstraat633735 135
Avondsterlaan555146 152
Planetenlaan646864 196
Neptunusstraat223225 79
Uranusstraat432535 103
Marsstraat583342 133
Number of segments:45
Total score:2110
Average segment score:47
Table 8. Paddepoel North district green category results per street segment.
ScoreMarsstraat Segment 1Marsstraat Segment 2Marsstraat Segment 3Uranus Straat Segment 1Uranus Straat Segment 2Uranus Straat Segment 3Neptunusstraat Segment 1Neptunusstraat Segment 2Neptunusstraat Segment 3Planetenlaan Segement 1Planetenlaan Segement 2Planetenlaan Segement 3Avondsterlaan Segement 1Avondsterlaan Segement 2Avondsterlaan Segement 3Jupiterstraat Segment 1Jupiterstraat Segment 2Jupiterstraat Segment 3Regulusstraat Segment 1Regulusstraat Segment 2Venuslaan Segment 1Venuslaan Segment 2Venuslaan Segment 3Venuslaan Segment 4Plutolaan Segment 1Plutolaan Segment 2Plutolaan Segment 3Poolsterlaan Segment 1Poolsterlaan Segment 2Poolsterlaan Segment 3Spicastraat Segment 1Spicastraat Segment 2Siriusstraat Segment 1Siriusstraat Segment 2Siriusstraat Segment 3Wegalaan Segment 1Wegalaan Segment 2Wegalaan Segment 3Capellastraat Segment 1Capellastraat Segment 2Kometenstraat Segment 1Kometenstraat Segment 2Mercuriusstraat Segment 1Morgensterlaan Segment 1Morgensterlaan Segment 2
Green category
Trees
No trees+0 0
Tree height 0–10 m+2202022 28 1414 2010 201822 6102220182 106146 4266 2
Tree height 10–15 m+33393312 219963999304040 330 24 345 12182421618369 3463
Tree height 15+ m, +420 128 2420202416128 1232 4 3228448 4 4328 4044
Maximum of 40 points 403820272810241019124040342717163424404040153636622174031404052721212231404090363403435
Green wall
No green wall +0 000000000000000000000 0000000000000 00000000
1–25% of walls+11 1 1
25–50% of walls+2
50–75% of walls+3
75–100% of walls+4
Facade garden/front yard
No facade garden/no front yard+0
1–50% facade garden+5 5
50–100% facade garden+6
1–25% green front yard+10 10 10
25–50% green front yard+12 12 12 12 1212 12 12 12
50–75% green front yard+141414 1414 14 14 1414 1414 14 14
75–100% green front yard+16 161616 16161616161616 16 16 1616 1616 16 1616161616
Green strips
No green strip +0000000000 0000 00 00 0 000
Green strip (1 m2–25 m2)+9 9 9
Green strip (25 m2–100 m2)+11 1313131313 131313131313131313131313 13 13 13 1313
Green strip (>100 m2)+13
Climate adaptive roofs
No climate adaptive roofs +00000000000000000000000000000000000 00000000
Adaptive roofs 1–50% +1 1 11
Adaptive roofs 50–100% +2
Green parking lots
No green parking lots +000000000000000000000000000000 000000000000000
1–50% green parking +1 1
50–100% green parking +2
Max possible points (Green Category) 77533443442638243528656963564641593856545242636224494469606764305237374847516523255219566465
Table 9. Paddepoel North district blue category scores per street segment.
ScoreMarsstraat Segment 1Marsstraat Segment 2Marsstraat Segment 3Uranus Straat Segment 1Uranus Straat Segment 2Uranus Straat Segment 3Neptunusstraat Segment 1Neptunusstraat Segment 2Neptunusstraat Segment 3Planetenlaan Segement 1Planetenlaan Segement 2Planetenlaan Segement 3Avondsterlaan Segement 1Avondsterlaan Segement 2Avondsterlaan Segement 3Jupiterstraat Segment 1Jupiterstraat Segment 2Jupiterstraat Segment 3Regulusstraat Segment 1Regulusstraat Segment 2Venuslaan Segment 1Venuslaan Segment 2Venuslaan Segment 3Venuslaan Segment 4Plutolaan Segment 1Plutolaan Segment 2Plutolaan Segment 3Poolsterlaan Segment 1Poolsterlaan Segment 2Poolsterlaan Segment 3Spicastraat Segment 1Spicastraat Segment 2Siriusstraat Segment 1Siriusstraat Segment 2Siriusstraat Segment 3Wegalaan Segment 1Wegalaan Segment 2Wegalaan Segment 3Capellastraat Segment 1Capellastraat Segment 2Kometenstraat Segment 1Kometenstraat Segment 2Mercuriusstraat Segment 1Morgensterlaan Segment 1Morgensterlaan Segment 2
Blue category
Rain barrels present
No rain barrels +000000000000000000000000000000000000000000 000
1 or more rain barrels+1 1
Permeable pavement (street or sidewalk)
No permeable pavement in the street+0000000000000000000000000000000000000000000000
Permeable pavement sidewalk+1
Permeable pavement street+2
Permeable pavement sidewalk and street+3
Bioswale
There is no bioswale nearby+0000000000000000000000000000000000000000000000
A biowale can be found within 50 m of the street+6
Surface water
There is no surface water nearby+0 000000000000 0000000 00000000000000000
Surface water can be found within 50 m of the street+66 666 6 6666
Max possible points (Blue category) 16600000000000066600000006000000000000000007666
Table 10. Paddepoel north district grey category scores per street segment.
ScoreMarsstraat Segment 1Marsstraat Segment 2Marsstraat Segment 3Uranus straat Segment 1Uranus Straat Segment 2Uranus Straat Segment 3Neptunusstraat Segment 1Neptunusstraat Segment 2Neptunusstraat Segment 3Planetenlaan Segement 1Planetenlaan Segement 2Planetenlaan Segement 3Avondsterlaan Segement 1Avondsterlaan Segement 2Avondsterlaan Segement 3Jupiterstraat Segment 1Jupiterstraat Segment 2Jupiterstraat Segment 3Regulusstraat Segment 1Regulusstraat Segment 2Venuslaan Segment 1Venuslaan Segment 2Venuslaan Segment 3Venuslaan Segment 4Plutolaan Segment 1Plutolaan Segment 2Plutolaan Segment 3Poolsterlaan Segment 1Poolsterlaan Segment 2Poolsterlaan Segment 3Spicastraat Segment 1Spicastraat Segment 2Siriusstraat Segment 1Siriusstraat Segment 2Siriusstraat Segment 3Wegalaan Segment 1Wegalaan Segment 2Wegalaan Segment 3Capellastraat Segment 1Capellastraat Segment 2Kometenstraat Segment 1Kometenstraat Segment 2Mercuriusstraat Segment 1Morgensterlaan Segment 1Morgensterlaan Segment 2
Bonus and deduction
Shaded areas (canopy)
No shaded areas present+0 0 0 0 0 0 0 0
Shades from trees (canopy)+1111111 11111111 1111 1 11 1111 11111111 11111
Artifical shade provision +2
If present, unpaved surface located lower than paved surface
Unpaved surface is located higher than paved surface+0000000000000000000000000000000 0000000000000
Unpaved surface is located lower than paved surface+2 22
Parking spaces
Cars are parked in the street (no designated parking spaces) 000000 0 000000000000000 00 0000000000000
Car free street+2
Designated parking spaces are present 2 2 22 222 222
Driving lanes
Car free street+1
1 point deduction per driving lane 1222222222222222222222222222222222222222222222
Max possible points (Grey category) 7−1−1−1−1−1−3−2−3−3−1−1−1−1−1−1−2−1−1−1−1−2−1−2−1−3−4−3−1−1−3−2−1−1−1−1−1−1−1−1−2−1−1−1−1−1
Total score 100583342432535223225646862555146633755535140626029464066596661285136364746506422235125616970
Table 11. Total score street segments for Paddepoel North district.
ScoreMarsstraat Segment 1Marsstraat Segment 2Marsstraat Segment 3Uranus Straat Segment 1Uranus Straat Segment 2Uranus Straat Segment 3Neptunusstraat Segment 1Neptunusstraat Segment 2Neptunusstraat Segment 3Planetenlaan Segement 1Planetenlaan Segement 2Planetenlaan Segement 3Avondsterlaan Segement 1Avondsterlaan Segement 2Avondsterlaan Segement 3Jupiterstraat Segment 1Jupiterstraat Segment 2Jupiterstraat Segment 3Regulusstraat Segment 1Regulusstraat Segment 2Venuslaan Segment 1Venuslaan Segment 2Venuslaan Segment 3Venuslaan Segment 4Plutolaan Segment 1Plutolaan Segment 2Plutolaan Segment 3Poolsterlaan Segment 1Poolsterlaan Segment 2Poolsterlaan Segment 3Spicastraat Segment 1Spicastraat Segment 2Siriusstraat Segment 1Siriusstraat Segment 2Siriusstraat Segment 3Wegalaan Segment 1Wegalaan Segment 2Wegalaan Segment 3Capellastraat Segment 1Capellastraat Segment 2Kometenstraat Segment 1Kometenstraat Segment 2Mercuriusstraat Segment 1Morgensterlaan Segment 1Morgensterlaan Segment 2
Total Score100583342432535223225646862555146633755535140626029464066596661285136364746506422235125616970
Publisher’s Note: MDPI stays neutral with regard to jurisdictional claims in published maps and institutional affiliations.

