Article

Methodology to Improve the Acceptance and Adoption of Circular and Social Economy: A Longitudinal Case Study of a Biodiesel Cooperative

by
Odette Lobato-Calleros
1,*,
Karla Fabila-Rodríguez
1 and
Brian Roberts
2
1
Department of Chemical, Industrial and Food Engineering, Universidad Iberoamericana Ciudad de México, Prolongación Paseo de la Reforma 880, Mexico City 01219, Mexico
2
Cowichan Bio-Diesel Co-op, 1081 Nagle Street, Duncan, BC V9L 2E6, Canada
*
Author to whom correspondence should be addressed.
Sustainability 2022, 14(19), 12394; https://doi.org/10.3390/su141912394
Submission received: 18 June 2022 / Revised: 27 August 2022 / Accepted: 1 September 2022 / Published: 29 September 2022

Abstract

:
Purpose: The aim was this study was to test the effectiveness of the Mexican User Satisfaction Index of Circular and Social Economy (MUSI-CSE) methodology to improve user acceptance and the adoption of biodiesel from the Cowichan Bio-Diesel Co-op (CB-DC), a social enterprise that upcycles cooking oil waste. Approach: The external strategy is to study factors of user experience with products and/or services and internal processes. This type of economy tends to build its value chain independently to avoid barriers in the economic structure. Methodology/Techniques: MUSI-CSE presents a model of satisfaction (present acceptance) and loyalty (future acceptance) factors and a measurement system comprising the same factors. It also identifies and monitors interventions in key factors and evaluates their effectiveness. Here, MUSI-CSE has been tested through a longitudinal and prospective study. In-depth interviews, surveys, SEM, and PLS were used. Findings/originality/applicability: User acceptance and adoption are based on self-benefits and the achievement of specific sustainable local development goals. Satisfaction did not change. Loyalty did experience a statistically significant increase at a 95% confidence level, and sales increased by 26%. It can be concluded that MUSI-CSE innovation contributed to improving users’ future acceptance and adoption. In the future, MUSI-CSE will be adjusted based on other case studies and will support the co-creation of an international methodology and index of circular and social economy.

1. Introduction

Climate change studies indicate that the Earth’s temperature increased by 1.09 °C on average between 2011 and 2020. Among the most affected zones are islands due to the effects of greenhouse gases (GHG) on ocean warming and acidification [1]. The fossil economy and consumption habits have been reported as the leading causes of GHG [2].
One response that society has been forging is the circular economy (CE), which is defined as “decoupling value creation from waste generation and resource use by radically transforming production and consumption systems” [3].
Increasing CE solutions is essential: if doubled, it would be enough to advance 85% of the goal to restrict global warming to below 2 °C by 2032 [4]. Currently, only 8.6% of economic activity is CE-based, yet it presents a trend toward its reduction (e.g., 9.1% in 2019).
Experts state that the main drawback of expanding to a CE is not its production systems nor its business models, as these aspects have experienced the most progress [5], but the lack of bottom-up attention on how CE impacts users’ daily life and what they expect in exchange regarding environmental care [6]. Ultimately, the lack of user acceptance has resonated with the low demand for CE solutions [7].
Guided by the objective to foster bottom-up changes at the local level, governments, non-governmental organizations, and society have fostered the creation of a social economy. Social enterprises focus on a type of sustainable development that the public and private sectors have failed to promote, as they prioritize the good life of the members of their community as well as care for the environment as goals by contributing with sustainable products and services. Social action and solidarity bond social enterprise stakeholders, among them users with a high social and environmental awareness [8], creating a favorable local space for the implementation of transitions of bottom-up production and consumption systems. Cooperatives, mutual societies, and non-profit organizations belong to the social economy [9]; nevertheless, their economic contributions are not quantified in all countries. For instance, social economy is considered to represent 8% of the European Union’s GDP [10].
In order to survive, and because it is not part of the dominant economic structure, a social and circular economy enterprise often needs to independently build a large share of its value chain with scarce resources, turning each of the links into an internal process of the enterprise. Given this, user acceptance is the result of experience with a product or service and the interaction with internal processes of the enterprise [11].
User acceptance in the context of CE is an emerging topic, on which the first study was published in 2015. The geographical location of these studies is concentrated in high-income countries, usually in either North America or Europe. Only one study from Latin America has been identified, and it is a precedent work from the case study presented in this article.
Prior studies mainly focused on electronics (e.g., maintenance and cellphone renewal) and sharing platforms (e.g., cars, co-housing, fashion) according to a review of the literature on all types of social economy solutions [3]. In a more limited manner, waste-to-value solutions in the food and drink sector were studied in another literature review [12]. The latter examples share a process with biodiesel: the utilization of an upcycling process, whose definition is “reuse of discarded materials which results in an increase in value” [12]. As research methodology, the quantitative approach is dominant, being applied in 95% of upcycling cases [12] and nearly half (46%) of the studies in the widest-spanning literature review [3], whereas only 16% have utilized a mixed research methodology. The statistical techniques used in these cases were structural equation modeling and regression analysis.
The data collection in 75% of previous studies was carried out through surveys (45%) and semi-structured interviews (20%). Other techniques involved focus groups or ethnography [3]. Observation and action research have been utilized sparingly “due to the lack of real settings and logistical problems” [13].
Regarding longitudinal studies, none were found, neither from a qualitative nor a quantitative perspective, and only around 10% utilized an experimental design. This methodological situation limits the establishment of more definitive conclusions on the causality relationships between factors and user acceptance, which is required for future longitudinal research that would need to control the studied variables [14].
The main topic of interest has been the distinction of the user acceptance factors in CE (barriers, drivers, motivators) [3], on which 65% of studies are focused. The research question of the review on waste-to-value cases for food and drinks was “What are the individual, context- and product-related factors that determine future acceptance of waste-to-value food products among consumers?” [12].
Seven types of factors for user acceptance have been identified: personal characteristics, product and service being offered, knowledge and understanding, experience and social aspects, risk and uncertainty, benefits, and other psychological factors [3].
No holistic analysis about the behavior of factor systems and their impact on user acceptance was found in the literature. An approximation was carried out by Möhlmann [15] and Tussyadiah [16], who postulate a model of satisfaction and loyalty factors. However, this model does not include the relationships between factors (e.g., quality–price) that would allow for perceiving the location of satisfaction within a network of relationships with loyalty as a final result. Möhlmann [15] recommends future research to advance the establishment of more holistic models.
The current literature only exhibits limited studies that focus on generating external strategies to improve the acceptance or adoption of circular solutions. On the one hand, strategies for risk reduction in the use of internet platforms were generated based on a documental review (e.g., sharing economy platforms) [15]. Strategies to increase sales, on the other hand, were proposed based on an internet survey to users and non-users (e.g., refurbished smartphones) [16].
Cases regarding the inclusion of the consumer perspectives in the design process of circular solutions are also scarce. A study based on the literature and expert opinions discussed participant roles within collaborative consumption through internet platforms (e.g., Uber: a platform provider, a peer-to-peer service provider, and a customer) [17]. Moreover, a product is transformed into a product service system (PSS) through a participative design from the perspective of different stakeholders (e.g., urban housing developments) [18]; the results are promising at the design level. Evaluating the experience of inhabiting these urban developments could be interesting. In a similar study focused on mobility, the authors emphasize the importance of considering users’ daily practices in the context of circular solutions [19]. The other factors that were identified in the latter studies are economical (e.g., price, savings, incomes, efficiency).
The state of the art on CE user acceptance identifies three relevant gaps: (i) a lack of research on how external strategies impact user acceptance, as few articles that study this topic were identified [15,16,20]; (ii) a shortage of holistic perspectives for factor analysis [21] and “focusing on data collection of observed rather than reported behavior” [22]; and (iii) a reduced number of solution types that are studied in CE [3,12,23], with just one analysis on sustainable fuels being identified but that did not include biodiesel [14].
The presented article aims to contribute to reducing the three described gaps in the study of CE user acceptance by developing the Mexican User Satisfaction Index for Circular and Social Economy (MUSI-CSE) that allows for (i) the proposition and evaluation of the effects of an external strategy to improve user acceptance and the adoption of CSE; (ii) the design of a holistic factor model about the user acceptance and adoption of CSE and its testing via a prospective longitudinal study, in which factors are intervened and effects are evaluated; and (iii) the first study on biodiesel, a solution of the circular and social economy, substituting the fossil fuels that produce the main GHG emissions.
The MUSI-CSE aims to improve user acceptance and adoption of CSE. Its external strategy is to study user experience factors with products and/or services and internal processes. The root of the MUSI-CSE is national customer satisfaction index models [24]. The MUSI-CSE can be distinguished from other methodologies used in the field, as it contributes to identifying, hypothesizing, evaluating, influencing, and comparing user acceptance factors of CSE. General factors are taken and adapted from the state-of-the-art, whereas specific factors are identified from a qualitative study. The interactions among factors and their impact on acceptance are postulated as hypotheses. From the user perspective, SEM’s capacity to explain the phenomenon is evaluated; improvements are applied to the factors with the highest impact and lowest score; and the results from the case study are compared in a historic fashion. Afterwards, in future efforts, the results will be compared to those from other case studies to obtain best practices for CSE.
Cowichan Biodiesel Co-op. (CB-DC) was selected to test the effectiveness of the methodology of the Mexican User Satisfaction Index of Circular and Social Economy. The cooperative was founded by the initiative of 21 citizens of the Cowichan Valley in Vancouver Island, British Columbia, Canada, in December 2004, who, inspired by the war in Iraq, decided to implement a CE upcycling solution to reduce their petroleum dependency and to help face local environmental, social, and economic challenges related to the sustainable production, distribution, and consumption of biofuels on Vancouver Island.
Given its isolated condition and lack of oil resources, Vancouver Island imports 100% of its fossil fuels to supply its more than 850,000 inhabitants [25]. The latter affects the environmental sustainability of the region due to diesel spills in the sea [26].
In addition to this, members of the CB-DC decided to contribute to specific local sustainable development goals, such as reducing environmental contamination caused by diesel such as CO2 emissions [27], reducing public health risks related to air pollution [28,29], and creating jobs in the region. Members of the CB-DC resolved to tackle these issues by recycling cooking oil waste to produce and distribute quality biodiesel to reduce GHG emissions caused by transportation, a sector that contributes 14% of the world’s total GHG emissions [30]. These goals have been carried out without interfering with the demand for soil to cultivate food [28] and without preventing the disposal of waste fats, oil, and grease in ways that block drainage pipelines and contaminate both water and soil.
Similar to many other circular and social enterprises, the CB-DC has faced significant challenges to improve user acceptance and the adoption of biodiesel, even though they possess a high level of environmental and social awareness. This enterprise needed to independently build a large share of its value chain with few resources. Since large oil companies and fuel producers do not allow the installment of dedicated biodiesel pumps at their filling stations, CB-DC reconstructed pumps disposed by these large oil companies to supply biodiesel at two different locations. Moreover, the CB-DC not only consumes its own main raw material, but also promotes trapping systems for waste cooking oil residues in restaurants and is responsible for its collection as well.
CB-DC’s other internal processes have been increasing cooperative membership, informing the use and benefits of biodiesel, producing biofuel through an upcycling process, distributing biodiesel to filling stations, keeping the filling pumps clean and operating, supporting a remote payment process, and generating information on GHG reductions.
In the CB-DC value chain, the acceptance and adoption of biodiesel users is affected by their experience with the product and their interaction with the internal processes of the enterprise. Considering the state of the art and the challenges that face the CB-DC case study, the objective, scope, and questions related to this research are presented next:
Research objective: To test the effectiveness of the Mexican User Satisfaction Index of Circular and Social Economy (MUSI-CSE) methodology to improve user acceptance and adoption of biodiesel in the Cowichan Bio-Diesel Co-op (CB-DC).
Research scope: In this research, the current acceptance of users is studied as satisfaction, user future acceptance is studied as loyalty, and user adoption is studied as sales. The MUSI-CSE focuses on identifying and intervening in the factors of user satisfaction and loyalty associated with the product or service and the internal processes of the social enterprise. Testing was carried out via a prospective and longitudinal case study of a biodiesel production cooperative.
Research questions:
Does MUSI-CSE contribute to increasing Cowichan Biodiesel Co-op user satisfaction?
Does MUSI-CSE contribute to increasing Cowichan Biodiesel Co-op user loyalty?
Does MUSI-CSE contribute to increasing Cowichan Biodiesel Co-op biodiesel sales?
The CB-DC case study was carried out in two steps: (i) a cross-sectional evaluation and (ii) a longitudinal study. In the first step, the model hypotheses were tested as association relationships. Alternatively, the longitudinal study featured an intervention in the factors with lower performances, enabling hypothesis testing to determine causality relationships.
The studies mentioned above were different in that (i) while the cross-sectional study focuses on comparing the opinions of active and non-active users in 2017, the longitudinal study analyzed the changing the active users’ opinions before (2017) and after (2019) the implementation of the intervening factors; (ii) the sample of active users is different since the longitudinal study only considers the active users that answered the survey during the two measurement events in 2017 and 2019; (iii) the measurement model analysis and the structural equation model (SEM) estimation utilize the same techniques, including partial least squares (PLS), but these are applied to the corresponding sample in each study. This article is dedicated exclusively to reporting the results of the longitudinal study.
The content of this article is distributed in four parts: a literature review of user acceptance factors in circular economy and national satisfaction indexes models; the methodology for the longitudinal case study and the MUSI-CSE; the results and their discussion; and conclusions.

2. Literature Review

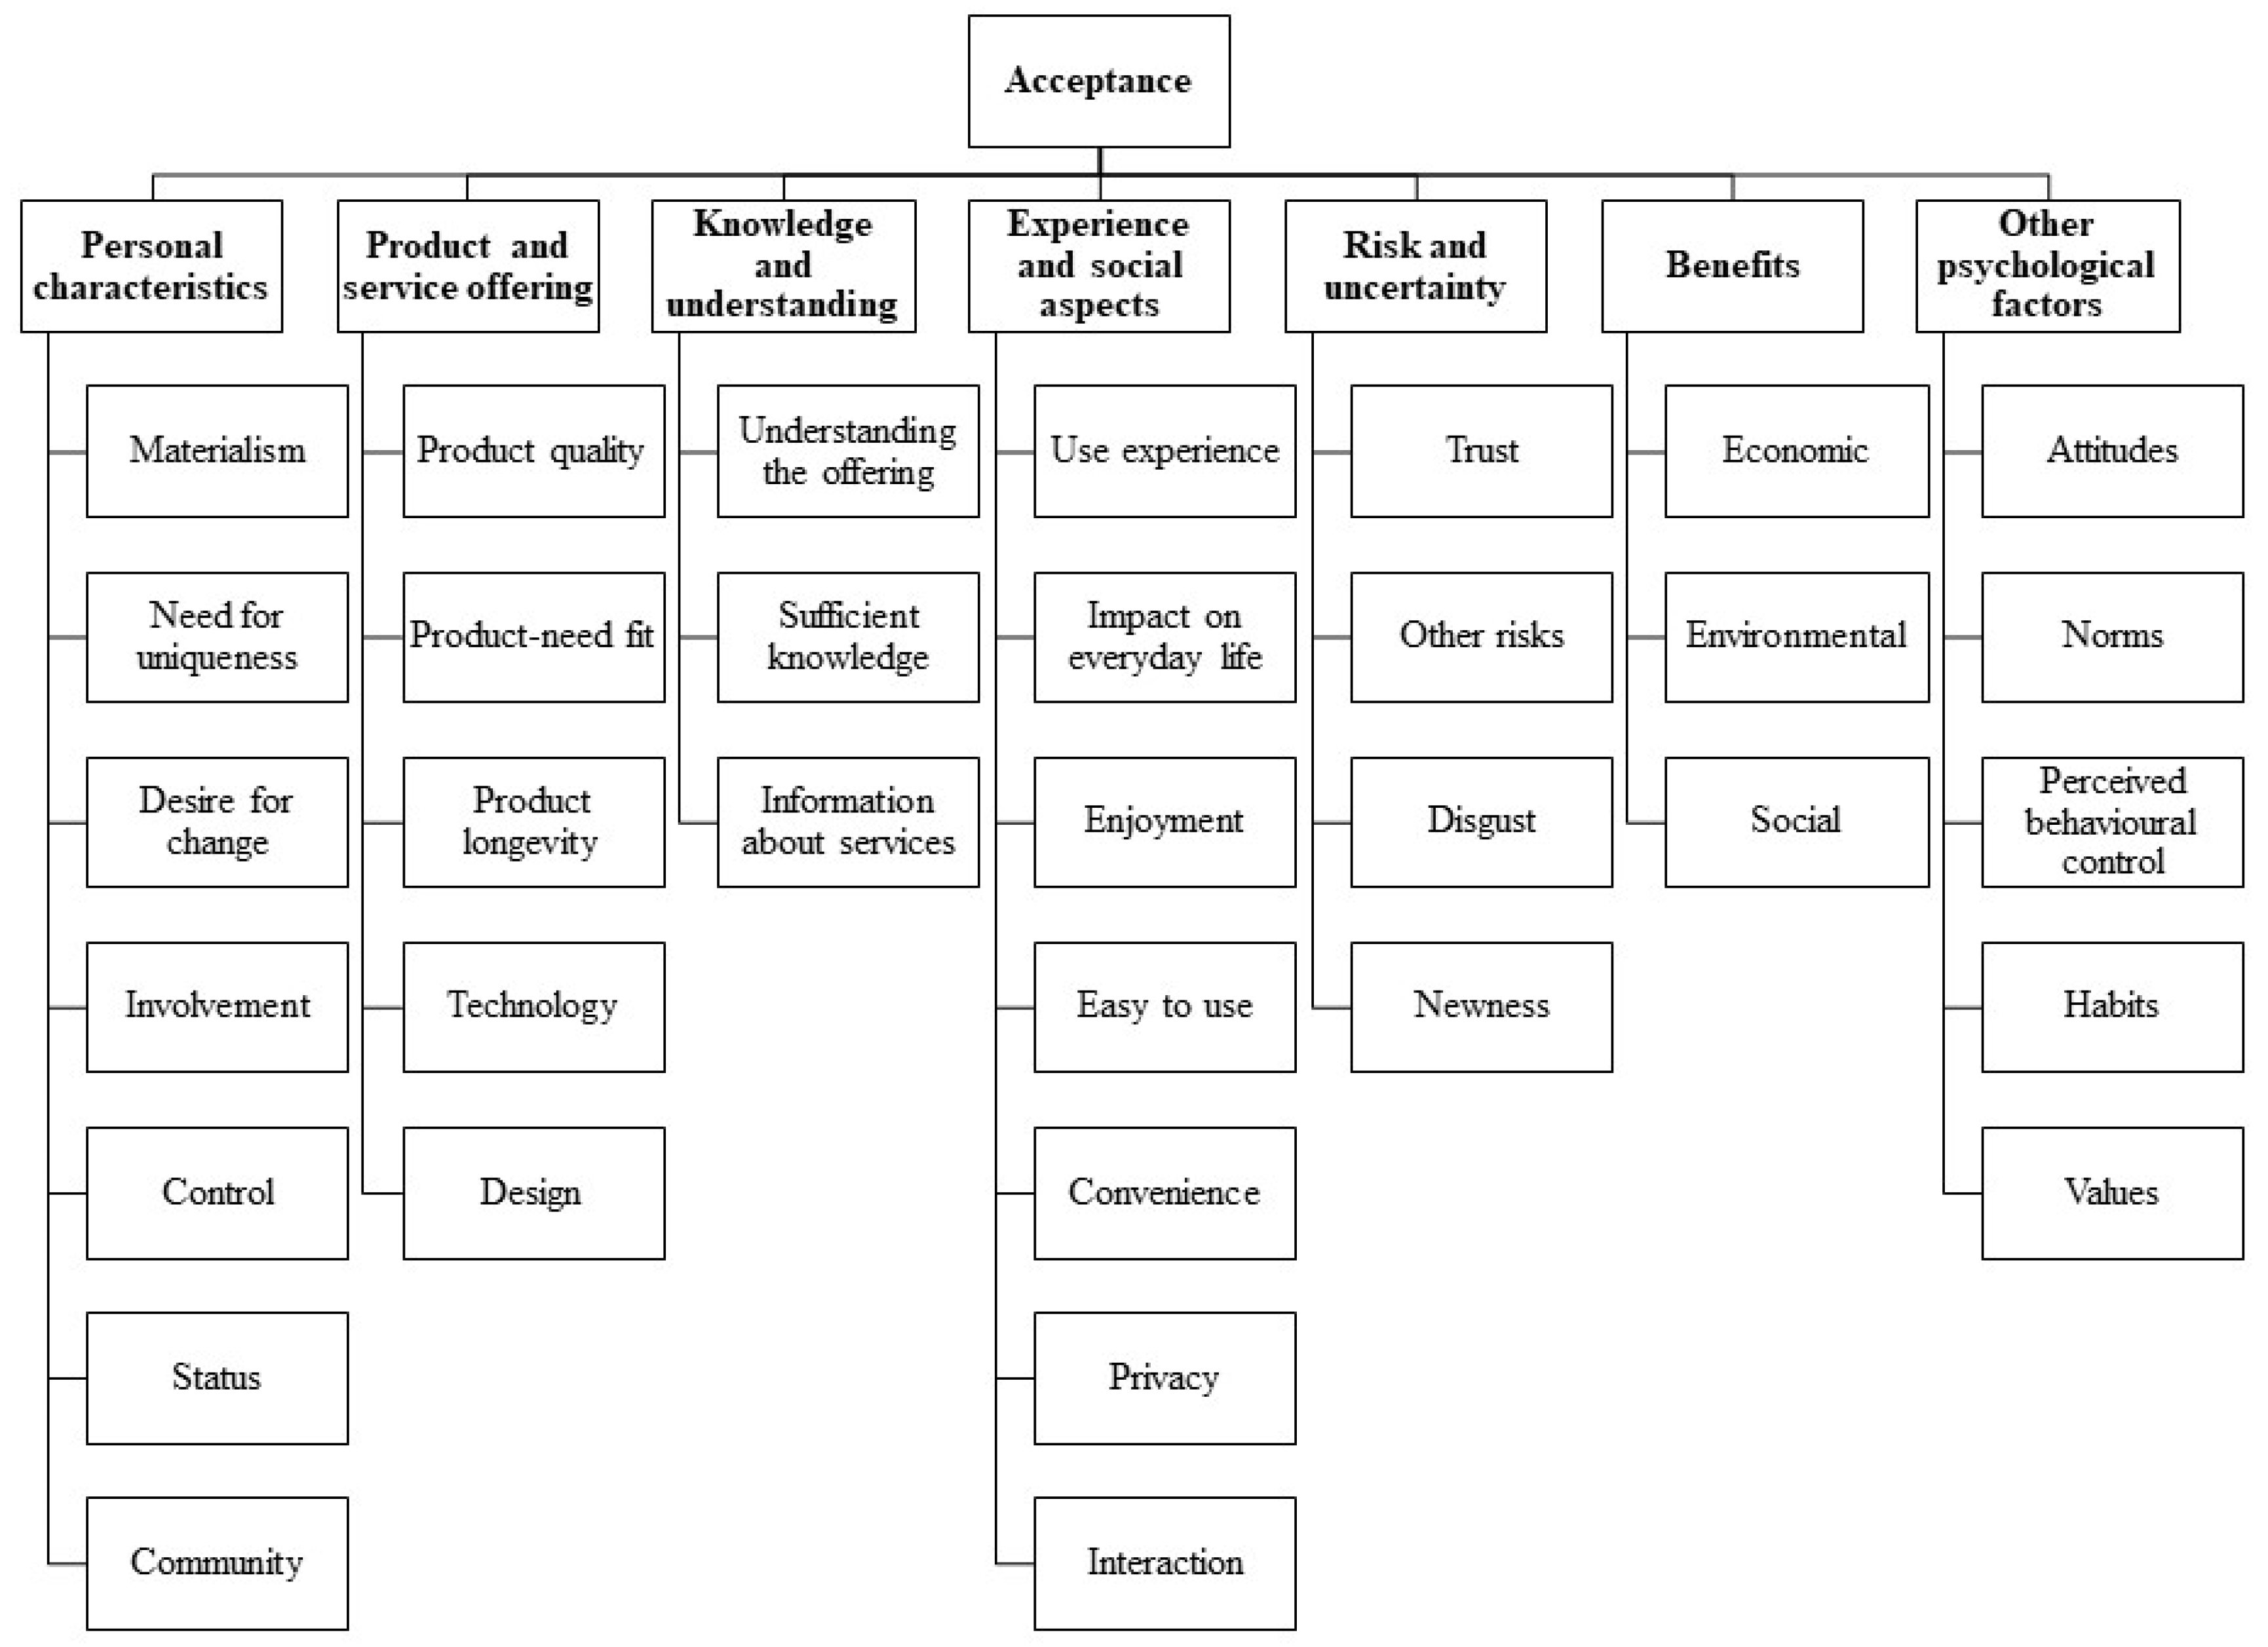
2.1. Acceptance Factors for Circular Economy Users

The field study of user acceptance of CE focuses on the “relationship between consumption and sustainable development, and the roles that consumers and other stakeholders play in that relationship” [3,31]. This field of study began its consolidation in recent years, as shown by the literature reviews by Camacho-Otero et al. [3] on general solutions in CE and by Aschemann-Witzel and Do Carmo [12] regarding upcycled by-product use in agri-food systems.
Relevant results by Camacho-Otero et al. [3] map the factors analyzed in this field of study (see Figure 1), where seven types of factors that impact perception and acceptance can be observed: (i) personal characteristics, (ii) product and service being offered, (iii) knowledge and understanding, (iv) experience and social aspects, (v) risk and uncertainty, (vi) benefits, and (vii) other psychological factors.
The factors identified by Aschemann-Witzel and Do Carmo [12] coincide with the factors identified in the CE solution universe in terms of personal characteristics, knowledge and understanding, and the characteristics of the offered product. The solutions that are analyzed refer to a circular bio-economy, “which is an economy based on renewable biological sources and converting waste streams into value added products” [12,32]. The latter is carried out through an upcycling process in which waste is transformed into products with a higher value and quality [33]. According to the findings of Aschemann-Witzel and Do Carmo [12], as part of the bio-economy and the use of upcycling, user acceptance of biodiesel is expected to be impacted by personal characteristics, knowledge and understanding, and product characteristics.
Under each type of factor, studies regarding possible relevant dimensions for users in the CB-DC case study are discussed.
Dimensions of personal characteristics: (i) Desirefor change is studied as the reduction of excessive consumption according to three types of use-oriented product/service systems (PSS), with the finding that reduced consumption is related to economical savings and satisfaction [34]. CB-DC users have the transition from fossil fuels to biofuels as a goal. (ii) Involvement during the consumption experience is identified as an influence on user acceptance of car-sharing services [13] and on online peer-to-peer renting platforms [35]. Biodiesel users are also members of the cooperative; thus, they possess a high level of involvement during the experience [36]. (iii) Control, or “user ability to effectively use the service” [3], has an impact on purchase intention within the spare parts value chain [37]. In the case of CB-DC, users have to know which diesel/biodiesel blend is adequate for their vehicle’s engine. (iv) Community, in the case of car sharing, is important; nevertheless it is not important for the Airbnb platform [21]. It is expected that biodiesel solutions will coincide with car sharing studies, as both of them face challenges in terms of the carbon emissions caused by fuels.
Dimensions of the offered product/service: (i) Productquality is a key dimension for remanufactured products and the acceptance of associated services [38]; for recycled products, users do not expect products of high or excellent quality [39]. This is similar to biodiesel users who do not expect perfect service, as they acknowledge the limitations of a small cooperative, but who instead expect a service that meets their needs. (ii) Product-need fit refers to how users from the peer-to-peer rental market require that the things they rent match their needs [35]; for users of CB-DC services (e.g., registration, payment, filling stations) and biodiesel, their availability and functionality must be determined according to their transportation needs.
Dimensions of knowledge and understanding: Knowledge of productsand services refers to the information that allows users to evaluate quality, benefits (e.g., environmental), and product costs; furthermore, Wang and Hazen [40] found that value perceptions, which are based on quality, value, cost, and awareness of environmental benefits impact the purchase intention of remanufactured products; transparency regarding the upcycling process has a positive effect in the acceptance of waste-to-value products; however, users expect to pay less for them [41]. Knowledge regarding saving on the cost of renting short-term space is related to satisfaction [21]; for the CB-DC case study, the impacts of environmental benefits on GHG reductions and price are provided to the user on their purchase invoice.
Dimensions of experience and social aspects: These dimensions study user experience consider solutions, present and accumulated, as well as the relationships of those solutions with daily life, recognizing that experience is affected by social, emotional, and affective characteristics. Johnson et al. [42] identify, in the collaborative consumption of fashion, the importance of the experience of the support received when starting the consultation process for web pages for this type of CE solution; in the CB-DC case, several active users initiated their consumption in 2005 by purchasing drums of biodiesel; however, user expectations have changed with the advances made by the cooperative.
Dimensions of risks and uncertainty: Trust is understood as supplier reliability and includes adequate responses to complaints. Möhlmann [21] found that this dimension is related to satisfaction. In the CB-DC, user feedback on biodiesel quality to the executive director is taken into account to adjustments in the cooperative production processes.
Dimensions of economic, environmental, and social benefits: Users of refurbished phones prioritize economic benefits over environmental ones and consider other benefits such as the absence of undesirable innovative features that demand spending money on new accessories. Because a professional company produces the refurbished products, these are of higher quality [43]; when considering the acceptance of waste-to-value products, it is recommended to communicate self-oriented benefits, such as those related to health [44] among other types of benefits [45]. Biodiesel users consider the possibility of avoiding investing in an electric car to reduce their carbon footprint on transportation as a benefit.
Dimensions of other psychological aspects: Subjectivenorms, perceived behavioral control, and values: Khor and Hazen [22] conceptualize subjective norms as social pressure exerted on certain types of behaviors and perceived control as resources that are required to move towards an unconventional alternative. It has been identified that only subjective norms are related to the purchase intention of remanufactured products. Monteiro et al. [46] study pro-environmental behavior and its impact on acquiring alternatives of extended life-cycle clothing based on the value–belief–norm theory, finding that biospheric values are only related in durable garments in the Netherlands but not in Brazil. Moreover, bio-economy food products are better accepted by users concerned about the environment [45,47]. In relation to the adoption of different types of sustainable fuel for vehicles (electricity or bioethanol), Jansson et al. [14] found in their study that “the adopters exhibited higher levels of pro-environmental values, beliefs, and personal norms (PN)”. In this sense, deciding to be a member of the CB-DC is choosing to use biodiesel while often paying more, which implies a pro-environmental and/or health care positioning.
The above-mentioned factors regarding studies on perceptions and acceptance within CE solutions make important contributions to fine-tuning the level of detail for each possible factor in the CB-DC. Since the objective is to not only acknowledge factors but to increase acceptance, it is also required to recognize the holistic effect of the interactions among these factors, as intervention in a process could have a “domino effect” of various factors that could even impact satisfaction and/or loyalty. The study of these interactions has been established in national satisfaction index models.

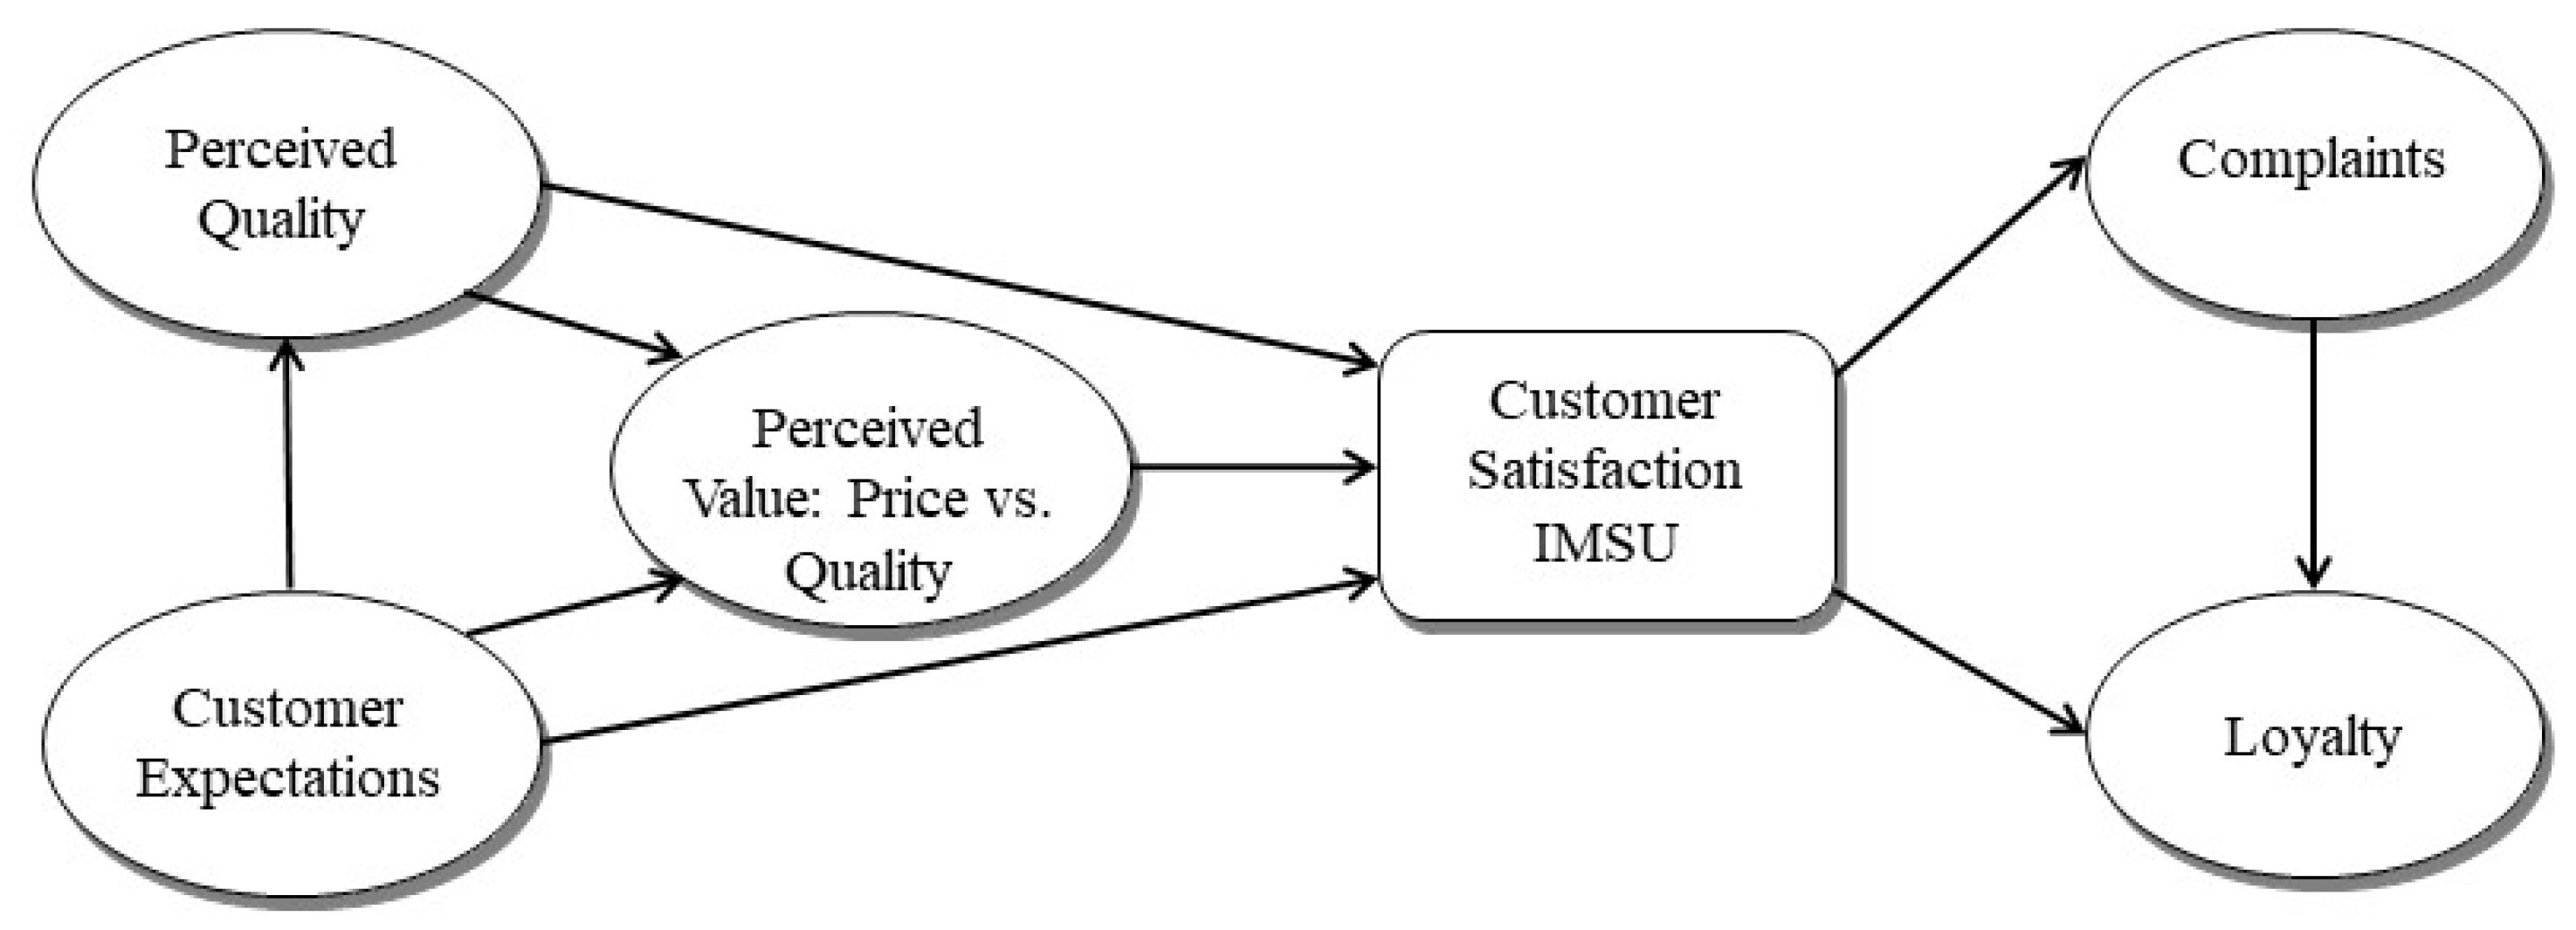
2.2. Models of National Satisfaction Indexes

National satisfaction indexes have a long record and a high level of consolidation. Their field of study surrounds the consumption experience focused on the fulfillment of self-oriented benefits. The first index to be developed was the Swedish Customer Satisfaction Barometer [48], which has been the basis for the creation of other national indexes such as the American Customer Satisfaction Index (ACSI) [49], the European Customer Satisfaction Index [50], and, more recently, the Mexican User Satisfaction Index (MUSI) [51].
The user satisfaction index, which is based on the ACSI model (Figure 2), is considered a key indicator for economic growth and company profitability. A positive relationship has been demonstrated for stock value [52] and investor recognition [53]. Moreover, their inclusion in financial markets has been suggested [54]. Aimed at harnessing ACSI advantages because investments in satisfaction are low risk [52], new self-oriented benefits have been assessed (fresh food e-commerce) [55]. However, sustainability and its other benefits continue to not be included in the ACSI model.
Aimed at evaluating socially engaged consumption, the MUSI team developed a model by retaking ACSI’s generic dimensions. This model was tested in coffee shops that are part of the organic coffee value chain and produced by Tzeltales (First Nation people from Chiapas, Mexico). As an innovation, dimensions referring to the social responsibility awareness of the user were added, and the results showed a high level of prediction for satisfaction and loyalty. The accomplishment of these results is reflected by similar satisfaction index performance to the performance reported by ACSI for fast food restaurants [11].
The ACSI customer satisfaction index, similar to other national indexes, is obtained by taking SEM as a basis for consumption experience. The ACSI’s SEM (Figure 2) presents latent variables enclosed in an ellipse or a rectangle, in which each line marks the relationship between two latent variables, and arrows point in the direction of such relationship. Latent variables are not observable; for this reason, manifest variables are established as indicators. In the case of latent variables within ACSI, the proposed manifest variables can be consulted in [49].
In the field CE user acceptance, two articles on acceptance, satisfaction, and loyalty determinants were identified. Loyalty, in this regard, is understood as the future intention to use a product or service. The articles utilize the SEM and the PLS estimation techniques. Their analyses are limited to direct relationships among satisfaction and loyalty with their corresponding factors. Therefore, the analysis of satisfaction within a cause-effect relationship system has been lost. This could allow for testing of the their nomological validity or “the degree to which a construct behaves as it should behave within a system of related constructs called a nomological net” [56,57,58] and uncovering interactions between variables located halfway through the model path trajectories.
The main findings of the cited research are described as follows: In the case of the car-sharing platform “Car2go” and the short-term space-renting platform “Airbnb”, Möhlmann [21] identifies, through a cross-sectional study, the following associated variables in order of importance: (i) satisfaction with trust or reliability, utility, quality service, cost savings, and familiarity in the utilization of sharing options and (ii) loyalty with utility, and community belonging. Furthermore, the relationships postulated by ACSI that have been confirmed are satisfaction and utility and satisfaction and cost savings. Similarly, satisfaction relationships with specific variables of the circular solution are spotted: trust that “simultaneously refers to trust in the provider of a collaborative consumption service and to the other consumers one is sharing with” [21,59,60,61], familiarity in the utilization of share options, and community belonging as the “aspiration to be part of a group or community” [21]. It is worth mentioning that environmental impact did not result in being a satisfaction and loyalty factor. The explanation level fluctuated between high and moderate, where satisfaction obtained an R2 = 0.63, and loyalty obtained an R2 = 0.37.
Tussyadiah [62] identifies differences between the variables that are related to satisfaction (or post-consumption evaluative judgment) and loyalty in the two types of P2P accommodation (room or entire home/apartment). The analyzed factors are enjoyment, amenities, sustainability, and economic, social, and location benefits. In the two accommodation types, relationships established by ACSI are confirmed: satisfaction and loyalty, amenities (a quality characteristic) and satisfaction, and economic benefits (price) and satisfaction. Specific relationships of the circular solution are added to the analysis: enjoyment and satisfaction, enjoyment and loyalty, social benefits and loyalty, and sustainability and satisfaction. High and moderate levels of prediction were obtained: R2 = 0.609 and R2 = 0.585 for satisfaction and loyalty, respectively.
The findings of [21,62] demonstrate that satisfaction and loyalty models, constituted by their direct relationships with self-oriented and specific factors of the CE solution, reach a level of explanation between moderate and high in the acceptance of collaborative consumption.
Based on prior CE findings and acknowledging the relevance of maintaining the study of nomological validity and the interaction factors of the ACSI model, the research presented in this article aims to explore and expand the ACSI perspective to evaluate circular economy consumption by recognizing that it not only includes self-oriented but other-oriented benefits, as they can be “anonymous, connected, political, uncertain, and based on multiple values, not only utility” [3].

3. Methodology

MUSI-CSE has the Mexican User Satisfaction Index (MUSI) as a methodological predecessor [51]. Differences between the two methodologies, as presented in Table 1, involve objective and scope, the types of variables under study, and statistical analysis. In the latter, MUSI-CSE adds the study, through time, and the statistical significance of difference between these latent variables, satisfaction and loyalty, and their corresponding factors.
The MUSI-CSE methodology’s steps are: (a) to postulate a structural equation model (SEM), (b) to design and evaluate a measurement system, (c) to carry out data collection and sampling, (d) to estimate the SEM, (e) to intervene externally in key factors that require improvement, (f) to evaluate users’ final opinions regarding improvements by applying steps (a) to (e), and, if considered convenient, to continue improving the product or service and internal processes.

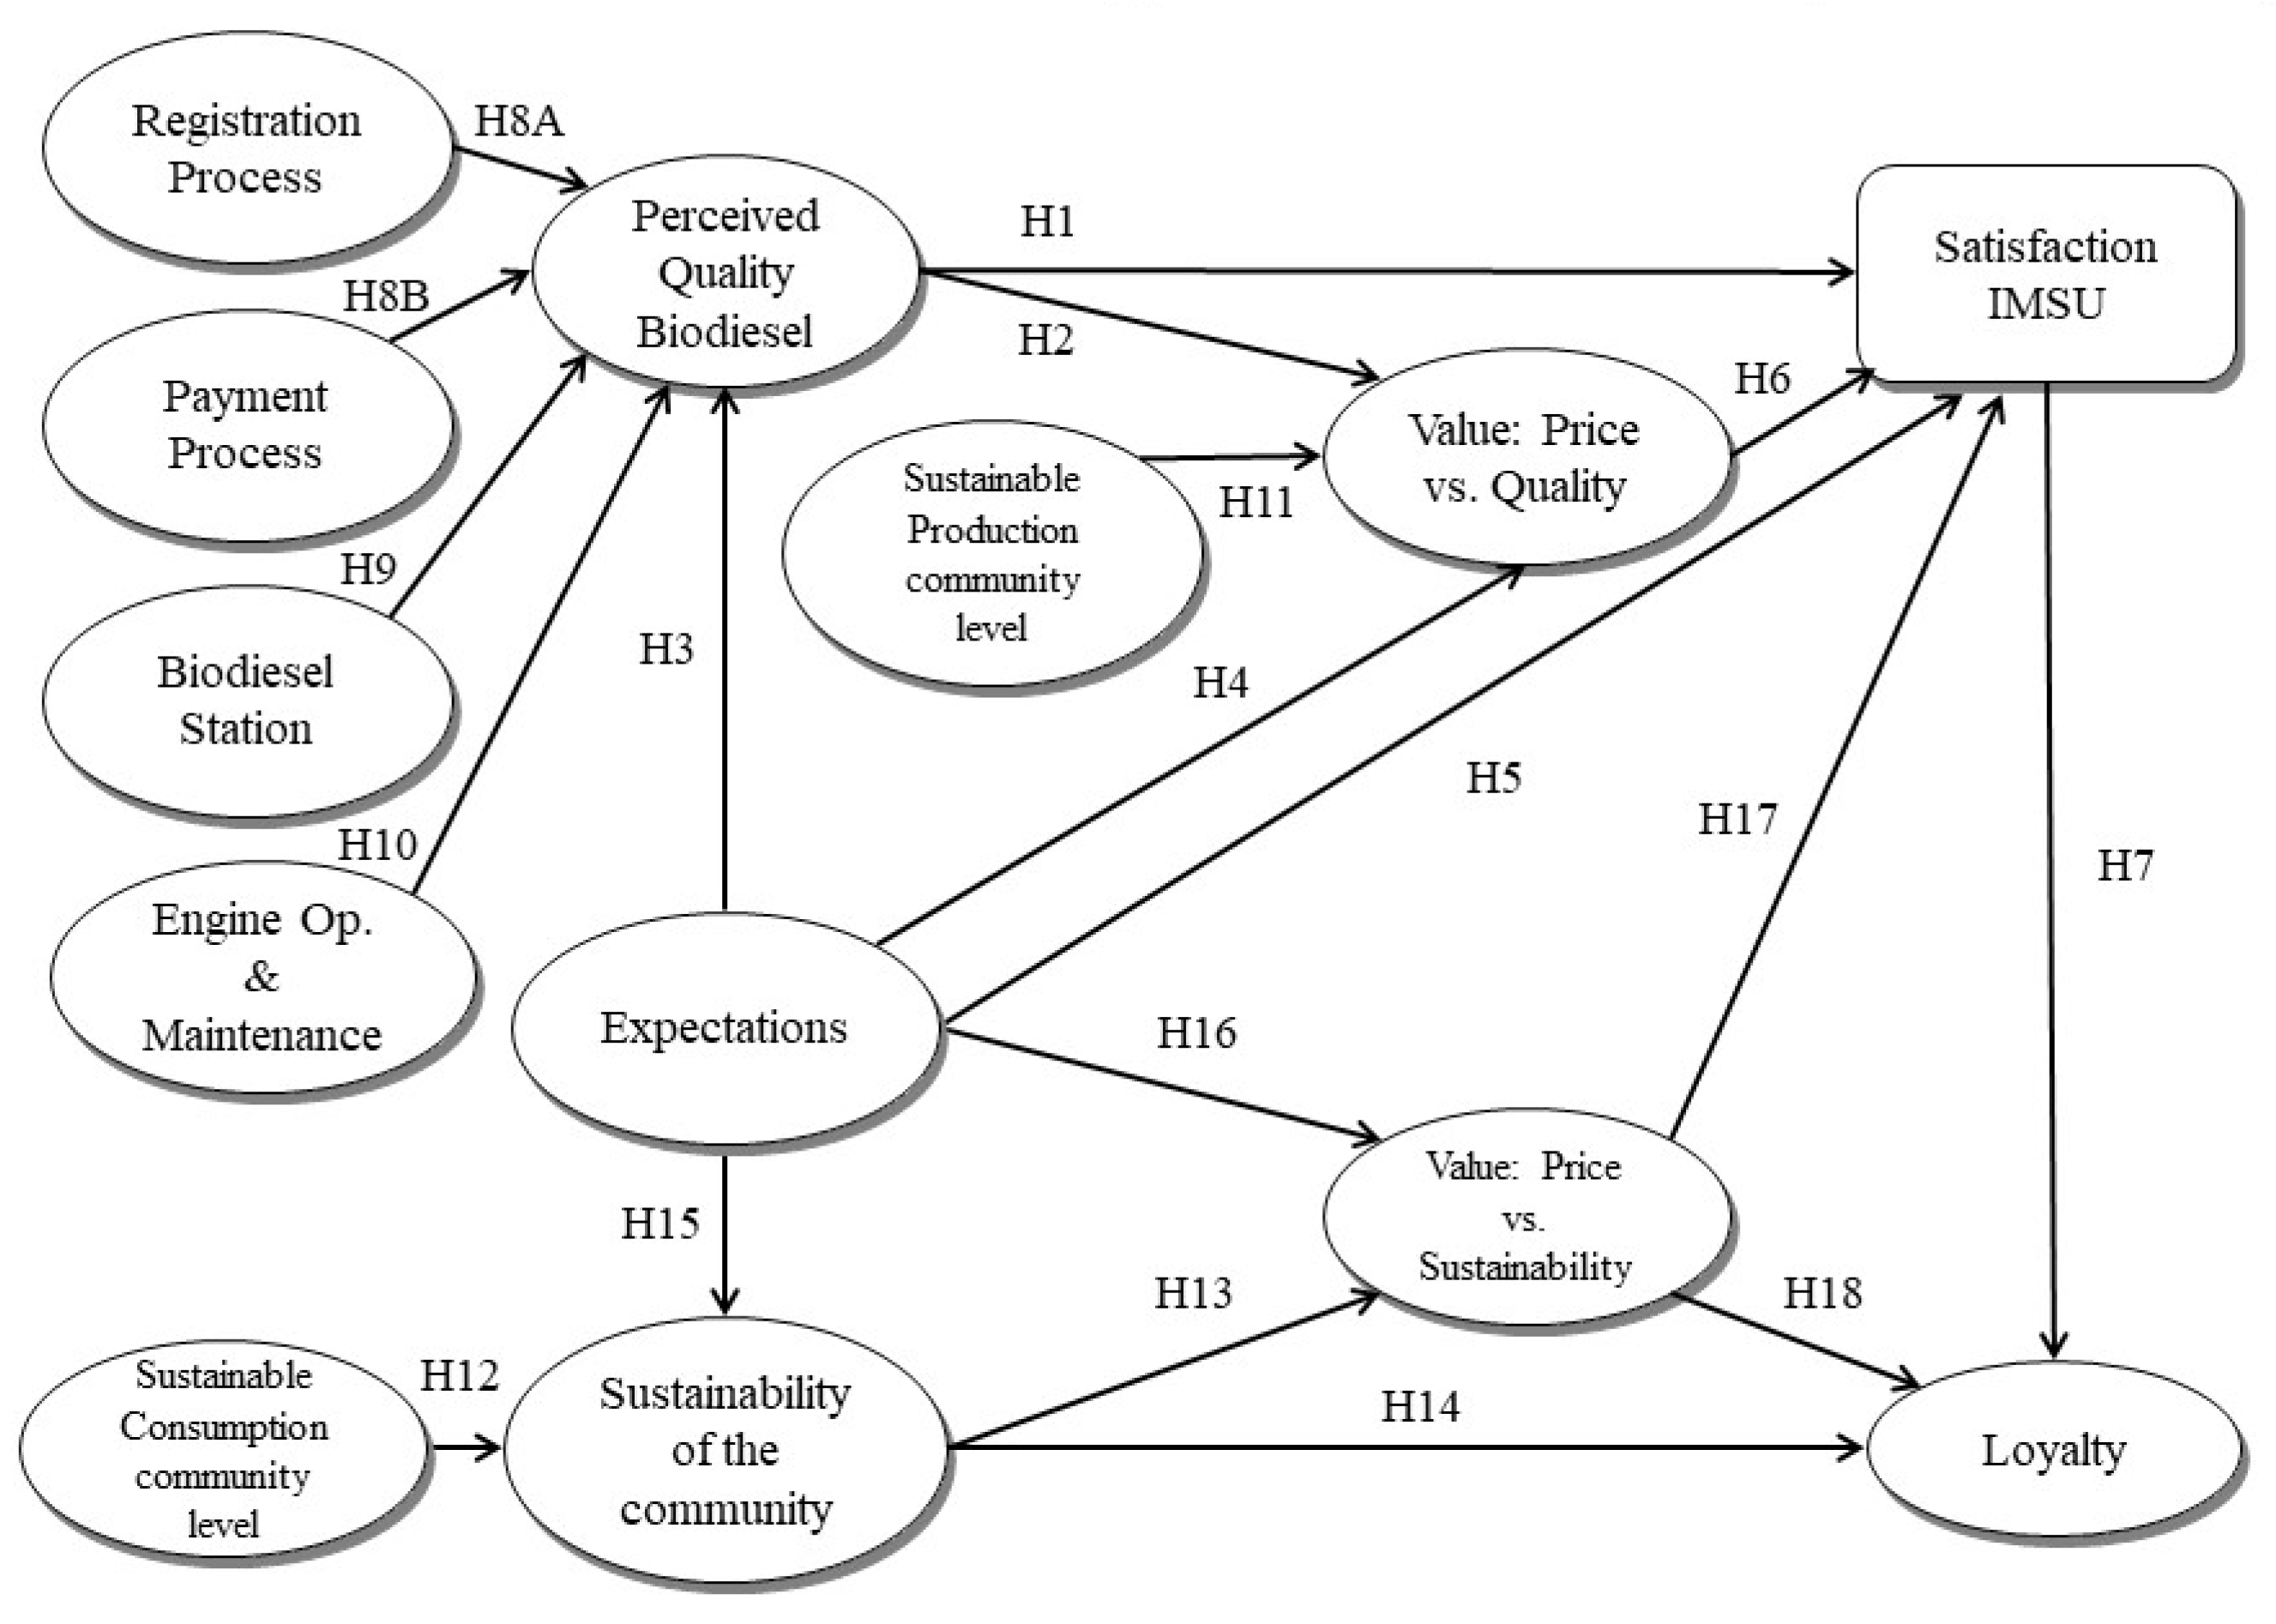
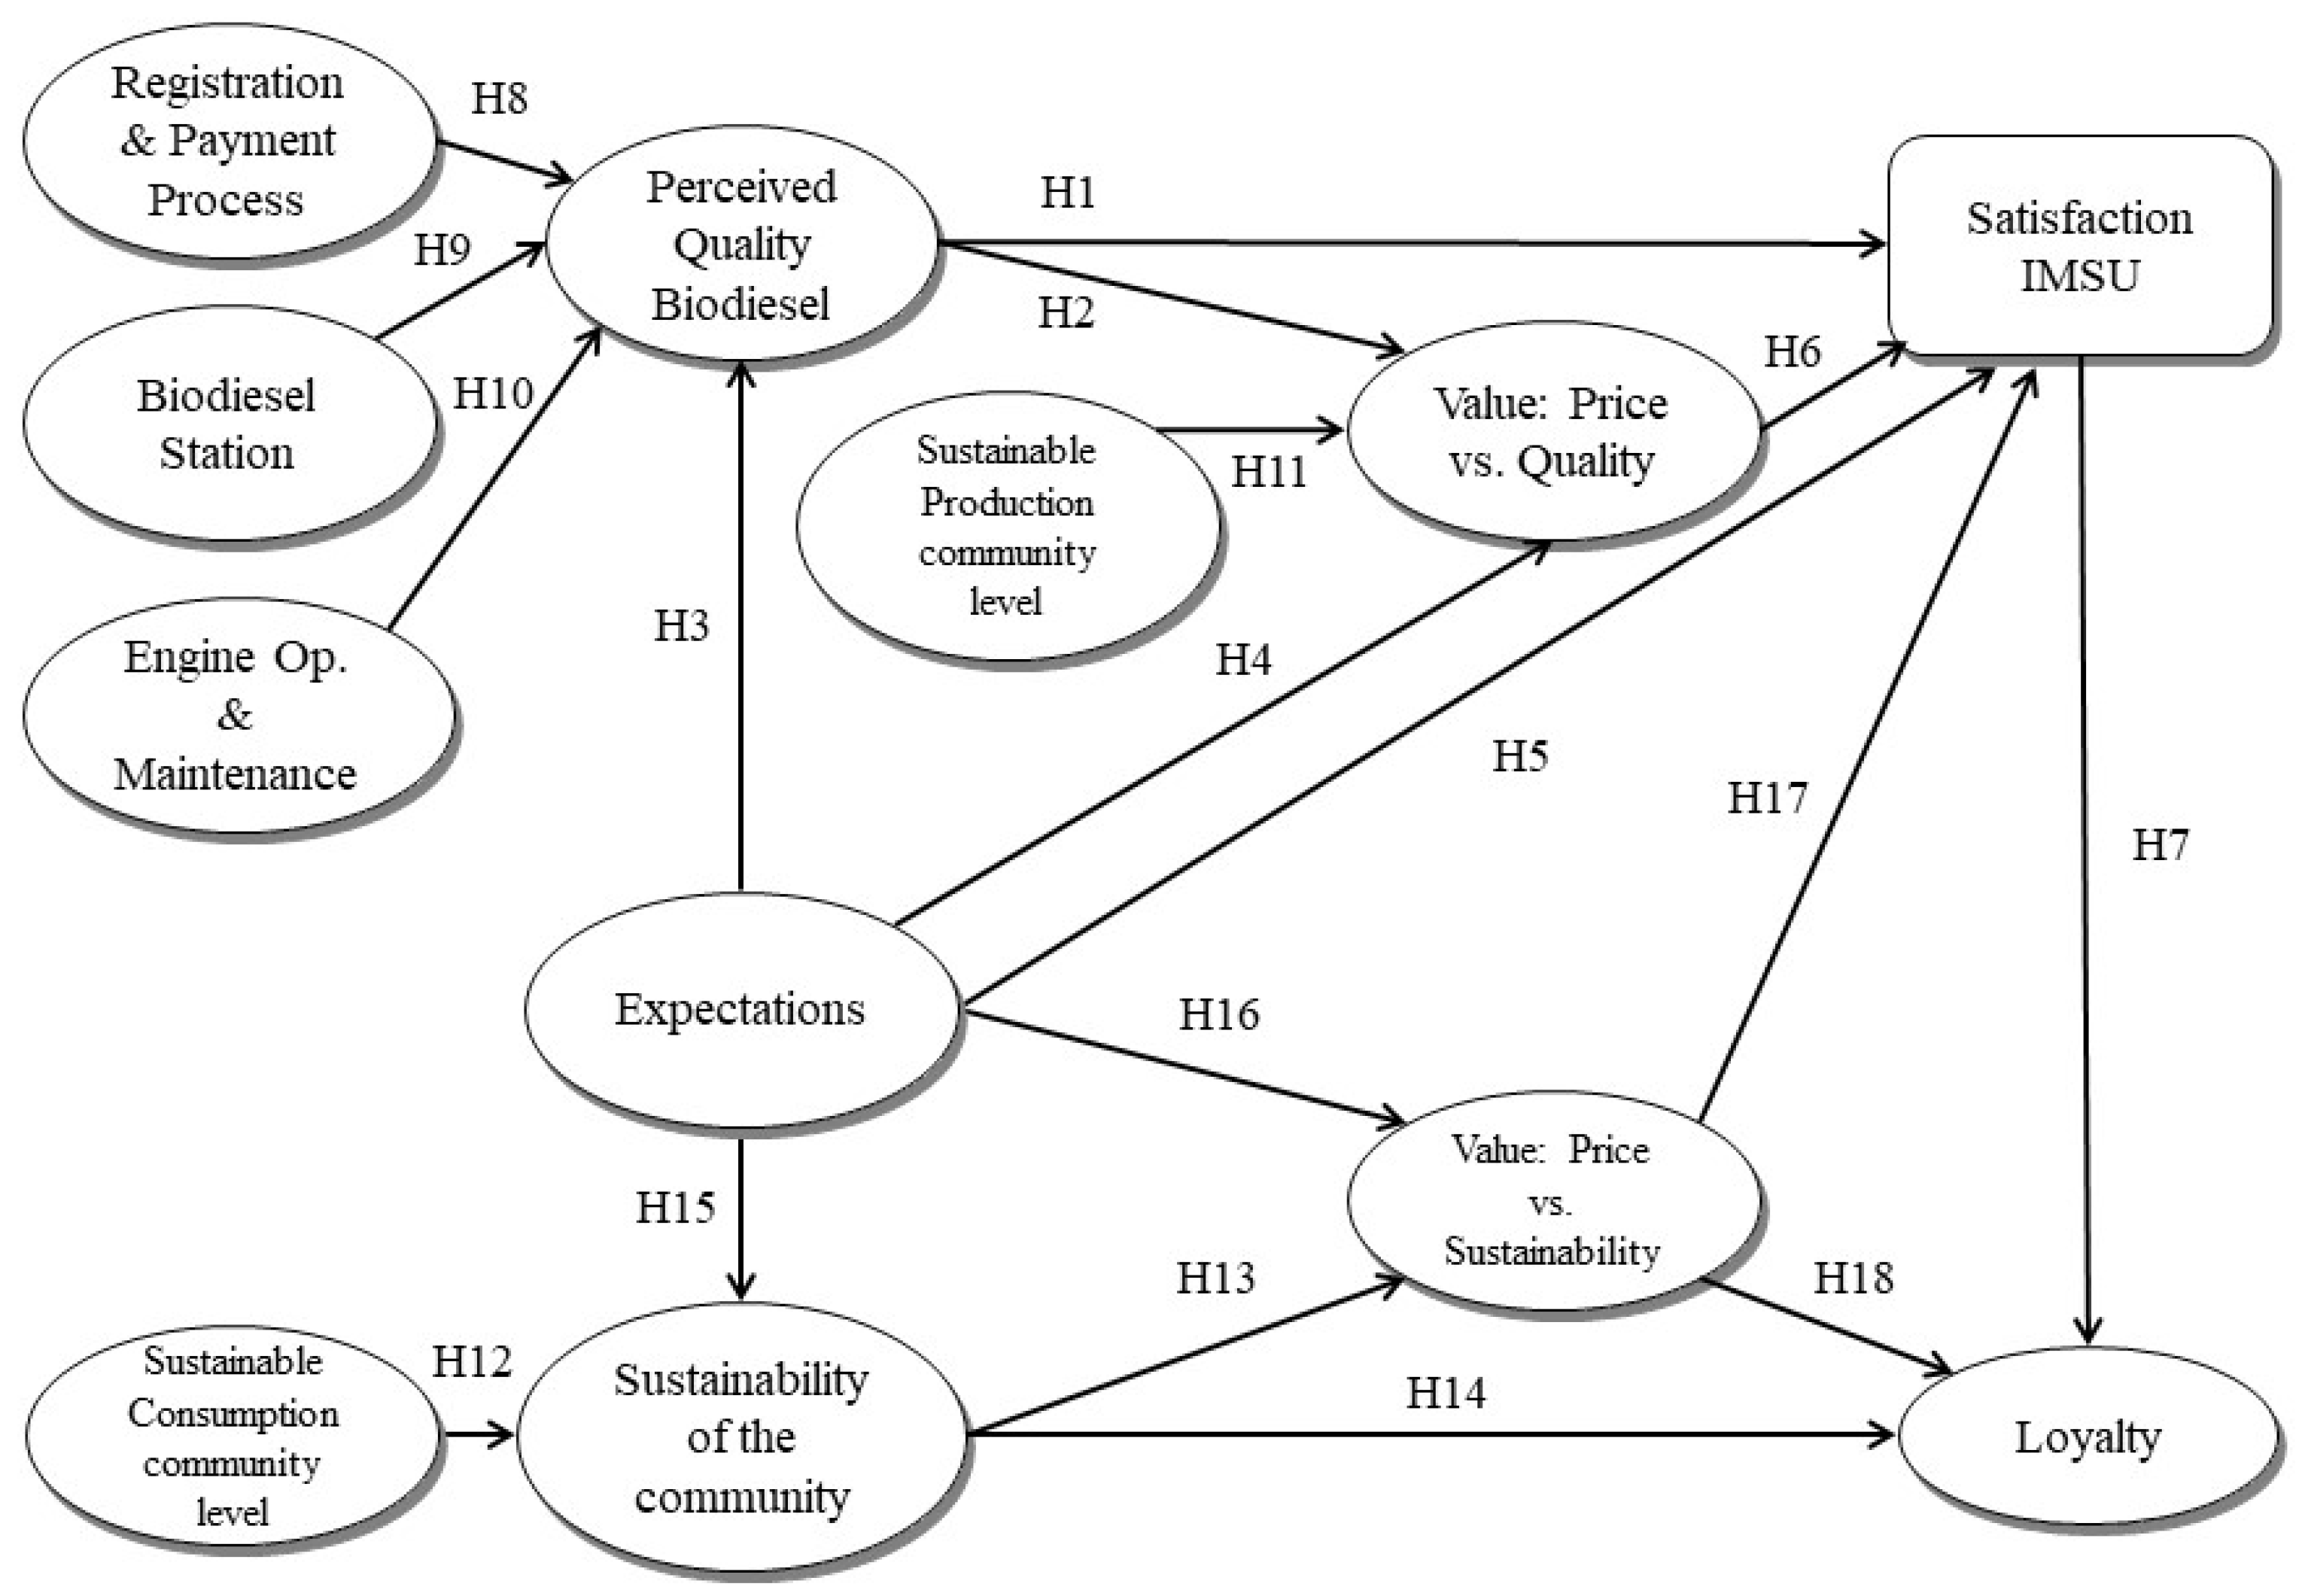
3.1. Postulation of a Structural Equation Model

The SEM was designed based on a literature review and a qualitative analysis by interviewing users in depth. The first qualitative study in 2017 was aimed at identifying the cooperative’s entire operation, biodiesel characteristics, processes that interact with users, and the factors important for user acceptance; for this purpose, an interview guide was developed and applied to eight users with different personal characteristics: professors from Vancouver Island University, staff in charge of the cooperative operation, members of the cooperative management board, employees from different companies, and retirees. In the second qualitative study in 2019, attention was focused on the processes that were improved earlier; thus, three interviews were applied to users.
The SEM proposes that the user experience with biodiesel can be known through the interrelation of three types of latent variables: generic self-oriented, whose presence has been demonstrated in many types of products and services and describes causes and results of user acceptance; specific self-oriented on quality, which refers to the interaction of the user with biodiesel and the internal processes of CB-DC: part of the latter refers to providing information on the use of biodiesel and its benefits; and specific on sustainable, which refers to sustainability factors that the user takes into account when deciding to consume biodiesel.
The SEM is a holistic system, as it also postulates how the three types of latent variables are related to each other and with the resulting acceptance. The latter cannot be mandatory nor obligatory, but is instead a consequence of user experience, knowledge, and awareness. Thus, it is expected that influencing one of the variables identified as “high impact-low score”, can generate a domino effect that ends with increased satisfaction (current acceptance) and loyalty (future acceptance).
Model 2017 (Figure 3) and model 2019 (Figure 4) share the same sections and latent variables. The difference between models is the integration into a single latent variable: the registration and biodiesel payment processes in model 2019, as the variables were integrated in a new process after the improvements made in 2018. The hypotheses are described in Table 2.

3.1.1. Generic Latent Variables (Self-Oriented)

In the state-of-the-art of user acceptance factors for CE, as discussed in Section 2, it is observed that (i) the user-perspective experience, present and accumulated, is not discarded, although its effect is limited by the user characteristics; (ii) satisfaction and loyalty are identified as determinants; (iii) the relevance of the product quality dimension is confirmed and is understood as an adjustment to client needs, but not as a superior or excellent product, because this type of quality would not be expected in remanufactured products; (iv) in the case studies, price or economic savings remain as key dimensions; and (v) the impact of previous experiences is observed in the construction of expectations.
Based on the latter, several dimensions of the ACSI model are being reviewed and adapted (see Figure 2): Loyalty, originally proposed to be relevant to purchase, is now modified for use owing to CE promoting use instead of possession. Satisfaction is kept as a comparative between quality and expectations. Quality is established in relation to meeting needs. Expectations, due to the role of the comparative basis, are determined as model connectors of the self-oriented and sustainable sections. For this reason, it was expanded with “environmental desires, sustainability expectations, or green needs” [64]. Value with price and quality as basis is kept. Complaints are not considered due to the lack of a formal complaint system at the time the study was performed. Table 3 contains the definitions of these variables within this section of the model. Hypotheses are maintained according to the ACSI model.

3.1.2. Specific Latent Variables of Perceived Quality (Self-Oriented)

In the first qualitative study, specific variables associated with quality were identified: (i) registration process, referring to the inscription of cooperative members, the reception of information about the biodiesel blend recommended according to the type of automobile and engine, and annual renewal in membership and fee payment; (ii) payment process, including diesel payment options when in the cooperative’s office or in the filling station; (iii) biodiesel station, two filling stations with one biodiesel pump located at each one; and (iv) engine operation and maintenance, assessment of engine powered using biodiesel. In the second qualitative study, the registration and biodiesel payment processes were integrated into the same latent variable. The definitions of the above-mentioned variables are listed in Table 4. Ultimately, these variables are directly related to perceived quality, as the ACSI model establishes for Government Programs and Services [56]. Hypotheses can be consulted in Table 2.

3.1.3. Specific Latent Variables of Sustainable Benefits

In the first qualitative study, it was observed that users, based on their knowledge and information, evaluate specific variables of sustainable benefits, which are a basic function of the cooperative to provide education and information. A relevant finding was that the users considered specific dimensions of sustainability (other-oriented) and quality (self-oriented), so these are complemented, resulting in increased requirements by the user, which can be seen reflected in the model.
Specific dimensions of sustainability and its complements that were identified are presented in the following paragraphs:
Sustainability of the community: This refers to the cooperative’s contributions to local sustainability. Members support the cooperative based on its contributions to the sustainability of the community. This dimension complements perceived general quality, which is traditionally focused on self-oriented benefits.
Sustainable consumption and production: Although it is recognized that sustainable consumption and production are integrally evaluated by users in several circular economy products (and according to the possessed information), “consumers are prone to purchase recycled products when they are aware of the environmental benefits provided by them” [39,66]. In the case of CB-DC, users (who are also cooperative members) have a high involvement with experience, which allows them to identify the upcycling process. The latter dimensions are analyzed separately.
Sustainable consumption: This dimension based on environmental and social benefits, pollution reduction, and personal and communitarian health. This definition coincides with the conceptualization of “reducing the negative impacts of consumption on the environment and social and economic life” from [39,67]. This dimension complements economic benefits such as speed, easiness, and efficiency provided by the specific processes of the cooperative and that the user evaluates as quality.
Sustainable production: This refers to the importance of waste upcycling compared to fossil oil use; additionally, the production of a small local cooperative that generates jobs is in contrast with a large external company. Several characteristics from UNEP (2010) [68], such as sustainable production concept are met, such as “the efficient use of resources and energy, the development of sustainable infrastructure, the provision of access to basic services, the generation of green decent jobs, and the accomplishment of a better-quality life”, as it is common to relate a low price with products obtained from waste-to-value processes [37].
Value as the relationship between price and sustainability: Since other carbon footprint-reducing alternatives of transportation include the purchase of hybrid or electric automobiles, users take into account automobile and biodiesel prices. This type of value complements Zeithaml’s concept of value [69], which only considers self-oriented benefits in comparison to what is delivered to the user.
The latter dimensions coincide with the factors identified in the state of the art of circular economy user acceptance: (i) desire for change: the transition from fossil fuels to biofuels; (ii) high involvement during the experience due to being a member of the cooperative, (iii) community: commitment to the reduction of GHG emissions in the community caused by diesel, and (iv) knowledge on benefits and cost, such as fewer health affectations, more jobs, increased waste collection, less contamination, and price acknowledgment. In Table 5, the variables mentioned within this sub-section are defined and related to a complementary self-oriented variable.
As the section on sustainability variables is complementary to the self-oriented benefits section, hypotheses are formulated in such a way that these sections converge (see Table 2): (a) Quality and sustainability of the community share expectations as the antecedent; (b) quality impacts value based on price and quality, while the sustainability of the community impacts value based on price and the sustainability baseline; and (c) self-oriented characteristics impact quality, and sustainable consumption benefits impact the sustainability of the community; quality impacts satisfaction, and the sustainability of the community impacts loyalty. These hypotheses are presented in Table 2.
In the evaluation of model 2017, by considering active users, it was found that sustainable production is associated with value having price and quality as a base. The latter coincides with other cases in which users expect a lower price for products elaborated from waste upcycling [41]. For this reason, the hypothesis regarding this relationship is maintained.

3.2. Design and Evaluation of the Measurement System

As a measurement instrument, a questionnaire with 32 indicators was designed to evaluate the latent variables of the two models (see Table 6). Item construction was based on the two qualitative studies from 2017 and 2019. Moreover, recommendations from Fornell et al. [49] and the ACSI staff [56] for variable indicators were adapted from the ACSI model. These indicators are marked with an asterisk in Table 6.
By analyzing the CB-DC model indicators and taking into account the seven types of user acceptance factors from the state of the art of CE [3], it is clear that each type of factor is represented by at least one indicator, as presented in Table 6.
The first section of the questionnaire is dedicated to verifying interviewee eligibility, explaining the research objectives, and inviting interviewees to agree to participate and registering data about interview execution. Afterwards, one question is established for each indicator, offering a 10-point Likert scale anchored at its limits with a qualifier to record answers. A questionnaire was developed for each survey (2017 and 2019) and kept the same items, except for five, four of which corresponded to improvements made to these processes in 2018: registering processes and payment and filling the pumping stations. In the 2019 questionnaire, a new indicator was added for sustainable consumption related to air and water pollution.
With the objective of reducing measurement errors during data collection [70], interviewers were trained on model structure, hypotheses to be tested, and observable variables or indicators of the measurement instrument. Questionnaire reading was rehearsed to verify its tone and speed. The pilot test was carried out with five users of the cooperative.

3.3. Data Collection and Sample

According to the data collection procedure, users were invited to participate in the survey via email, and they were briefed on the research objective, the confidentiality and treatment of the data, the responsibilities of the academic and CB-DC staff, survey application dates, and contact phone numbers for the cooperative if users required more information or had to schedule an appointment to participate in the survey. If accepted, the interview was conducted from the telephone at the cooperative. Informed consent was obtained from all subjects involved in the study. No data on users that could enable them to be identified was kept. The first survey was carried out from 11 May to 1 June of 2017, whereas the second one took place two years later in June 2019. The data are available upon request due to restrictions, e.g., privacy or ethical.
Due to the small size of the biodiesel cooperative, data collection was based on a census. In 2017, all active users were contacted, and 25 of them agreed to participate. These active users were invited to participate once again two years later in 2019, 15 of whom accepted, representing 60% of the possible population to be evaluated longitudinally. The sample size, although small, represents the cooperative’s active users. Table 7 presents the demographic characteristics of the sample.

4. Results

Model estimation was achieved through the statistical technique known as partial least squares, PLS, using SmartPLS 3.0 software [71]. This technique was used because the variables are integrated by reflexive composite indicators, which means that the indicators operate as contributors to the construction of the variable and not as variable causes [72]; furthermore, the PLS technique possesses multiple advantages: (i) it does not require distributional assumptions, (ii) it can evaluate complex models without estimation problems, (iii) it can manage databases with few observations and larger numbers of latent variables, (iv) the estimated latent variables are easily interpreted, (v) it can estimate models with small samples, and vi) it is robust to missing values [73].
Model estimation was built in two stages: the first stage corresponds to the measurement model analysis, in which the reliability and validity of the indicators with respect to the variable they construct or reflect are tested. In other words, it is verified that indicators fulfill the function for which they were designed. The criteria utilized to evaluate the measurement model were individual reliability, internal consistency, convergent validity, and discriminant validity.
The individual reliability of the indicators is verified through the external weight of each one, and its acceptance criterion is 0.707 [74]; however, weights with values from 0.40 to 0.70 can only be considered to be eliminated if the model’s composite reliability increases; those indicators with weights lower than 0.40 should always be eliminated from the model [75].
Individual consistency allows the verification that the indicators are measuring a common variable, for which the statistical estimators Cronbach’s Alpha and composite reliability are used. The first is used as the lower limit of the real value, as it tends to underestimate the internal consistency, whereas the second is utilized as the upper limit because it overestimates the internal consistency value. Values between 0.60 and 0.70 are considered acceptable, whereas values between 0.70 and 0.90 are considered satisfactory [75].
The convergent validity is confirmed by the indicator’s average variance extracted (AVE), which contributes to testing the model’s ability to explain, at least half of the indicator’s variance, so values higher than 0.5 are acceptable [76].
In Table 8, the results from the measurement models of 2017 and 2019 are presented, and it should be noted that the results of all of the latent variables are within the acceptable ranges for each statistical criterion. Because of this, it was necessary to eliminate the following indicators for having low reliability, as shown by an external weight lesser than 0.7: (i) in the 2017 questionnaire, biodiesel user guide (0.505) and biodiesel-diesel switch (0.226); (ii) in the 2019 questionnaire, dimensions of quality expectations (0.237), registration process (0.264), membership renewal (0.313), and blend availability (0.497).
Finally, discriminant validity verifies the extent to which a construct differs empirically from another construct so that it is possible to affirm that a certain phenomenon or theory is being adequately captured. The Fornell–Larcker criterion allows this characteristic to be validated if the square root of the AVE of each latent variable is higher that its correlation with the rest of the latent variables since it is based on the idea that a construct shares a greater variance with its own indicators than with another construct [76].
The empirical experience of evaluating IMSU models over time has shown that the Fornell–Larcker criterion is consistent in its results while maintaining statistical tolerance when the complexity of the models increases; thus, this criterion was considered to perform the discriminant validity analysis.
Table 9 shows the results of the discriminant validity for the 2017 model, where the square root of the AVE of each construct (values in bold font) is greater than the correlation with the rest of the constructs; however, there were some exceptions that are described below. The square root of the AVE of the engine operation and maintenance construct (0.837) revealed a slight similarity with satisfaction (0.886) and value: price vs. sustainability (0.848) because a question about “how difficult is it for the engine to change between biodiesel and diesel” led the user to consider diesel and biodiesel to be similar, losing discrimination capacity with satisfaction and value: price vs. sustainability. As such, the manifest variable was removed as an indicator for this construct.
On the other hand, the construct of sustainable consumption resulted in a lack of discriminant validity (0.899) with respect to the latent variable of sustainable production (0.902) as well as to a certain similarity with the variable of loyalty (0.895); however, all of these constructs presented outstanding values for the criteria of internal consistency, composite reliability, and convergent validity, so it was decided to leave them within the model. However, these results were considered to make changes to the indicators included in these variables in the 2019 model because their impact would also be affected by the operational changes that the cooperative was going to carry out.
The same criteria were used for the evaluation of the 2019 model. Table 10 shows the results, where the same behavior of the constructs can be seen. The only case that presents a slight variation is the registration and payment process construct, which was unified into a single construct based on the results of 2017. The reason for this variation is the CO2 information indicator, which presented an outer loading of 0.568, slightly lower than the limit value of 0.7; however, it was decided to keep it within the model to give the construct greater “content validity” [76] because the values of internal consistency and discriminant validity were not affected by this loading.
Regarding the lack of discriminant validity presented in 2017 in the variables of sustainable consumption, sustainable production, and loyalty, this was resolved satisfactorily since the wording of the questions was improved and a new indicator was added to the latent variable of sustainable consumption. In general, it can be seen that from model 2017 to model 2019, the discriminant validity is greater, as from one year to the next, it was adjusted and improved.
Additionally, another detected factor involved in discriminant validity concerns is due to the sample size of the study because of the fact that the cooperative is a growing organization, so they have a lot of variability in their consumer continuity; therefore, it was a challenge to locate the longitudinal users, causing a small sample size and low variability in the responses. This reduced variability was replicated during the simulation process. causing similarities between latent variables. However, even with this reduced variability and small sample size, few latent variables exhibit discriminant validity concerns and both models showed robustness within the other criteria of internal consistency, composite reliability, and convergent validity.
Before using SEM estimation to identify the factors to intervene, its predictive capacity was verified with (i) significance of the trail coefficients (hypothesis testing), (ii) determination level of the coefficient, R2, and (iii) predictive relevance, Q2. These same criteria had to be included in the 2019 model to evaluate the effectiveness of the intervention.
Due to the small sample size, the significance verification of the trail coefficients within the model was obtained by means of the non-parametric resampling technique, bootstrapping, which consists of a computationally intensive procedure that provides m random samples with the replacement of the original sample, where mean, standard deviation, and error can be obtained. The latter allows a t-test to be performed to prove the significance of the model’s relations [76]. In this project, using the 15 questionnaires collected as a base, a total of 500 responses were simulated and run with 5000 bootstrap samples at a 95% confidence interval.
The determination coefficient, R2, allows the amount of variance in the endogenous variables (response variables) that can be explained by the exogenous variables (predictors) to be learned; in other words, it is the coefficient that measures the predictive power of the model. The R2 values range from 0 to 1, where values close to 1 indicate greater predictive accuracy, and some acceptance criteria were found to be 0.25 (poor), 0.50 (moderate), and 0.75 (substantial) [75].
Figure 5 depicts the 2017 model with information about the two previously described criteria. The continuous arrows indicate that the relationship was significant at 99% confidence, whereas the dashed arrows indicate that the relationship could not be proven. The statistical effect size f2 was revised by considering that a value of a small effect of 0.02, a moderate effect of 0.15 and a large effect of 0.35 [77], and all statistically significant relationships were considered to have a moderate to high effect.
Of all of the hypotheses that were postulated, three (16% of the total) were not able to be proved: H3: expectations, was positively related to perceived quality; H6: value: price vs. quality, was positively related to user satisfaction; and H18: value: price vs. sustainability, was positively related to loyalty. Regarding the first hypothesis, it could be that the measurement of expectations at the beginning of affiliation with the cooperative is so distant in time that they are not related to perceived quality. As for the last two hypotheses, these are statistically significant, but their impact is negative. This highlights the opinion that the price of biodiesel is high and that it mainly has a negative impact on user loyalty, which coincides with the findings of the qualitative study.
It can also be seen in Figure 5 that all of the endogenous variables possess a coefficient of determination value, R2, that reflects a moderate or substantial predictive power: satisfaction = 0.86, loyalty = 0.71, perceived quality = 0.82, sustainability of the community = 0.52, value price vs. quality = 0.70, and value price vs. sustainability = 0.54.
The predictive relevance complements the predictive power of the model by obtaining the Stone–Geisser Q2 value, which indicates the prediction accuracy of the path that precedes the endogenous variable [75]. Hair et al. (2016) [75] recommend that 0.02 be considered small, 0.15 be considered medium, and 0.35 be considered large when being used to interpret predictive relevance. Table 11 presents the Q2 values of the model, revealing that all of the endogenous variables have a high predictive capacity.
The performance indexes of the latent variables were obtained through a series of iterations in the model with the values given by users. In Figure 5, these indexes can be seen within gray circles on a 0–100 scale. The user satisfaction index is 83.19, which, compared to the index obtained by ACSI for gasoline stations in 2017 (which was 76), turns out to have a fairly high performance [78]. Furthermore, loyalty had a performance of 97.55, which is very high in this case.
The SEM (see Figure 5) allows for the identification of latent variables with lower performance and that have an impact on the model. These latent variables, together with their indicators on a scale of 0–100, obtained the following performance values: (i) payment process (71.86); (ii) value based on price and sustainability (82.81): sustainability vs. price (84.18) and price vs. sustainability (82.00); (iii) biodiesel station (84.13): proximity to regular activities (78.53) and blend availability (89.44); (iv) engine operation and maintenance (84.94): efficiency km/L (83.42), engine operation (91.18), and engine maintenance (82.05); (v) registration process (85.40); and vi) value based on price and quality (86.59): quality vs. price (90.53) and price and quality (81.69). The latent variables with the greatest impact are value based on price and sustainability (0.57) and registration process (0.50).
Based on the previous results, a report was delivered to the executive director and to all members of the cooperative.

4.1. External Intervention in Key Factors to Improve

The dimensions identified and the improvements made are presented on Table 12.
CBC implemented a new marketing strategy focused on informing actual and potential members about these improvements. The total sales increase between 2017 and 2019 was 26%, even though pump operation learning curve was reached at the end of 2019.

4.2. Evaluation of Users’ Final Opinions on Improvements

The estimation of the 2019 model can be seen in Figure 6, revealing the criteria of its prediction capacity: (i) significance of the trail coefficients (hypothesis testing), (ii) determination of level coefficient, R2, and (iii) predictive relevance, Q2. As a background, Table 8 and Table 10 present the positive evaluation of this measurement model.
In Figure 6, the continuous arrows indicate that the relationship was significant at 99% confidence, whereas the dashed arrows indicate that the relationship could not be proved. In total, 14 of the 18 hypotheses were proven, amounting to 77.7% of the postulated hypotheses. The statistical effect size f2 was revised by considering that the value of a small effect is 0.02, of a moderate effect is 0.15, and of a large effect is 0.35 [77], and it was found that all statistically significant relationships have a moderate to high effect, with the exception of engine operation and maintenance.
Hypothesis H13, which establishes the relationship between the latent variable community sustainability provided by CB-DC and the latent variable value price vs. sustainability, was not proven. Additionally, a significant decrease in the prediction capacity of the latent variable value price vs. sustainability is observed, decreasing from R21 = 0.54 to R22 = 0.09, and the prediction of the path that precedes it: Q21 = 0.47 to Q22 = 0.07. This allowed an error to be identified in one of the indicators of the latent variable community sustainability provided by CB-DC: in 2017, the production and consumption of the co-op was asked about, and in 2019, the health and pollution was asked about. The latter corresponds to the latent variable of sustainable consumption. This error also affected the prediction capacity for loyalty: R21 = 0.71 and R22 = 0.59; Q21 = 0.53 and Q22 = 0.43. This error also impacts hypothesis H14, which establishes that community sustainability is positively related to loyalty. The resulting negative relationship between these variables shows that when the price is more acceptable, users give price more weight when deciding to continue being loyal than they do to community sustainability.
Hypothesis H9, which was not statistically significant, establishes the relationship between biodiesel station and perceived quality. It is considered that this may have been due to the inconveniences suffered by users when the pump was being installed, and because the installation was not completed until May 2019, users had little experience using it before the 2019 survey. Hypothesis H5 establishes a positive relationship between expectations and satisfaction when these are lower than satisfaction. Although expectations were lower than satisfaction, the relationship was negative and statistically significant. This may be due to the reduction in the difference between the indices (0–100) of expectations and satisfaction, which reduced from 3.68 in 2017 to 1.27 in 2019.
The latent variables, as shown in Figure 6 for the R2 indicator and in Table 13 for the Q2 indicator, have a predictive power that is between moderate and substantial, with the exception of the variable value price vs. sustainability.
The performance indexes for the latent variables are shown in Figure 6 within gray circles with a 0–100 scale. The user satisfaction index is 81.68 compared to the index obtained by the ACSI for gasoline stations in 2019 (which was 73), which turned out to be a very high performance [78]. Furthermore, loyalty had a performance of 98.33, being very high as well.
The estimated model identifies that the predictor variable with the lowest performance in the model is biodiesel station (78.16), with indicator values for general operation being 76.70 and availability of access hours (80.89). After completing the learning curve, the biodiesel station has had a very positive impact on user acceptance and increased sales for CBC.
The performance indices of the latent variables from the 2017 and 2019 SEM were compared. Due to the small size of the enterprise and sample, using the original sample as base, 500 responses were simulated with bootstrapping with non-parametric resampling using a replacement technique at a 95% confidence interval. The comparison was made based on a t-test, verifying the presence of significant differences at a 95% confidence level as well.
The longitudinal comparison of latent variables (2017–2019) (Table 14) revealed that 8% reduced their performance, 42% maintained the same performance, and 50% increased their performance. These differences are analyzed with respect to the interventions carried out by the cooperative in the specific latent variables of perceived quality, value price vs. quality, and value price vs. sustainability (see Table 15).
The three specific latent variables of perceived quality that were intervened with yielded the following results:
  • Installation of a more modern pump did not increase the performance of the biodiesel station; rather, it reduced performance. This could have been due to the fact that pump installation was finished in May 2019 and the evaluation of user opinions was performed in June of the same year, with user experience related to the inconveniences of its installation prevailing over its benefits.
  • It was not possible to assess whether the automatic payment of the annuity had a positive impact, as its indicator obtained an individual reliability of 0.313, not meeting the criterion of being greater than 0.707 [74]. This could be due to members not having to pay their annuity between the pump launching in May 2019 and the user feedback evaluation in June 2019.
  • The change in the biodiesel payment process was well received, increasing its performance positively from 71.86 to 84.33.
  • Expansion of the biodiesel use guide had a positive impact on the performance of the latent variable engine operation and maintenance, increasing from 84.94 to 89.63.
Changes within the specific variables of perceived quality did not have a statistically significant impact on the increase in the performance of this latent variable until June 2019. Although another application of the MUSI-CSE was planned to analyze the effectiveness of the changes in the summer of 2020, it was decided not to carry it out due to the important confounding factor that has been the COVID-19 pandemic. Because of the need to keep a safe distance from others and people travelling around less, the consumption of biofuels was significantly reduced. Thereafter, it was not possible to carry out another evaluation, as the cooperative faced a post-COVID-19 recovery period, and funding for the research project ended.
The reduction in biodiesel prices allowed the blend B20 (biodiesel 20%–diesel 80%) to become cheaper than 100% diesel, which had a very positive and a statistically significant impact on the performance of the latent variable value: price and quality, going from 86.59 to 93.69, and value: price and sustainability, which increased from 82.81 to 89.11. Additionally, while B20 sales have started off very slowly, they have steadily increased since the newer pump opened in 2019. From 2019 to 2020, B20 sales increased by 308%. Between 2020 and 2021, they increased another 47%.
According to the SEM, the perceived quality had a large effect (0.94) on satisfaction, and the variable value: price vs. quality had a moderate effect (0.15) on satisfaction. Despite the fact that this last latent variable had an increase in its performance, it was not possible to increase satisfaction, which remained at the same level in 2017 and 2019.
It was possible to impact loyalty through the latent variable value: price vs. sustainability, which had a high weight of 0.40 on loyalty.
This case study confirms the strong effect of quality as a factor in user’s acceptance of circular solutions. This effect is clearly identified in the literature review by Camacho-Otero et al. [3]. As an IMSU-CSE innovation, we know how to measure the user experience according to the company’s internal processes and evaluate its significant impact on satisfaction, adding the quality of the company’s internal processes to the quality of the product.
The findings regarding price show, as in other cases of circular economy [21,43,62], that it remains a key factor in satisfaction and loyalty, even for users with a level of high environmental awareness.
Sustainability of the community, a main contribution of CB-DC, increased in a statistically significant way from 86.01 to 89.11, which could mean that this is the final result of the model and not a variable that is located in the middle of the path between sustainable consumption and loyalty. Since the cooperative improved its internal processes, there are more possibilities for it to contribute to the sustainability of the community. A similar result was obtained in the prosumer engagement study by [36].
In response to the first research question: Does the MUSI-CSE methodology contribute to increasing Cowichan Biodiesel Co-op user satisfaction?, we found that satisfaction had no statistically significant difference. This is because the history of its perceived quality path remained at the same level, probably due to the short time that users were able to experience the benefits of the newly installed pump and improvements in the membership renewal payment system.
Regarding the second research question: Does the MUSI-CSE methodology contribute to increasing Cowicahn Biodiesl Co-op user loyalty?, there was a significant difference towards an increase, with performance increasing from 97.55 to 98.33. This increase is based on the favorable change achieved by the latent variable price value and sustainability.
For the third research question: Does the MUSI-CSE methodology contribute to increase the sales of Cowicahn Biodiesel Co-op?, between 2017 and 2019, sales increased by 26% [79,80].
Although the results were not totally favorable regarding the intervention in the internal processes of the enterprise due to the short time between implementation and evaluation, it can be considered that a tendency exists to increase the future acceptance and adoption of biodiesel by users.

5. Discussion

The objective of the present research was to test the effectiveness of the methodology of the Mexican User Satisfaction Index for Circular and Social Economy (MUSI-CSE) in a case study of the biofuel industry.
MUSI-CSE is distinguishable from other methodologies in the field, as it contributes to observing, hypothesizing, evaluating, improving, and comparing the factors of user acceptance of CSE before and after improvements in internal processes and products/services.
MUSI-CSE identifies the latter factors through a qualitative study. In a holistic model, the hypotheses are postulated on how the experience and knowledge of the user impact his/her acceptance of CSE. User opinions are evaluated with a questionnaire and the corresponding measurement model. The factors to improve are selected based on their scores and impact in a structural equation model (SEM), though they were previously estimated using the partial least squares technique (PLS). The factors’ behavior and acceptance levels are compared longitudinally before and after improvements are enforced.
In this article, MUSI-CSE was tested in a case study of the Cowichan Biodiesel Co-op (CB-DC), which is located on Vancouver Island, British Columbia, Canada. The cooperative was founded by a group of 21 citizens of the Cowichan Valley who decided to implement an upcycling solution for cooking oil waste to reduce their petroleum dependency and its negative impact on local sustainability. Problems related to the use of diesel include diesel spills in the sea during its importation to the island, CO2 emissions by vehicles that utilize diesel, public health risks related to air pollution, cooking oil waste spills in the water and soil, and lack of jobs due to imported products such as diesel.
The research questions considered in this study were:
Does MUSI-CSE contribute to increasing CB-DC user satisfaction?
Does MUSI-CSE contribute to increasing CB-DC user loyalty?
Does MUSI-CSE contribute to increasing CB-DC biodiesel sales?
The qualitative study was the basis for establishing an external strategy for CB-DC according to its nature and within its sphere of influence to increase the acceptance of biodiesel users. This social enterprise, to avoid the restrictions of the dominant economy, had to build its supply chain independently and using scarce resources by creating internal processes to substitute those considered external in other types of enterprises within the same sector. This phenomenon has been observed in other social and circular enterprises (i.e., Yomolatel Coop.).
This independent supply chain increases the user contact points with the enterprise, which reportedly affects its present and future acceptance. Moreover, as this is a new environmental solution for the user, they carry out a thorough evaluation of product performance, its price in comparison with quality and sustainability, and how biodiesel consumption contributes to the sustainability of the community.
Based on the aforementioned points, the MUSI-CSE’s external strategy to improve user acceptance and the adoption of CSE to study user experience factors with products and/or services and internal processes. For this purpose, satisfaction is understood as present acceptance, whereas loyalty is understood as future acceptance, and adoption is understood as the purchase of biodiesel. The knowledge acquired through qualitative and quantitative techniques from the satisfaction factors and the loyalty of biodiesel users was condensed into an SEM.
The SEM postulates three types of factors: generic self-oriented, specific self-oriented on quality, and specific on sustainable benefits. On the one hand, generic factors were adapted from the ACSI model, as these are widely accepted, even when the circular economy ends [21,56,62]. Specific factors, on the other hand, were identified via in-depth interviews with users. A questionnaire was designed based on the indicators of the latent variables in the SEM.
The SEM hypotheses were put to the test in telephone surveys with CD-BC users in 2017 and 2019. After confirming that the corresponding measurement models met the criteria for individual reliability, internal consistency, convergent validity, and discriminant validity, the SEM was estimated using PLS.
The SEM’s predictive capability for the MUSI-CSE on user acceptance in 2017 and 2019 was evaluated with the determination coefficient R2, whose value ranges from 0 to 1. A value close to 1 indicates greater predictive accuracy. The 2017 and 2019 results for satisfaction were 0.86 and 0.85, respectively, whereas they were 0.71 and 0.59 for loyalty.
The predictive capability of satisfaction is substantial and consistent. The prediction level for loyalty was not consistent, passing from substantial to moderate, due to a change in a sustainability of the community indicator in 2019. This variable is part of the trajectory that precedes loyalty.
In the literature, two studies on user acceptance of circular economy solutions (sharing platforms case studies) were found, and, as with the MUSI-CSE, both studies took the ACSI model as a basis. In [21], satisfaction reached R2 = 0.63, while in [62], R2 = 0.609 was reached. In the case of loyalty, R2 = 0.37 and R2 = 0.585 were obtained correspondingly.
Comparing the present research with the two case studies from the literature revealed that the lower prediction level of loyalty (from MUSI-CSE) coincides with the highest level obtained in the above-cited research reports. Moreover, the explanation level for satisfaction increased consistently by 20% with respect to previous studies.
The increased prediction level for satisfaction could be caused by previous SEM research that merely included the direct relationship between factors and satisfaction. Instead, the MUSI-CSE’s SEM adds the interactions among factors and how the results of these interactions impact the response variables of the study.
The latter is also limited to the predictive capability of the previous research [21,62] in the case of satisfaction and loyalty. Alternatively, the MUSI-CSE’s SEM possesses predictive capability for more endogenous variables (response variables) when following the predictive accuracy criteria of 0.25, poor; 0.50, moderate; and 0.75, substantial [75]. The indicator perceived quality was found to be at the substantial level; a moderate level was obtained for value: price and quality and sustainability of the community; and a poor level was obtained for value: price and sustainability.
As satisfaction and perceived quality are the most studied factors regarding user acceptance, it is comprehensible that these have the highest levels of predictive capability.
The moderate and poor levels of the predictive capacity are mainly caused by the lack of robust indicators of new latent variables. In this case study, the latent variable sustainability of the community, understood as the contributions made by the cooperative to the community, changed the co-op’s production and consumption indicator in 2017 to the health and pollution indicator in 2019. This change did not work because health and pollution is not a direct result of the cooperative, but a consequence of sustainable consumption. This error reduced the predictive capability of the sustainability of the community, and the latent variables that follow its path: value: price and sustainability and loyalty.
The MUSI-CSE SEM established 18 hypotheses (Table 16). The only difference between the 2017 and 2019 hypotheses is due to the correspondence of the SEM with the internal processes of the cooperative. In 2017, the registration process and payment process were independent. In 2019, after the implementation of a new information system, users were able to pay for biodiesel and the annual membership fee (when necessary) at the filling pump. For that reason, hypotheses H8A and H8B were integrated in 2019’s H8.
A comparative analysis among the latent variables from the MUSI-CSE’s SEM and the seven types of factors reported in the documental review determining circular economy acceptance [3] indicated that the SEM included at least one indicator for each type of factor.
The appearance frequency of the seven factors [3] in the MUSI-CSE’s SEM is as follows: benefits (economic, environmental, and social) (32%); products and services offered and internal processes (18%); experience and social aspects (user experience and impact on everyday life) (18%); personal characteristics (desire for change and community) (13%); other psychological factors (values) (11%); knowledge and understanding (understanding the offering and sufficient knowledge) (5%); and risk and uncertainty (trust) (3%).
The testing of each SEM path with a 99% confidence level in 2017 (Figure 5) and 2019 (Figure 6) allowed us to identify which relationships can be confirmed or rejected (Table 16).
In the group of generic self-oriented variables, two hypotheses involving expectations and one hypothesis about the impact of the variable value: quality and price were not confirmed. In the expectation-based evaluation of quality, it was identified that users did not recall their expectations clearly, so the question “expectations before becoming a member” in 2017 was changed to “expectations at the beginning of the year” in 2019. This hypothesis was confirmed in 2019.
In the case of the hypotheses regarding expectations and satisfaction, the relationship is positive or negative depending on whether expectations are lower or higher than satisfaction. Because the difference between these scores was relatively small in 2019, users did not distinguish between the two, giving the opposite result than expected.
The value hypothesis, which compares price and quality and its impact on satisfaction, provided a negative result via the unbalance generated by the much higher biodiesel prices than those of diesel in 2017; with the subsequent reduction in biodiesel prices, the hypothesis was confirmed in 2019. The literature on circular economy solutions that utilize waste-upcycling processes revealed that users expect that the product price to be lower than other alternatives that do not use waste as a resource [3].
The paths of the generic self-oriented variables that were identified to possess a high or moderate effect were quality to satisfaction and satisfaction to loyalty. As per other research on circular economy solutions, it is confirmed that the proposals of this type of economy should satisfy user necessities [3].
The specific self-oriented benefits on quality hypotheses, which reflect the impact of internal processes and biodiesel, are confirmed in their totality, with a moderate to high effect being observed in 2017. The hypothesis about the impact of the biodiesel station in perceived quality was not confirmed in 2019. Recent user experience included inconveniences caused by pump installation and benefits due to its operation. Afterwards, the continuous and improved operation of the biodiesel pump has found to be fundamental in user acceptance.
Within the hypotheses on sustainable benefits, the relationship of value: price and sustainability with loyalty was negative in 2017, as users did not find a balance between biodiesel prices and the benefits that the former provides to the sustainability of the community. In 2019, when biodiesel prices were close to those of diesel, the positive relationship of value: price and sustainability with loyalty was confirmed.
The two hypotheses on community sustainability were not confirmed in 2019 due to an error in one of its indicators that has been explained earlier.
It is important to highlight that all of the paths towards sustainable benefits have high weights in the 2017 path analysis. This was not possible in 2019 because of the error in the sustainability of the community indicator. As it can be seen, SEM estimation is quite sensitive with its indicators; hence, it is necessary to carry out further work in order to better define them.
With the objective of increasing user acceptance and based on the impact and score of specific self-oriented on quality factors in the initial evaluation of the SEM in 2017 (Figure 5), it was decided to focus the improvements towards (i) biodiesel prices that are closer to those of diesel, (ii) an automatic payment system for membership annuity and biodiesel, (iii) modernization of the biodiesel station by adding a refurbished pump, and (iv) diffusion of more information about the biodiesel blend to be used to improve engine operation and maintenance.
The reduction in biodiesel prices allowed the negative impact on satisfaction and loyalty to be modified from having a moderate positive impact on satisfaction to having a high impact on loyalty during the 2019 measurement.
The diffusion of more information about the biodiesel blend to be used generated the perception of a positive impact on the engine operation and maintenance indicator. The increased diffusion of information increased its positive impact on satisfaction from moderate to high between 2017 and 2019.
It is noteworthy that biodiesel price and the diffusion of more information coincide with the following types of factors from the literature [3,12]: benefits and knowledge and understanding, respectively.
Changes in the next processes did not result in a statistically significant positive change in their scores (utilizing a 95% confidence level): automatic membership annuity payment and biodiesel station. The improvements of these two processes ended one month before the follow-up evaluation took place.
The differences in perceptions regarding biodiesel station was negative. The main cause was the multiple inconveniences incurred to users during the construction and launching of the biodiesel station. Although the new biodiesel station is more user-friendly, it is still not perceived in this fashion. Another effect is that the latent variable biodiesel station had no impact on perceived quality in 2019.
According to the state of the art [3,12], the registration process and membership annuity payment as well as the biodiesel station belong to the indicator type products and services offered and experience and social aspects (impact everyday life and convenience), respectively.
As a global result of the CB-CD factor intervention, no statistically significant difference in the satisfaction score (83.19 and 81.68) was obtained. A 95% confidence level and a 1–100 scale were used for factor intervention. It needs to be highlighted that compared to the index obtained by the ACSI for gasoline stations, the scores of 73 and 76 for 2017 and 2019, indicate a very high performance [78].
Despite the inconveniences incurred to the user during the improvements, there was a statistically significant increase (95% confidence level) with respect to loyalty: from 97.55 to 98.33 on a 0–100 scale. This increase demonstrates a high level of difficulty, as loyalty‘s performance was already high. Furthermore, the increase in loyalty ensured the future of the cooperative.
Another relevant result is the 26% increase in sales between 2017 and 2019.
The results regarding biodiesel acceptance and sales within the CB-DC case study show that the MUSI-CSE methodology successfully implemented the intervention strategy to link the user experience factors with the product or service and internal processes.

6. Conclusions

The present research concludes that the Mexican User Satisfaction Index of Circular and Social Economy (MUSI-CSE) methodology is effective in maintaining present user acceptance—satisfaction—and in improving future user acceptance—loyalty—as well as biodiesel adoption—sales—for the Cowichan Bio-Diesel Co-op (CB-DC).
In the user acceptance study of circular economy, MUSI-CSE identifies three relevant gaps: a lack of research on how external strategies impact user acceptance; (ii) a shortage of holistic perspectives for factor analysis; and (iii) a reduced number of solution types that are studied in CE.
Through the CB-DC case study, MUSI-CSE contributes to the following study gaps:
The transition from user acceptance observation to have an influence on it by developing an effective external strategy to study factors of user experience with products and/or services and internal processes: This strategy responds to the nature of CSE and what enterprise can control. Enterprises in the CE tend to have more internal processes because they substitute external links from their value chain to avoid barriers in the economic structure. Hence, the user has more points of contact with the enterprise, which ultimately impact its level of acceptance.
To generate a holistic model of the factors that influence user acceptance: By evaluating the SEM (designed along with its indicators and measurement model) from the user perspective in a longitudinal manner (2017–2019) and by estimating it through PLS, it achieves an explanation level, R2, for satisfaction (85–86%) and loyalty (71–59%). The explanations of satisfaction and loyalty are higher than or at least equal to research using models that do not postulate interactions among factors. Loyalty is at least equal. In [15], these explanation levels were R2 = 0.63 in the case of satisfaction and R2 = 0.37 for loyalty, whereas in [16], an R2 = 0.609 and an R2 = 0.585 were obtained for satisfaction and loyalty, respectively.
It can be concluded that the variables that interconnect the SEM’s three types of latent variables are expectations and values (price–quality and price–sustainability). The above-mentioned three types of latent variables are generic self-oriented, specific self-oriented on quality, and specific on sustainable. Such latent variables include at least one indicator for each of the seven types of factors reported in the literature [3]: benefits (economic, environmental, and social); product and service offering, including internal processes; experience and social aspects (use experience and impact on everyday life); personal characteristics (desire for change and community); other psychological factors (values); knowledge and understanding (understanding the offering and sufficient knowledge of it); and risk and uncertainty (trust).
The most important reflection in the sense of a holistic model is that new users who are aware of their role in communitarian sustainability are demanding an effective system that is not just effective from just one perspective, regardless of whether that perspective is economic, social, or environmental. Instead, they desire a balanced system that equilibrates these aspects that are beneficial for both the individual and the community.
We aimed to extend the study of user acceptance in CSE through a case study on biodiesel. The testing of the MUSI-CSE developed the first case study on the transition from fossil fuels to biodiesel. Contributing to this transition process by increasing user acceptance is important for the reduction of greenhouse gases (GHG), which are mainly generated via the fossil economy and consumption habits [2], which, in places such as Vancouver Island (where this case study is located), increase ocean warming and acidification [2].
The limitations of this study were as follows: During the data collection process to determine the final opinions of the users, it was detected that some of the improvements to the processes had been enacted less than a month after being implemented. The users’ limited experience with these new processes restricted their knowledge and evaluation. The possibility of reapplying the evaluation in 2020 was canceled because of the relevant confounding factor of the mobility restrictions that the COVID-19 pandemic had exerted on transportation. Post-COVID-19, the cooperative entered a recovery period, while funding for the research project ended.
Because of the small sample size, which was due to the small population, a simulation was used to increase the sample. In future research, it should be confirmed that the user has adequate accumulated experience once the changes have been implemented. The continued use of simulations is planned to be able to study small enterprises in the social economy due to the good results obtained with the simulation here. However, it would also be convenient to test the methodology in a large company participating this type of economy.
The main lessons learned from this research, in which the MUSI-CSE was developed to intervene in the factors of user experience related to social and circular economy, are as follows:
  • The circular solution developed by the cooperative contributes to the specific local sustainable development goals, which have been established by its users and members. Current and potential users are informed about the contributions to these objectives.
  • The importance of adding to the conceptualization of circular and social economy as well as of a circular strategy for the continuous innovation of internal processes based on the factors of user experience.
  • The impact of a robust methodology that first identifies and then intervenes in the key factors of the user experience and ultimately evaluates results based on user opinions and sales on user acceptance.
  • The systematic measurement of the factors of the indices for user acceptance yields according to the variables that are comparable over time, which allow the effectiveness of the actions taken to be evaluated.
This research establishes favorable expectations about the effectiveness of the MUSI-CSE methodology to improve the user acceptance and adoption of a circular and social economy that contributes to reaching specific local sustainable development goals. In the future, it should be tested in other case studies. Using the MUSI-CSE in more case studies would allow it to be fine-tuned and to establish the bases to co-create an international user satisfaction index for circular and social economy.
An international index would allow progress to be assessed within a company and among companies in the social and circular economy, enabling the identification of replicable good practices and increasing the possibility to meeting specific local sustainable development goals.

Author Contributions

O.L.-C.: conceptualization; prospective and longitudinal case study; methodology; design of MUSI-CSE, SEM factors, interview guide, and questionnaire; investigation; literature review; validation; estimating the measurement model and structural equation model; funding acquisition: project funds from the Instituto de Investigación para el Desarrollo con Equidad (EQUIDE) from Universidad Iberoamericana Ciudad de Mexico and from a professor and students mobility scholarship from the Dirección de Investigación y Posgrado de la Universidad Iberoamericana Ciudad de Mexico and the Canadian Embassy in Mexico; project administration; project supervision; and writing—review and editing. K.F.-R.: investigation; literature review; supervision; data collection; data curation; collecting questionnaire answers; formal analysis; estimating the measurement model and structural equation model; and funding acquisition: funds acquired from a student mobility scholarship from the Dirección de Investigación y Posgrado de la Universidad Iberoamericana Ciudad de Mexico and the Consejo Nacional de Ciencia y Tecnología (CONACYT). B.R.: methodology; internal process improvement within the case study; validity; SEM of factors; estimating the measurement model and structural equation model; and results interpretation. All authors have read and agreed to the published version of the manuscript.

Funding

This research received no external funding.

Institutional Review Board Statement

The study was conducted in accordance with the Declaration of Helsinki and was approved by the Institutional Research Ethics Board of Vancouver Island University with the protocol code 2016-065-VIUF-LOBATO-CALLEROS approved 28 November 2016 for the 2016 measurement event and under the application 0218-038-UIAF-LOBATO approved in 20 June 2019 for the event of the same year.

Informed Consent Statement

Informed consent was obtained from all subjects involved in the study.

Data Availability Statement

Data available on request due to privacy restrictions.

Acknowledgments

Special thanks are due to Instituto de Investigación para el Desarrollo con Equidad (EQUIDE) from Universidad Iberoamericana Ciudad de Mexico for funding the present project, to Dirección de Investigación y Posgrado de la Universidad Iberoamericana Ciudad de Mexico, the Canadian Embassy in Mexico, and to Consejo Nacional de Ciencia y Tecnología (CONACYT) for the mobility scholarships necessary for the research stays for both the professors and students. Likewise, all of the support received from directors and staff of Cowichan Biodiesel Co-op and Cowichan Energy Alternatives is deeply appreciated. Special thanks to the professors and students from the Vancouver Island University for the culmination of this research and to Shaw and her students. Additionally, we would like to thank Pablo Segura, the doctorate in engineering sciences student from Universidad Iberoamericana Ciudad de Mexico.

Conflicts of Interest

The authors declare no conflict of interest.

References

  1. IPCC. Climate Change 2022 Impacts, Adaptation and Vulnerability. In Working Group II Contribution to the Sixth Assessment Report of the Intergovernmental Panel on Climate Change, Summary for Policymakers; Intergovernmental Panel on Climate Change: Geneva, Switzerland, 2022. [Google Scholar]
  2. Framing and Context. Global Warming of 1.5 °C: IPCC Special Report on Impacts of Global Warming of 1.5 °C Above Pre-Industrial Levels in Context of Strengthening Response to Climate Change, Sustainable Development, and Efforts to Eradicate Poverty; Ipcc Ed. Cambridge; Cambridge University Press: Cambridge, UK, 2022; pp. 49–92. [Google Scholar]
  3. Camacho-Otero, J.; Boks, C.; Pettersen, I.N. Consumption in the Circular Economy: A Literature Review. Sustainability 2018, 10, 2758. [Google Scholar] [CrossRef]
  4. The Circularity Gap Reporting Initiative. The Circularity Gap Report 2021; The Circularity Gap Reporting Initiative: Fitzrovia, London, 2021. [Google Scholar]
  5. Wijkman, A.; Skånberg, K. The Circular Economy and Benefits for Society: Jobs and Climate Clear Winners in an Economy Based on Renewable Energy and Resource Efficiency; Club of Rome: Roma, Italy, 2015. [Google Scholar]
  6. Kirchherr, J.; Reike, D.; Hekkert, M. Conceptualizing the circular economy: An analysis of 114 definitions. Resour. Conserv. Recycl. 2017, 127, 221–232. [Google Scholar] [CrossRef]
  7. Kirchherr, J.; Hekkert, M.; Bour, R.; Huibrechtse-Truijens, A.; Kostense-Smit, E.; Muller, J. Barriers Circular Economy; Elsevier: Utrecht, The Netherlands, 2017. [Google Scholar]
  8. Forno, F.; Graziano, P. From global to glocal. Sustainable Community Movement Organisations (SCMOs) in times of crisis. Eur. Soc. 2019, 21, 729–752. [Google Scholar] [CrossRef]
  9. Chaves-Avila, R.; Campos, J. La economía social ante los paradigmas económicos emergentes: Innovación social, economía colaborativa, economía circular, responsabilidad social empresarial, economía del bien común, empresa social y economía solidaria. CIRIEC-Esp. Rev. Econ. Pública Soc. Y Coop. 2018, 93, 5–50. [Google Scholar] [CrossRef]
  10. Europe, S.E. El Futuro de las Políticas Europeas para la Economía Social: Hacia un Plan de Acción; Social Economy Europe: Bruxelles, Belgium, 2018. [Google Scholar]
  11. Lobato-Calleros, M.O.; Rodriguez, K.F.; Carrera-Lobato, P.; Carrera-Lobato, R. Development and testing of an assessment model for social enterprises. Bus. Process Manag. J. 2016, 22, 1009–1020. [Google Scholar] [CrossRef]
  12. Aschemann-Witzel, J.; Stangherlin, I.D.C. Upcycled by-product use in agri-food systems from a consumer perspective: A review of what we know, and what is missing. Technol. Forecast. Soc. Chang. 2021, 168, 120749. [Google Scholar] [CrossRef]
  13. Bardhi, F.; Eckhardt, G.M. Access-Based Consumption: The Case of Car Sharing. J. Consum. Res. 2012, 39, 881–898. [Google Scholar] [CrossRef]
  14. Jansson, J.; Marell, A.; Nordlund, A. Exploring consumer adoption of a high involvement eco-innovation using value-belief-norm theory. J. Consum. Behav. 2011, 10, 51–60. [Google Scholar] [CrossRef]
  15. Etzioni, A. Cyber Trust. J. Bus. Ethics 2019, 156, 1–13. [Google Scholar] [CrossRef]
  16. Mugge, R.; Jockin, B.; Bocken, N. How to sell refurbished smartphones? An investigation of different customer groups and appropriate incentives. J. Clean. Prod. 2017, 147, 284–296. [Google Scholar] [CrossRef]
  17. Benoit, S.; Baker, T.L.; Bolton, R.N.; Gruber, T.; Kandampully, J. A triadic framework for collaborative consumption (CC): Motives, activities and resources & capabilities of actors. J. Bus. Res. 2017, 79, 219–227. [Google Scholar] [CrossRef]
  18. Dewberry, E.; Cook, M.; Angus, A.; Gottberg, A.; Longhurst, P. Critical Reflections on Designing Product Service Systems. Des. J. 2013, 16, 408–430. [Google Scholar] [CrossRef]
  19. Knot, M.; Luiten, H. User involvement in the development of sustainable product-service systems. User Behav. Technol. Dev. 2006, 263–276. [Google Scholar] [CrossRef]
  20. Wallner, T.S.; Magnier, L.; Mugge, R. An Exploration of the Value of Timeless Design Styles for the Consumer Acceptance of Refurbished Products. Sustainability 2020, 12, 1213. [Google Scholar] [CrossRef]
  21. Möhlmann, M. Collaborative consumption: Determinants of satisfaction and the likelihood of using a sharing economy option again. J. Consum. Behav. 2015, 14, 193–207. [Google Scholar] [CrossRef]
  22. Khor, K.S.; Hazen, B.T. Remanufactured products purchase intentions and behaviour: Evidence from Malaysia. Int. J. Prod. Res. 2017, 55, 2149–2162. [Google Scholar] [CrossRef]
  23. Camacho-Otero, J.; Boks, C.; Pettersen, I.N. User acceptance and adoption of circular offerings in the fashion sector: Insights from user-generated online reviews. J. Clean. Prod. 2019, 231, 928–939. [Google Scholar] [CrossRef]
  24. Johnson, M.D.; Gustafsson, A.; Andreassen, T.W.; Lervik, L.; Cha, J. The evolution and future of national customer satisfaction index models. J. Econ. Psychol. 2001, 22, 217–245. [Google Scholar] [CrossRef]
  25. Canada, S. Census Profile, 2021 Census. Available online: https://www12.statcan.gc.ca (accessed on 27 September 2022).
  26. Holmes, I. Premier Voices Serious Oil Response Concerns during Visit to Nanaimo. Available online: https://viea.ca/premier-voices-serious-oil-response-concerns-visit-nanaimo/ (accessed on 27 September 2022).
  27. Bozbas, K. Biodiesel as an alternative motor fuel: Production and policies in the European Union. Renew. Sustain. Energy Rev. 2008, 12, 542–552. [Google Scholar] [CrossRef]
  28. Hajjari, M.; Tabatabaei, M.; Aghbashlo, M.; Ghanavati, H. A review on the prospects of sustainable biodiesel production: A global scenario with an emphasis on waste-oil biodiesel utilization. Renew. Sustain. Energy Rev. 2017, 72, 445–464. [Google Scholar] [CrossRef]
  29. Riojas-Rodríguez, H.; Álamo-Hernández, U.; Texcalac-Sangrador, J.L.; Romieu, I. Health impact assessment of decreases in PM10 and ozone concentrations in the Mexico City Metropolitan Area. A basis for a new air quality management program. Salud Pública México 2014, 56, 579–591. [Google Scholar] [CrossRef] [PubMed]
  30. Wang, S.; Ge, M. Everything You Need to Know about the Fastest-Growing Source of Global Emissions: Transport. Available online: https://www.wri.org/insights/everything-you-need-know-about-fastest-growing-source-global-emissions-transport (accessed on 27 September 2022).
  31. Reisch, L.A.; Thøgersen, J. Handbook of Research on Sustainable Consumption; Edward Elgar Publishing: Cheltenham, UK, 2017. [Google Scholar]
  32. Carus, M.; Dammer, L. The Circular Bioeconomy—Concepts, Opportunities, and Limitations. Ind. Biotechnol. 2018, 14, 83–91. [Google Scholar] [CrossRef]
  33. Sung, K. A Review on Upcycling: Current Body of Literature, Knowledge Gaps and a Way Forward; World Academy of Science: Trieste, Italy, 2015. [Google Scholar]
  34. Armstrong, C.M.; Niinimäki, K.; Lang, C.; Kujala, S. A Use-Oriented Clothing Economy? Preliminary Affirmation for Sustainable Clothing Consumption Alternatives. Sustain. Dev. 2016, 24, 18–31. [Google Scholar] [CrossRef]
  35. Philip, H.E.; Ozanne, L.K.; Ballantine, P.W. Examining temporary disposition and acquisition in peer-to-peer renting. J. Mark. Manag. 2015, 31, 1310–1332. [Google Scholar] [CrossRef]
  36. Fabila-Rodríguez, K.; Lobato-Calleros, O.; Ruiz-Morales, M.; Brun-Battistini, D. Prosumer’s commitment model: The case of a biodiesel cooperative. Bus. Strategy Environ. 2021, 30, 1674–1688. [Google Scholar] [CrossRef]
  37. Wang, Y.; Wiegerinck, V.; Krikke, H.; Zhang, H. Understanding the purchase intention towards remanufactured product in closed-loop supply chains. Int. J. Phys. Distrib. Logist. Manag. 2013, 43, 866–888. [Google Scholar] [CrossRef]
  38. Gaur, J.; Amini, M.; Banerjee, P.; Gupta, R. Drivers of consumer purchase intentions for remanufactured products. Qual. Mark. Res. Int. J. 2015, 18, 30–47. [Google Scholar] [CrossRef]
  39. Calvo-Porral, C.; Lévy-Mangin, J.-P. The Circular Economy Business Model: Examining Consumers’ Acceptance of Recycled Goods. Adm. Sci. 2020, 10, 28. [Google Scholar] [CrossRef]
  40. Wang, Y.; Hazen, B.T. Consumer product knowledge and intention to purchase remanufactured products. Int. J. Prod. Econ. 2016, 181, 460–469. [Google Scholar] [CrossRef]
  41. Peschel, A.O.; Aschemann-Witzel, J. Sell more for less or less for more? The role of transparency in consumer response to upcycled food products. J. Clean. Prod. 2020, 273, 122884. [Google Scholar] [CrossRef]
  42. Johnson, K.K.P.; Mun, J.M.; Chae, Y. Antecedents to internet use to collaboratively consume apparel. J. Fash. Mark. Manag. Int. J. 2016, 20, 370–382. [Google Scholar] [CrossRef]
  43. van Weelden, E.; Mugge, R.; Bakker, C. Paving the way towards circular consumption: Exploring consumer acceptance of refurbished mobile phones in the Dutch market. J. Clean. Prod. 2016, 113, 743–754. [Google Scholar] [CrossRef]
  44. Coderoni, S.; Perito, M.A. Sustainable consumption in the circular economy. An analysis of consumers’ purchase intentions for waste-to-value food. J. Clean. Prod. 2020, 252, 119870. [Google Scholar] [CrossRef]
  45. McCarthy, B.; Kapetanaki, A.B.; Wang, P. Completing the food waste management loop: Is there market potential for value-added surplus products (VASP)? J. Clean. Prod. 2020, 256, 120435. [Google Scholar] [CrossRef]
  46. Gomes, G.M.; Moreira, N.; Bouman, T.; Ometto, A.R.; van der Werff, E. Towards Circular Economy for More Sustainable Apparel Consumption: Testing the Value-Belief-Norm Theory in Brazil and in The Netherlands. Sustainability 2022, 14, 618. [Google Scholar] [CrossRef]
  47. Grasso, S.; Asioli, D. Consumer preferences for upcycled ingredients: A case study with biscuits. Food Qual. Prefer. 2020, 84, 103951. [Google Scholar] [CrossRef]
  48. Fornell, C. A National Customer Satisfaction Barometer: The Swedish Experience. J. Mark. 1992, 56, 6–21. [Google Scholar] [CrossRef]
  49. Fornell, C.; Johnson, M.D.; Anderson, E.W.; Cha, J.; Bryant, B.E. The American Customer Satisfaction Index: Nature, Purpose, and Findings. J. Mark. 1996, 60, 7–18. [Google Scholar] [CrossRef]
  50. Kristensen, K.; Martensen, A.; Gronholdt, L. Customer satisfaction measurement at Post Denmark: Results of application of the European Customer Satisfaction Index Methodology. Total Qual. Manag. 2000, 11, 1007–1015. [Google Scholar] [CrossRef]
  51. Lobato-Calleros, O.; Rivera, H.; Serrato, H.; Gómez, M.E.; Ramírez, I.M. Methodology for Setting a Mexican User Satisfaction Index for Social Programs. Int. J. Soc. Qual. 2015, 5, 84–111. (In English) [Google Scholar] [CrossRef]
  52. Fornell, C.; Mithas, S.; Iii, F.V.M.; Krishnan, M.S. Customer satisfaction and stock prices: High returns, low risk. J. Mark. 2006, 70, 3–14. [Google Scholar] [CrossRef]
  53. Truong, C.; Nguyen, T.H.; Huynh, T. Customer satisfaction and the cost of capital. Rev. Account. Stud. 2021, 26, 293–342. [Google Scholar] [CrossRef]
  54. Tuli, K.R.; Bharadwaj, S.G. Customer Satisfaction and Stock Returns Risk. J. Mark. 2009, 73, 184–197. [Google Scholar] [CrossRef]
  55. Cui, L.; He, S.; Deng, H.; Wang, X. Sustaining customer loyalty of fresh food e-tailers: An empirical study in China. Asia Pac. J. Mark. Logist. 2022; ahead-of-print. [Google Scholar] [CrossRef]
  56. Staff, T.A. American Customer Satisfaction Index (ACSI): Methodology Report; Stephen, M., Ed.; Ross School of Business of University of Michigan: Ann Arbor, MI, USA, 2005. [Google Scholar]
  57. Bagozzi, R.P. Causal Models in Marketing; Wiley: Hoboken, NY, USA, 1980. [Google Scholar]
  58. Cronbach, L.J.; Meehl, P.E. Construct validity in psychological tests. Psychol. Bull. 1955, 52, 281–302. [Google Scholar] [CrossRef]
  59. Anol, B. Individual Trust in Online Firms: Scale Development and Initial Test. J. Manag. Inf. Syst. 2002, 19, 211–241. [Google Scholar] [CrossRef]
  60. Melnik, M.I.; Alm, J. Does a Seller’s eCommerce Reputation Matter? Evidence from eBay Auctions. J. Ind. Econ. 2002, 50, 337–349. [Google Scholar] [CrossRef]
  61. Chai, S.; Das, S.; Rao, H.R. Factors Affecting Bloggers’ Knowledge Sharing: An Investigation Across Gender. J. Manag. Inf. Syst. 2011, 28, 309–342. [Google Scholar] [CrossRef]
  62. Tussyadiah, I.P. Factors of satisfaction and intention to use peer-to-peer accommodation. Int. J. Hosp. Manag. 2016, 55, 70–80. [Google Scholar] [CrossRef]
  63. Lobato-Calleros, M.O.; Fabila, K.; Shaw, P.; Roberts, B. Quality assessment methods for index of community sustainability. Bus. Process Manag. J. 2018, 24, 1339–1354. [Google Scholar] [CrossRef]
  64. Chen, Y.S.; Chang, C.H. Enhance green purchase intentions. Manag. Decis. 2012, 50, 502–520. [Google Scholar] [CrossRef]
  65. Oliver, R.L. A Cognitive Model of the Antecedents and Consequences of Satisfaction Decisions. J. Mark. Res. 1980, 17, 460–469. [Google Scholar] [CrossRef]
  66. Wang, Y.; Huscroft, J.R.; Hazen, B.T.; Zhang, M. Green information, green certification and consumer perceptions of remanufctured automobile parts. Resour. Conserv. Recycl. 2018, 128, 187–196. [Google Scholar] [CrossRef]
  67. Tunn, V.S.C.; Bocken, N.M.P.; van den Hende, E.A.; Schoormans, J.P.L. Business models for sustainable consumption in the circular economy: An expert study. J. Clean. Prod. 2019, 212, 324–333. [Google Scholar] [CrossRef]
  68. UNEP. ABC of SCP: Clarifying Concepts on Sustainable Consumption and Production; UNEP: Nairobi, Kenya, 2010. [Google Scholar]
  69. Zeithaml, V.A. Consumer Perceptions of Price, Quality, and Value: A Means-End Model and Synthesis of Evidence. J. Mark. 1988, 52, 2–22. [Google Scholar] [CrossRef]
  70. Dillman, D.A.; Smyth, J.D.; Christian, L.M. Internet, Phone, Mail, and Mixed-Mode Surveys: The Tailored Design Method; Wiley: Hoboken, NY, USA, 2014. [Google Scholar]
  71. SmartPLS 3. Boenningstedt: SmartPLS. 2015. Available online: http://www.smartpls.com (accessed on 27 September 2022).
  72. Sarstedt, M.; Hair, J.F.; Ringle, C.M.; Thiele, K.O.; Gudergan, S.P. Estimation issues with PLS and CBSEM: Where the bias lies! J. Bus. Res. 2016, 69, 3998–4010. [Google Scholar] [CrossRef]
  73. Gómez, M. Estimación de los Modelos de Ecuaciones Estructurales, del Índice Mexicano de la Satisfacción del Usuario de Programas Sociales Mexicanos, con la Metodología de Mínimos Cuadrados Parciales. Master Thesis, Universidad Iberoamericana, Ciudad de México, México, 2011. [Google Scholar]
  74. Barclay, D.; Higgins, C.; Thompson, R. The partial least squares (PLS) approach to casual modeling: Personal computer adoption ans use as an Illustration. Technol. Stud. 1995, 2, 285–309. [Google Scholar]
  75. Hair, J.F.; Hult, G.T.M.; Ringle, C.; Sarstedt, M. A Primer on Partial Least Squares Structural Equation Modeling (PLS-SEM); SAGE Publications: Newbury Park, CA, USA, 2016. [Google Scholar]
  76. Henseler, J.; Ringle, C.M.; Sinkovics, R.R. The use of partial least squares path modeling in international marketing. In New Challenges to International Marketing; Sinkovics, R.R., Ghauri, P.N., Eds.; Advances in International Marketing; Emerald Group Publishing Limited: Bingley, UK, 2009; Volume 20, pp. 277–319. [Google Scholar]
  77. Kotilainen, K.; Saari, U.A.; Mäkinen, S.J.; Ringle, C.M. Exploring the microfoundations of end-user interests toward co-creating renewable energy technology innovations. J. Clean. Prod. 2019, 229, 203–212. [Google Scholar] [CrossRef]
  78. ACSI. Benchmarks by Company. Available online: https://www.theacsi.org/industries/retail/gas-stations/ (accessed on 27 September 2022).
  79. Cowichan Energy Alternatives. CBDC Fuel Switching Biodiesel Program; Cowichan Energy Alternatives: Duncan, BC, Canada, 2018. [Google Scholar]
  80. Cowichan Energy Alternatives. Cowichan Biodiesel Greenhouse Gas Reductions of 2019; Cowichan Energy Alternatives: Duncan, BC, Canada, 2020. [Google Scholar]
Figure 1. Main factors influencing the perception and acceptance of circular solutions according to the literature. Source: Reprinted with permission from Ref. [3].
Sustainability 14 12394 g001
Figure 2. ACSI model: private sector. Source: Reprinted from [56].
Sustainability 14 12394 g002
Figure 3. Factor model of user satisfaction and loyalty for CB-DC. 2017. Source: [63].
Sustainability 14 12394 g003
Figure 4. Factor model of user satisfaction and loyalty for CB-DC, 2019. Source: Authors.
Sustainability 14 12394 g004
Figure 5. Estimation of the 2017 structural model.
Sustainability 14 12394 g005
Figure 6. Estimation of the 2019 structural model.
Sustainability 14 12394 g006
Table 1. Differences between the MUSI-CSE methodology and its predecessor. Source: authors.
DifferenceMUSIMUSI-CSE
Objective and scopeTo obtain a satisfaction index while identifying satisfaction and loyalty factors. A cross-sectional measurement is executed for this purpose.To intervene in satisfaction and loyalty factors, which implies longitudinal and prospective measurements and the improvement of products or services and internal processes associated with key dimensions.
Types of variables under studySelf-oriented factors of quality, price, and expectations that have an impact on satisfaction and loyalty. Users evaluate them from their own experience.Adds self-oriented and other-oriented sustainability factors. Users evaluate them from their own experience and knowledge while considering sustainability benefits.
Factor modelIncludes two sections of latent variables of self-oriented benefits: generic and specific.Adds one more section of latent variables of specific benefits: sustainability.
Theoretical base for factor model designNational satisfaction indexes, specifically the American Customer Satisfaction Index (ACSI).Adds the field study of CE user acceptance.
Qualitative study perspective on specific variablesFrom the concept of value as a comparative of obtained quality and price paid.Adds the concept of value as a comparative of contribution to sustainability and price paid.
Measurement system designMeasurement instrument constituted solely by manifest variables with self-oriented benefits.Wider measurement instruments as manifest variables of sustainability are included.
Statistical analysis of resultsStatistical estimation on the model’s explanation level and cross-sectional evaluation of variable performance.Adds a statistical significance of difference analysis of latent variable performance, satisfaction and loyalty, and their factors through time.
Report and improvement follow-upResults report.Adds an improvements follow-up for internal processes. Includes a results assessment by means of user evaluation and company sales.
Table 2. Hypotheses for biodiesel acceptance factors.
Hypotheses20172019
Generic hypotheses: self-oriented benefits
Hypothesis 1 (H1). Perceived quality is positively related to user satisfaction.
Hypothesis 2 (H2). Perceived quality is positively related to perceived value: price vs. quality.
Hypothesis 3 (H3). Expectations are positively related to perceived quality when these are less than the perceived quality.
Hypothesis 4 (H4). Expectations are positively related to perceived value: price vs. quality, when these are less than the perceived value.
Hypothesis 5 (H5). Expectations are positively related to satisfaction when these are less than satisfaction.
Hypothesis 6 (H6). Perceived value: price vs. quality is positively related to user satisfaction.
Hypothesis 7 (H7). User satisfaction is positively related to loyalty.
Specific hypotheses on quality: self-oriented benefits
Hypothesis 8 (H8). Registration and payment process is positively related to perceived quality.
Hypothesis 8A (H8A). Registration process is positively related to perceived quality.
Hypothesis 8B (H8B).Payment process is positively related to perceived quality.
Hypothesis 9 (H9). Biodiesel station is positively related to perceived quality.
Hypothesis 10 (H10). Engine operation and maintenance is positively related to perceived quality.
Hypotheses on sustainable benefits
Hypothesis 11 (H11). Sustainable production at community level is positively related to perceived value: price vs. quality.
Hypothesis 12 (H12). Sustainable consumption at community level is positively related to sustainability of the community.
Hypothesis 13 (H13). Sustainability of the community is positively related to perceived value: price vs. sustainability.
Hypothesis 14 (H14). Sustainability of the community is positively related to loyalty.
Hypothesis 15 (H15). Expectations are positively related to sustainability of the community when these are less than the sustainability of the community.
Hypothesis 16 (H16). Expectations are positively related to perceived value: price vs. sustainability, when these are less than perceived value.
Hypothesis 17 (H17). Perceived value: price vs. sustainability is positively related to user satisfaction.
Hypothesis 18 (H18). Perceived value: price vs. sustainability is positively related to loyalty.
Postulated hypothesis: √; unpostulated hypothesis: ✕.
Table 3. Generic latent variables of self-oriented benefits for Cowichan Biodiesel Co-op.
Latent Variable Based on ACSIDefinition (Within This Research)Definition’s Author
SatisfactionComparison among recently accumulated experience and expectations.[65]
LoyaltyPredisposition of the user to continue using a product.[24]
Perceived qualityFulfillment of user needs by a product or service.[56]
ExpectationsAnticipation based on self-oriented and sustainable benefits.[56]
Value: price and qualityRelationship between product perceived quality and price paid.[56]
Table 4. Specific latent variables of self-oriented perceived quality for Cowichan Biodiesel Co-op.
Latent Variable Definition (Within This Research)
Registration processProcess for inscription and annual renewal in cooperative members.
Biodiesel payment processProcess for biodiesel payment.
Biodiesel registration and paymentProcess for inscription, membership renewal, and biodiesel payment
Biodiesel stationProcess for biodiesel filling in the corresponding pump and station.
Engine operation and maintenanceProcess for biodiesel evaluation: performance, operation, and required motor maintenance.
Table 5. Specific latent variables of sustainability benefits for Cowichan Biodiesel Coop.
Latent VariableDefinition (Adopted for the CBC Case Study)Latent Variable Complement
Sustainability of the community by CBCContribution of CBC to the communitarian sustainability of the cooperative. The enterprise must generate quality and sustainability.Perceived quality (self-oriented).
Sustainable consumption of biodieselBiodiesel consumption and the importance of reducing negative environmental and social impacts. Products should be useful and reduce their effect on the environment.Specific variables of quality (self-oriented).
Sustainable production
of biodiesel
Biodiesel production and the importance of supporting a local company that creates jobs and that utilizes a waste-upcycling process.Previously, consumption models did not include how production processes impact the user community.
Value: sustainability and priceComparison between sustainable benefits and transportation payment (automobile and biodiesel).
Sustainability also has a price.
Value: quality vs. price.
Table 6. Measurement indicators for latent variables.
Latent VariableManifest Variable20172019
ExpectationsOverall co-op operation * (products and services offered)
Quality dimensions * (products and services offered)
Contribution of cooperative production to community sustainability (benefits)
Contribution of biodiesel consumption to community sustainability (benefits)
Registration processRegistration process (products and services offered)
Payment processPayment at co-op office/payment at biodiesel station (products and services offered)
Biodiesel user guide (knowledge and understanding; trust)
CO2 information (knowledge and understanding)
Biodiesel stationCloseness of regular activities (experience and social aspects: impact on everyday life)
General operation (products and services offered)
Blend availability/hours of operation (experience and social aspects: convenience)
Engine operation and maintenanceEfficiency km/L (benefits)
Engine operation (benefits)
Engine maintenance (benefits)
Perceived qualityOverall operation co-op * (products and services offered)
Quality dimensions * (products and services offered)
Sustainable productionImportance of upcycling waste cooking oil vs. petroleum
(personal characteristics: desire to change; benefits)
Importance of co-op vs. big companies
(personal characteristics: desire to change; benefits)
Sustainable consumptionImportance of personal and community health
(personal characteristics: sense of community; benefits)
Importance of community sustainability
(personal characteristics: sense of community; benefits)
Importance of water and air pollution
(personal characteristics: desire to change; benefits)
Sustainability of the communityOverall contribution of the co-op to community sustainability (benefits)
Production and consumption: co-op contribution to community sustainability (benefits)
Value: price vs. qualityQuality vs. price * (values)
Price vs. quality * (values)
Value: price vs. sustainabilitySustainability vs. price (values)
Price vs. sustainability (values)
SatisfactionGeneral satisfaction about the co-op * (experience and social aspects)
Confirmed expectations of the co-op * (experience and social aspects)
Comparison of co-op with ideal * (experience and social aspects)
LoyaltyRe-purchase * (experience and social aspects)
Recommendation (experience and social aspects)
* Adapted ACSI indicator. Measured indicator: √; unmeasured indicator: ✕.
Table 7. Sample data of demographic characteristics.
Demographic CharacteristicsFrequencyPercentage
Gender Male 1280%
Female320%
Age29–45213%
45–61853%
61–77533%
EducationHigh school213%
Some college427%
4-year college320%
Master’s degree640%
OrganizationNon-profit213%
Government17%
Trades17%
For-profit960%
Retired213%
Table 8. Measurement models from 2017 and 2019.
Latent VariableInternal ConsistencyConvergent ValidityDiscriminant Validity
Cronbach’s Alpha > 0.6Composite Realiability > 0.7AVE > 0.5Correlation > 0.707
20172019201720192017201920172019
Expectations0.8200.7960.8800.8740.6500.7030.8060.838
Perceived quality0.6760.9080.8590.9560.7530.9150.8680.957
Value: price vs. quality0.8600.8940.9340.9490.8770.9040.9370.951
Satisfaction0.8610.7680.9150.8650.7830.6810.8850.825
Loyalty0.7100.6220.8720.8410.7730.7250.8790.852
Registration process1.000NA1.000NA1.000NA1.000NA
Payment process1.000NA1.000NA1.000NA1.000NA
Registration/payment processNA0.760NA0.864NA0.690NA0.830
Biodiesel Station0.8670.5820.9350.8080.8770.6830.9370.827
Engine operation and maintenance0.7940.6000.8750.7750.7000.5380.8370.734
Sustainable production0.7150.6790.8740.8610.7770.7570.8820.870
Sustainable consumption0.7650.9600.8940.9740.8090.9260.8990.962
Sustainability of the community0.8100.7940.9120.9060.8380.8290.9160.910
Value: price vs. sustainability0.8850.8070.9450.9120.8960.8390.9470.916
Table 9. Discriminant validity by Fornell–Larcker criteria, model 2017.
Latent VariablePQSCBSEXLOOMPPPQPSSPRPSASC
Perceived
quality (PQ)
0.868
Sustainable consumption (SC)0.5850.899
Biodiesel
station (BS)
0.4200.2500.937
Expectations
(EX)
0.7100.6340.2530.806
Loyalty
(LO)
0.5710.8950.1870.6290.879
Engine operation and maintenance (OM)0.7290.5120.2430.6120.3870.837
Payment
process (PP)
0.1470.025−0.2170.2740.0000.0981.000
Value: price vs. quality (PQ)0.5100.7280.3390.6940.5200.463−0.0060.937
Value: price vs. sustainability (PS)0.6670.5050.4430.6230.3310.848−0.0520.6970.947
Sustainable production (SP)0.3500.9020.1100.6220.7730.3650.0000.7890.4720.882
Registration
process (RP)
0.7880.4120.1390.7430.5570.5360.2990.1660.3400.1991.000
Satisfaction
(SA)
0.7760.7430.3840.7960.6670.8860.0370.6480.8520.6330.6290.885
Sustainability of the community (SC)0.6310.6600.3590.6380.5470.556−0.0760.5540.6940.5920.5540.7010.916
Table 10. Discriminant validity by Fornell–Larcker criteria, model 2019.
Latent VariablePQSCBSEXLOOMRPPPQPSSPSASC
Perceived
quality (PQ)
0.957
Sustainable consumption (SC)0.3570.962
Biodiesel
station (BS)
0.745−0.0510.827
Expectations
(EX)
0.5410.6460.3280.838
Loyalty
(LO)
−0.205−0.184−0.089−0.1810.852
Engine operation and maintenance (OM)0.7250.1780.6330.636−0.0560.734
Registration and payment process (RPP)0.8780.2020.8030.270−0.1960.6250.830
Value: price vs.
quality (PQ)
0.7150.6950.2330.674−0.0220.5380.4620.951
Value: price vs. sustainability (PS)0.0930.477−0.0110.2980.3120.081−0.0030.4870.916
Sustainable
production (SP)
0.4930.4140.1110.745−0.0850.7230.1920.6910.2990.870
Satisfaction
(SA)
0.8010.2000.6540.3270.0910.6980.8280.6700.2050.3960.825
Sustainability of the community (SC)0.8340.5380.6880.684−0.4640.5920.7660.6140.2260.3980.6130.910
Table 11. Predictive relevance of the 2017 model.
Endogenous VariablesQ2—2017
Perceived quality0.60
Sustainability of the community0.42
Value: price vs. quality0.61
Value: price vs. sustainability0.47
Satisfaction0.67
Loyalty0.53
Table 12. Identification of factors and improvements.
Identified DimensionsImprovements
Biodiesel price to improve the relationship in value price and quality as well as value for value price and sustainability. The drop in the price of fossil oil led to the price of pure biodiesel to become significantly higher than that of diesel.The price was adjusted so that the B20 blend made up of 20% biodiesel and 80% diesel had a lower price than diesel. Thus, the most price-sensitive users could opt for the benefits of this blend for engine lubrication and pollution reduction.
Registration process and membership annuity payment were carried out by phone or in person at the cooperative office.A new system in the pumps charges the annuity automatically. The mandatory registration to load biodiesel was eliminated
Biodiesel stations, due to problems with pump operation, meant that the availability of the desired blend and the ability to choose the pump closest to the regular activities of the users were not met.A more modern pump was rebuilt and installed at the location closest to the city’s downtown. This pump is characterized by offering the blends B20, B50, and B100 and operates continuously.
The biodiesel payment process sometimes required the user to pay at the cooperative’s office before biodiesel filling.Payment is made automatically by credit or debit card using the pump’s point of sale system, and a receipt is issued informing users about the price and CO2 savings.
Diffusion of more information about the biodiesel blend to be used to improve engine operation and maintenance.The explanation in the biodiesel use guide was expanded, paying special attention to the selection of the biodiesel blend by considering temperatures below freezing and car warranties.
Table 13. Predictive relevance for the 2019 model.
Endogenous VariablesQ2—2019
Perceived quality0.79
Sustainability of the community0.39
Value: price vs. quality0.59
Value: price vs. sustainability0.07
Satisfaction0.56
Loyalty0.43
Table 14. Comparative indexes for latent variables.
Latent Variable2017 Index2019 IndexChangeHypothesis Testing
H0: μ1 − μ2 = 0
H1: μ1 − μ2 ≠ 0
p Value
Expectations79.5180.41=No significant difference0.437
Perceived quality87.3385.53=No significant difference0.035
Value: price vs. quality86.5993.69+Confirmed significant difference0
Satisfaction83.1981.68=No significant difference0.071
Loyalty97.5598.33+Confirmed significant difference0.005
Payment process71.8684.33+Confirmed significant difference0.0001
Biodiesel station84.1378.16Confirmed significant difference0.0001
Engine operations and maintenance84.9489.63+Confirmed significant difference0.0001
Sustainable production95.6997.80=No significant difference0.0001
Sustainable consumption91.9192.79=No significant difference0.311
Sustainability of the community86.0191.06+Confirmed significant difference0.0001
Value: price vs. sustainability82.8189.11+Confirmed significant difference0.0001
H0: Null Hypothesis, H1: Alternative Hypothesis.
Table 15. Comparative indexes for manifest variables.
Improve DimensionsStatistically Significant Differences in Performance
Biodiesel priceValue price and quality: increased
Value price and sustainability: increased
Registration process and membership annuity paymentThe change could not be assessed because the annuity payment indicator was unreliable. Registering as a member was eliminated as a requirement for biodiesel consumption.
Biodiesel station (installation of a pump to improve availability)Biodiesel station: decreased
Biodiesel payment processBiodiesel payment process: increased
Diffusion of more information on the biodiesel blend to be used to improve engine operation and maintenanceEngine operation and maintenance: increased
Table 16. Hypotheses testing of the MUSI-CSE’s SEM.
Hypotheses20172019
Generic hypotheses: self-oriented benefits
H1
H2
H3
H4
H5
H6
H7
Specific hypotheses on quality: self-oriented benefits
H8NA
H8ANA
H8BNA
H9
H10
Hypotheses on sustainable benefits
H11
H12
H13
H14
H15
H16
H17
H18
Confirmed relationship: √; rejected relationship: ✕.
Publisher’s Note: MDPI stays neutral with regard to jurisdictional claims in published maps and institutional affiliations.

