Skip to Content
SustainabilitySustainability
  • Article
  • Open Access

27 September 2022

Mapping of Suitable Sites for Concentrated Solar Power Plants in the Philippines Using Geographic Information System and Analytic Hierarchy Process

,
,
and
Department of Mechanical Engineering, University of the Philippines Diliman, Quezon City 1101, Philippines
*
Author to whom correspondence should be addressed.

Abstract

Solar energy is a renewable source of energy harnessed from the sun. Concentrated solar power (CSP) plants harness this energy by focusing sunlight on a limited area to heat a working fluid, which is used to generate steam and power a thermodynamic cycle that produces electricity. There are currently no CSP plants in the Philippines, and this study aimed to locate the most suitable sites for this type of power plant. The first step was to mask out areas totally unsuitable as plant sites; we identified five exclusion factors for this: protected areas, slope, direct normal irradiance (DNI), water bodies, and land cover type. A scoring gradient was then applied to the remaining suitable areas according to seven ranking factors: DNI, slope, typhoon frequency, capacity of the nearest grid line, distance to the nearest grid line, distance to the nearest road, and distance to the nearest water body. Next, to reflect the actual degrees of influence of the factors to site suitability, we determined their relative numeric weights using analytic hierarchy process, with the weights derived from inputs from interviews with academic and industry experts. Finally, using ArcGIS Pro, we used a weighted sum of the ranking scores to produce a suitability map covering the entire Philippines. Suitable sites in the following provinces were found: Ilocos Sur, Pampanga, Mindoro, Masbate, and Maguindanao. These areas have a total area of 27.9 km2 and a projected total power output of 733 MW.

1. Introduction

Solar energy is the energy that comes from the sun in the form of radiation [1]. The sunlight that reaches the Earth’s surface is nearly 50% visible light, 45% infrared radiation, and small amounts of ultraviolet and other forms of electromagnetic radiation. It is the cleanest and most abundant renewable source of energy [2]. It can be harnessed to produce electricity without emitting carbon. In 2019, the world consumed 1793 TWh of solar energy, which is 5% of the total renewable energy mix and 1% of the total energy mix [3].
In 2008, Republic Act No. 9513, or the Renewable Energy Act of 2008, was passed with the goal of accelerating the exploration and development of renewable energy technologies in the Philippines [4]. This law encouraged companies to invest in renewable energy through incentives, such as the feed-in tariff (FIT) system. The FIT system entitles renewable energy producers to the benefit of a fixed payment for every kilowatt-hour of energy distributed to the grid within a minimum period of 12 years [5]. However, the FIT period increased up to 20 years as per the Energy Regulatory Commission Resolution 16 series of 2010 [4].
As of December 2021, the Philippines has 1317 MW total installed capacity in solar power connected to the grid, with 757 MW in Luzon, 476 MW in Visayas, and 84 MW in Mindanao [6]. These numbers are nameplate capacities, as calculated from electric generator nameplates based on the rated power factors. The dependable capacities, i.e., maximum capacities when modified for ambient limitations for a specified period of time, are lower: 586 MW for Luzon, 381 MW for Visayas, and 67 MW for Mindanao, for a total of 1034 MW. Both capacities exceed the National Renewable Energy Program’s (NREP) goal of 285.0 MW installed capacity in solar power by 2030 [4]. Despite this achievement, the Philippines is still lacking compared to its neighboring countries. Vietnam is currently leading the solar power industry in Southeast Asia with 16,504 MW in 2020. Thailand is second with a total installed capacity of 2983 MW in the same year. They are the only Southeast Asian countries with solar thermal technology [7].
Even though the country has surpassed the NREP goal for solar power, the Philippines still has a long way to go in terms of harnessing renewable energy sources overall. As of 31 May 2021, the total installed capacity for renewable energy is 5468.91 MW, which is still far from NREP’s goal of 15,304.3 MW by 2030 [8]. The country is still mostly reliant on fossil fuels for energy production, according to the 2020 energy supply mix with 66.5% from oil, coal, natural gas, and ethanol, while the remaining 33.5% is from renewable energy sources [8]. Installing more solar power plants will help achieve the NREP goal and improve the energy mix.
Concentrated solar power (CSP) is a relatively new energy technology. CSP plants use reflectors to focus sunlight on receivers, boiling working fluid. The thermal energy is converted to electricity using conventional thermodynamic cycles.
Researchers conduct site suitability studies to determine ideal locations for renewable energy plants, including CSP systems. Most studies use geographic information system (GIS) in creating, modifying, and processing geographic data. Methods of multi-criteria decision-making (MCDM) are used to weigh and compare the different factors that affect the suitability of a site; the most common MCDM method used in site suitability studies is the analytic hierarchy process (AHP).
In this study, exclusion criteria were established to mask out areas totally unsuitable as plant sites, such as areas with rough terrain and low solar irradiation; the GIS software ArcGIS Pro was used in processing map data. Then, with the use of AHP, ranking criteria were used to determine the most important factors in site suitability. Finally, ArcGIS processing yielded the desired site suitability map.

1.1. Statement of the Problem

There are currently no CSP plants in the Philippines. CSP technologies can store thermal energy, which means they can produce electricity at night and during low-sunshine periods. Thus, installing CSP plants can help improve the baseload grid capacity. However, installing a large-scale renewable energy plant, no matter what the type is, requires the determination of the most suitable plant locations, and there have been no papers that have done this.

1.2. Objectives

This study aimed to achieve the following:
  • Construct a weighted ranking of factors that affect the suitability of a site as a CSP plant location;
  • Determine the most suitable locations for CSP plant installation in the Philippines.

1.3. Significance of the Study

To combat climate change, greenhouse gas emissions must be cut down, and this requires the expansion of our renewable energy capacity. Determining suitable sites for CSP plants in the Philippines will help in accelerating the harnessing of renewable energy in the country, given that the country is still far from the goal of 15,304.3 MW by 2030 set by NREP. The results of this study will be a significant contribution to the first steps in deploying CSP in the country. Moreover, the addition of a new type of technology can encourage scientific research in the country.

1.4. Limitations of the Study

The results of this study were highly dependent on the availability of maps. The researchers had to make do with what were available from credible sources. Additionally, the factors for site suitability considered in this study were limited only to topographic, meteorological, and logistic factors. Economic factors, such as the installation costs of the plants that can be built on the suitable sites, and design factors, such as the sizing of the plants, are beyond the scope of this study.

3. Methodology

This study used GIS analysis, with AHP as the MCDM method, in mapping suitable locations for CSP plants in the Philippines; Figure 1 presents the methodology. The first step was the identification of exclusion criteria that mask out areas unsuitable as plant location. This study used exclusion factors collated from the related literature reviewed in the last section. These masks were mapped and overlaid using ArcGIS Pro. Next, a list of factors to be weighed using AHP were constructed, and tiers of scores were developed for each factor. Interviews with experts and stakeholders were conducted, and their inputs were used in constructing the pairwise comparison matrix. AHP computations yielded the required weights. Lastly, the suitability score of locations in unmasked regions were computed using a simple weighted sum of the scores and the AHP weights.
Figure 1. Methodology.

3.1. Exclusion Criteria

Table 5 shows the exclusion factors that were used to mask out totally unsuitable areas. For each factor, the exclusion factor and the map used, including its source, are shown.
Table 5. Exclusion factors and criteria used.

3.2. AHP

Respondents were given questionnaires where they compared every pair of ranking factors and for each pair determined the more important one, if there is one. They were asked to use the numbers 1 to 9 in comparing the factors, as prescribed by Saaty in his comparison scheme (see Table 3). Their inputs were arranged into the comparison matrices.
In consolidating the multiple comparison matrices, the method of aggregation of individual judgments was chosen because it yielded a better set of weights or priorities, as will be shown. The geometric mean method was used to aggregate the comparison matrices, and the eigenvector method was used to derive the weights from the aggregate matrix.

3.3. Ranking Factors

After reviewing related literature, we arrived with the following set of seven ranking factors:
  • DNI;
  • Typhoon frequency or the average number of typhoons that hit an area in a year;
  • Slope;
  • Voltage rating of the nearest grid line;
  • Distance to the nearest grid line;
  • Distance to the nearest road;
  • Distance to the nearest water body.
An additional factor, condition of the nearest road, was initially considered but was then excluded due to lack of data source. While only lakes were considered in the exclusion criteria, both lakes and rivers were considered in the ranking factor of distance to water body.

3.4. Respondents

The researchers created an initial list of respondents of 30 people, who are all stakeholders in the solar energy industry. Out of the 30 invited, only six people accepted the invitation to participate. Four of these respondents were from the academe, one from the industry, and one from the government. Table 6 shows brief profiles of them.
Table 6. Profiles of respondents.

3.5. Scoring System

A linear scoring system for each of the ranking factors was constructed (see Table 7); all the papers reviewed used a linear system as well. For a given factor, bins of equal width were specified to contain all the values of that factor across the entire Philippines. For example, the maximum slope value considered for ranking is 2.1% while the minimum value on the generated slope map is 0. A lower slope corresponds to a higher score, so the lower bound for the highest score of 9 was set to 0. Setting the bin width to 0.25% situates 2.1% within the bounds for the lowest score of 1, which are 2.00% and 2.25%. For the distances to grid, road, and water body, we did not use a maximum allowed value. Thus, the highest values that appeared in the map were assigned to the lowest score of 1; the bin sizes were adjusted accordingly to make sure the highest values fit inside the intervals for the score of 1. For example, the largest distance to grid detected was 389 km; the bin for the score of 1, which is actually 360–405 km (notice that the bin size is 45 km), contains this maximum value.
Table 7. Suitability scores for the ranking factors.

4. Results and Discussion

This section discusses the individual exclusion maps and the final exclusion map generated, the weights and consistency ratios obtained using AHP, the final suitability map generated, and projected power output from the suitable sites.

4.1. Exclusion Map

The application of the overall exclusion layer significantly reduced the total viable area to only about 0.3% of the total Philippine land area, with the slope and DNI being the biggest eliminating factors.
Considering the threshold value for DNI of 1600 kWh/m2/year, only 6% of the Philippine land area is suitable as plant location, contradicting the expectation that the country will have a lot of well-lit areas due to its proximity to the equator. Several factors, including microclimate, pollution, cloud cover, and abundance of terraneous areas, may have contributed to the low turnout. Most of these well-lit areas are in Region I (see Figure 2a).
Figure 2. Exclusion map for each of the ranking factors: (a) direct normal irradiance (DNI); (b) land cover; (c) DNI (central Luzon closeup); (d) land cover (central Luzon closeup); (e) water bodies; (f) protected areas; and (g) slope.
Figure 2b shows the exclusion map for land cover. As expected, agricultural centers and highly urbanized areas with a considerably strong industrial base were mostly excluded, especially areas in NCR and Region IV-A. Areas in Region I and CAR were deemed suitable, since they are less densely populated and slope was not taken into account for this exclusion layer. The huge presence of mangroves across the Palawan province and some portions of Mindanao also contributed to the elimination of the said areas.
An area is deemed suitable if it receives high DNI and has a suitable land cover type. Referring to Figure 2c,d, it can be noticed that areas with high DNI have unsuitable land cover type, and areas with suitable land cover type have low DNI. The mutual exclusivity of these two types of suitable areas was the biggest factor in the significant reduction in suitable area in the country.
Figure 2e shows the exclusion map for water bodies. As previously discussed, only lakes were excluded.
Figure 2f shows the exclusion map for protected areas. Protected areas in the Philippines occupy 15.82% of the country’s total land area. Notice how Palawan is almost entirely a protected area.
A huge portion, or 83.85%, of the country’s total land area has slope greater than 2.1%, making it unsuitable for CSP installation (see Figure 2g). The relatively flat areas are mostly in Regions III and XII.
Figure 3a shows the resulting aggregate exclusion map, with closeup insets of northern Luzon (Figure 3b) and Mindoro (Figure 3c). Notice how almost the entire country is not suitable as plant location; the suitable areas are small, few, and scattered that they are not appreciably visible in a magnification that shows the entire country, as in Figure 3a. The resulting viable areas were concentrated on Region I, Pampanga, Mindoro, Masbate, and Maguindanao.
Figure 3. Resulting exclusion map (a) with closeups of (b) northern Luzon and (c) Mindoro.

4.2. Weights and Consistency Ratios

Table 8 shows the aggregate matrix derived from the individual comparison matrices using the geometric mean method, with values shown up to two decimal places.
Table 8. Aggregate pairwise comparison matrix.
Table 9 shows the consistency ratios of the individual comparison matrices of the respondents. Note how only one respondent, Respondent 5, yielded a ratio less than the threshold value of 10%, or 0.10.
Table 9. Consistency ratios of the individual comparison matrices.
The consistency ratio of the aggregate comparison matrix is 0.0368, which is less than 0.1. Table 10 shows the priorities computed using the eigenvector method, along with the respective ranks in descending order. For comparison, the priorities computed from aggregating individual priorities, also using the eigenvector method for deriving the individual priorities and then the geometric mean method for deriving the final priorities, are also shown.
Table 10. Priorities computed using aggregation of individual judgments and aggregation of individual priorities.
The ranking of the factors in both methods is the same except for typhoon frequency and distance to grid. Since we have incomplete data on typhoon tracks, we chose the first set of priorities, which puts less weight on typhoon frequency.

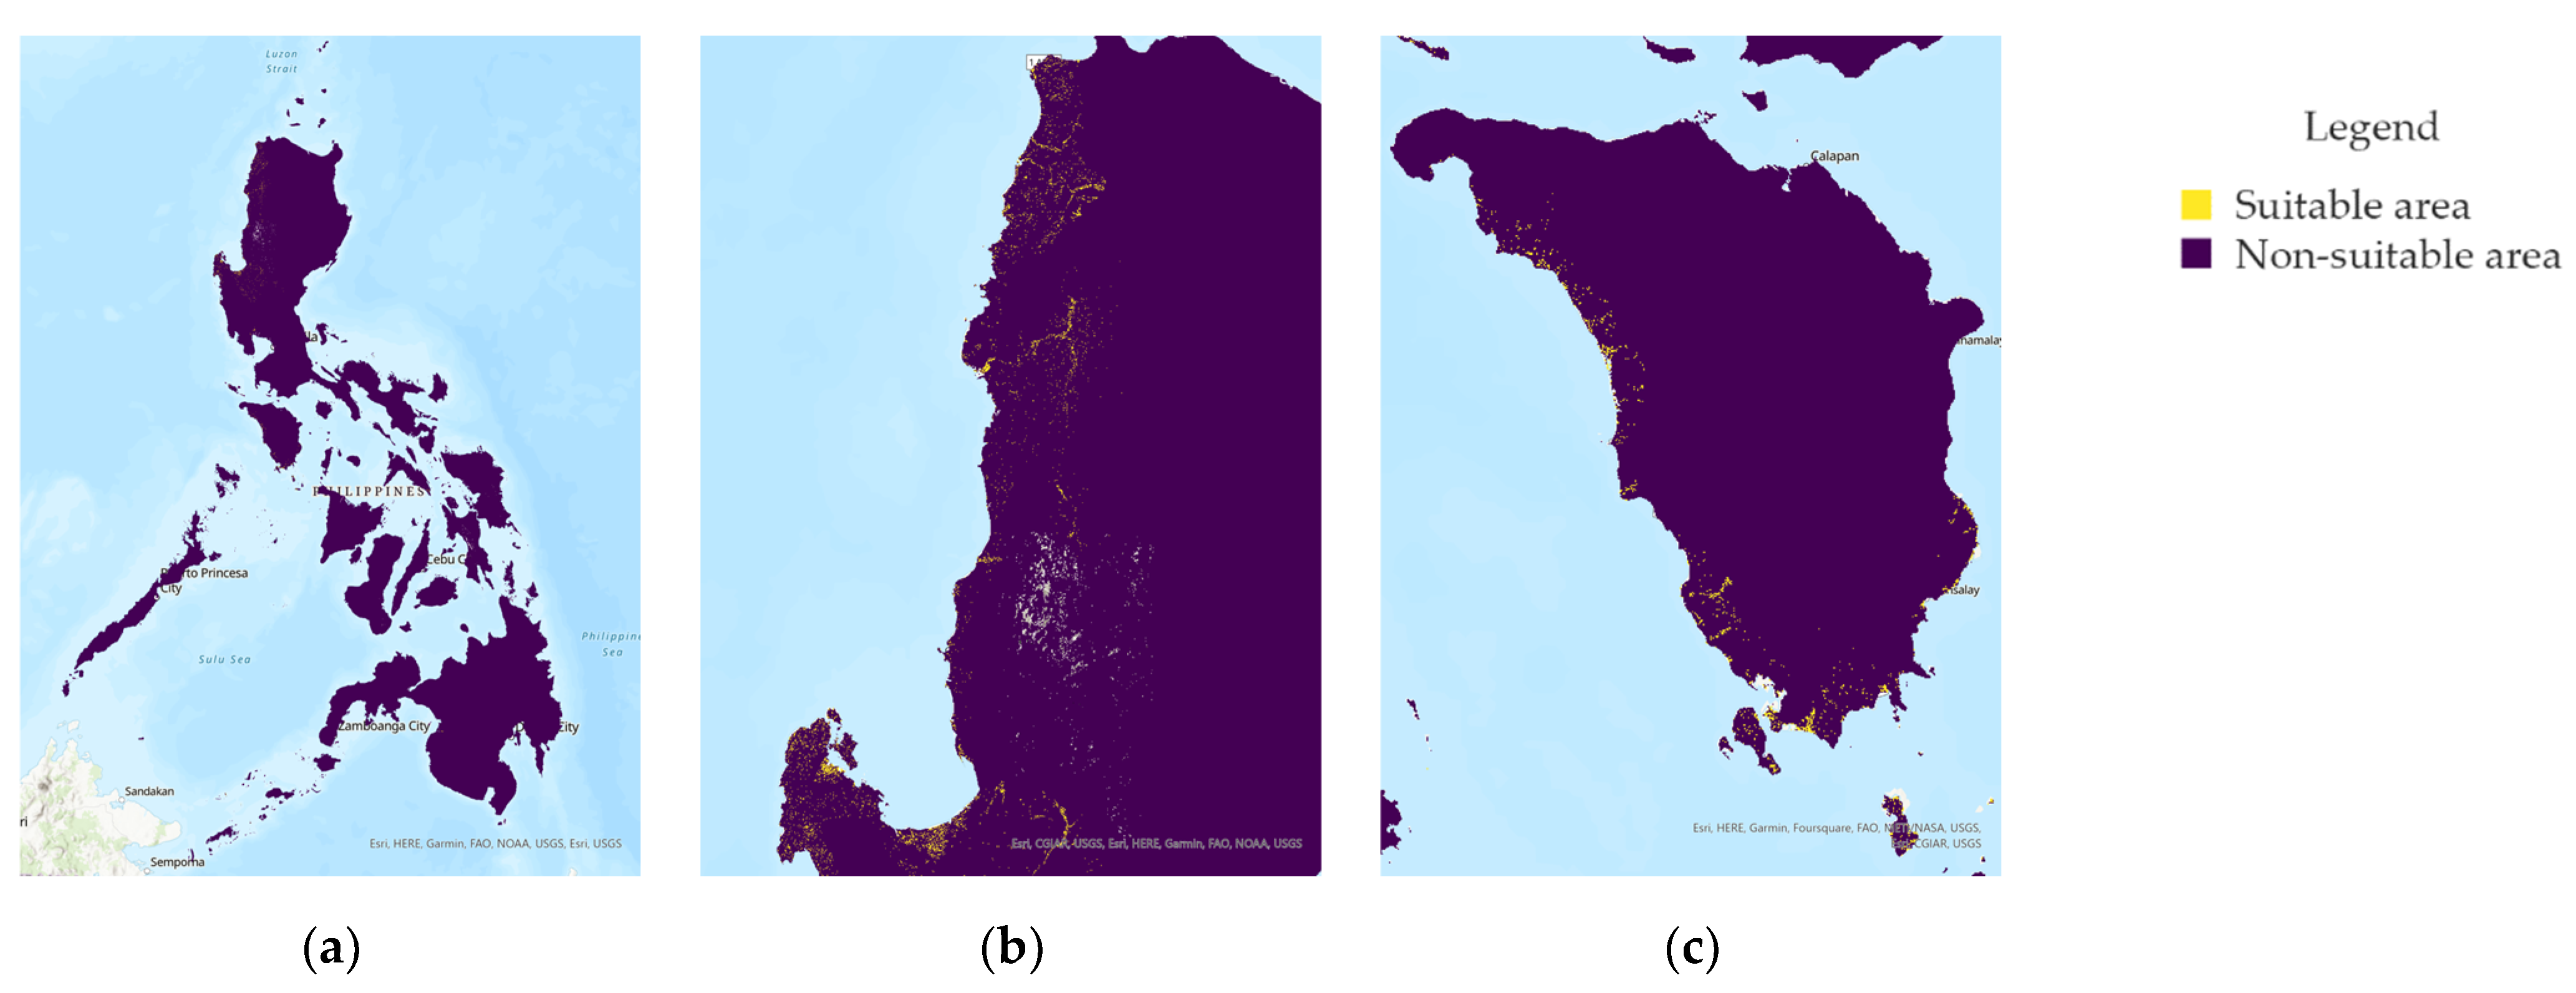
4.3. Final Suitability Map

Applying the scoring system to the raw maps, with the AHP weights, produced the unmasked suitability map shown in Figure 4a; note that the exclusion map has not been applied here yet. The suitability scores ranged from 2.8 to 8.0, with a mean of 3.5. More than half of the country (57.36%) has an intermediate suitability score of 3–4, while those with a score between 4 and 5 comprise 38.96% of the total land area. Figure 5 shows the distribution of the suitability scores for the entire country; the horizontal axis is the score, and the vertical axis is the number of pixels.
Figure 4. Final suitability map with the exclusion layer (a) not applied and (b) applied.
Figure 5. Distribution of the suitability scores in the Philippines.
It can be seen that the most suitable areas in the Philippines are the ones with the highest DNI (compare Figure 2a and Figure 4a). This is because DNI has the highest computed priority.
Lastly, the exclusion map previously created was applied on the unmasked suitability map to produce the final, masked suitability map shown in Figure 4b. As previously discussed, only about 0.3% of the entire Philippines remained after applying the exclusion layer, so only a few areas are left in the final map. They are also scattered across the entire country, so they are almost not visible in the scale of Figure 4b.
The most suitable areas for CSP installation are scattered across the Ilocos provinces (see Figure 6a). A contiguous area was found near Caoayan, Ilocos Sur, with an area of 5.18 km2. However, this area is on a river delta, making it unsuitable for plant construction. The next most suitable areas are in Pangasinan. The researchers were unable to calculate the largest contiguous area here because the patches of suitable areas were too scattered (see Figure 6b).
Figure 6. Closeups of the final masked suitability map: (a) Ilocos provinces; (b) Pangasinan; (c) Pampanga; (d) southern Mindoro; (e) southern Masbate; and (f) Maguindanao.
The largest contiguous area in Pampanga is 3.79 km2, an agricultural land with bare areas (see Figure 6c). In southern Mindoro, the largest contiguous area is 6.03 km2 (see Figure 6d). Similar to Pampanga, the land is used for agriculture and contains bare areas as well.
Southern Masbate contains the largest contiguous area suitable for CSP installation in the Philippines, specifically 8.35 km2 (see Figure 6e). The last suitable area is in Cotabato City, Maguindanao, with an area of 4.56 km2 (see Figure 6f). Both of these areas are bare land.

4.4. Projected Capacity

Column 2 of Table 11 shows the lowest annual DNI value in the largest contiguous area in the five locations discussed in the previous section; the corresponding available solar power values in W/m2 are in the next column. The areas of those suitable contiguous sites are shown in Column 4. The lower bound value was utilized to provide a more grounded evaluation of the said areas.
Table 11. Lower bound energy generation of the largest contiguous area at suitable areas.
The power output, shown in the last column, was estimated using the formula
Projected Power Output = Available Solar Power × Area × Area Collection
Factor × Efficiency.
The area factor is the fraction of the total site’s area covered by heliostats. The value of 0.7 was used based on the maximum land occupancy of solar collectors with minimum shading effect [25]. Solar power plants have average efficiency values of 7–25% [35]; a fairly conservative value of 20% [18] was used. The computed projected power outputs are shown in the last column. The Ilocos site receives the highest DNI, but the Masbate site has the highest projected output because of its larger land area. Pangasinan was not included because the researchers were unable to determine a contiguous area.

5. Summary and Recommendations

Just like most renewable energy systems, the performance of a CSP plant is site-sensitive and highly dependent on the existing main energy source in the area. The following factors were chosen to determine the suitability of a location as a CSP plant: DNI, typhoon frequency, slope, voltage rating of nearest grid line, and distances to the nearest grid line, road, and water body. Their respective weights were determined using AHP; DNI, distance to grid, and typhoon frequency obtained the highest weights. This satisfies the first objective set in Chapter 1.
To satisfy the second objective, a map of the suitability scores of areas across the entire Philippines was generated. Despite the proximity of the country to the equator, the country receives relatively low DNI, with respect to CSP requirements, and this substantially restricted the total suitable area. The total suitable area in the country is about 905 km2; much of this area, however, is non-contiguous. Relatively large, contiguous suitable areas were found in the following provinces: Ilocos, Pampanga, Mindoro, Masbate, and Maguindanao. The Ilocos site, which covers 5.18 km2 has the highest average DNI of 199 W/m2. The Masbate site, however, yielded the highest projected power output of 219 MW due to its large land area (8.35 km2). The total area and total projected output of the five sites are 27.9 km2 and 733 MW, respectively, or 26.3 MW/km2.
Suitability studies such as the present paper rely heavily on the availability of maps on the factors to be used. In this study, only lakes were excluded as water bodies. There are data on the location of rivers, but there are no data on their widths. Using a single value for the width will misrepresent a large number of rivers, so it was decided to disregard them in creating the exclusion map. Hence, river deltas, such as the one in Ilocos Sur, were included in the final suitability map when they should not have been. There are also incomplete data on the typhoon tracks; the typhoon frequencies computed were underestimations. Thus, it is recommended, before conducting a suitability study such as this, to make sure there are complete data on the exclusion and ranking factors to be used.
While multiple factors were already incorporated in this study, further research can still be done to include other parameters that were not covered in this paper. To add more depth to the technical aspect of site selection, the wind velocity and soil composition could also be included in further studies to factor in possible loss of efficiency due to abrasion on the reflector surface. Moreover, since there are four standard CSP systems being used in the industry, a more specific study can be conducted that will consider the efficiency, cooling requirements, capital costs, and base load capacity of the said systems to determine the best fit in this country’s geographic and climatic conditions. Furthermore, since renewable energy is also subjected to market forces, an economic evaluation combined with sensitivity analysis on potential electricity prices can be performed to provide a more holistic view of the potential for a CSP plant in the country. The distance to the nearest existing solar power plant could also be added as a factor, since the existence of the said plants usually indicates that the necessary infrastructural support was already available within the vicinity.

Author Contributions

Conceptualization, data curation, formal analysis, investigation, methodology, project administration, resources, software, visualization, writing—original draft, review, and editing, A.T.A.L., R.P.T.O. and J.R.V.S.; supervision, validation, funding acquisition, resource, L.A.M.D. All authors have read and agreed to the published version of the manuscript.

Funding

The APC was funded by the Department of Science and Technology through the Engineering Research and Development for Technology Program.

Institutional Review Board Statement

Not applicable.

Data Availability Statement

Some of the maps analyzed in the study are available for viewing and downloading online at the following links: https://earthexplorer.usgs.gov/ (SRTM DEM); https://globalsolaratlas.info/download/philippines (DNI map); https://data.humdata.org/dataset/philippines-water-body-lakes (lake map); https://data.humdata.org/dataset/hotosm_phl_north_roads and https://data.humdata.org/dataset/hotosm_phl_south_roads (road map); and https://data.humdata.org/dataset/hotosm_phl_north_waterways and https://data.humdata.org/dataset/hotosm_phl_south_waterways (river map). The typhoon frequency map used was created from typhoon track data downloaded from a National Oceanic and Atmospheric Administration database (https://www.ncei.noaa.gov/data/international-best-track-archive-for-climate-stewardship-ibtracs/v04r00/access/shapefile/). Some of the maps used were requested from and provided by specific government agencies, with the agreement that they not be shared in any form anywhere. The map of protected areas was from the Department of Environment and Natural Resources Biodiversity Management Bureau, the land cover map from the National Mapping and Resource Information Authority, and the grid line data from the National Grid Corporation of the Philippines. All links accessed on 12 July 2022.

Acknowledgments

The authors would like to express their gratitude and appreciation to the Department of Environment and Natural Resources Biodiversity Management Bureau for providing the map of protected areas used in this study, the National Mapping Resource Information Authority for the land cover map, and the National Grid Corporation of the Philippines for the grid line map. The authors also like to thank the University of the Philippines Diliman Computer Center for assisting them with the ArcGIS Pro licensing.

Conflicts of Interest

The authors declare no conflict of interest.

References

  1. Ashok, S. Solar Energy. Available online: https://www.britannica.com/science/solar-energy (accessed on 12 July 2022).
  2. Solar Energy Industries Association. Solar Energy. Available online: https://www.seia.org/initiatives/about-solar-energy (accessed on 12 July 2022).
  3. Ritchie, H.; Roser, R. Energy Mix. Available online: https://ourworldindata.org/energy (accessed on 12 July 2022).
  4. Department of Energy. Empowered: Renewable Energy Decade Report 2008–2018. Available online: https://www.doe.gov.ph/renewable-energy?q=renewable-energy/empowered-renewable-energy-decade-report-2008-2018 (accessed on 12 July 2022).
  5. Suarez, B.; Wada, M. The role of solar photovoltaic power plants in Philippine energy production. J. Inf. Study Discuss. Glob. Resour. Manag. Doshisa Univ. 2017, 3, 51–62. [Google Scholar] [CrossRef]
  6. Department of Energy. 2021 Power Statistics. Available online: https://www.doe.gov.ph/sites/default/files/pdf/energy_statistics/2021_power_statistics_02_installed_and_dependable_capacity_per_plant_type_per_grid.pdf (accessed on 12 July 2022).
  7. International Renewable Energy Agency. Solar Energy. Available online: https://irena.org/solar (accessed on 12 July 2022).
  8. Department of Energy. Executive Summary. Available online: https://www.doe.gov.ph/executive-summary?withshield=1 (accessed on 12 July 2022).
  9. Zhang, H.L.; Baeyens, J.; Degrève, J.; Cacères, G. Concentrated solar power plants: Review and design methodology. Renew. Sustain. Energy Rev. 2013, 22, 466–481. [Google Scholar] [CrossRef]
  10. International Renewable Energy Agency. Technology Roadmap: Concentrating Solar Power. Available online: https://iea.blob.core.windows.net/assets/663fabad-397e-4518-802f-7f1c94bc2076/csp_roadmap.pdf (accessed on 12 July 2022).
  11. Schlecht, M.; Meyer, R. Site Selection and Feasibility Analysis for Concentrating Solar Power Systems. In Concentrating Solar Power Technology: Principles, Developments, and Applications, 2nd ed.; Lovegrove, K., Stein, W., Eds.; Woodhead Publishing: Sawston, UK, 2012; pp. 91–119. ISBN 987-1-8456-9769-3. [Google Scholar]
  12. Qoaider, L.; Liqreina, A. Optimization of dry cooled parabolic trough (CSP) plants for the desert regions of the Middle East and North Africa (MENA). Sol. Energy 2015, 122, 976–985. [Google Scholar] [CrossRef]
  13. Hussain, A.; Batra, A.; Pachauri, R. An experimental study on effect of dust on power loss in solar photovoltaic module. Renew. Wind Water Sol. 2017, 4, 9. [Google Scholar] [CrossRef]
  14. Alqaderi, M.; Emar, W.; Saraereh, O. Concentrated solar power site suitability using GIS-MCDM technique taken UAE as a case study. Int. J. Adv. Comput. Sci. Appl. 2018, 9, 261–268. [Google Scholar] [CrossRef]
  15. Aly, A.; Jensen, S.; Pederson, A. Solar power potential of Tanzania: Identifying CSP and PV hot spots through a GIS multicriteria decision making analysis. Renew. Energy 2017, 117, 159–175. [Google Scholar] [CrossRef]
  16. Merrouni, A.; Elalaoui, F.; Ghennioui, A.; Mezrhab, A.; Mezrhab, A. A GIS-AHP combination for the sites assessment of large-scale CSP plants with dry and wet cooling systems. Case study: Eastern Morocco. Sol. Energy 2018, 166, 2–12. [Google Scholar] [CrossRef]
  17. Haddad, B.; Díaz-Cuevas, P.; Ferreira, P.; Djebli, A.; Pérez, J. Mapping concentrated solar power site suitability in Algeria. Renew. Energy 2021, 168, 838–853. [Google Scholar] [CrossRef]
  18. Dawson, L.; Schlyter, P. Less is more: Strategic scale site suitability for concentrated solar thermal power in Western Australia. Energy Policy 2012, 47, 91–101. [Google Scholar] [CrossRef]
  19. Doorga, J.; Rughooputh, S.; Boojhawon, R. Multi-criteria GIS-based modelling technique for identifying potential solar farm sites: A case study in Mauritius. Renew. Energy 2019, 133, 1201–1219. [Google Scholar] [CrossRef]
  20. Gouareh, A.; Settou, B.; Settou, N. A new geographical information system approach based on the best worst method and analytic hierarchy process for site suitability and technical potential evaluation for large-scale CSP on-grid plant: An application for Algeria territory. Energy Convers. Manag. 2021, 235, 113963. [Google Scholar] [CrossRef]
  21. Giamalaki, M.; Tsoutsos, T. Sustainable siting of solar power installations in Mediterranean using a GIS/AHP approach. Renew. Energy 2019, 141, 64–75. [Google Scholar] [CrossRef]
  22. Mardani, A.; Jusoh, A.; Nor, K.; Khalifah, Z.; Zakwan, N.; Valipour, A. Multiple criteria decision-making techniques and their applications: A review of literature from 2000 to 2014. Econ. Res. 2015, 28, 516–571. [Google Scholar] [CrossRef]
  23. Castro, D.; Silv Parreiras, F. A review on multi-criteria decision-making for energy efficiency in automotive engineering. Appl. Comput. Inform. 2021, 17, 53–78. [Google Scholar] [CrossRef]
  24. Dožić, S.; Kalić, M. Comparison of two MCDM methodologies in aircraft type selection problem. Transp. Res. Procedia 2015, 10, 910–919. [Google Scholar] [CrossRef]
  25. Kumar, A.; Sah, B.; Singh, A.; Deng, Y.; He, X.; Kumar, P.; Bansal, R. A review of multi criteria decision making (MCDM) towards sustainable renewable energy development. Renew. Sustain. Energy Rev. 2017, 69, 596–609. [Google Scholar] [CrossRef]
  26. Saaty, T. A Scaling Method for Priorities in Hierarchical Structures. J. Math. Psychol. 1977, 15, 234–281. [Google Scholar] [CrossRef]
  27. Brunelli, M. Introduction to the Analytic Hierarchy Process; Springer: New York, NY, USA, 2015; ISBN 978-3-319-12502-2. [Google Scholar]
  28. Yushchenko, A.; de Bono, A.; Chatenoux, B.; Patel, M.; Ray, N. GIS-based assessment of photovoltaic (PV) and concentrated solar power (CSP) generation potential in West Africa. Renew. Sustain. Energy Rev. 2018, 81, 2088–2103. [Google Scholar] [CrossRef]
  29. Charabi, Y.; Gastli, A. PV site suitability analysis using GIS-based spatial fuzzy multi-criteria evaluation. Renew. Energy 2011, 36, 2554–2561. [Google Scholar] [CrossRef]
  30. Chen, C.-R.; Huang, C.-C.; Tsuei, H.-J. A hybrid MCDM model for improving GIS-based solar farms site selection. Int. J. Photoenergy 2014, 2014, 925370. [Google Scholar] [CrossRef]
  31. Doljak, D.; Stanojević, G. Evaluation of natural conditions for site selection of ground-mounted photovoltaic power plants in Serbia. Energy 2017, 127, 291–300. [Google Scholar] [CrossRef]
  32. Noorollahi, E.; Fadai, D.; Shirazi, M.; Ghodsipour, S. Land suitability analysis for solar farms exploitation using GIS and fuzzy analytic hierarchy process (FAHP): A case study of Iran. Energies 2016, 9, 643. [Google Scholar] [CrossRef]
  33. Sánchez-Lozano, J.; Antunes, C.; García-Cascales, M.; Dias, L. GIS-based photovoltaic solar farms site selection using ELECTRI-TRI: Evaluating the case for Torre Pacheco, Murcia, southeast of Spain. Renew. Energy 2014, 66, 478–494. [Google Scholar] [CrossRef]
  34. Zoghi, M.; Ehsani, A.; Sadat, M.; Amiri, M.; Karimi, S. Optimization solar site selection by fuzzy logic model and weighted linear combination method in arid and semi-arid region: A case study Isfahan-Iran. Renew. Sustain. Energy Rev. 2017, 68, 986–996. [Google Scholar] [CrossRef]
  35. Purohit, I.; Purohit, P. Technical and economic potential of concentrating solar thermal power generation in India. Renew. Sustain. Energy Rev. 2017, 78, 648–667. [Google Scholar] [CrossRef]
Publisher’s Note: MDPI stays neutral with regard to jurisdictional claims in published maps and institutional affiliations.

Article Metrics

Citations

Article Access Statistics

Multiple requests from the same IP address are counted as one view.