Article

Evaluation of Indoor Thermal Comfort Conditions of Residential Traditional and Modern Buildings in a Warm-Humid Climate

by
Marcellinus U. Okafor
1,
Bankole Osita Awuzie
2,3,
Kenneth Otasowie
4,*,
Udochukwu Marcel-Okafor
5 and
Clinton Aigbavboa
4
1
Department of Architecture, Imo State University, Owerri 460108, Nigeria
2
Department of Built Environment, Central University of Technology, Bloemfontein 9300, South Africa
3
Faculty of Environmental Sciences, K.O. Mbadiwe University, Ogboko 475102, Nigeria
4
CIDB Centre of Excellence and Sustainable Human Settlement and Construction Research Centre, Faculty of Engineering and the Built Environment, University of Johannesburg, Johannesburg 2006, South Africa
5
Department of Architecture, Federal Polytechnic, Nekede 460113, Nigeria
*
Author to whom correspondence should be addressed.
Sustainability 2022, 14(19), 12138; https://doi.org/10.3390/su141912138
Submission received: 23 August 2022 / Revised: 13 September 2022 / Accepted: 13 September 2022 / Published: 25 September 2022

Abstract

:
Achieving optimal levels of indoor thermal comfort in a warm, humid climate continues to pose a challenge to building occupants in such climatic regions. Buildings are either being retrofitted or designed differently to cater to thermal comfort. As a result, a variety of tactics have been deployed to guarantee optimal thermal comfort for occupants. Some scholars have highlighted the salient contributions of various types of construction materials toward the delivery of different housing types which perform differently under a diverse range of climatic conditions. A plethora of studies suggesting better indoor thermal comfort performance of traditional buildings as compared to contemporary dwellings due to various reasons have been observed. However, limited studies have sought to investigate this suggestion within warm, humid climatic regions. As such, this study engages in an evaluation of indoor thermal comfort qualities of traditional and modern buildings during the dry season with the goal of developing design guidelines for a thermally pleasant environment in a town, Okigwe, which is situated in a warm, humid climatic region in Southeastern Nigeria. Data were collected utilizing a field measurement technique. Throughout the survey period, variables of the indoor environment such as relative humidity and air temperature were recorded concurrently in nine selected buildings, two traditional and seven modern buildings. The fluctuations and differences in relative humidity and air temperature between the two building types were investigated using Z-test statistical techniques. The study’s results revealed that the contemporary structures’ indoor air temperature (29.4 °C) was 0.6 °C higher than traditional buildings’ indoor air temperature (28.8 °C). Therefore, the study recommends that architects and planners should make concerted efforts to integrate methods of passive design into the provision of a comfortable indoor thermal environment rather than relying solely on active design strategies, which whilst lacking in traditional buildings, nonetheless did not prevent such buildings from recording lower air temperature readings compared to modern buildings.

1. Introduction

The global commitment to achieving a carbon neutral society has continued to resonate in contemporary developmental discourse [1]. This is evident in the outcomes emanating from the recently concluded United Nations Framework Convention on Climate Change (UNFCC) Conference of Parties (COP)26 international climate conference [1,2]. At this summit, commitments were made toward securing a net zero regime by the middle of the current century whilst maintaining a maximum of 1.5 °C degrees of warming [2]. The operationalization of these commitments toward achieving carbon neutrality have been outlined through two notable outcomes, namely, the Glasgow Climate Pact and the Paris Rulebook [1,2,3].
The contribution of the built environment to the achievement of this mandate has been elucidated by various scholars [4,5,6]. For instance, Wang et al. [4] admitted that the Chinese construction industry was responsible for 51.3% of the entirety of carbon emissions in that country in 2018, with an estimated 21.9% emanating from building operations whilst the construction process accounted for 42.87%. Similarly, Gan et al. [7] maintained that the construction industry was responsible for 30% of the greenhouse gas emissions. Furthermore, they averred that an estimated 40% of the global energy consumption could be attributed to the sector [7]. Impliedly, the building sector requires considerable improvement to enhance its potential to contribute toward carbon neutrality. This understanding has culminated in the increasing interest of various scholars over the past decade on built environment-related facets influencing this potential [4,7,8,9,10,11].
The extant literature has continued to reiterate the nexus between thermal comfort and the wellbeing of human beings [12,13,14,15,16], sustainable development [17,18,19], and green building development [15], among other facets. Such sustained levels of interest among the research and practitioner communities concerning thermal comfort have been attributed to its potential to engender improved sustainability performance of contemporary society, tackling, as it were, challenges such as unsustainable energy consumption patterns [20,21] urban poverty, energy poverty [22,23], low levels of productivity [24,25,26,27,28], and above all, global warming [29,30].
The drive for improved levels of thermal comfort in the built environment has seemed to further delineate among scholars as it concerns indoor thermal comfort and outdoor thermal comfort [31,32]. Additionally, extant studies have sought to further dichotomize the inquiry into the phenomenon of the nature of buildings by comparing traditional (vernacular) and modern (contemporary) buildings [33,34]. Others have focused on thermal comfort across contexts in places experiencing different climatic conditions such as temperate, tropical, and warm, humid climates, among others [35,36,37,38]. This study belongs to the class of studies seeking to understand the variance in thermal comfort between traditional and modern buildings situated in a warm, humid climate. Therefore, instances relating to the indoor and outdoor thermal comfort evaluation fall outside the study’s remit.
Available evidence points to the salient contribution of dwelling types to the degree of thermal comfort experienced therein [39,40] due to the nature of materials and the design. Al Rasbi and Gadi [41] investigated the elements of traditional buildings in Oman which contributed toward improved levels of thermal comfort. They discovered that traditional structures may inform the successful harnessing of ambient energy sources for creating an artificial setting that is comfortable thermally [41]. Malama and Sharples [42] investigated the thermal performance of traditional Zambian dwellings during the cool season. These traditional structures proved to be uncomfortable during the cool season based on the empirical assessments. In the Libyan oasis of Ghadames, Ealiwa et al. [43] evaluated the thermal comfort of traditional and contemporary buildings. Findings from their study highlighted that measurements of predicted mean vote (PMV) in new air-conditioned buildings demonstrated good comfort conditions [43]. Dyvia and Arif [44] describe PMV as an index which seeks to predict the mean value of votes of a group of occupants on a seven-point thermal sensation scale. It is used to discern the degree of thermal sensation felt by building occupants. In traditional buildings, however, identical measurements and survey findings revealed that, although a PMV based on measurements and the International Organization for Standardization (ISO, 7730:2005), which focuses on ergonomics of the thermal environment template, signified discomfort (hot), the inhabitants reported their contentment with the internal comfort conditions. Ealiwa et al. [43] suggested that older buildings have a higher level of thermal comfort than newer buildings.
Akair and Banhidi [45] carried out a thermal comfort study in three Libyan towns spanning two climate zones. According to their study, the thermal comfort temperature in Libya was calculated and determined using one of the following expressions:
Tc-Griffiths = 0.518To − Avg + 10.35
Tc-Brager = 0.680To − Avg + 6.88
Tc-Griffiths (C) is the comfort temperature calculated using the Griffiths method, Tc-Brager (C) is the comfort temperature discovered using the de Dear and Brager method, and To − Avg (C) is the monthly mean outdoor temperature.
For buildings with air conditioning and heating systems, the comfort temperature computed from the preceding equation must be used to set a variable interior temperature. The use of traditional passive solutions to minimize energy usage and carbon emissions in modern buildings was studied by Mahar et al. [46]. The authors observed that in Pakistan, conventional passive approaches yielded a high degree of comfort for a longer length of time while lowering energy consumption [46]. Shaeri et al. [47] investigated the performance and thermal comfort of traditional buildings in Bushehr, Iran. The study found that without any mechanical systems, the performance of these old buildings was entirely sufficient. Huimei et al. [48] employed the climate chamber approach to investigate thermal comfort in China’s hot, humid environment. They discovered that the PMV model and the two-node model, two of the globally renowned standards, were inapplicable in measuring thermal comfort in buildings situated in the country’s hot, humid climate regions. Using TRNSYS software, Khoukhi and Fezzioui [49] investigated the thermal comfort design in traditional dwellings situated within Algeria’s hot, dry area. This modeling approach revealed that, save for the use of air conditioning in the summer, current average houses appear to be unsuitable for the desert environment. Priya et al. [50] used data solely acquired from measurements to evaluate the thermal efficiency of traditional and contemporary buildings in Nagapattinam, Tamil Nadu, India. Traditional buildings were shown to be valuable markers of a proper architectural design response for future modern buildings [50].
Few studies in Nigeria have made attempts at engendering a comparison between the internal thermal convenience characteristics of both traditional and modern buildings, particularly during the dry season. Nevertheless, based on the outcomes of the limited and dated research conducted across various regions of Nigeria, Ogunsote and Prucnal-Ogunsote [51] advocated a comfort limit of 20–25 °C, utilizing Nigeria as an exemplar for determining the effective temperature index in the tropics. However, the restrictions associated with the study’s breadth and duration seemingly undermined the potency of its projected contributions. In another study focusing on the selection of a thermal index for architectural design in a Nigerian climate, Ogunsote and Prucnal-Ogunsote [52] employed a mental evaluation examination to capture thermal pressure. The results from that study established that the Evans scale (lesser-known) was typically more precise [52]. Akingbade [53] studied the indoor thermal environment in the dry season, using 12 subjects residing in a hot, humid environment within Ibadan metropolis in Nigeria’s southwest region. The scholar discovered that during the hot season, residents of residential buildings were able to withstand greater temperatures within the comfort temperature range of 28 °C and 32 °C, with an ideal temperature of 29.5 °C [53]. Moreso, to evaluate thermal comfort, Ogbonna and Harris [54] used data from empirical measurements and subjective questionnaires eliciting the experiences of building occupants in Jos, Nigeria. The optimal operational temperature was a little over 26 °C, according to the results. Furthermore, Akande and Adebamowo [55] conducted a field study throughout the dry and wet seasons to investigate the indoor thermal environment of residential buildings in Bauchi, in Nigeria’s northeastern region, in a hot, dry climate. The study’s findings revealed the need to review the principles underpinning the notion of thermal comfort and occupant adaptability in such climates [55]. Eludoyin et al. [56] investigated relative humidity, air temperature, and regionalization of thermal comfort and climate within the Nigerian context and discovered a variance in the degree of thermal comfort experienced across the country due to the inherent diverse climatic conditions existing therein. This has necessitated the use of several thermal indices for measuring thermal comfort. Nwalusi et al. [57] deployed these indices in the study of thermal comfort in traditional buildings in Nsukka. Results from their study corroborated the findings by Akande and Adebamowo [55], especially as it concerned the need to review the desired levels of thermal comfort and occupant adaptability.
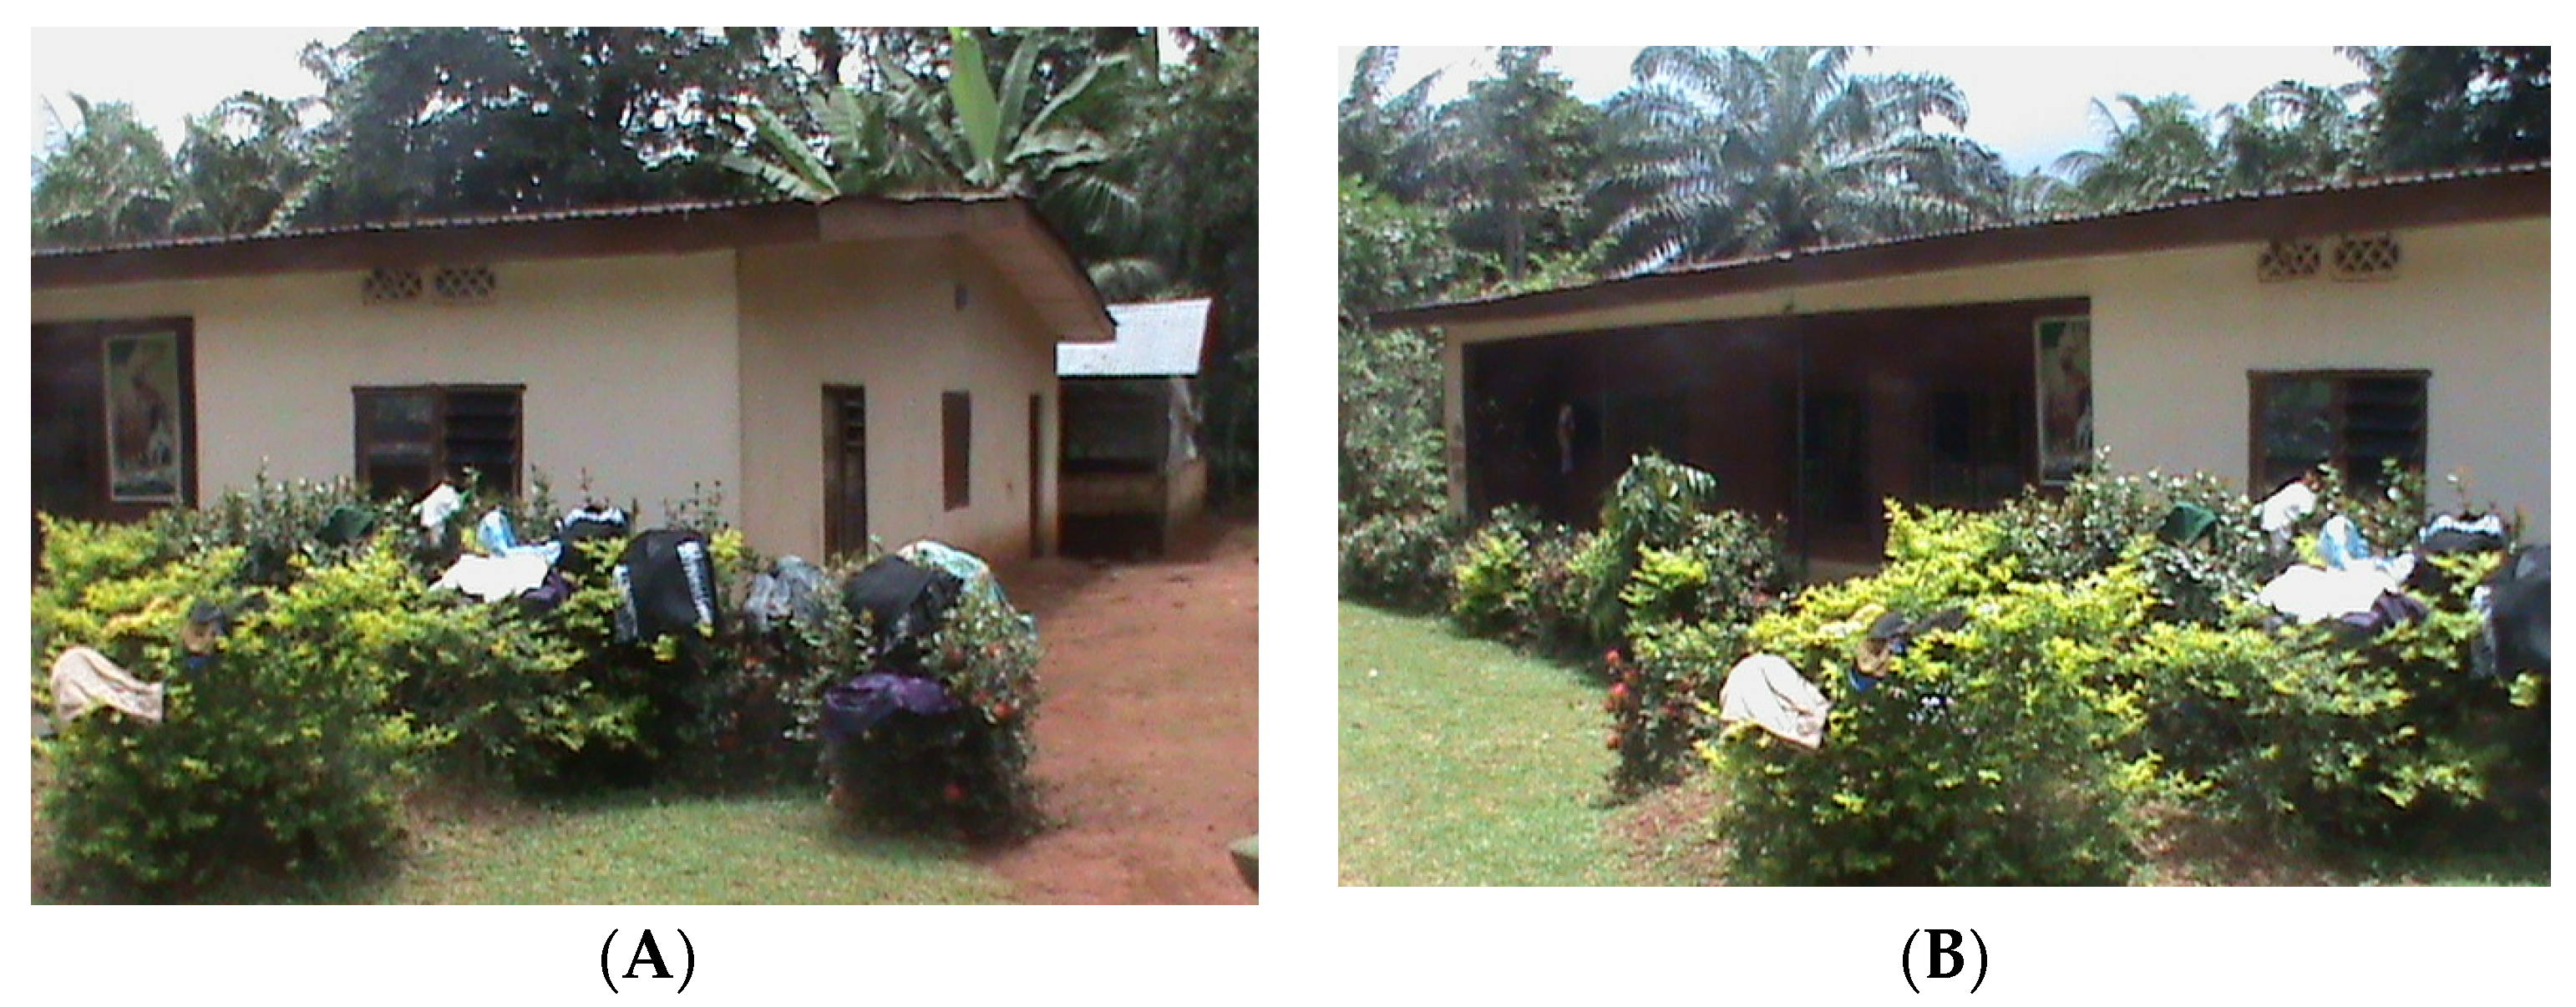
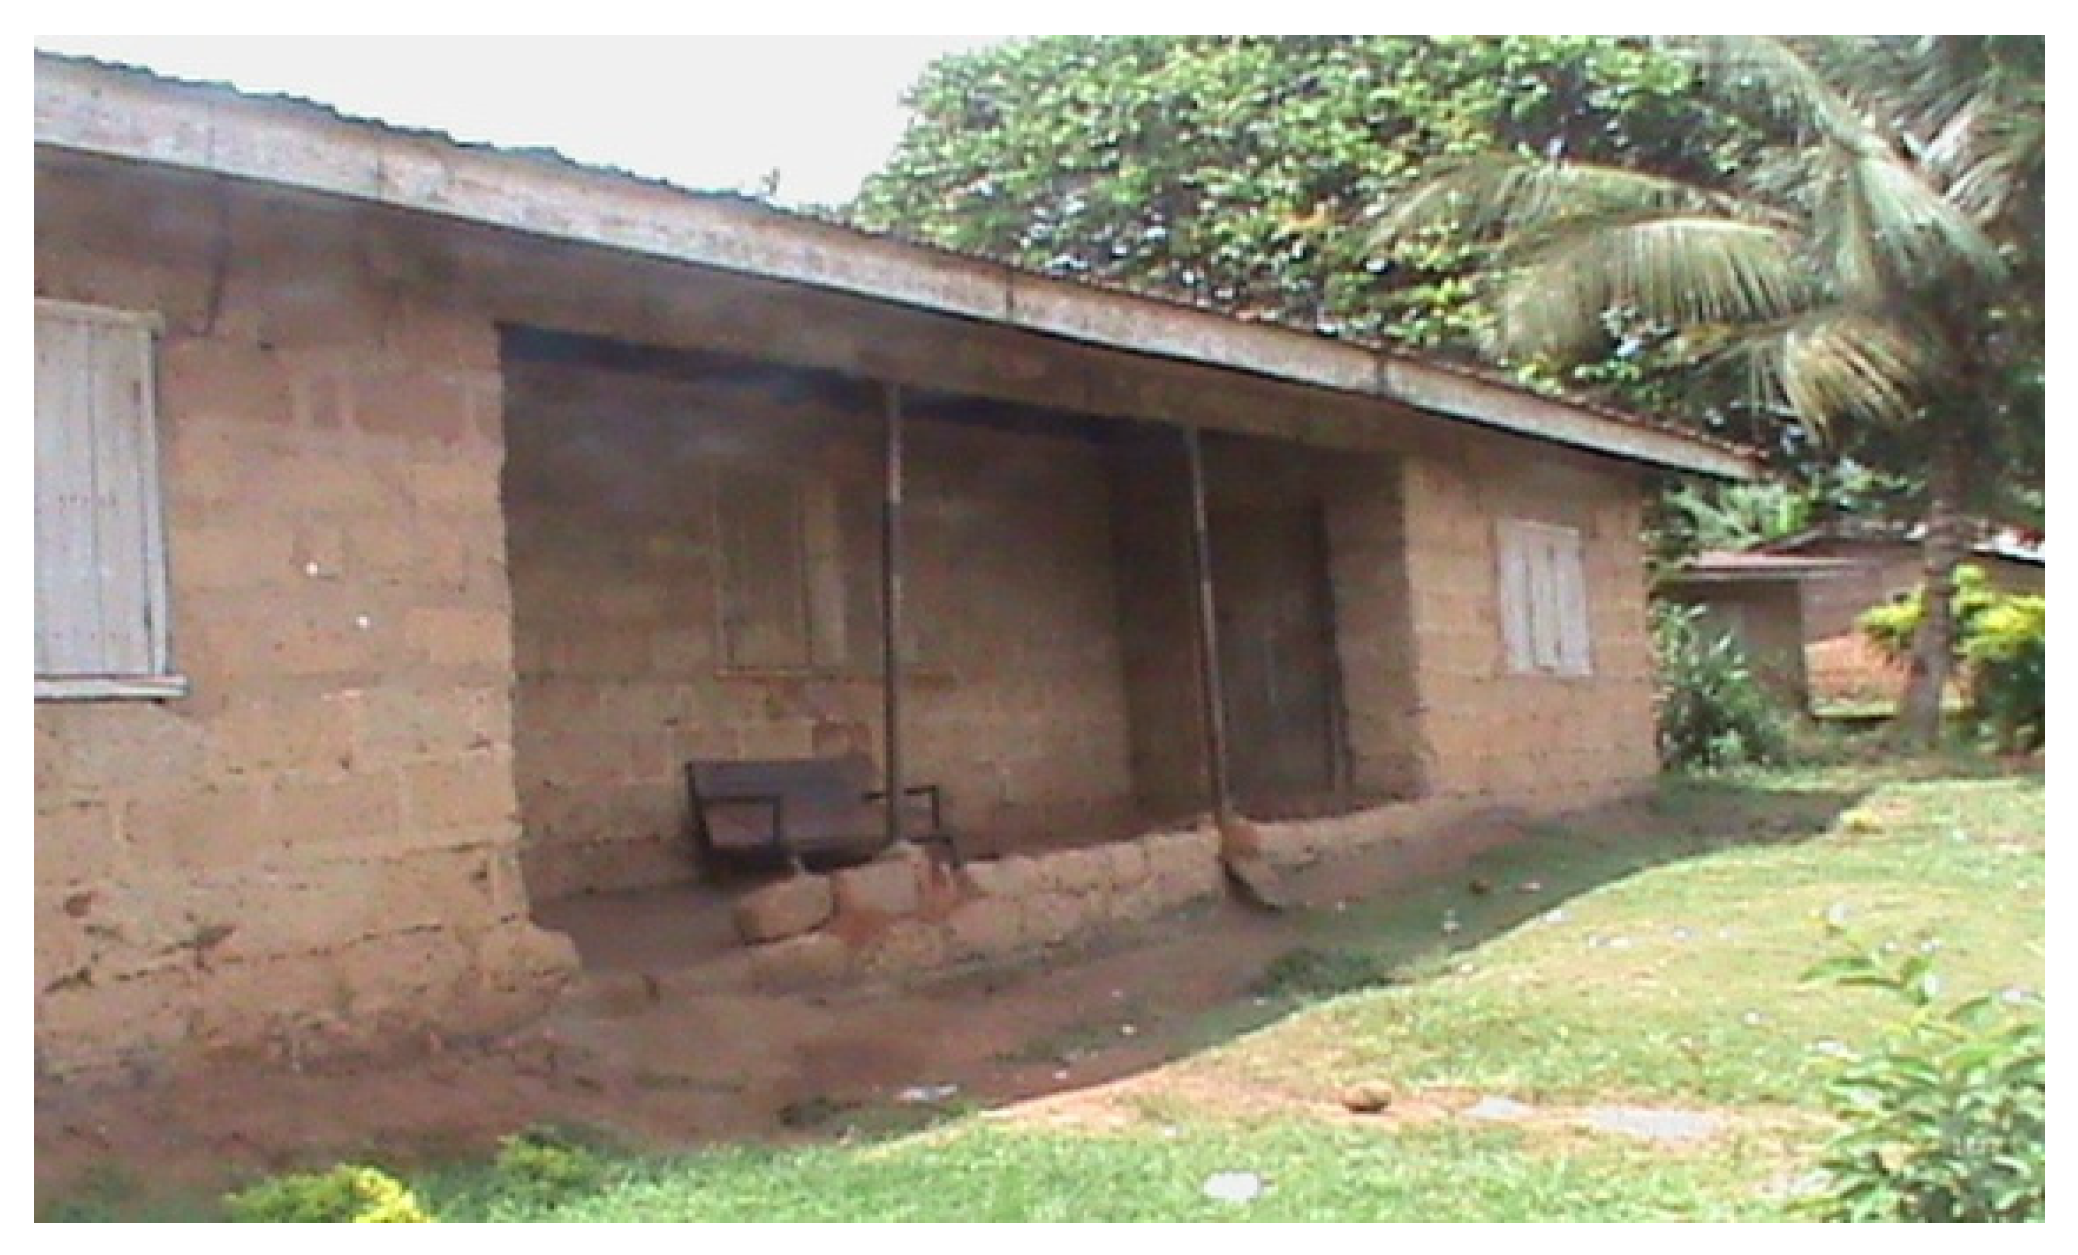
In contributing to the growing corpus of relevant studies focusing on the assessment of indoor thermal comfort in Nigeria, this study reports on an evaluation of the indoor thermal comfort characteristics of traditional and modern buildings in Okigwe, Southeastern Nigeria, during the heat period. It is expected that the study’s findings would engender a rethink of the extant design standards toward enabling a thermally comfortable setting. Both tropical dry and tropical wet climatic conditions are prevalent in the study region (Okigwe, Imo State, Southeastern Nigeria). Therefore, the climate can be described as warm and humid, with seasons of drought and rain, little daily temperature change, and high temperatures and humidity. As a result, the research is limited to the influence on the thermal environment of relative humidity and air temperature as experienced in nine traditional and modern buildings. Additionally, the heat season begins in late October and runs until early March, with the beginning of December and end of February being the driest months. Thermal comfort remains a critical facet which has enjoyed considerable reportage in indoor environmental quality studies globally. This study seeks to extend the knowledge around this concept within the context of traditional and modern buildings situated in a warm, humid climate. As such, nonenvironmental factors such as air quality, acoustics, and lighting, as well as any physical, biological, or chemical space pollution that might influence human health or comfort, are excluded from this study.

2. Materials and Methods

2.1. Description of Study’s Location

Nigeria’s climatic zones are divided into categories, namely: tropical savanna, tropical rainforest, and montane or highland climates. The southeast region of Nigeria’s climate, Okigwe inclusive, is predominantly a tropical rainforest defined as “AF” by the Köppen–Geiger climate classification [19]. The tropical rainforest is divided into the humid tropic and tropical arid climates [56]. Temperatures in Nigeria vary significantly from location to location and season to season. From the coast, between the high plateau and the lowlands, and to the interior, differences exist. Additionally, such variations in temperature are observed during rainy and dry seasons. According to Nwankwo [58], the yearly temperature range in the tropical rainforest climate zone, which is the difference between the warmest and coolest months, is very modest and practically consistent throughout the year. The warmest months are January to March, with a mean maximum temperature of 28 °C, whereas the coldest months are July to September, with a temperature of at least 26 °C. The temperature difference is less than 2 °C. However, this research was conducted during the dry season, which extends from the end of October until the beginning of March, with the driest months being early December and late February.

2.2. Protocol for Monitoring

Data for this investigation were collected using data loggers for the physical measurement of relative humidity and air temperature. The data loggers were configured to record relative humidity (RH) and air temperature every hour. They were installed at a height of 1200 mm in both traditional and contemporary structures, with measurements covering the dry season period in the research region. Before being placed in the selected buildings, the data loggers were enabled on the computer and all settings were established. From 1 November until 31 March, the dry season was in effect. The data loggers, as shown in Figure 1, were activated in the computer with all the parameters set before they were mounted in the selected buildings. Data were exported to Excel through the software of Tinytag Explorer 4.9 (http://www.geminidataloggers.com/software/tinytag-explorer Gemini Data Loggers, Chichester, UK, accessed on 1 April 2016).

2.3. Description of Buildings

2.3.1. Traditional Buildings

In this study, traditional buildings are used to describe buildings which have been constructed using locally sourced materials such as mud, various species of timber, bamboo, palm midribs, thatch, and rope and thread. Examples are shown in Figure 2 and Figure 3. Wall thickness is 225 mm, which is the same for all building types, and the height of buildings is 3000 mm.

2.3.2. Contemporary Buildings

Contemporary buildings are buildings erected based on modern architectural design. Hollow and solid sandcrete blocks and bricks, glass, wood/timber, concrete, ordinary Portland cement, aluminum, textured and emulsion finishing paints, ceramic, porcelain and vitrified tiles, and aluminum roofing sheets are some of the materials utilized in contemporary constructions. Wall thickness is 225 mm, which is same for all building types, and the height of buildings is 3500 mm (Figure 4, Figure 5, Figure 6, Figure 7, Figure 8, Figure 9 and Figure 10).

2.4. Method of Analysis

The fluctuations and differences in air temperature and relative humidity between the building types were investigated using the Z-test statistical tool.

3. Results

Indoor environmental elements such as relative humidity and air temperature were measured and investigated in nine buildings that represented traditional and modern architectural typologies, as indicated in Table 1. The data were collected utilizing Tinytag Plus 2 Dual-Channel Temperature and Relative Humidity data loggers (TGP-4500) throughout the dry season months, from November 2015 to March 2016, and the results are provided below.

3.1. Traditional Building T1 Indoor Minimum and Maximum Air Temperature Values

Table 2 displays the mean monthly temperatures, both minimum and maximum, together with their ranges for the traditional building T1 in Figure 2A,B. Mud walls and thatch roofing sheets were used in the traditional building. The mean monthly minimum temperature in traditional buildings ranged from 23.20 °C in December 2015 to 27.9 °C in February 2016. The average monthly maximum temperature ranged from 28.90 °C in December 2015 to 31.90 °C in February 2016. The temperature ranged from 3.40 to 5.70 °C. The traditional building T1 recorded the lowest and highest internal air temperatures in December 2015 and February 2016, respectively. The lowest temperature was 23.2 °C and the highest temperature was 28.9 °C in December 2015 (5.7 °C). November 2015 had the lowest temperature range (3.4 °C), with a mean minimum of 26.4 °C and a mean high of 29.8 °C. The average minimum interior temperature during the dry season was 26.1 °C, with a maximum of 30.4 °C and a range of 4.26 °C. The mean internal temperature for this conventional building, however, was 28.7 °C.

3.2. Traditional Building T1 Indoor Relative Humidity Minimum and Maximum Values

The mean monthly relative humidity minima and maxima, as well as the averages, were measured for the traditional building T1 (A and B). In December 2015, the mean monthly minimum relative humidity was 26.2%, whereas in March 2016, it was 65.2%. In December 2015, the mean monthly maximum relative humidity was 49.2%, whereas in November 2015, it was 83.4%. As a result, the average ranged from 37.7% to 73.7%. In the traditional building T1, the lowest and highest indoor relative humidity levels were documented in the months of November and December 2015. The lowest indoor relative humidity during the dry season was 43.3%, with a maximum of 67.7%. In this conventional structure T1, however, the average internal relative humidity was 55.5% (Table 3).
The traditional building T1’s daily internal temperature, relative humidity, and dew point data were recorded and graphed in Figure 11.

3.3. Traditional Building T2 Indoor Minimum and Maximum Air Temperature Values

Table 2 shows the mean monthly minimum and maximum temperatures and ranges for the traditional structure T2 in Figure 3. The traditional building featured mud walls and corrugated iron roofing sheets. Traditional building T2’s typical monthly minimum temperature ranged from 25.1 °C in December 2015 to 28.8 °C in February 2016. Additionally, the average monthly maximum temperature ranged from 29.50 °C in December 2015 to 32.6 °C in February 2016. The temperature ranged from 3.20 to 4.40 °C. In the modern building T2, the lowest and highest interior air temperatures were recorded in December 2015 and February 2016. December 2015 (4.4 °C) had the highest mean monthly minimum and maximum temperatures, with a low of 25.1 °C and a high of 29.5 °C. In November 2015, the lowest temperature range (3.2 °C) occurred, with a mean minimum temperature of 27.1 °C and a mean maximum temperature of 30.3 °C. The average minimum interior temperature for the dry season was 27.20 °C, with a high of 30.90 °C and a range of 3.80 °C. However, the average inside temperature in this traditional building was 29.10 °C (Table 2).

3.4. Traditional Building T2 Indoor Relative Humidity Minimum and Maximum Values

The monthly mean relative humidity minima and maxima, as well as the averages, were documented for traditional structure T2. In December 2015, the mean monthly minimum relative humidity was 26.6%, whereas in March 2016, it was 63.4%. In December 2015, the mean monthly maximum relative humidity was 46.1%, whereas in November 2015, it was 80.4%. As a result, the average ranged from 49.7.7% to 71.6%. In the traditional building T2, the lowest and highest indoor relative humidity was in December and November 2016, respectively. The minimum indoor relative humidity during the hot season was 43.3%, and the maximum was 64.3%. In this traditional building T2, however, the average internal relative humidity was 53.8% (Table 3).
Traditional building T2’s daily internal temperature, relative humidity, and dew point data were recorded and graphed in Figure 12.

3.5. Contemporary Building C3 Indoor Minimum and Maximum Air Temperature Values

The mean monthly minimum and maximum temperatures, as well as their ranges, were documented for the modern building C3 in Figure 4. The bungalow C3 is a modern structure. It was constructed with a roof covering of corrugated iron and sandcrete block walls, plastered and painted. Modern structure C3’s average monthly lowest temperature varied from 25.4 °C in December 2015 to 28.6 °C in February 2016. In addition, the average monthly maximum temperature ranged from 32.0 °C in December 2015 to 34.9 °C in February 2016. The temperature ranged from 5.40 to 6.60 °C. In the modern building C3, the lowest and greatest internal air temperatures occurred in December 2015 and February 2016. The mean monthly minimum and maximum temperatures were at their greatest in December 2015 (6.6 °C with a low of 25.4 °C and a maximum of 32.0 °C). The lowest temperature range was 5.4 °C in November 2015, with a mean minimum of 26.9 °C and a mean maximum of 32.3 °C. The average minimum indoor temperature for the dry season was 27.10 °C, with a high of 33.20 °C and a range of 6.10 °C. However, the average inside temperature in this modern structure was 30.20 °C (Table 2).

3.6. Contemporary Building C3 Indoor Relative Humidity Minimum and Maximum Values

The monthly mean relative humidity minima and maxima, as well as the averages, were documented for the modern structure C3 in Figure 4. In December 2015, the mean monthly minimum relative humidity was 26.6%, whereas in November 2015, it was 59.0%. In December 2015, the average highest relative humidity for the month was 42.3%, whereas in November 2015, it was 83.4%. As a result, the average ranged from 34.5 to 71.2%. In the modern building C3, the lowest and highest indoor relative humidity was in November and December of 2015, respectively. The lowest indoor relative humidity for the hot season was 41.0%, with a maximum of 65.2%. In this modern building C3, however, the average internal relative humidity was 53.1% (Table 3).
The internal dew point, relative humidity, and temperature values of the modern building C3 were documented daily and graphed in Figure 13.

3.7. Contemporary Building C4 Indoor Minimum and Maximum Air Temperature Values

The mean monthly minimum and maximum temperatures, as presented in Table 2, as well as their ranges, were documented for the modern building C4 in Figure 4. C4 is a two-story apartment building in the modern style. It has masonry walls and corrugated aluminum roofing sheets for the roof coverings. The average monthly lowest temperature for the modern building C4 varied from 26.2 °C in December 2015 to 30.0 °C in February 2016. In addition, the average monthly maximum temperature ranged from 30.2 °C in December 2015 to 31.3 °C in February 2016. The temperature ranged from 1.10 to 4.30 °C. In the modern building C4, the lowest and highest internal air temperatures occurred in December 2015 and February 2016, respectively. The mean monthly lowest and highest temperature range was widest in December 2015 with a difference of 4.0 °C, where the lowest was 26.2 °C and the highest was 30.2 °C. The lowest temperature range of 1.1 °C occurred in the month of March 2016, when 29.6 °C was the mean lowest temperature recorded and the mean highest temperature was 30.7 °C. The average minimum interior temperature for the dry season was 28.10 °C, with a high of 30.80 °C and a range of 2.70 °C. However, the average inside temperature in this modern structure was 29.50 °C (Table 2).

3.8. Contemporary Building C4 Indoor Relative Humidity Minimum and Maximum Values

The monthly mean relative humidity minima and maxima, as well as the averages, were documented for the modern structure C4 in Figure 5. The monthly mean minimum relative humidity ranged from 23.0% in 2015 and in January 2016 to 67.8% in the month of March 2016. In December 2015, the mean monthly highest relative humidity was 43.8%, whereas in November 2015, it was 80.1%. As a result, the average ranged from 33.4 to 73.3%. In the modern building C4, the lowest and highest indoor relative humidity was in November and December 2015, and January 2016, respectively. The minimum indoor relative humidity during the dry season was 39.1%, with a maximum of 63.9%. In this modern building C4, however, the average internal relative humidity was 51.5% (Table 3).
The dew point, internal temperature, and relative humidity values of the modern building C4 were documented daily and graphed in Figure 14.

3.9. Contemporary Building C5 Indoor Minimum and Maximum Air Temperature Values

Table 2 shows the mean monthly minimum and maximum temperatures and ranges as determined by the data loggers. Readings were collected for the modern building C5 and illustrated in Figure 6. C5 is a modern cottage with corrugated iron roofing sheets that is unplastered and unpainted. The building’s walls are composed of sandcrete blockwork. The current building C5’s mean monthly minimum temperature ranged from 23.30 °C in December 2015 to 27.1 °C in February 2016. Additionally, the average monthly maximum temperature ranged from 34.40 °C in December 2015 to 37.20 °C in February 2016. The temperature ranged from 8.60 to 11.10 °C. In the modern building C5, the lowest and highest internal air temperatures occurred in December 2015 and February 2016, respectively. The mean monthly lowest and highest temperature range was widest in December 2015 (11.1 °C), with a low of 23.3 °C and high of 34.4 °C. The lowest temperature range was 8.60 °C in the month of March 2016, with a mean low of 26.70 °C and a mean high of 35.30 °C. During the dry season, the average minimum interior temperature was 25.50 °C, with a high of 35.30 °C and a range of 9.8 °C. However, the average inside temperature in this modern building was 30.40 °C (Table 2).

3.10. Contemporary Building C5 Indoor Relative Humidity Minimum and Maximum Values

The monthly mean relative humidity minima and maxima, as well as the averages, were documented for the modern building C5 in Figure 6. In December 2015, the mean monthly lowest relative humidity was 24.0%, whereas in the month of March 2016, it was 56.6%. In December 2015, the mean monthly maximum relative humidity was 50.2%, whereas in November 2015, it was 87.9%. As a result, the average ranged from 37.1 to 71.3%. In the modern building C5, the lowest and highest indoor relative humidity was in November and December 2015, respectively. The minimum indoor relative humidity during the hot season was 37.6%, with a maximum of 71.4%. In this modern building, however, the average internal relative humidity was 54.5% (Table 3).
The internal dew point, relative humidity, and temperature values of the modern building C5 were documented daily and graphed in Figure 15.

3.11. Contemporary Building C6 Indoor Minimum and Maximum Air Temperature Values

The data logger readings revealed the mean monthly lowest and highest air temperatures, and the ranges were calculated and presented in Table 2. Data readings were collected for the modern building C6, illustrated in Figure 7. C6 is a modern duplex with roofing sheets of stepped tiles and aluminum. The data logger was placed in the building’s top floor level, which has sandcrete blockwork walls. The mean monthly lowest temperature for the modern building C6 varied from 24.5 °C in December 2015 to 27.80 °C in February 2016. The average maximum monthly temperature ranged from 29.3 °C in December 2015 to 32.3 °C in February 2016. The temperature ranged from 3.80 to 4.80 °C. In the modern building C6, the lowest and highest internal air temperatures occurred in December 2015 and February 2016. The mean monthly minimum and maximum temperatures were at their highest in December 2015 (4.8 °C), with a low of 24.5 °C and a maximum of 29.3 °C. The lowest temperature range (3.8 °C) occurred in November 2015, when the mean lowest temperature was 26.3 °C and the mean highest temperature was 30.1 ° C. During the dry season, the average lowest indoor temperature was 26.30 °C, with a high of 30.7 °C and a range of 4.3 °C. However, the average inside temperature in this modern building was 28.50 °C (Table 2).

3.12. Contemporary Building C6 Indoor Relative Humidity Minimum and Maximum Values

The monthly mean relative humidity minima and maxima, as well as the averages, were documented for the modern building C6 in Figure 7. In December 2015, the mean monthly minimum relative humidity was 33.7%, whereas in November 2015, it was 71.9%. In December 2015, the mean monthly maximum relative humidity was 50.8%, with a high of 83.4% in 2015. As a result, the average ranged from 42.3% to 77.7%. In the modern building C6, the lowest and highest indoor relative humidity was in November and December 2015, respectively. The minimum indoor relative humidity for the hot season was 50.5%, with a maximum of 67.6%. In this modern building C6, however, the average internal relative humidity was 54.8% (Table 3).
The internal dew point, relative humidity, and temperature values of the modern building C6 were documented daily and graphed in Figure 16.

3.13. Contemporary Building C7 Indoor Air Temperature Minimum and Maximum Values

The data logger readings revealed the mean monthly lowest and highest temperatures, and the ranges were calculated and presented in Table 2. Data readings were taken for the modern building C7, illustrated in Figure 8. C7 is a modern duplex with roofing sheets of stepped tiles and aluminum. The data recorder was installed on the bottom level of the structure, which has sandcrete blockwork walls and a slab ceiling with reinforced concrete. The average monthly lowest temperature for the modern structure C7 varied from 25.5 °C in December 2015 to 28.0 °C in the month of February 2016. The average monthly highest temperature ranged from 27.80 °C in December 2015 to 30.4 °C in February 2016. The temperature ranged from 2.10 to 2.4 °C. In the modern building C7, the lowest and highest internal air temperatures occurred in December 2015 and February 2016. The mean monthly minimum and maximum temperatures were highest (2.4 °C each) in the months of February and March 2016, when minimum temperatures were 28.0 ° C and 27.5 °C, respectively, and highest temperatures were 30.4 °C and 29.9 °C. The lowest temperature range (2.1 °C) occurred in January 2016, when the mean lowest temperature was 26.7 °C, and the mean highest temperature was 29.0 °C. In the dry season, the average lowest indoor temperature was 26.3 °C, with a high of 30.7 °C and a range of 2.3 °C. However, the average inside temperature in this modern structure was 27.9 °C (Table 2).

3.14. Contemporary Building C7 Indoor Relative Humidity Minimum and Maximum Values

The monthly mean relative humidity minima and maxima, as well as the averages, were documented for the contemporary building C7 in Figure 8. In December 2015, the mean monthly lowest relative humidity was 40.5%, whereas in the month of March 2016, it was 74.3%. In January 2016, the mean monthly highest relative humidity was 63.6%, whereas in November 2015 it was 89.6%. As a result, the average ranged from 52.4 to 81.9%. The lowest and highest interior relative humidity in the modern structure C7 was measured in November and December 2015, respectively. The lowest indoor relative humidity during the dry season was 56.6%, with a maximum of 74.8%. The average internal relative humidity for this modern building C7, on the other hand, was 65.7% (Table 3).
The internal dew point, temperature, and relative humidity values of the modern building C7 were documented daily and graphed in Figure 17.

3.15. Contemporary Building C8 Indoor Minimum and Maximum Air Temperature Values

Table 2 shows the mean monthly minimum and maximum temperatures and ranges for the contemporary building C8 in Figure 9. C8 is a two-story apartment building in the modern style. It was constructed using sandcrete blockwork, with corrugated aluminum roofing sheets as roof coverings. Current building C8’s mean monthly minimum temperature ranged from 26.4 °C in December 2015 to 29.7 °C in February 2016. The average monthly maximum temperature ranged from 29.6 °C in December 2015 to 32.5 °C in February 2016. The temperature ranged from 2.4 to 2.9 °C. In the modern building C8, the lowest and highest internal air temperatures occurred in December 2015 and February 2016. The largest monthly temperature range (2.9 °C) happened in January 2016, when the lowest temperature was 27.5 °C, whereas the highest temperature was 30.4 °C. The lowest temperature range (2.4 °C) occurred in the month of November 2015, when the mean lowest temperature was 28.0 °C and the mean highest temperature was 30.4 °C. The average lowest interior temperature for the dry season was 28.1 °C, with a high of 30.9 °C and a range of 2.8 °C. However, the average inside temperature in this modern structure was 29.5 °C (Table 2).

3.16. Contemporary Building C8 Indoor Relative Humidity Minimum and Maximum Values

The monthly mean relative humidity minima and maxima, as well as the averages, were documented for the modern structure C8 in Figure 9. In December 2015, the mean monthly minimum relative humidity was 25.7%, whereas in March 2016, it was 63.5%. In December 2015, the mean monthly maximum relative humidity was 44.1%, whereas in November 2015, it was 78.4%. As a result, the average ranged from 34.9 to 70.2%. In the modern building C8, the lowest and highest indoor relative humidity was in November and December, respectively. The minimum indoor relative humidity during the dry season was 42.4%, with a maximum of 63.1%. In this modern building, however, the average internal relative humidity was 52.8% (Table 3).
The internal dew point, relative humidity, and temperature values of the modern building C8 were documented daily and graphed in Figure 18.

3.17. Contemporary Building C9 Indoor Minimum and Maximum Air Temperature Values

The data logger readings revealed the mean monthly minimum and maximum temperatures, and the ranges were calculated and presented in Table 2. Data readings were collected for the modern structure C9 in Figure 10. C9, a modern structure, is a cottage with corrugated aluminum roofing sheets. The building featured plastered and painted sandcrete blockwork walls. The average monthly lowest temperature for the modern building C9 varied from 26.1 °C in December 2015 to 29.2 °C in February 2016. The average monthly maximum temperature ranged from 29.7 °C in December 2015 to 32.9 °C in February 2016. The temperature ranged from 2.80 to 3.7 °C. In the modern building C9, the lowest and highest internal air temperatures occurred in December 2015 and February 2016. The mean monthly minimum and maximum temperatures were at their highest (3.7 °C) in January and February 2016, when minimum temperatures were 26.9 °C and 29.2 °C, respectively, and maximum temperatures were 30.6 °C and 32.9 °C. The lowest temperature range (2.8 °C) occurred in the month of November 2016, when 27.5 °C was the mean lowest temperature and the mean highest temperature was 30.3 °C. During the hot season, the average lowest indoor temperature was 27.7 °C, with a high of 31.1 °C and a range of 3.4 °C. However, the average inside temperature in these modern buildings was 29.4 °C (Table 2).

3.18. Contemporary Building C9 Indoor Minimum and Maximum Relative Humidity Values

The monthly mean relative humidity minima and maxima, as well as the averages, were documented for the contemporary structure C9 in Figure 10. The average monthly minimum relative humidity fluctuated from 28.1% in January 2016 to 67.8% in 2015. In December 2015, the mean monthly highest relative humidity was 47.8%, whereas in November 2015, it was 81.4%. As a result, the average ranged from 38.3 to 74.6%. In the modern building C9, the lowest and highest indoor relative humidity was documented in the months of November 2015 and January 2016, respectively. The lowest indoor relative humidity during the dry season was 45.3%, with a maximum of 65.3%. The average internal relative humidity for this modern building C9, on the other hand, was 55.3% (Table 3).
The internal dew point, temperature, and relative humidity values of the modern building C9 were documented daily and graphed in Figure 19.

3.19. Comparison of Mean Monthly Minima and Maxima in Traditional and Modern Buildings’ Indoor Air Temperature Values

The connection between the mean monthly lowest inside temperatures for traditional and modern buildings is seen in Figure 20. The temperature difference between the two measurements varied from 0.10 to 0.50 °C. The difference between November 2015 and February 2016 was only 0.1 °C. Gaps of 0.5 °C and 0.4 °C between the minimum interior temperatures of traditional and contemporary buildings were only established in December 2015 and January 2016. Contemporary buildings had higher reading values than traditional ones during the sampling period.
The mean monthly maximum inside temperatures of traditional and modern buildings are shown in the line comparison chart in Figure 21. There are gaps between the two readings, as depicted in the picture. The largest temperature differential of 10 °C was recorded in January 2016, followed by 0.90 °C in November 2015. The temperature difference between December 2015 and March 2016 was 0.7 °C, with the smallest difference being 0.4 °C in February 2016.

3.20. Traditional and Modern Buildings’ Monthly Mean Minimum and Maximum Indoor Relative Humidity

Figure 22 shows the link between the lowest values of the monthly means of indoor relative humidity documented in traditional and modern buildings. From November and December 2015 to February and March 2016, both traditional and modern building readings seem to be near to one other. However, between December 2015 and February 2016 there was a difference, notably in January 2016 when the disparity was as high as 5.6%, compared to 0.3% and 0.6% in November 2015 and March 2016.
Figure 23 depicts the relationship between monthly mean maximum indoor relative humidity values in traditional and modern buildings in the study area, running from November 2015 to March 2016. The interpretations from traditional and modern buildings looked remarkably identical, indicating that the reading values were quite close. In January 2016, the highest difference between the two measures was 1.9%. In March 2016, the difference was only 1%, compared to 1.1% in February, 1.3% in December 2015, and 1.6% in November 2015. Except in January 2016, when traditional buildings slightly outnumbered contemporary ones by 1.9%, modern buildings had higher reading values.

3.21. Dry Season Indoor Air Temperatures of Traditional and Modern Buildings

The mean dry season inside temperature values of traditional buildings are presented in Table 4. The extreme temperatures of 27.1 °C and 30.6 °C recorded in the months of December 2015 and February 2016 had a mean range of 3.6 °C. The mean interior air temperature was 28.8 °C for the five-month sample period, which corresponded to the dry season.
The mean dry season interior temperature values of modern buildings are shown in Table 5. The extreme values of 27.9 °C and 30.9 °C with a range of 3.0 °C were recorded in the same months of December 2015 and February 2016 as the mean values described under conventional buildings. The typical dry season internal temperature value for modern buildings was calculated to be 29.4 °C as a result.

3.22. Traditional and Modern Buildings’ Indoor Relative Humidity Values in the Dry Season

Table 6 shows the mean interior relative humidity values of traditional buildings throughout the hot season. For November and December 2015, the extreme mean values were 37.1% and 72.7%, respectively. The typical indoor relative humidity value during the dry season was determined to be 54.7%.
Table 7 presents the modern buildings’ mean interior relative humidity values throughout the hot season. For November and December 2015, the extreme mean values were 39.0% and 73.3%, respectively. The average indoor relative humidity value during the dry season was determined to be 55.9%.

3.23. Traditional and Contemporary Buildings’ Indoor Air Temperature Value Relationship in the Dry Season

In Okigwe, Nigeria, Table 8 and Figure 24 show the link between the dry season interior air temperature values of traditional and contemporary building structures. With a difference of 0.6 °C, the measurements in Figure 24 reveal that the values are near to each other.

3.24. Traditional and Modern Buildings’ Dry Season Indoor Relative Humidity Levels

In the study area, Table 9 and Figure 25 present the link between the traditional and modern structures’ mean dry season interior relative humidity values. The numbers in Figure 25 show that the humidity values are not as close as the values of the interior air temperature. There was a 1.2% difference in the interior level of relative humidity of traditional and modern buildings.

3.25. Test of Hypothesis

According to the null hypothesis (H1), indoor air temperature values of traditional and modern buildings are not significantly different in the study area, and indoor relative humidity values of traditional and modern buildings are not significantly different during the hot season in the study area (H2). The hypothesis (H1) for this study was premised on data collected from field measurements in two traditional buildings and seven modern buildings. The Z-test was utilized to examine the significant difference between traditional structures’ mean interior air temperature value of M = 28.8 °C and modern structures’ mean interior air temperature value of M = 29.2 °C. Z = −4.2365, p = 0.0000 are the traditional and modern buildings’ air temperature values based on the Z-test statistic (Table 10).
p < α and α = 0.05; thus, H1 was rejected.
Traditional and contemporary structures in Okigwe, Nigeria, have significantly different indoor air temperature values throughout the dry season.
The hypothesis (H2) was also based on field measurements acquired in the two traditional structures and seven modern structures under investigation. The Z-test was utilized to determine the significant difference between traditional structures’ indoor relative humidity mean value of M = 54.2% and modern structures’ indoor relative humidity of M = 55.8%. The Z-test statistic for the traditional and modern structures’ relative humidity values (Z = −1.3222, p = 0.1861) (Table 11).
p > α and α = 0.05; therefore, H2 was accepted.
In the dry season in the study area, indoor relative humidity readings are not significantly different between traditional and modern structures.

4. Discussion

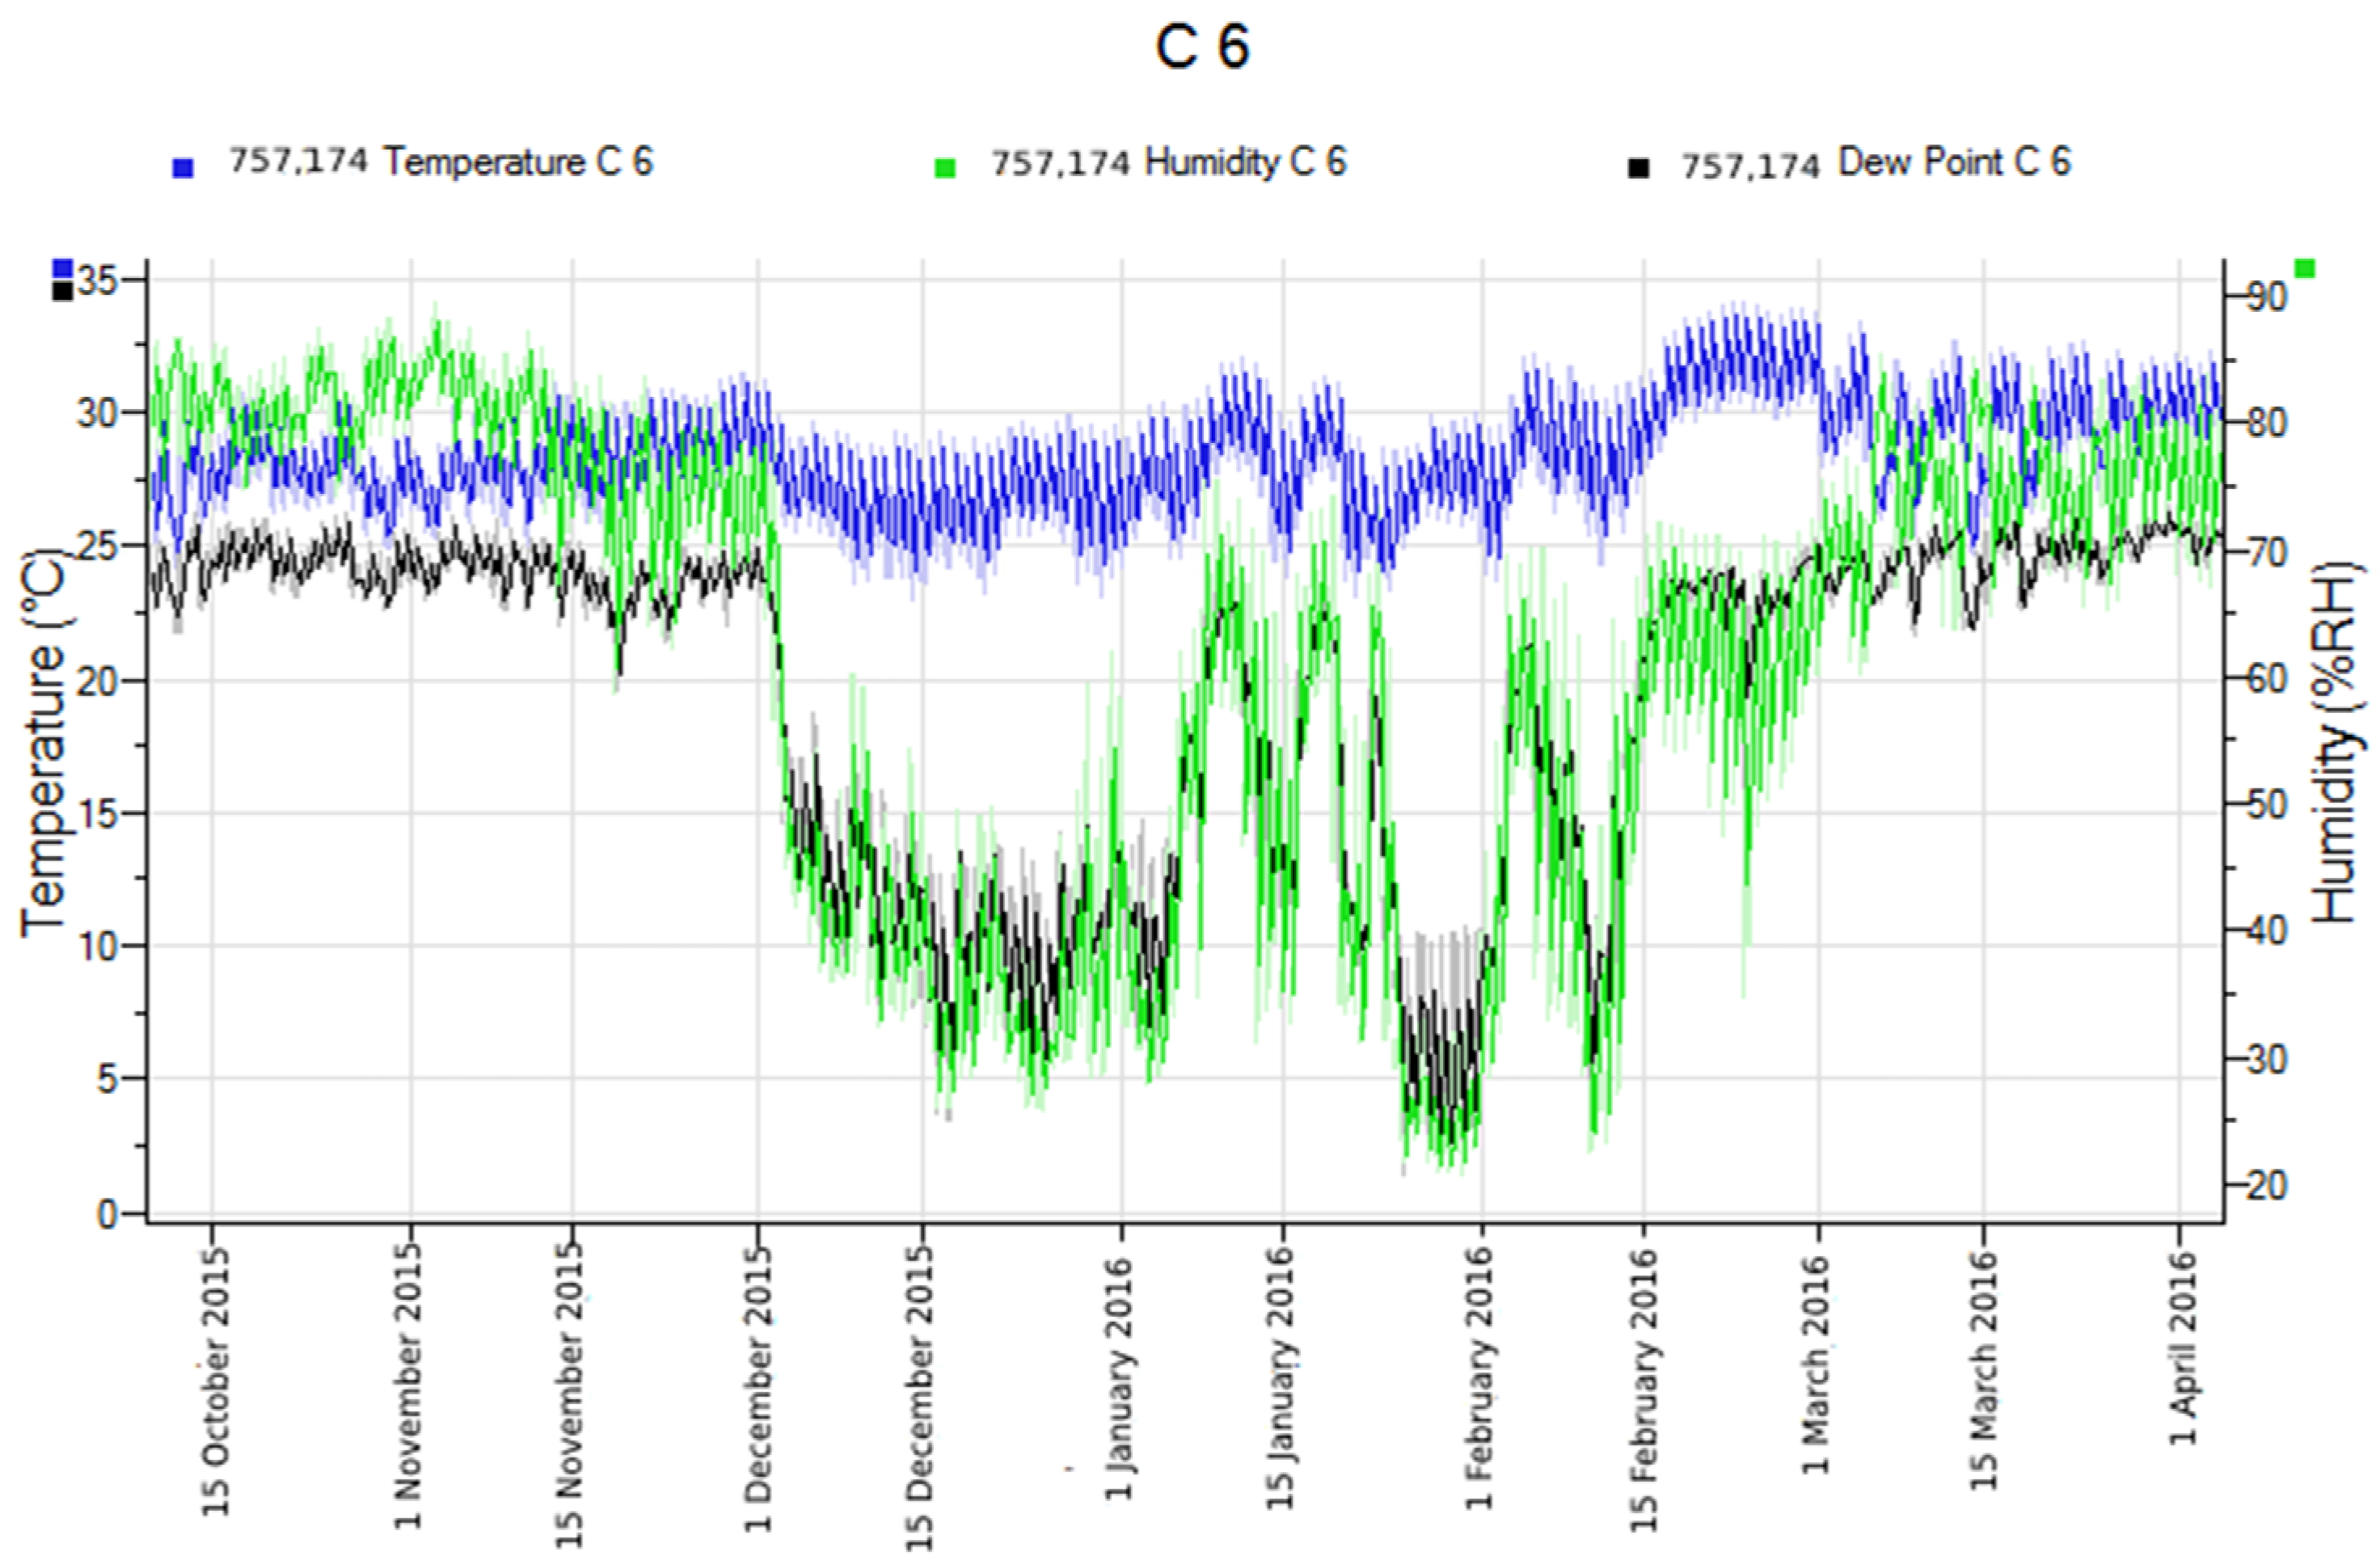
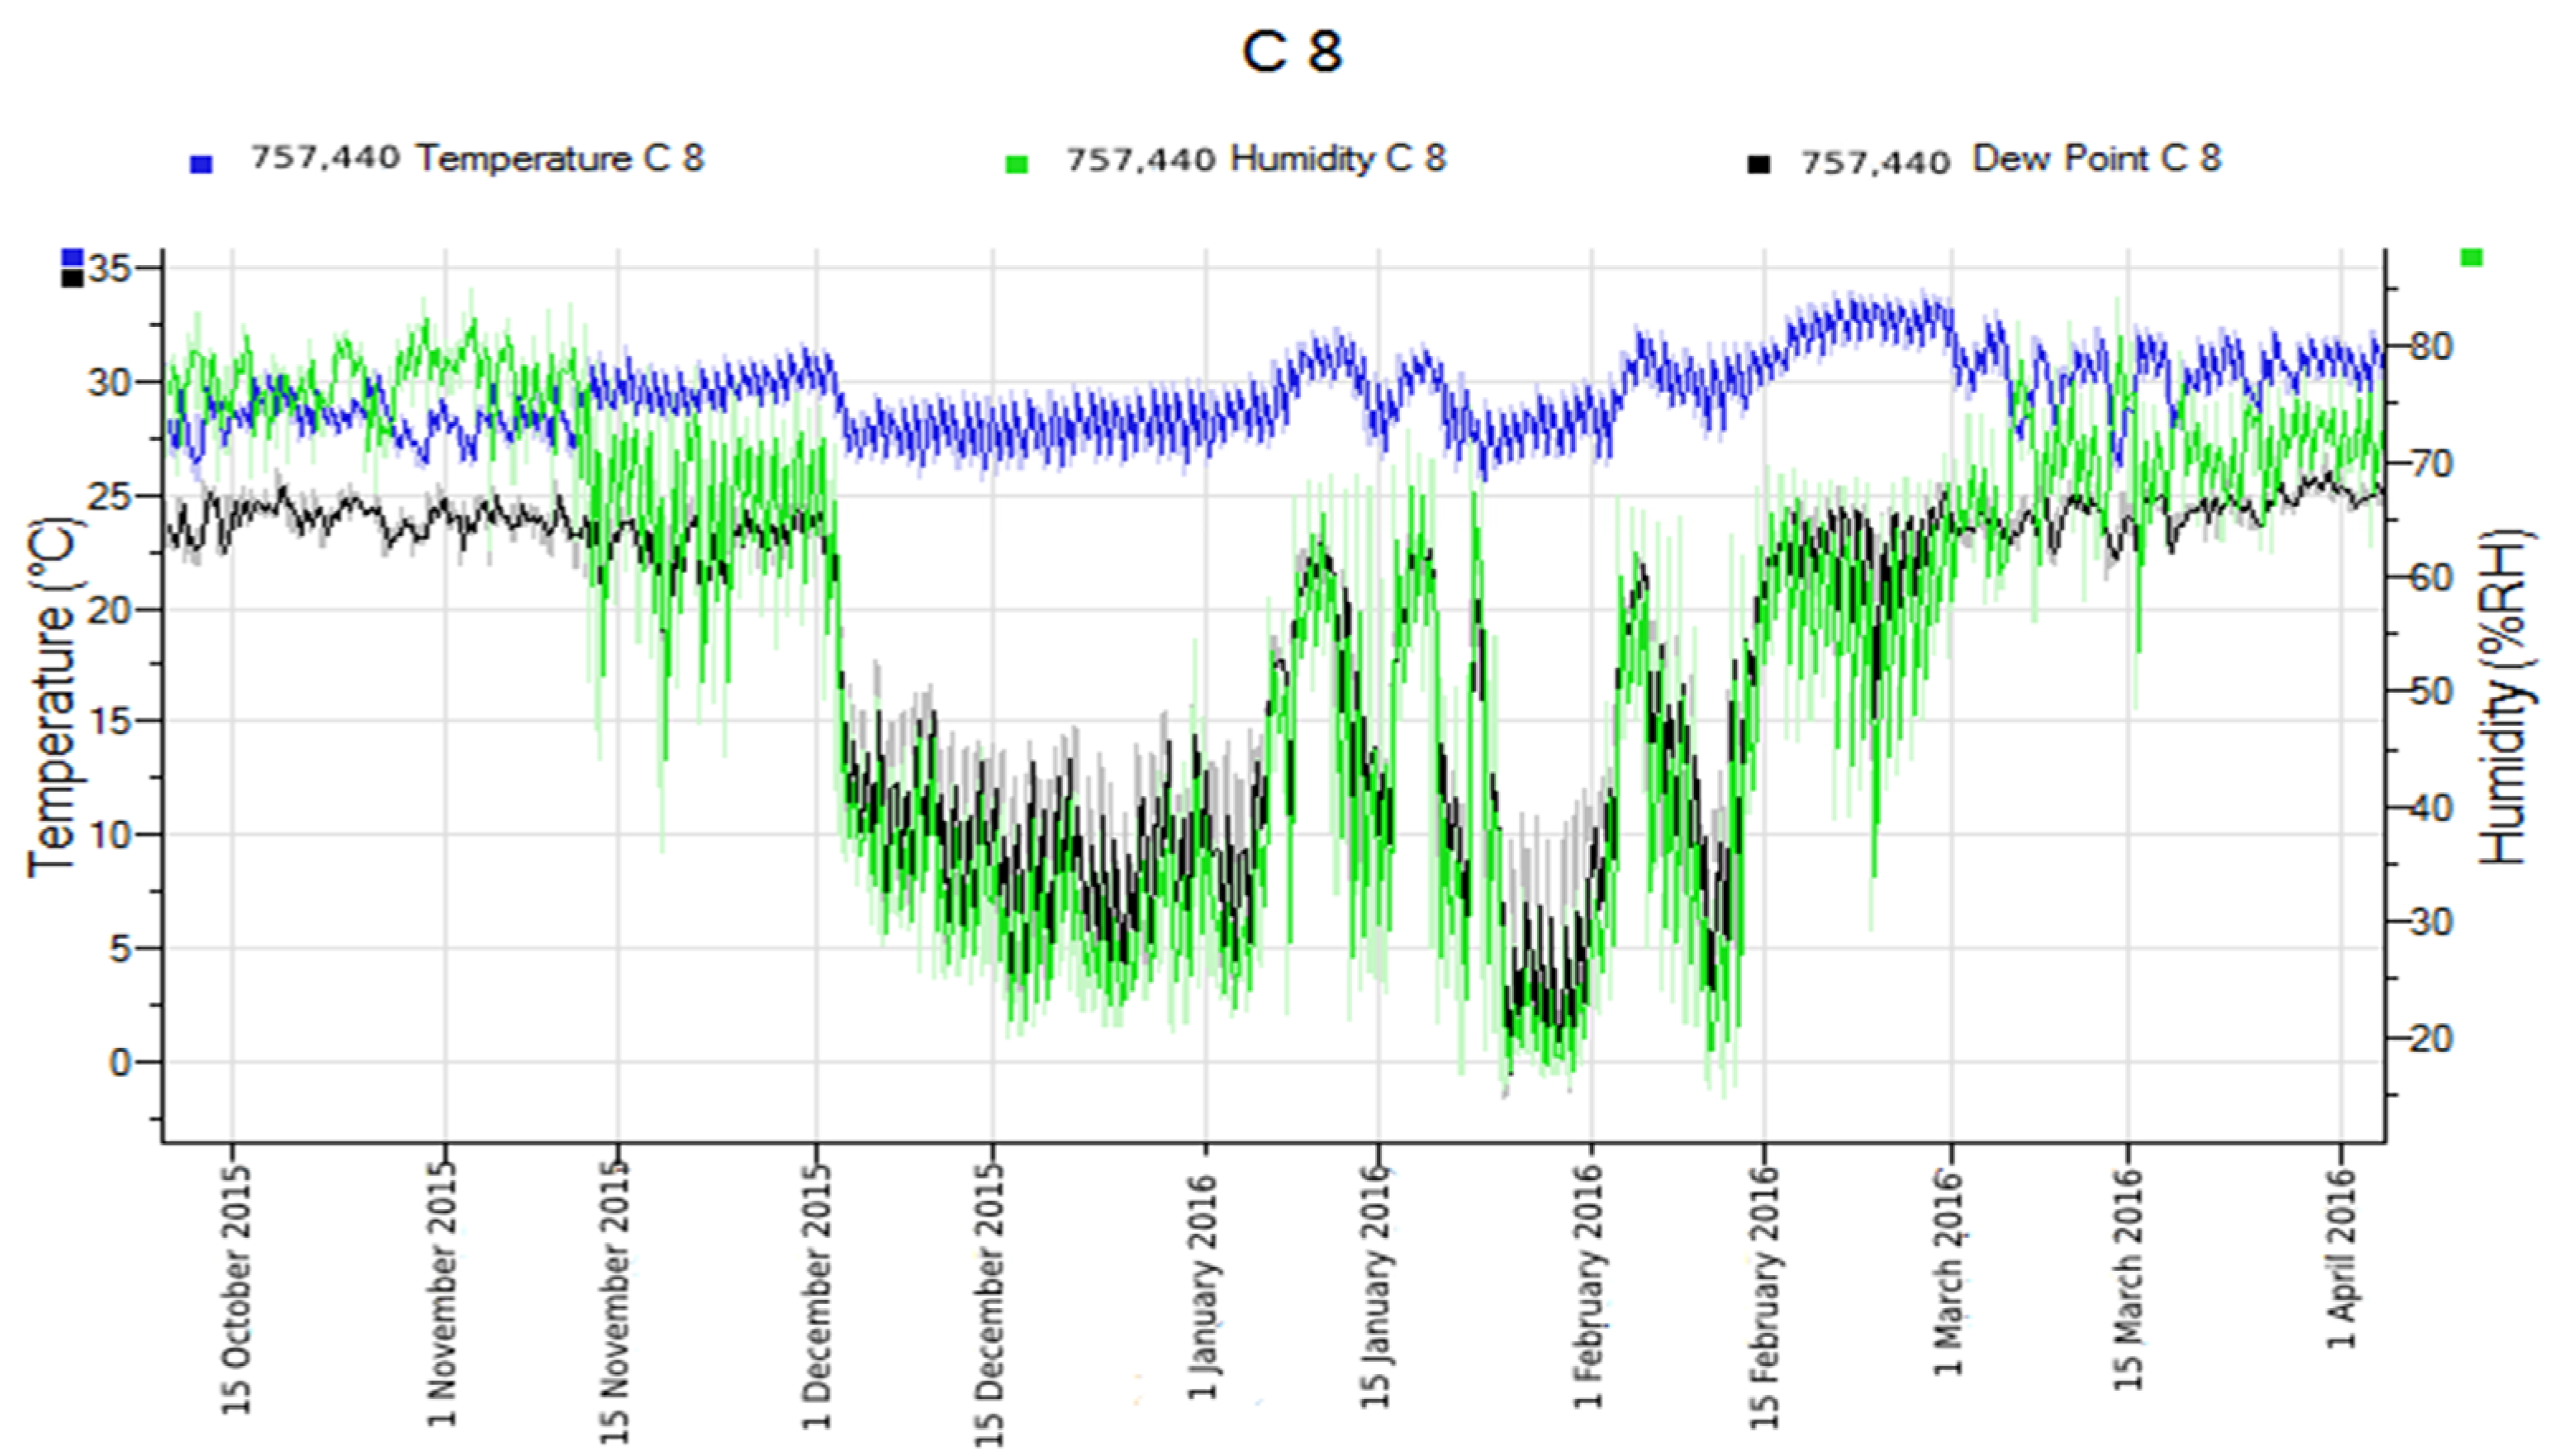
Dry season extreme values of the mean interior air temperature for traditional buildings were reported in the months of December 2015 and February 2016, according to this study. The lowest temperature was 24.50 °C, whereas the maximum was 28.50 °C. In December 2015 and February 2016, the dry season extreme values of the mean interior air temperature for modern buildings were also reported. The lowest temperature was 25.30 °C, whereas the maximum was 28.60 °C. In comparison, 0.8 °C was the seasonal difference in air temperature between traditional buildings (24.5 °C) and modern buildings (25.3 °C). This meant that traditional buildings’ dry season air temperature mean was 0.8 °C lower than that of the modern structures. Traditional buildings had the highest value of 28.5 °C, whereas modern buildings had the highest value of 28.5 °C. The seasonal difference between the peak air temperature values of traditional (28.5 °C) and modern (28.6 °C) buildings was 0.1 °C. This also meant that traditional buildings’ dry season air temperature mean was 0.1 °C lower than that of modern buildings, despite the difference appearing to be insignificant. During the dry season, inhabitants of traditional buildings have a cooler interior thermal environment than occupants of contemporary buildings in the early hours.
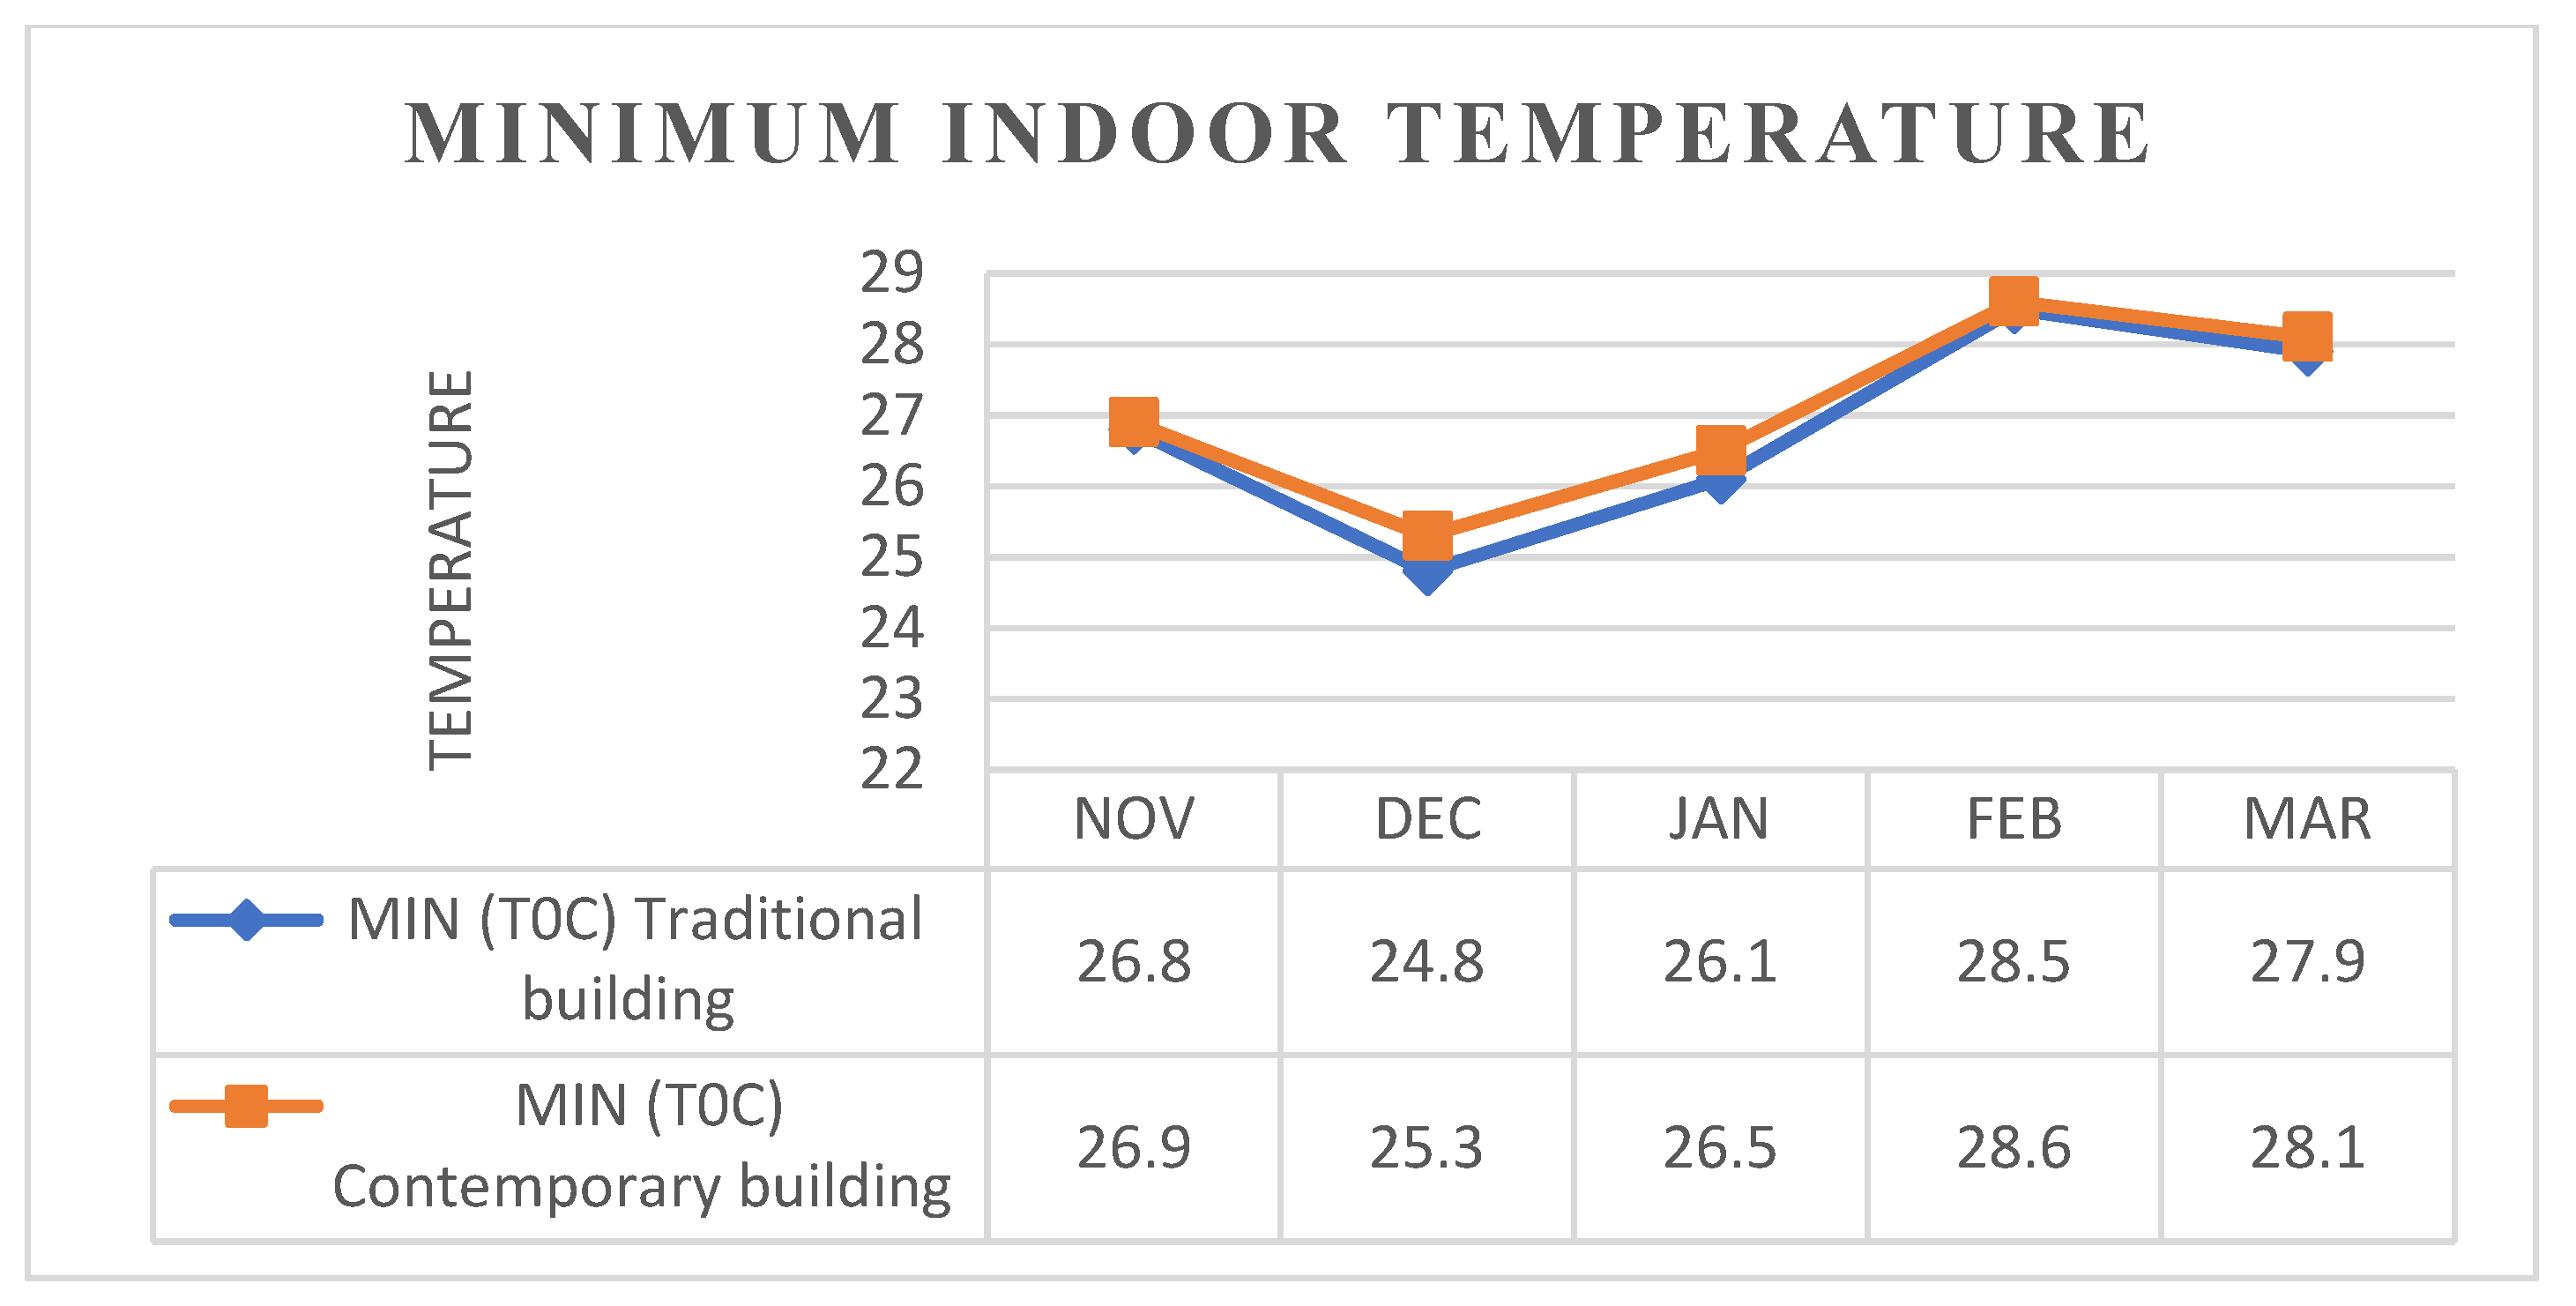
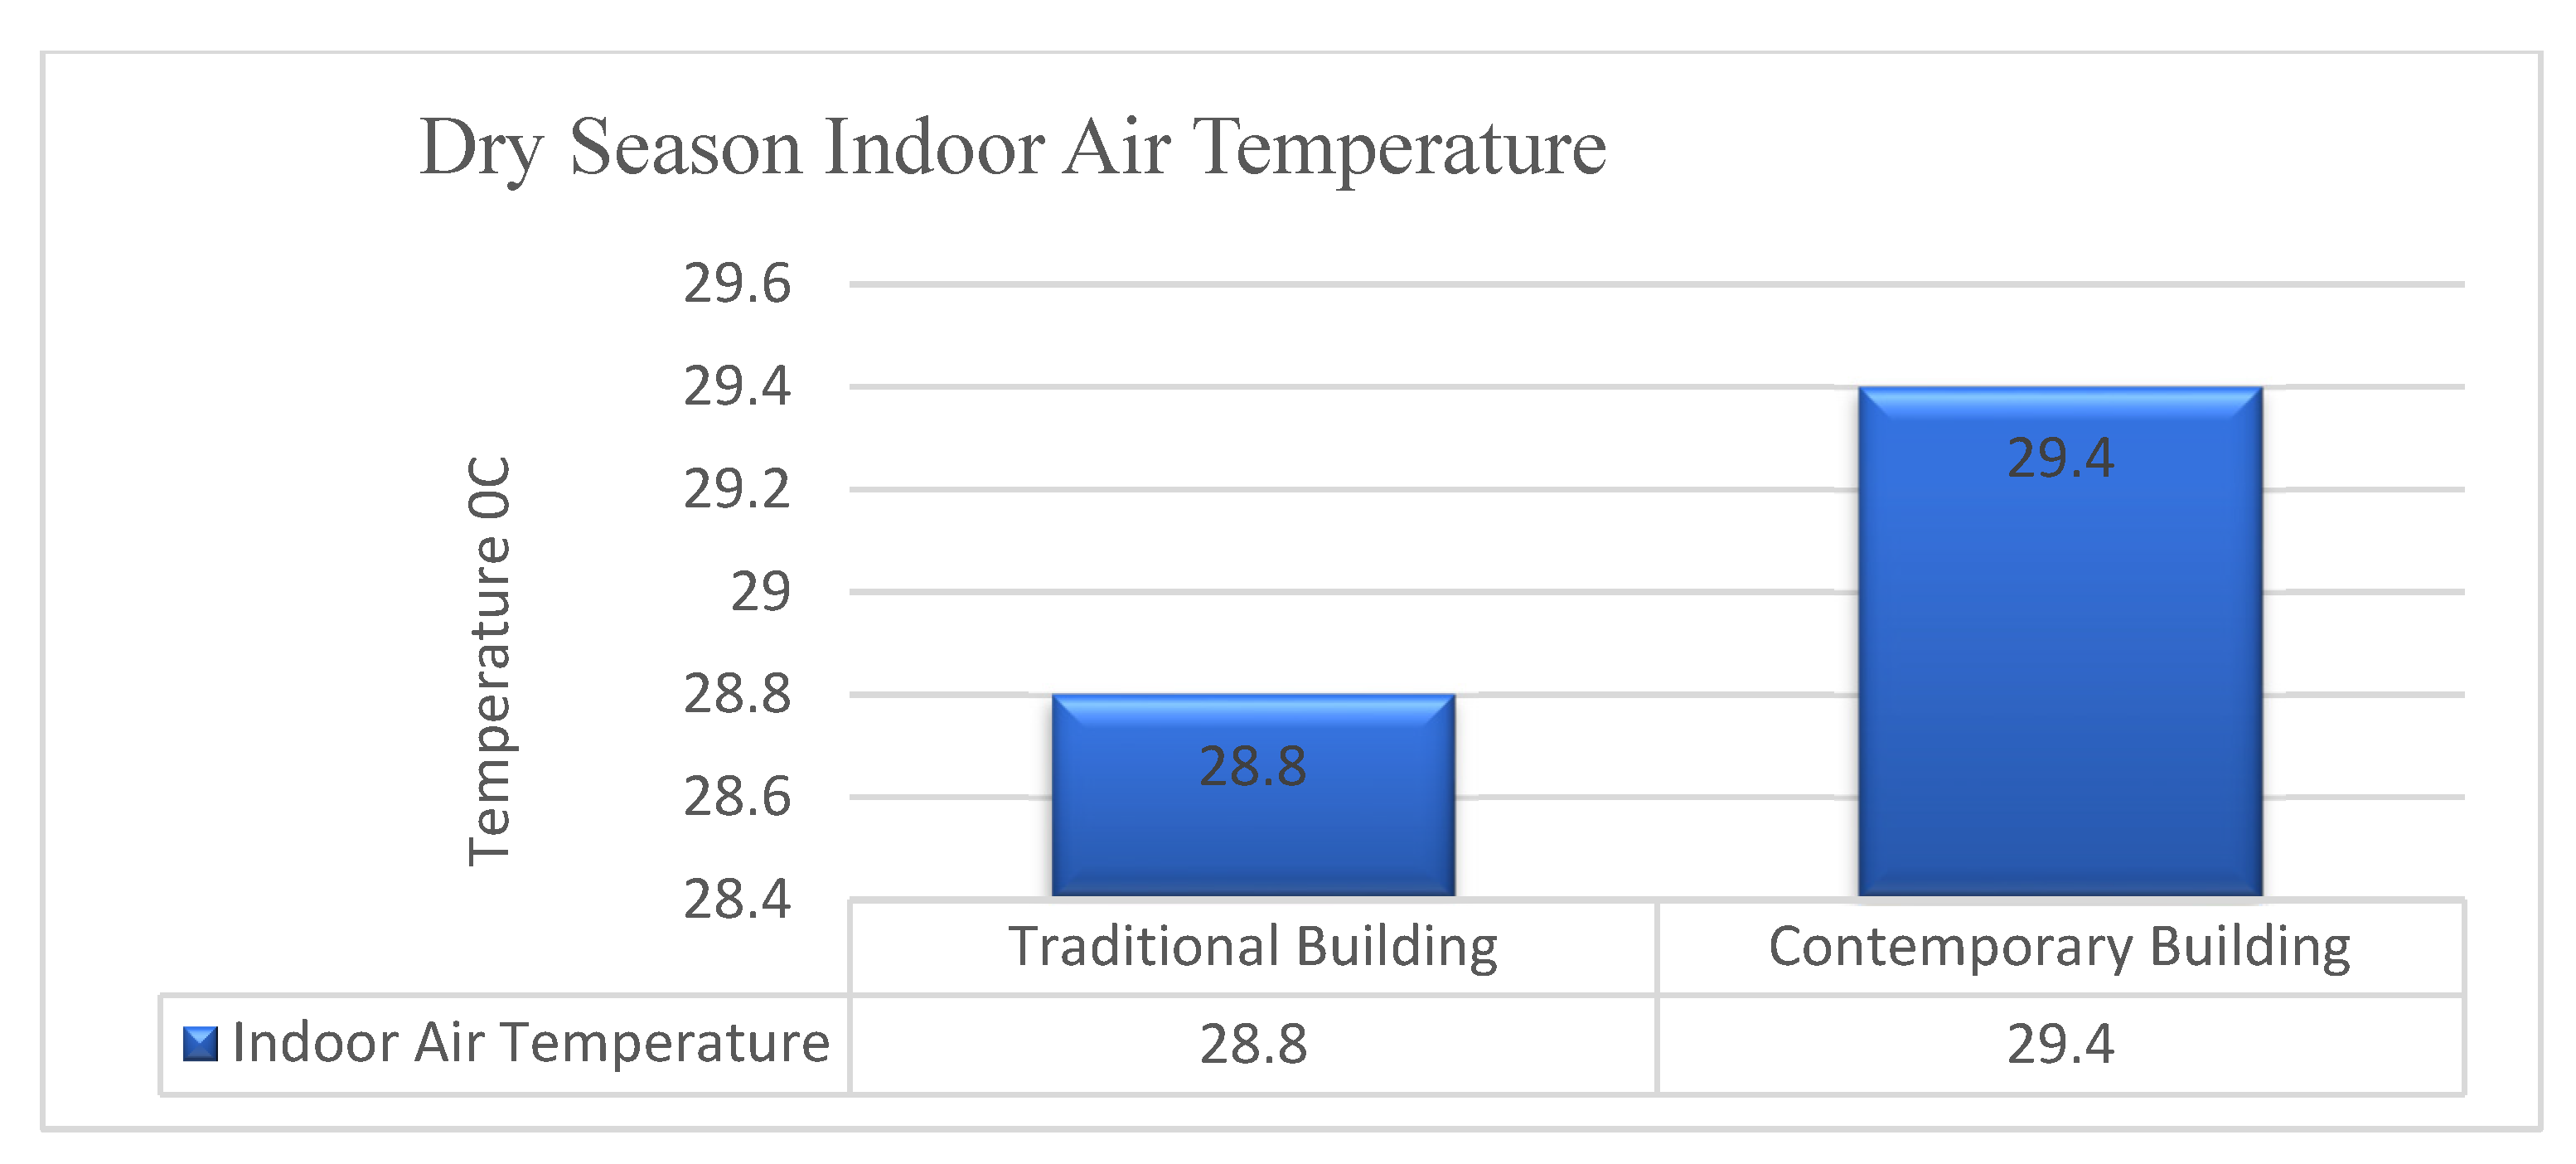
Furthermore, with a difference of 0.3 °C, the dry season minimum values of the interior air temperature for traditional structures were 26.8 °C and 27.1 °C for modern structures. However, the mean maximum indoor air temperature in traditional buildings in the dry season, as well as that of modern structures, reached high levels between the months of December 2015 and February 2016. Traditional buildings had values of 32.7 °C (highest) and 29.7 °C (lowest), whereas modern buildings had values of 33.1 °C (highest) and 30.4 °C (lowest). Traditional buildings had seasonal fluctuations of 30 °C (32.7–29.7), whereas newer buildings had seasonal variations of 2.70 °C (33.1–30.4). With a variance of 0.8 °C, the dry season maximum interior air temperature for traditional buildings was 30.8 °C and 31.6 °C for contemporary buildings. For traditional and contemporary buildings, the mean minimum and maximum were 40 °C and 4.50 °C, respectively. In Okigwe, Southeastern Nigeria, the mean dry season indoor air temperatures for traditional and contemporary buildings were 28.8 °C and 29.4 °C, respectively, with a 0.6 °C difference between them.
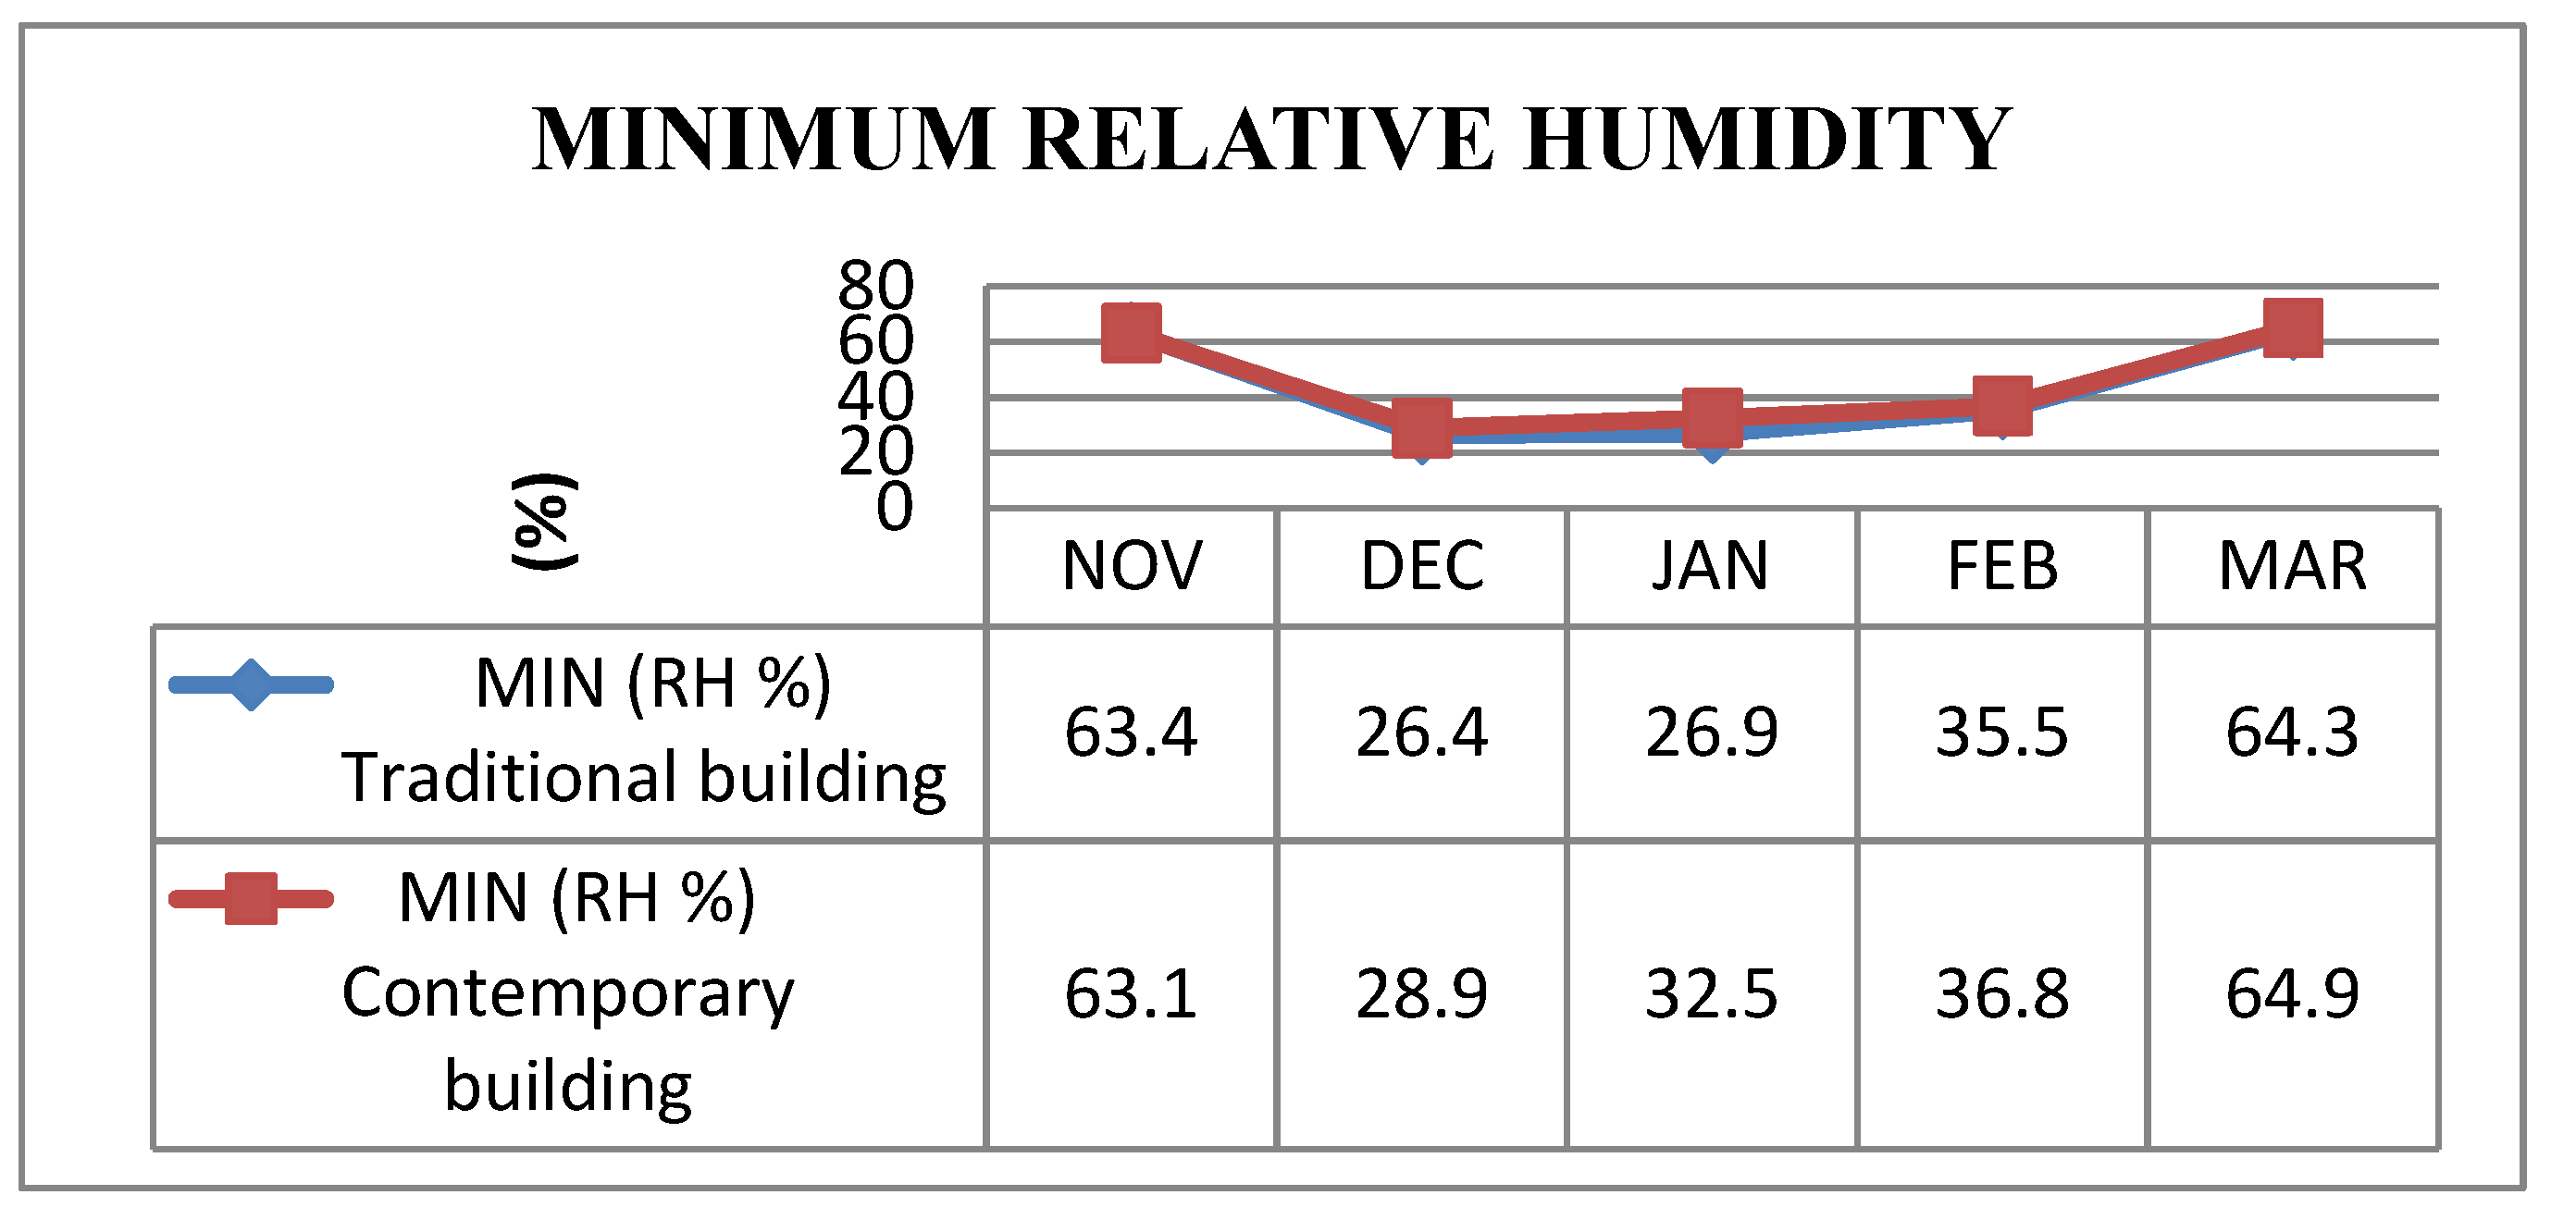
There exists no significant relationship between the interior relative humidity levels of traditional and modern buildings, as shown by the Z-test statistic (Z = −1.3222, p = 0.1861). The mean minimum dry season relative humidity in traditional buildings, on the other hand, was found to be 64.3% in March 2016 and 26.4% in December 2015. In modern buildings, the maximum value was 64.9% in the month of March 2016, whereas the lowest value was 28.9% (December 2015). With a difference of 22.7%, the dry season minimum interior relative humidity for traditional buildings was 43.3% and 66% for modern buildings. In the month of November 2015, the mean highest dry season relative humidity of traditional buildings was 81.9.3%, with the lowest value of 47.74% in December 2015. In November 2015, the highest value in a modern building was 83.5%, whereas the lowest was 49.0% in the month of December 2015. With a variance of 21.4%, the dry season maximum interior relative humidity value of traditional buildings were 45.2% and 66.6% for modern buildings. In Okigwe, the mean dry season interior relative humidity for traditional and modern buildings was 54.7% and 55.9%, respectively, with a difference of 1.2%.
It is important to note that the maximum temperature of both the traditional and contemporary buildings is slightly above the comfort limit Ogunsote and Prucnal-Ogunsote [51] and Akingbade [53] advocated for in the country where the study area is located, which is a comfort limit of 20–25 °C and 28–32 °C, respectively. Although the lowest temperature for traditional buildings is within this limit, that of contemporary buildings is still higher than the advocated limit of Ogunsote and Prucnal-Ogunsote [51], but not that of Akingbade [53]. However, the indoor temperature of the temporary buildings was achieved while relying on mechanical and artificial systems, whereas the traditional buildings had none.
Finally, the study is not without limitations. The study covered nine buildings in the study area, two traditional and seven contemporary buildings, with emphasis only on temperature and relative humidity. Floor plans (with wall thickness) and sections (height of the houses) could not be accessed. Even the occupants did not initially agree to having the Tinytag Explorer 4.9 Gemini Data Loggers mounted in their residences because of the security challenges in the country and need for alertness. However, respite came through one of the research assistants, whose knowledge of the residents of the community greatly aided in convincing the occupants to unconditionally and without fear accept the mounting of the data loggers in their buildings. Nevertheless, this does not influence the quality of the results, as revealed by the study. Further research could also be conducted to validate the study.

5. Conclusions

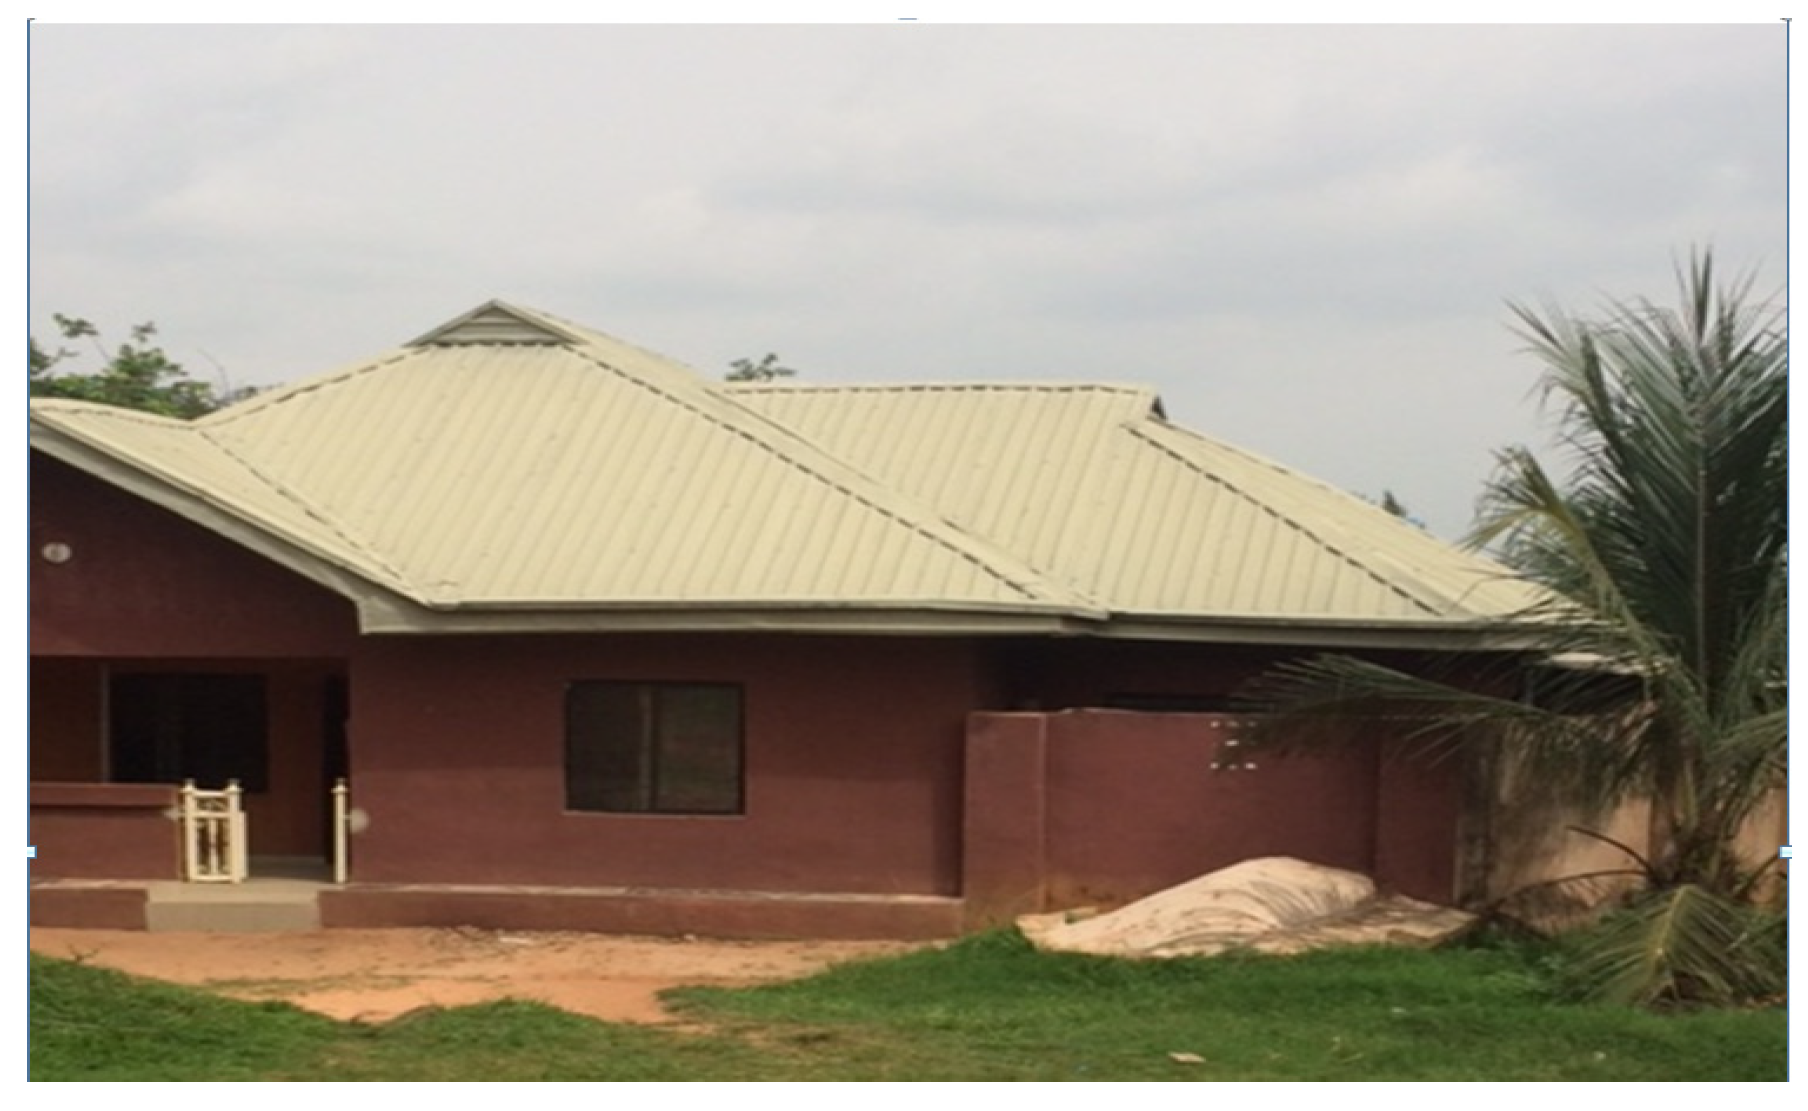
The purpose of the study was to compare the internal thermal comfort characteristics of traditional and modern buildings in Okigwe, Southeastern Nigeria during the dry season to provide design standards for a thermally comfortable setting. The need to find alternative means of attenuating and mitigating the problems of climate change by taking typological lessons from the similarities and differences in both traditional and modern structures in producing thermally suitable environments prompted this study. The study discovered that traditional buildings have lower indoor air temperatures than modern buildings, meaning that their outstanding thermal qualities might be used to learn typological principles. Traditional buildings also adhere to sustainable design principles: they are sensitive to local characteristics, connected to nature, and hence, produce no waste. Traditional buildings were constructed based on locally accessible resources and circumstances rather than relying on mechanical and artificial heating, ventilation, and air conditioning systems, lowering energy usage and expenditures. Thus, to achieve the comfort range as prescribed by previous studies, they do not have to rely on the usage of electro-mechanical equipment such as air conditioners, fans, and water heaters, among others. Modern architecture, and particularly contemporary buildings, on the other hand, is foreign, imported, and promotes the use of electro-mechanical devices for comfort, which is not only at odds with traditional architecture’s passive measures, but also has a negative impact on the environment by causing mismanagement of energy resources. To achieve the comfort range as prescribed by previous studies, modern structures must rely on active design methods such as the usage of electro-mechanical equipment. Based on this, the study recommends that architects and planners in Nigeria should make concerted efforts to integrate passive design strategies through the use of traditional construction materials into the provision of a comfortable indoor thermal environment, rather than relying solely on active design strategies. Traditional buildings, which lack design strategies, nonetheless recorded lower air temperature readings than modern structures, as seen in the study’s results.

Author Contributions

Conceptualization, M.U.O.; data curation, M.U.O. and U.M.-O.; formal analysis, M.U.O.; investigation, M.U.O.; methodology, M.U.O.; resources, M.U.O. and U.M.-O.; software, M.U.O.; validation, M.U.O. and U.M.-O.; writing—original draft, B.O.A., K.O. and C.A.; writing—review and editing, B.O.A., K.O. and C.A. All authors have read and agreed to the published version of the manuscript.

Funding

This research received no external funding.

Institutional Review Board Statement

Not applicable.

Informed Consent Statement

Not applicable.

Data Availability Statement

Not applicable.

Acknowledgments

The authors acknowledge the occupants of the buildings used for this study. Their understanding made this study possible.

Conflicts of Interest

The authors declare no conflict of interest.

References

  1. Cohen, R.; Eames, P.C.; Hammond, G.P.; Newborough, M.; Norton, B. Briefing: The 2021 Glasgow Climate Pact: Steps on the transition pathway towards a low carbon world. Proc. Inst. Civ. Eng.-Energy 2022, 173, 1–6. [Google Scholar] [CrossRef]
  2. Depledge, J.; Saldivia, M.; Peñasco, C. Glass half full or glass half empty? In The 2021 Glas Clim Conference; Taylor & Francis: Abingdon, UK, 2022; pp. 147–157. [Google Scholar]
  3. Smith, P.; Beaumont, L.; Bernacchi, C.J.; Byrne, M.; Cheung, W.; Conant, R.T.; Cotrufo, F.; Feng, X.; Janssens, I.; Jones, H. Essential outcomes for COP26. Glob. Change Biol. 2021, 28, 1–3. [Google Scholar] [CrossRef] [PubMed]
  4. Wang, J.; Yu, C.W.; Cao, S.-J. Technology pathway of efficient and climate-friendly cooling in buildings: Towards carbon neutrality. Indoor Built Environ. 2021, 30, 1307–1311. [Google Scholar] [CrossRef]
  5. Gooroochurn, M. Circular homes–An energy-water-materials nexus for community climate engagement and action at grassroots level in the built environment. Results Eng. 2022, 15, 100548. [Google Scholar] [CrossRef]
  6. Hu, S.; Zhang, Y.; Yang, Z.; Yan, D.; Jiang, Y. Challenges and opportunities for carbon neutrality in China’s building sector—Modelling and data. Build. Simul. 2022, 15, 1899–1921. [Google Scholar] [CrossRef]
  7. Gan, V.J.; Wong, C.L.; Tse, K.T.; Cheng, J.C.; Lo, I.M.; Chan, C.M. Parametric modelling and evolutionary optimization for cost-optimal and low-carbon design of high-rise reinforced concrete buildings. Adv. Eng. Inform. 2019, 42, 100962. [Google Scholar] [CrossRef]
  8. Zuo, J.; Read, B.; Pullen, S.; Shi, Q. Achieving carbon neutrality in commercial building developments–Perceptions of the construction industry. Habitat Int. 2012, 36, 278–286. [Google Scholar] [CrossRef]
  9. Wang, N.; Phelan, P.E.; Gonzalez, J.; Harris, C.; Henze, G.P.; Hutchinson, R.; Langevin, J.; Lazarus, M.A.; Nelson, B.; Pyke, C. Ten questions concerning future buildings beyond zero energy and carbon neutrality. Build. Environ. 2017, 119, 169–182. [Google Scholar] [CrossRef]
  10. Attahiru, Y.B.; Aziz, M.A.; Kassim, K.A.; Shahid, S.; Bakar, W.A.; Nsashruddin, T.F.; Rahman, F.A.; Ahamed, M.I. Review on green economy and development of green roads and highways using carbon neutral materials. Renew. Sustain. Energy Rev. 2019, 101, 600–613. [Google Scholar] [CrossRef]
  11. Zhang, S.; Wang, K.; Xu, W.; Iyer-Raniga, U.; Athienitis, A.; Ge, H.; Woo Cho, D.; Feng, W.; Okumiya, M.; Yoon, G. Policy recommendations for the zero energy building promotion towards carbon neutral in Asia-Pacific Region. Energy Policy 2021, 159, 112661. [Google Scholar] [CrossRef]
  12. Taleghani, M.; Tenpierik, M.; Kurvers, S.; Van Den Dobbelsteen, A. A review into thermal comfort in buildings. Renew. Sustain. Energy Rev. 2013, 26, 201–215. [Google Scholar] [CrossRef]
  13. Luo, M.; Wang, Z.; Ke, K.; Cao, B.; Zhai, Y.; Zhou, X. Human metabolic rate and thermal comfort in buildings: The problem and challenge. Build. Environ. 2018, 131, 44–52. [Google Scholar] [CrossRef]
  14. Sansaniwal, S.K.; Mathur, J.; Mathur, S. Review of practices for human thermal comfort in buildings: Present and future perspectives. Int. J. Ambient Energy 2020, 43, 2097–2123. [Google Scholar] [CrossRef]
  15. Elnaklah, R.; Walker, I.; Natarajan, S. Moving to a green building: Indoor environment quality, thermal comfort and health. Build. Environ. 2021, 191, 107592. [Google Scholar] [CrossRef]
  16. Antoniadou, P.; Papadopoulos, A. Occupants’ thermal comfort: State of the art and the prospects of personalized assessment in office buildings. Energy Build. 2017, 153, 136–149. [Google Scholar] [CrossRef]
  17. Al-Absi, Z.A.; Hafizal, M.I.; Ismail, M.; Ghazali, A. Towards Sustainable Development: Building’s Retrofitting with PCMs to Enhance the Indoor Thermal Comfort in Tropical Climate, Malaysia. Sustainability 2021, 13, 3614. [Google Scholar] [CrossRef]
  18. Montiel, I.; Mayoral, A.M.; Navarro Pedreño, J.; Maiques, S.; Marco Dos Santos, G. Linking sustainable development goals with thermal comfort and lighting conditions in educational environments. Educ. Sci. 2020, 10, 65. [Google Scholar] [CrossRef]
  19. Yang, S.-Q.; Matzarakis, A. Implementation of human thermal comfort and air humidity in Köppen-Geiger climate classification and importance towards the achievement of sustainable development goals. Theor. Appl. Climatol. 2019, 138, 981–998. [Google Scholar] [CrossRef]
  20. Yang, L.; Yan, H.; Lam, J. Thermal comfort and building energy consumption implications—A review. Appl. Energy 2014, 115, 164–173. [Google Scholar] [CrossRef]
  21. Ngarambe, J.; Yun, J.; Santamouris, M. The use of artificial intelligence (AI) methods in the prediction of thermal comfort in buildings: Energy implications of AI-based thermal comfort controls. Energy Build. 2020, 211, 109807. [Google Scholar] [CrossRef]
  22. Cedano, K.G.; Robles-Bonilla, T.; Santillán, O.S.; Martínez, M. Assessing energy poverty in urban regions of Mexico: The role of thermal comfort and bioclimatic context. Sustainability 2021, 13, 10646. [Google Scholar] [CrossRef]
  23. Herrero, S.T. Energy poverty indicators: A critical review of methods. Indoor Built Environ. 2017, 26, 1018–1031. [Google Scholar] [CrossRef]
  24. Bueno, A.M.; de Paula Xavier, A.; Broday, E.E. Evaluating the connection between thermal comfort and productivity in buildings: A systematic literature review. Buildings 2021, 11, 244. [Google Scholar] [CrossRef]
  25. McCartney, K.; Humphreys, M. Thermal comfort and productivity. Proc. Indoor Air 2002, 2002, 822–827. [Google Scholar]
  26. Kaushik, A.; Arif, M.; Tumula, P.; Ebohon, O.J. Effect of thermal comfort on occupant productivity in office buildings: Response surface analysis. Build. Environ. 2020, 180, 107021. [Google Scholar] [CrossRef]
  27. Akimoto, T.; Tanabe, S.-I.; Yanai, T.; Sasaki, M. Thermal comfort and productivity-Evaluation of workplace environment in a task conditioned office. Build. Environ. 2010, 45, 45–50. [Google Scholar] [CrossRef]
  28. Lipczynska, A.; Schiavon, S.; Graham, L.T. Thermal comfort and self-reported productivity in an office with ceiling fans in the tropics. Build. Environ. 2018, 135, 202–212. [Google Scholar] [CrossRef]
  29. Roshan, G.R.; Ranjbar, F.; Orosa, J. Simulation of global warming effect on outdoor thermal comfort conditions. Int. J. Environ. Sci. Technol. 2010, 7, 571–580. [Google Scholar] [CrossRef]
  30. Golshan, T.; Lande, S.; Nickfardjam, K.; Cohensedgh, S.; Roitblat, Y.; Nehuliaieva, L.; Khabie, D.; Stillman, R.; Volynsky-Lauson, A.; Mametov, K. Thermal Comfort in School Classes in the Era of Global Warming: A Prospective Multicenter Study. J. Sch. Health 2021, 91, 146–154. [Google Scholar] [CrossRef]
  31. Masmoudi, S.; Mazouz, S. Relation of geometry, vegetation and thermal comfort around buildings in urban settings, the case of hot arid regions. Energy Build. 2004, 36, 710–719. [Google Scholar] [CrossRef]
  32. Dunjić, J. Outdoor thermal comfort research in urban areas of Central and Southeast Europe: A review. Geogr. Pannonica 2019, 23, 359–373. [Google Scholar] [CrossRef] [Green Version]
  33. Shastry, V.; Mani, M.; Tenorio, R. Impacts of modern transitions on thermal comfort in vernacular dwellings in warm-humid climate of Sugganahalli (India). Indoor Built Environ. 2012, 23, 543–564. [Google Scholar] [CrossRef]
  34. Dili, A.; Naseer, M.; Varghese, T.Z. Thermal comfort study of Kerala traditional residential buildings based on questionnaire survey among occupants of traditional and modern buildings. Energy Build. 2010, 42, 2139–2150. [Google Scholar] [CrossRef]
  35. Odimegwu, C. A Derivation of Passive Guidelines for Achieving Thermal Comfort in the Design of Residential Buildings in Warm Humid Climate of Abia State, Nigeria. Int. J. Dev. Strateg. Humanit. Manag. Soc. Sci. 2019, 9, 1–15. [Google Scholar]
  36. Jayasinghe, M.; Attalage, R.; Jayawardena, A. Roof orientation, roofing materials and roof surface colour: Their influence on indoor thermal comfort in warm humid climates. Energy Sustain. Dev. 2003, 7, 16–27. [Google Scholar] [CrossRef]
  37. Williamson, T.; Daniel, L. A new adaptive thermal comfort model for homes in temperate climates of Australia. Energy Build. 2019, 210, 109728. [Google Scholar] [CrossRef]
  38. Shrestha, M.; Rijal, H.; Kayo, G.; Shukuya, M. A field investigation on adaptive thermal comfort in school buildings in the temperate climatic region of Nepal. Build. Environ. 2020, 190, 107523. [Google Scholar] [CrossRef]
  39. Martínez-Molina, A.; Tort-Ausina, I.; Cho, S.; Vivancos, J. Energy efficiency and thermal comfort in historic buildings: A review. Renew. Sustain. Energy Rev. 2016, 61, 70–85. [Google Scholar] [CrossRef]
  40. Mishra, A.K.; Ramgopal, M. Field studies on human thermal comfort—An overview. Build. Environ. 2013, 64, 94–106. [Google Scholar] [CrossRef]
  41. Al Rasbi, H.; Gadi, M. Energy Modelling of Traditional and Contemporary Mosque Buildings in Oman. Buildings 2021, 11, 314. [Google Scholar] [CrossRef]
  42. Malama, A.; Sharples, S. Thermal performance of traditional and contemporary housing in the cool season of Zambia. Build. Environ. 1997, 32, 69–78. [Google Scholar] [CrossRef]
  43. Ealiwa, M.; Taki, A.; Howarth, A.; Seden, M. An investigation into thermal comfort in the summer season of Ghadames, Libya. Build. Environ. 2001, 36, 231–237. [Google Scholar] [CrossRef]
  44. Dyvia, H.; Arif, C. Analysis of thermal comfort with predicted mean vote (PMV) index using artificial neural network. In IOP Conference Series: Earth and Environmental Science; IOP Publishing: Bristol, UK, 2021; Volume 622, pp. 1–12. [Google Scholar]
  45. Akair, A.; Bánhidi, L. Thermal comfort investigation in Libya. Period. Polytech. Mech. Eng. 2007, 51, 45. [Google Scholar] [CrossRef]
  46. Mahar, W.A.; Verbeeck, G.; Singh, M.K.; Attia, S. An investigation of thermal comfort of houses in dry and semi-arid climates of Quetta, Pakistan. Sustainability 2019, 11, 5203. [Google Scholar] [CrossRef]
  47. Shaeri, J.; Yaghoubi, M.; Aflaki, A.; Habibi, A. Evaluation of thermal comfort in traditional houses in a tropical climate. Buildings 2018, 8, 126. [Google Scholar] [CrossRef]
  48. Huimei, C.; Yufeng, Z.; Jinyong, W.; Qinglin, M. Thermal comfort study in hot-humid area of China. In Proceedings of the Adapting to Change: New Thinking on Comfort, Network for Comfort and Energy Use in Buildings, Cumberland Lodge, Windsor, UK, 9–11 April 2010. [Google Scholar]
  49. Khoukhi, M.; Fezzioui, N. Thermal comfort design of traditional houses in hot dry region of Algeria. Int. J. Energy Environ. Eng. 2012, 3, 5. [Google Scholar] [CrossRef]
  50. Priya, R.S.; Sundarraja, M.; Radhakrishnan, S. Comparing the thermal performance of traditional and modern building in the coastal region of Nagappattinam, Tamil Nadu. Indian J. Tradit. Knowl. 2012, 11, 542–547. [Google Scholar]
  51. Ogunsote, O.; Prucnal-Ogunsote, B. Defining climatic zones for architectural design in Nigeria: A systematic delineation. J. Environ. Technol. 2002, 1, 1–14. [Google Scholar]
  52. Ogunsote, O.O.; Prucnal-Ogunsote, B. Choice of a thermal index for architectural design with climate in Nigeria. Habitat Int. 2003, 27, 63–81. [Google Scholar] [CrossRef]
  53. Akingbade, F. Responses on indoor thermal environment in selected dwellings during the hot season in Ibadan, Nigeria. Glob. J. Pure Appl. Sci. 2004, 10, 627–633. [Google Scholar] [CrossRef]
  54. Ogbonna, A.C.; Harris, D. Thermal comfort in sub-Saharan Africa: Field study report in Jos-Nigeria. Appl. Energy 2008, 85, 1–11. [Google Scholar] [CrossRef]
  55. Akande, O.K.; Adebamowo, M.A. Indoor Thermal Comfort for Residential Buildings in Hot-Dry Climate in Nigeria. In Proceedings of the Conference: Adapting to Change: New Thinking on Comfort and Energy Use in Buildings, Network for Comfort and Energy Use in Buildings, Cumberland Lodge, Windsor, UK, 9–11 April 2010. [Google Scholar]
  56. Eludoyin, O.M.; Adelekan, I.O.; Webster, R.; Eludoyin, A. Air temperature, relative humidity, climate regionalization and thermal comfort of Nigeria. Int. J. Clim. 2013, 34, 2000–2018. [Google Scholar] [CrossRef] [Green Version]
  57. Nwalusi, D.; Chukwuali, C.; Nwachukwu, M.; Chike, H. Analysis of thermal comfort in traditional residential buildings in Nigeria. J. Recent Act. Arch. Sci. 2019, 4, 28–39. [Google Scholar]
  58. Nwankwo, O. Climate variability and its implications on rural household food security in Nigeria. J. Environ. Issues Agric. Dev. Ctries. 2013, 5, 10–18. [Google Scholar]
Figure 1. The data loggers used in the study.
Sustainability 14 12138 g001
Figure 2. Traditional building (T1) with mud wall and thatch roof (A,B).
Sustainability 14 12138 g002
Figure 3. Traditional building (T2) with mud wall and corrugated roofing sheets (A,B).
Sustainability 14 12138 g003
Figure 4. (A,B) A modern building with plastered and painted walls and corrugated iron roofing sheets.
Sustainability 14 12138 g004
Figure 5. Contemporary structure with brick walls and corrugated aluminum roofing sheets.
Sustainability 14 12138 g005
Figure 6. Contemporary bungalow with corrugated iron roofing sheets, unplastered and unpainted.
Sustainability 14 12138 g006
Figure 7. Duplex (top story) contemporary building with stepped aluminum roofing tiles.
Sustainability 14 12138 g007
Figure 8. Contemporary duplex (ground floor) with stepped tiles and aluminum roofing sheets.
Sustainability 14 12138 g008
Figure 9. A modern structure with block walls and corrugated aluminum roofing sheets.
Sustainability 14 12138 g009
Figure 10. Contemporary bungalow with corrugated aluminum roofing sheets, plastered and painted.
Sustainability 14 12138 g010
Figure 11. Traditional building T1 dew point (°C), T (°C), RH (%) daily graph.
Sustainability 14 12138 g011
Figure 12. T (°C), RH (%), and dew point (°C) of traditional building T2 graph.
Sustainability 14 12138 g012
Figure 13. Graph showing contemporary building C3’s daily T (°C), RH (%), and dew point (°C).
Sustainability 14 12138 g013
Figure 14. T (°C), RH (%), and dew point (°C) graph of modern structure C4.
Sustainability 14 12138 g014
Figure 15. Modern structure C5 T (°C), RH (%), and dew point (°C) daily graph.
Sustainability 14 12138 g015
Figure 16. Modern structure C6 T (°C), RH (%), and dew point (°C) daily graph.
Sustainability 14 12138 g016
Figure 17. T (°C), RH (%), and dew point (°C) daily graph of contemporary structure C7.
Sustainability 14 12138 g017
Figure 18. Contemporary building C8 T (°C), RH (%), and dew point (°C) daily graph.
Sustainability 14 12138 g018
Figure 19. T (°C), RH (%), and dew point (°C) of contemporary structure C9 daily graph.
Sustainability 14 12138 g019
Figure 20. Monthly mean minimum air temperature values in a line chart for traditional and modern buildings.
Sustainability 14 12138 g020
Figure 21. Traditional and modern buildings’ mean monthly maximum air temperature values in a line chart.
Sustainability 14 12138 g021
Figure 22. Traditional and modern buildings’ monthly mean minimum RH levels are compared.
Sustainability 14 12138 g022
Figure 23. Traditional and contemporary buildings’ monthly mean maximum RH levels compared.
Sustainability 14 12138 g023
Figure 24. Dry Season Traditional and Modern Structures Indoor Air Temperatures.
Sustainability 14 12138 g024
Figure 25. Traditional and modern structures indoor RH values in the dry season.
Sustainability 14 12138 g025
Table 1. Buildings investigated.
Building TypeBuilding NatureID of BuildingCharacteristics of Roof and Wall
TraditionalBungalowT1Mud wall and thatch roof
TraditionalBungalowT2Mud and corrugated metal zinc sheets
Contemporary (modern)BungalowC3Corrugated metal roofing sheets and well-plastered and painted wall
Contemporary (modern)Block of
Contemporary (modern)FlatsC4Brick wall with corrugated aluminum roofing sheets
Contemporary (modern)BungalowC5corrugated metal roofing sheets on an unplastered and unpainted wall
Contemporary (modern)Duplex
Contemporary (modern)(Upper Floor)C6Block wall with corrugated aluminum roofing sheets
Contemporary (modern)Duplex
Traditional(Ground Floor)C7Block wall with concrete slab
TraditionalBlock of
Contemporary (modern)FlatsC8Block wall with corrugated aluminum roofing sheets
Source: (Fieldwork, 2016).
Table 2. Temperature range and mean monthly minimum and maximum temperatures (°C).
MonthMin Ave per MonthAve Max per MonthRange of Monthly Mean
T1
November26.429.83.4
December23.228.95.7
January25.630.04.4
February27.931.94.0
March27.431.23.8
T2
November27.130.33.2
December25.129.54.4
January26.530.54.0
February28.832.63.8
March28.431.83.4
C3
November26.932.35.4
December25.4326.6
January26.532.86.3
February28.634.96.3
March28.134.16.0
C4
November26.931.24.3
December26.230.24.0
January27.730.52.8
February30.031.31.3
March29.630.71.1
C5
November25.834.68.8
December23.334.411.1
January24.73510.3
February27.137.210.1
March26.735.38.6
C6
November26.330.13.8
December24.529.34.8
January25.530.14.6
February27.832.34.5
March27.531.54.0
C7
November26.328.62.3
December25.527.82.3
January26.428.52.1
February2830.42.4
March27.529.92.4
C8
November28.030.42.4
December26.429.63.2
January27.530.42.9
February29.732.52.8
March28.931.72.8
C9
November27.530.32.8
December26.129.73.6
January26.930.63.7
February29.232.93.7
March28.732.03.3
Source: (Fieldwork, 2015; 2016).
Table 3. Indoor relative humidity minimum and maximum (%) values.
MonthMin Mean per Month (P.M.)Max Mean per Month (A.M.)Average
T1
November64.083.473.7
December26.249.237.7
January26.357.341.8
February34.866.750.1
March65.281.873.5
T2
November62.880.471.6
December26.646.149.7
January27.454.554.7
February36.163.968.1
March63.476.870.1
C3
November59.083.471.2
December26.642.334.5
January27.054.941.0
February33.666.149.9
March58.879.569.2
C4
November56.480.168.3
December23.043.833.4
January23.053.938.5
February25.263.144.2
March67.878.873.3
C5
November52.787.970.3
December24.050.237.1
January24.161.042.6
February30.672.151.4
March56.686.071.3
C6
November71.983.477.7
December33.750.842.3
January35.256.746
February43.166.354.7
March68.480.974.7
C7
November74.189.681.9
December40.564.352.4
January41.563.652.6
February52.570.861.7
March74.385.980.1
C8
November59.578.469.0
December25.744.134.9
January27.353.640.1
February35.862.849.3
March63.576.870.2
C9
November67.881.413.6
December28.847.819
January28.156.027.9
February36.863.927.1
March65.177.512.4
Source: (Fieldwork, 2015; 2016).
Table 4. Traditional buildings’ mean indoor air temperature values in the dry season.
MonthMinMaxAverage
November26.830.228.5
December24.529.727.1
January26.130.128.1
February28.532.730.6
March27.931.529.7
D/S MEAN26.830.828.8
Source: (Fieldwork, 2016).
Table 5. Indoor air temperature values of modern buildings in the dry season.
MonthMinMaxAverage
November26.931.129
December25.330.427.9
January26.531.128.8
February28.633.130.9
March28.132.230.2
D/S MEAN27.131.629.4
Source: (Fieldwork, 2016).
Table 6. Traditional buildings’ indoor relative humidity values in the dry season.
MonthMinMaxAverage
November63.481.972.7
December26.447.737.1
January26.955.941.4
February35.565.350.4
March64.379.371.8
D/S MEAN43.36654.7
Source: (Fieldwork, 2016).
Table 7. Modern buildings’ indoor relative humidity values in the dry season.
MonthMinMaxAverage
November63.183.573.3
December28.94939.0
January32.55443.3
February36.866.451.6
March64.980.372.6
D/S MEAN45.266.655.9
Source: (Fieldwork, 2016).
Table 8. Traditional and modern buildings’ indoor air temperatures in the dry season.
StructuresIndoor Air Temperature in Dry Season
Traditional28.8
Modern29.4
Source: (Fieldwork, 2016).
Table 9. Minima and maxima for the traditional and contemporary buildings’ dry season mean humidity values.
StructuresIndoor Relative Humidity in Dry Season
Traditional54.7
Modern 55.9
Source: (Fieldwork, 2016).
Table 10. Traditional and modern buildings’ indoor air temperature Z-test values.
Traditional StructuresModern Structures
Ind. Air Temp (°C)
Mean28.829.2
Known Variance2.49882.6617
Hypothesized Mean Difference0
Z−4.2365
p Value0.0000
Source: (Fieldwork, 2016).
Table 11. Traditional and modern buildings’ indoor relative humidity Z-test values.
Traditional StructuresModern Structures
Ind. RH(%)
Mean54.255.8
Known Variance357.3352.68
Hypothesized Mean Difference0
Z−1.3222
p Value0.1861
Source: (Fieldwork, 2016).
Publisher’s Note: MDPI stays neutral with regard to jurisdictional claims in published maps and institutional affiliations.

