1. Introduction
Current energy policy, largely focused on fossil fuels and nuclear fission, is being questioned by consumers whose environmental awareness is increasing. Global warming, nuclear accidents, or acid rain, among multiple unwanted side effects, are forcing us to adapt next-generation guidelines with the aim of achieving an ecologically sustainable energy model that favors new energy resources, as agreed in the “United Nations Conference on Climate Change” (COP26) of 2021, held in Glasgow, United Kingdom [
1]. Some of the most appealing options within the range of renewable technologies are photovoltaic, wind, and wave technology; however, despite the fact that solar and wind energy have reached a high enough maturity level to be commercially viable, wave energy has lagged behind, with no effective commercial prototypes [
2,
3]. Even so, wave energy is increasingly considered as an important and promising resource. Waves contain the most condensed energy because they store energy from the wind, and thus from the sun [
4]. The gross wave resource energy estimated worldwide is about 32,000 TWh/year, which exceeds the amount of electricity consumed by humanity in a whole year [
5,
6]. The wave energy resource identified in Europe (EU) is in the range of 1000–1500 TWh/year [
2].
The development of wave energy can provide many benefits in those places with an abundant wave resource. These benefits include increased renewable energy mix and guaranteed diversity of energy supply; ensured energy supply and energy independence by reducing the strong dependence on oil and gas imports; an enhanced blue and green economy; job creation; and combatting of climate change [
3,
5].
According to a report by Ocean Energy Systems (OES), global tidal and wave energy production has increased 10-fold in the last decade, with the energy produced by wave and tidal technologies increasing from 5.0 GWh in 2009 to around 45 GWh in 2019. Currently, multiple major projects and implementations are being planned for coming years as the decarbonizing mission intensifies and governments around the world exhibit an increased interest in ocean energy technologies [
7]. In 2020, the European Commission proposed the future development of ocean energy in the European Union for coming years. The goals are 100 MW installed by 2025, 1.0 GW by 2030, and 40 GW by the end of 2050 [
8].
In Spain, during 2019, the government continued work on the “Energy and Climate National Integrated Plan 2021–2030” [
9] and on the “Energy Transition and Climate Change Act” [
10]. The Energy and Climate National Integrated Plan 2021–2030 sets an ocean energy target of 25 MW of installed capacity for 2025 and 50 MW for 2030.
It is important to keep in mind the current limitations of ocean energy generation; while the technology of photovoltaic (PV) and wind systems are well defined and mature, wave energy converter plants (WECs) are limited to prototypes and experimental projects. Although there are still several barriers to overcome, some due to the technology development stage of ocean energy and others due to the lack of a stable policy and legal framework to further the development of the sector, renewable ocean energies will exhibit very high growth in the energy sector in the world in coming decades, as stated in Avila et al. [
2] on the inclusion of wave energy in the renewable energy agenda for the reduction of polluting gas emissions by 2050. Ahmed et al. [
11] also expose the importance of government decision making and policies for wave energy development.
Moreover, many isolated regions or islands such as the Canary Islands experience a high shortage of fresh water, and desalination is used to supply the fresh water needed for domestic, industrial, and agricultural activities. For this reason, energy has an increasingly important environmental and economic impact on island systems [
12,
13].
The use of renewable energies for the Canary archipelago is a very good option to reduce dependence on imported fossil fuels and lessen the environmental impact of electricity production. The islands offer extraordinary renewable energy potential, with solar, wind, and wave energy [
13,
14]. In the long term, renewable energies could be an important resource for the economic and financial sustainability of the electricity and water supply systems on the islands. The production, transport, and management costs of renewable energy production could be significantly reduced in the next few decades, being reported by Kılkış et al. [
15] in their research on advancements in sustainable development of energy. Against this backdrop, wave energy systems are a promising option as an energy source in coastal places with a high wave resource. However, there is still a long way to go to reach an acceptable level of technological maturity.
In the Canary Islands, water management is increasingly dependent on energy resources, making the link between water and energy important and difficult to manage. According to the Eco-Management Plan for the production and distribution of water in the Canary Island archipelago, the relationship between the energy demand of the comprehensive water cycle and the electrical energy supplied to the grid, in some islands, may be close to 20% (taking into account the seawater desalination processes, transport and distribution of water to consumption points, wastewater collection, purification, and regeneration). That is, the total energy needed for the entire water cycle may account for 15 to 20% of the electricity demand of an island in the archipelago [
16]. Specifically, on the island of El Hierro, as per information published in [
16], around 90% of domestic water supply on the island comes from desalinated water, which is provided by four desalination plants that produce 4100 m
3/day of desalinated water. In fact, 5.7% of the electricity demand on the island of El Hierro corresponds to the desalination processes.
El Hierro aims to become the first 100% carbon-free island in the world, after its favorable conditions for this kind of project have been recognized both locally and national, but the system currently installed is based on a diesel power plant and a hydro-wind power plant, which do not allow the production of 100% of the required electric energy in the island from renewable sources throughout the year [
17].
The solution to this problem does not involve expanding the wind generation capacity, but rather diversifying the energy mix of the island’s generation system by introducing other renewable energy sources.
In this sense, the installation of an experimental WEC and its connection to the island’s electrical system can be a first step in the introduction of this type of energy in the island’s energy mix and in obtaining valuable experience on its use and operation.
To date, different devices have been developed with different operating principles to harness the energy of the waves, studying in the Canary Islands the power take-off in many of the different WECs, such as Pelamis (hydraulic motor), Wave Dragon, and Aqua Buoy (hydroturbine), using the Monte Carlo method [
2]. On the island of El Hierro, other researchers such as Padrón et al. [
18] have evaluated different WECs to supply power to desalination systems. Goncalves et al. [
19] carried out a numerical study of the wave energy distribution in the Canary Islands to determine the region with the greatest potential. In the Mediterranean region, other studies on the potential of wave energy on small islands have been carried out, such as the preliminary analysis of the performance of several nearshore WECs located on the west coast of Sicily, Italy [
20], and another study developed by Neshat et al. [
21] that focus their research on the optimization of a multi-mode WEC also in western Sicily.
Amongst all of them, systems based on oscillating water columns (OWC) are emerging as the preferable technology in the scientific world. In fact, a large number of the WEC prototypes deployed so far at sea have been of the OWC type. In an OWC system, a fixed or floating hollow structure is open to the sea below the water surface, which catches air over the inner free surface. The wave action compresses and decompresses the trapped air, which is forced to flow through a turbine coupled to a generator. From a mechanical point of view, the power take-off is particularly simple and reliable, since the only moving part is the rotor of an air turbine that is located above the level of sea water, which is responsible for directly operating a conventional electric generator [
22,
23].
Hence, the main goal of this study is to propose a methodology to select and characterize the wave energy potential that can be easily extrapolated by industry professionals to other coasts, and in particular to other oceanic islands. The island of El Hierro has been taken as a case study to install an OWC prototype. First, the territorial, technical, and economic conditions of a possible WEC installation have been studied in order to define the best location for the installation. Secondly, the average wave regime and the wave propagation coefficients in the coastal area have been determined in order to characterize the waves in the previously selected area. Thirdly, a non-directional study of gross energy potential at selected points has been performed to determine the wave energy that would be made available to an OWC prototype to convert into pneumatic energy so that the choice of location can be justified. The results should be useful for designing and installing a future prototype of a multidirectional OWC power plant that supplies energy to the small electrical grid of El Hierro, or that can provide the energy needed to operate one of the desalination plants on the island.
This paper is organized into five sections. Following this introduction, we present the case of study and the methodology proposed for selecting and characterizing the wave energy off the coast of El Hierro. The results are analyzed and discussed in the
Section 4. Finally,
Section 5 presents the conclusions.
2. Case of Study
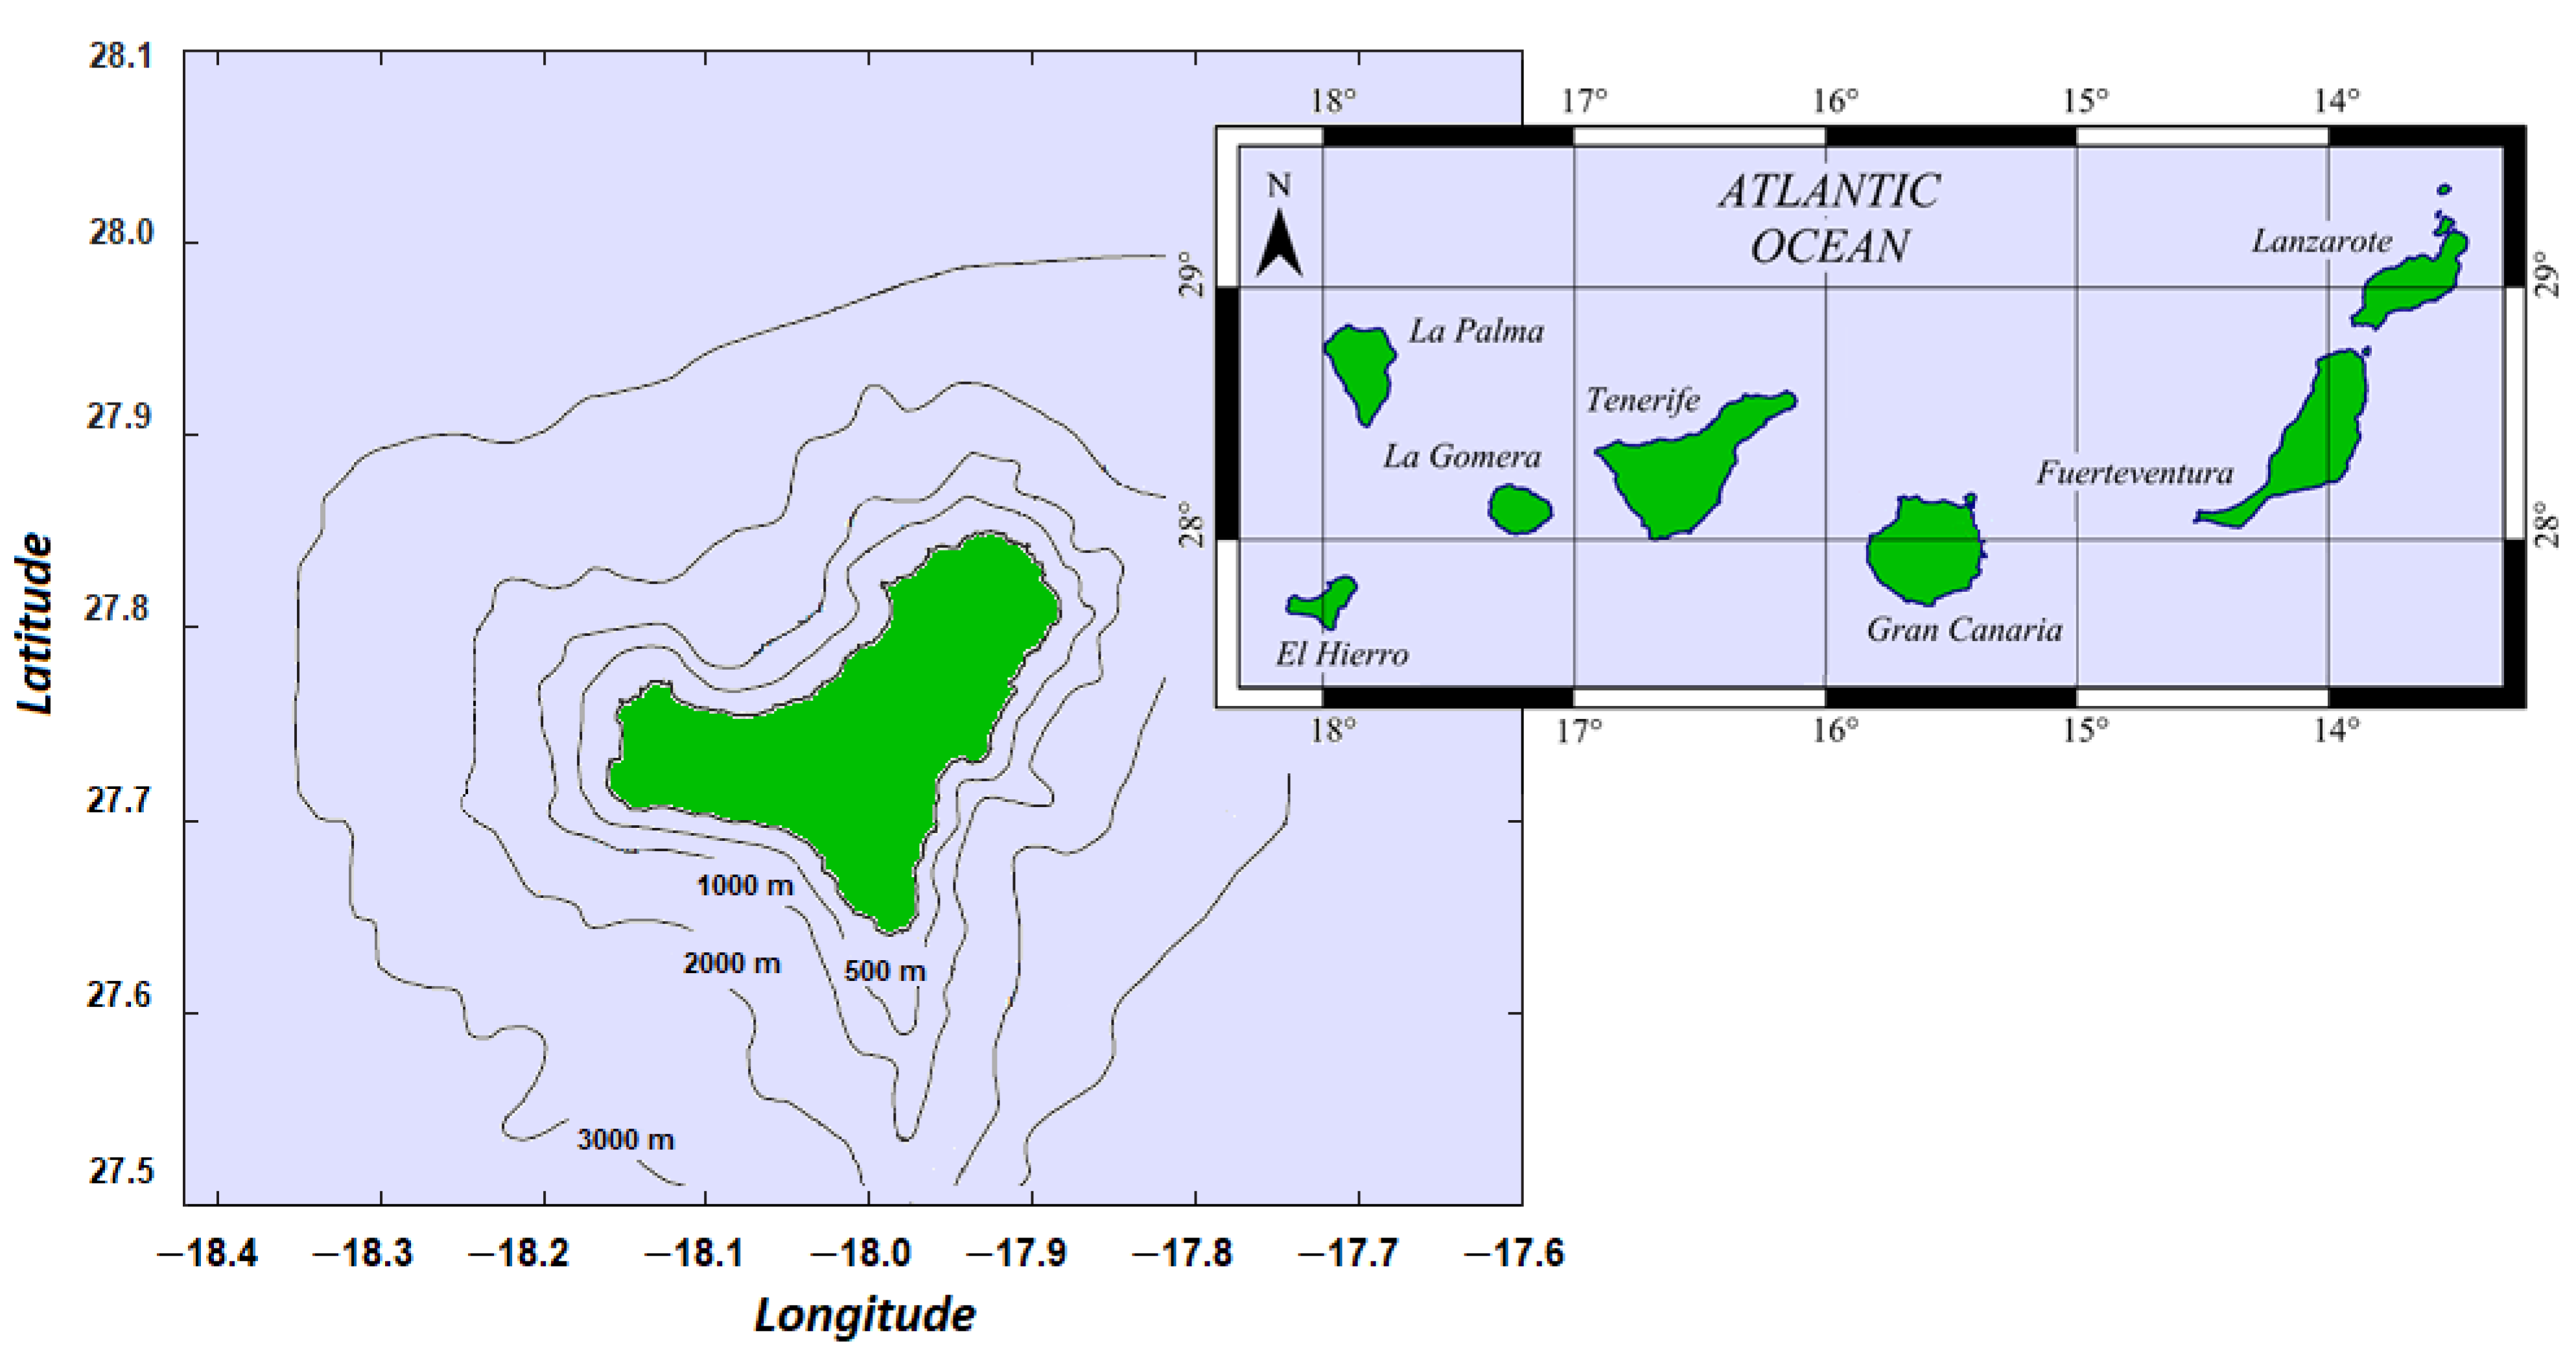
The island studied in this work, El Hierro (
Figure 1), has been a biosphere reserve since 2000. It is one of the archipelago’s youngest islands, and its rugged terrain quickly rises to an elevation of 1500 m, resulting in a unique landscape with steep slopes. El Hierro island aspires to become the first place in the world with a 100% renewable supply source. Currently, the island of El Hierro has the “Llanos Blancos” Diesel Power Plant, which produces electricity with a nominal installed power of 14.96 MW, according to [
17]. In addition, El Hierro has the “Gorona del Viento” Hydro-Wind Power Plant, which supplies electricity directly to the grid through a wind farm (11.5 MW) and simultaneously powers a pumped hydro facility that stores water in an elevated reservoir as an energy storage system. As a result, the hydroelectric 11.32 MW power plant takes advantage of stored potential energy, guaranteeing the electrical supply and the stability of the grid. In the year 2020, 42% of the energy produced in the island came from renewable energies, saving 15,484 tons/year in CO
2 emissions. “Gorona del Viento” is capable of covering 100% of the electrical demand in periods with favorable wind conditions (1293 h in 2020); however, during the months when the wind speed is lower, another complementary energy source is necessary [
24].
As has been exposed before, perhaps the island energy solution does not involve expanding its wind generation capacity, but rather creating synergies with other renewable energies such as ocean energies, in this case with wave energy. For that reason, is so important to identify a methodology to select the right place to install an OWC prototype in El Hierro Island or any other place in the world with the same characteristics.
The potential of El Hierro must be harnessed because this island is an ideal territory for experimenting with sustainable energy systems due to an abundance of hours of sun, wind, and waves. For this reason, it is necessary to study the wave energy alternative to support wind energy in order to achieve greater generation guarantees and greater penetration of renewables in the electricity system.
3. Methodology
This research aims to propose a methodology for selecting and characterizing the wave energy off the coast of El Hierro so as to propose the best place to install an OWC prototype. Therefore, the study was divided into three main sections:
- I.
Selection of the best location for the future installation of a wave energy plant.
- II.
Wave characterization in the selected area.
- III.
Non-directional study of the gross energy potential at the point selected to calculate the available wave energy.
3.1. Selecting the Best Location to Install the Wave Energy Plant
In this first step, we studied the bathymetric, geological, geotechnical, economic, environmental, and legal conditions to determine the best area for installing a wave energy plant.
To carry out the bathymetric study of El Hierro, we used the general bathymetry available in GrafCan, which corresponds to that provided by service of the Spanish Institute of Oceanography, with 50 m equidistant isobaths. In addition, the Bionomic Atlas of the Canary Islands was used to yield a detailed bathymetry with equidistant isobaths 5.0 m apart. The extensive bibliography and existing studies on the geology of Canary Islands were considered for the geologic and geotechnical studies. The studies carried out were used to determine the location where the installation costs of a wave power plant are minimal and the conditions for its operation are optimal.
Finally, to complete the first section, a revision of planning and the environmental regulations was conducted to test the feasibility of the selected location. So that the possible location of the wave power station does not affect the natural environment of El Hierro, the limits of the protected territory of the island were taken into account. We also reviewed the existing national and European legislation for the installation and operation of a WEC.
3.2. Wave Characterization
The aim of this second section is to characterize the waves in the selected area. We did so by determining the medium wave regime and the wave propagation. Firstly, the mean wave regime was determined using the historical wave data between 1958 and 2019 (61 years) of the SIMAR points of the Spanish Ports Authority (Puertos del Estado) re-analysis model. This model relies on the third-generation wave model WAM/SWAN, and therefore the values of the different wave parameters obtained are spectral values. There are buoys for measuring wave data in the Canary Islands, but they are located very far from the selected location and exposed to very different wave conditions. The directional ranges of the waves that affect the “Llanos Blancos” coast have been established, and those directions in which the coast is sheltered by other islands have been eliminated. Data points were chosen from the determination of the exposure ranges. The criteria used were determined by those data points that are at least as exposed to the waves as the “Llanos Blancos” coast. The hourly values of the selected WANA-SIMAR point (one data point in each hour of the series) of the following parameters were taken as the starting data:
- ■
Significant wave height in deep sea, Hs.
- ■
Peak wave period, Tp.
- ■
Direction of origin of the wave in deep sea, .
In the statistical analysis of the mean wave regime, the height and period data will be discriminated according to the direction of origin. The statistical distributions used were log-normal and Weibull (
Table 1). The procedure began with the separation of data by direction. For both variables, the
N size sample was arranged from lowest to highest, and the
i-th datum was assigned the cumulative sample probability
pi = (
i − c1)/(
N + c2). To represent the data by wave height and direction, intervals of 0.5 m amplitude were considered. The parameters of both statistical distributions were obtained by linear regression of the wave height over the reduced variables obtained from the sample probability.
Secondly, the storm directional regime of the waves was determined from the series of historical re-analysis data of Spanish Ports Authority for point SIMAR 4,008,007 (lat. 27.83333° N, lon. 17.83333° W), as well as directional wave propagation. The significant wave height and direction of propagation obtained by statistical methods corresponded to the depth of the location of the SIMAR point used (deep water in all cases). To calculate the wave propagation, we used the direct analytical method based on the linear theory of waves by means of which the characteristics of the waves (coefficients and direction of propagation) were determined as the depth of the advancing wave is reduced. The coefficients and the direction of propagation were calculated at regular depth intervals up to the break in two sections:
- ■
A first section from depth L0/2 (considered the limit between deep and transition waters) to isobath z = −25 m. The depth interval was divided into 25 z-values, and the change in the direction of propagation (refraction) from one division to the next was determined.
- ■
Another section from the isobath
z = −25 m to the breaker. In this section, the divisions were made every meter, so that they correspond to integer values of
z (−25, −24 −23, …). The criterion for determining the depth at which break occurs was McCowan’s [
25], with a breaking index
γ = 0.80.
The orientation of the isobaths corresponding to the different divisions were measured in the bathymetric plane. The propagation took into account the phenomena of shoaling and refraction. We assumed that the reflection and diffraction that may occur in the selected area were not significant, since the coasts are highly dissipative, and thus we ignored them in this study. To calculate the propagation coefficients, the waves were separated by direction of origin and peak period. The two extreme tidal levels corresponding to the equinoctial high and low tides at “Puerto de la Estaca” (El Hierro, Canary Islands) were also considered. The tidal levels were added to the elevation of the isobaths to obtain the water depth (h) on each of them.
For each peak wave period and each water depth value considered, the angular number of waves (
k) was calculated using the dispersion equation, expression number 1.
The angular number of waves was used to determine the wave train celerity factor, Equation (3).
Both parameters were used to determine the shoaling coefficient, expression (4).
The incidence angle of the waves at each isobath was calculated to determine the refraction coefficient. If
αi+1 is the crest angle with isobath
i when the wave passes over isobath (
αi+1), the angle when it passes over isobath
i (
αi) was determined using Snell’s law (Equation (5)).
Equation (6) was used to determine the refraction coefficient over isobath
i from crest angle
α0 in deep water with isobath
i.
3.3. Energy Potential
The historical data of the mean wave regime in the period between 1958 and 2019 was used to calculate the gross wave energy potential of the selected location; specifically, the data set of the WANNA-SIMAR point chosen as determined by the exposure ranges, since this point is exposed to the waves at the coast of “Llanos Blancos”. The hourly values of the WANA-SIMAR point selected (one data point for each hour in the series) of the following parameters were taken as the starting data:
- ■
Significant wave height in deep sea, Hs.
- ■
Peak wave period, Tp.
These data covered approximately a period of 61 years of sea states per hour, which led to an accurate description of the climate of deep sea waves at the chosen point. The offshore energy resource was thus characterized by separating the data on the basis of the height and period of the waves. Data packets were established with a significant wave height resolution of 0.5 m and a peak wave period of 1.0 s. The established ranges were a range between 0.5 and 5.5 m and a range between 3.5 and 19.5 s. Different sea states were defined, and the statistical probability for each sea state was obtained by estimating the number of hours that a certain sea state occurs over a one-year period.
To determine the available wave energy, it was necessary to propagate the waves from the chosen WANA-SIMAR point to the selected site. To do this, the abovementioned method based on the Linear wave theory (often referred to as the Airy wave theory) was used to determine the wave characteristics as the waves approach shallower water near the coast. The angular number of waves was used to determine the wave train celerity factor. Once the wave train celerity factor was calculated, the wave power was calculated using the equation for deep water conditions found in [
26].
where
Pw is the wave energy flux in watts per meter of crest length (kW/m),
= 1025 kg/m
3 is the mean density of sea water in El Hierro,
g is the gravitational acceleration,
Hs is the significant wave height, and
Te is the energy period.
The values corresponding to
Te were obtained indirectly from the expression (2), where
Tp is the peak wave period [
19,
26].
Up to this point, the total number of hourly data points for each variable available in the historical series was 535,610 (1958–2019, 61 years).
Finally, different energy containers were defined to calculate the annual energy potential of the location. These containers were based on the number of hours that each sea state is present during an average year. The product of the power of each sea state and the number of hours corresponding to each sea state was calculated to obtain the watt-hours per unit area for each sea state in one year. The sum of each of the energy containers will yield the gross energy potential of the site studied in a typical year. This study considered all wave directions, meaning it was a non-directional study.
4. Results and Discussions
In this section, the results obtained in the proposal of a methodology for the selection and characterization of wave energy in isolated regions are presented and discussed.
4.1. Selected Location, Llanos Blanco Coast
The first objective of this study was to determine the best location for the potential installation of an OWC prototype in El Hierro. The search for the best area for the use of wave energy prioritized the following conditions:
- ■
Proximity to the “Llanos Blancos” Power Plant, in order to facilitate its connection to the island’s grid and take advantage of the electrical infrastructures to distribute the energy generated by a future wave power plant.
- ■
Avoid the fact that the proposed site is sheltered from any structure for obvious reasons.
- ■
The corresponding structure of a future WEC will be grounded at the bottom and will be radially symmetrical to take advantage of waves coming in from any direction.
- ■
The environmental impact on the territory and biocenosis must be minimal.
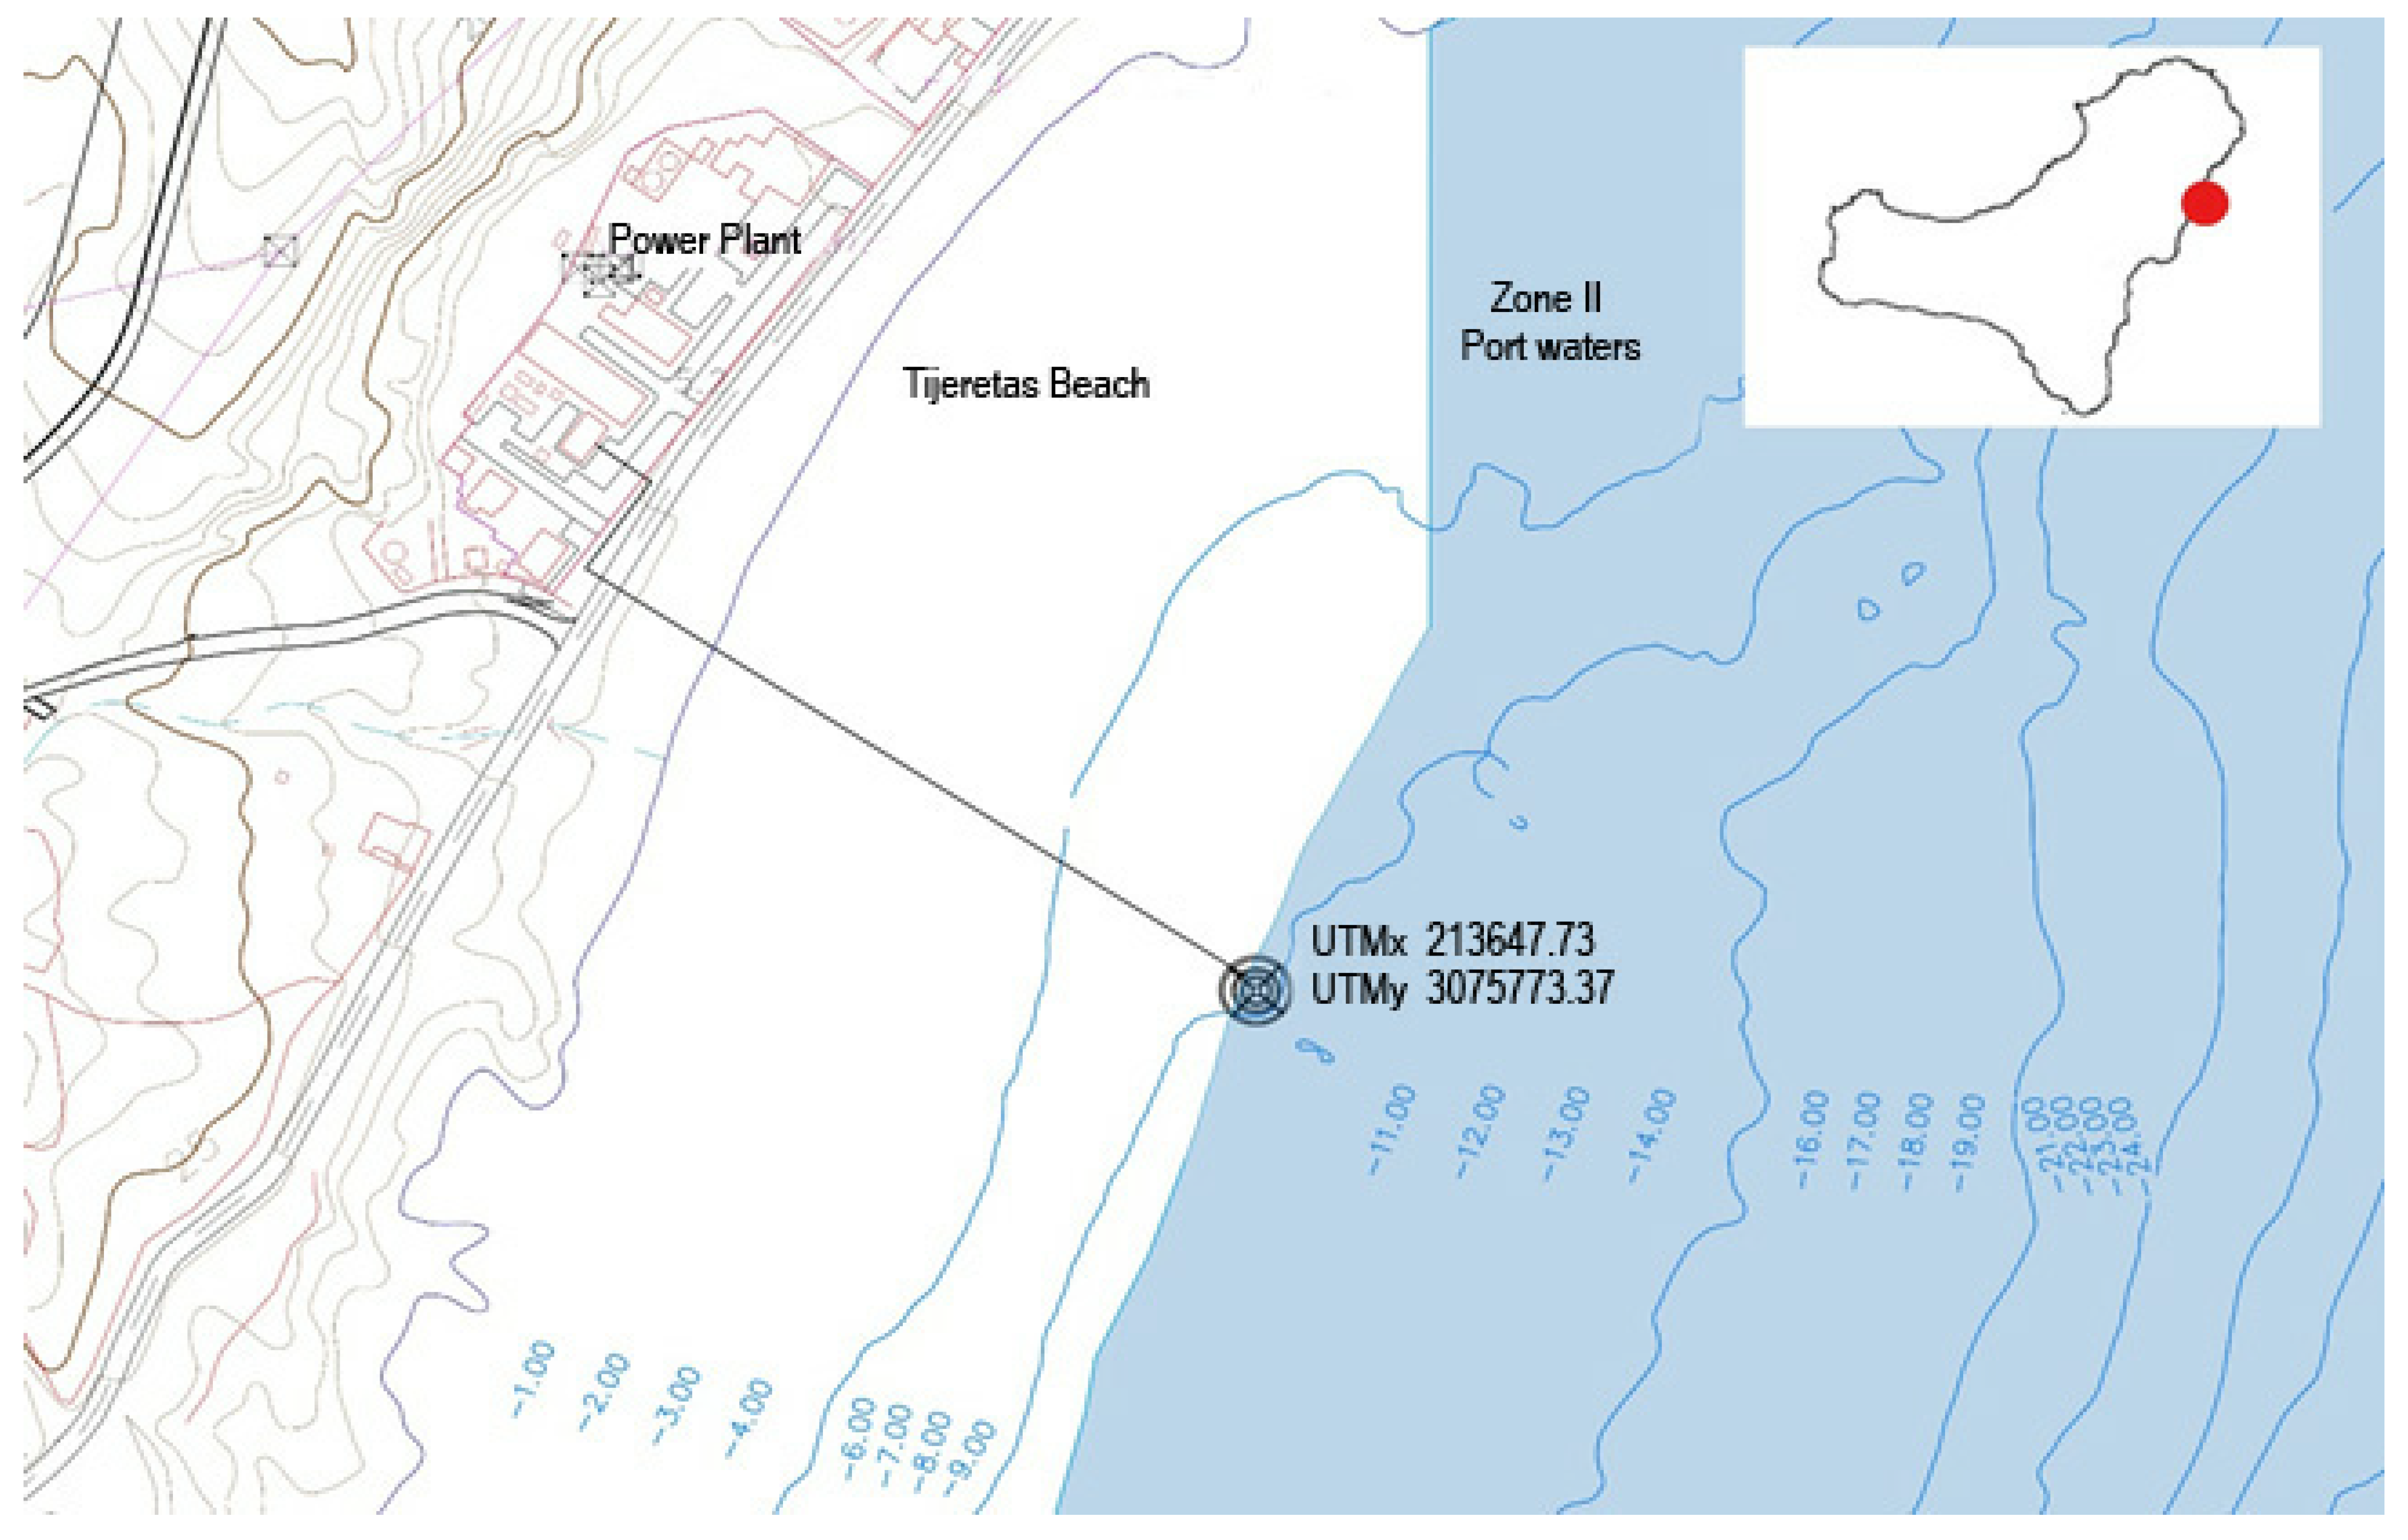
Figure 2 shows the proposed location of the OWC experimental plant on the isobath
z = −10 m in front of the “Llanos Blancos” Power Plant Station. Its UTM coordinates were
x = 213,647.73,
y = 3,075,773.37 in the 28 N zone. The wave device was thus located just at the boundary of the administrative zone II of port waters, although within it, and the length of the power line that would connect it with the substation of the Power Plant is 311.09 m. The reasons for selecting this location are summarized below.
Regarding the economic cost of a future wave power plant, the installation will be more expensive the deeper the structure necessary to capture the wave energy is grounded. In addition, the power line that will transport the energy from the WEC to the corresponding transformer station will possibly be channeled in a trench along its entire length, meaning the longer the length, the higher the cost of the power line. Therefore, the most economically advantageous location for a WEC was the shallowest location at the shortest possible distance from the “Llanos Blancos” Diesel Power Plant.
Considering the morphology of the sea bottom and its geotechnical characteristics, the foundation is less problematic in rocky bottoms than in sandy bottoms, although in any case, it is necessary to build a bench of selected granular material that correctly transmits the stress to the bottom. In front of the power plant, the sand bottom starts from the isobath z = −10 m. The least problematic construction locations are located from z = −10 m to the coast.
Environmentally, infrastructures such as the diesel power plant, the lower pond of the “Gorona del Viento” complex, and part of the industrial and hydrocarbon storage infrastructures associated with the “Puerto de La Estaca” are located within the Natural Landscape of “Timijiraque” (identifier H-7 of the network of protected natural areas of the Canary Islands). This space is within the Natura 2000 network as a place of community importance (SCI ES7020006), a zone of special conservation (ZEC 173-EH). However, ENP H-7 has its limit at the coastline, meaning the infrastructure considered herein only affects the land section of the power line. Furthermore, the entire territory from the Island of El Hierro and the strip of coastal waters of the “Mar de Las Calmas” between “La Restinga” and the “Tecorón-El Lance” area is protected as a biosphere reserve. The limit of this space in the “Llanos Blancos” area is the coastline, so this work only affects the land section of the ditch power line.
Finally, regarding the impact on the public port domain of the “Puerto de la Estaca”, those waters that, due to their depth and proximity to the coast, are of no use to the port, and that according to the port are excluded from administrative zone II Order FOM/2728/2015, which approves the delimitation of spaces and port uses of the “Puerto de La Estaca” on the Island of El Hierro, are those located in a 200 m wide strip from the coast. However, the legislation does not prohibit the installation of WECs in the outer waters of the ports, and in this case, its installation within zone II may offer more advantages than disadvantages by benefiting from the uses permitted in these waters.
4.2. Wave Characterization in “Llanos Blancos” Coast
The determination of the mean wave regime and wave propagation is essential in any project involving the installation of a WEC.
On the one hand, the average directional regime was determined from a statistical analysis of the historical data series for Hs and Tp in each of the directions that affect the “Llanos Blancos” coast. The “Llanos Blancos” coast is exposed to the following directions (only those directions that range in the range of ±11.25°, the exposure range are included):
- ■
Directions with component N exposed to waves from 9° to 49° with respect to N. It covers directions N, NNE, and NE.
- ■
Directions with component E and S exposed to waves from 77° to 203° with respect to N. It covers directions ENE, E, ESE, SE, SSE, S, and SS.
The
N-size sample was ordered from lowest to highest, and the
i-th data were assigned the cumulative sample probability
pi = (
i −
c1)/(
N + c2), with
c1 and
c2 taking on the values shown in
Table 2.
To represent the data by wave height and direction, 0.5 m wide intervals were considered. These data are based on a linear regression of the wave height and the period on the reduced variables obtained from the sample probability (
Table 3). The parameters for both distributions of the significant wave height are shown in
Table 4. The results obtained in the statistical distributions adjusted very well to the average wave height regime for each direction studied. The determination coefficients (R
2) obtained always exceeded 0.98.
The waves were separated by the direction of origin and peak period to calculate the propagation coefficients. The two extreme tidal levels (+0 m and +2.5 m) corresponding to the equinoctial high and low tides at “Puerto de la Estaca” (El Hierro, Canary Islands) were considered. The tidal levels were added to the elevation of the isobaths to obtain the water depth (h) for each.
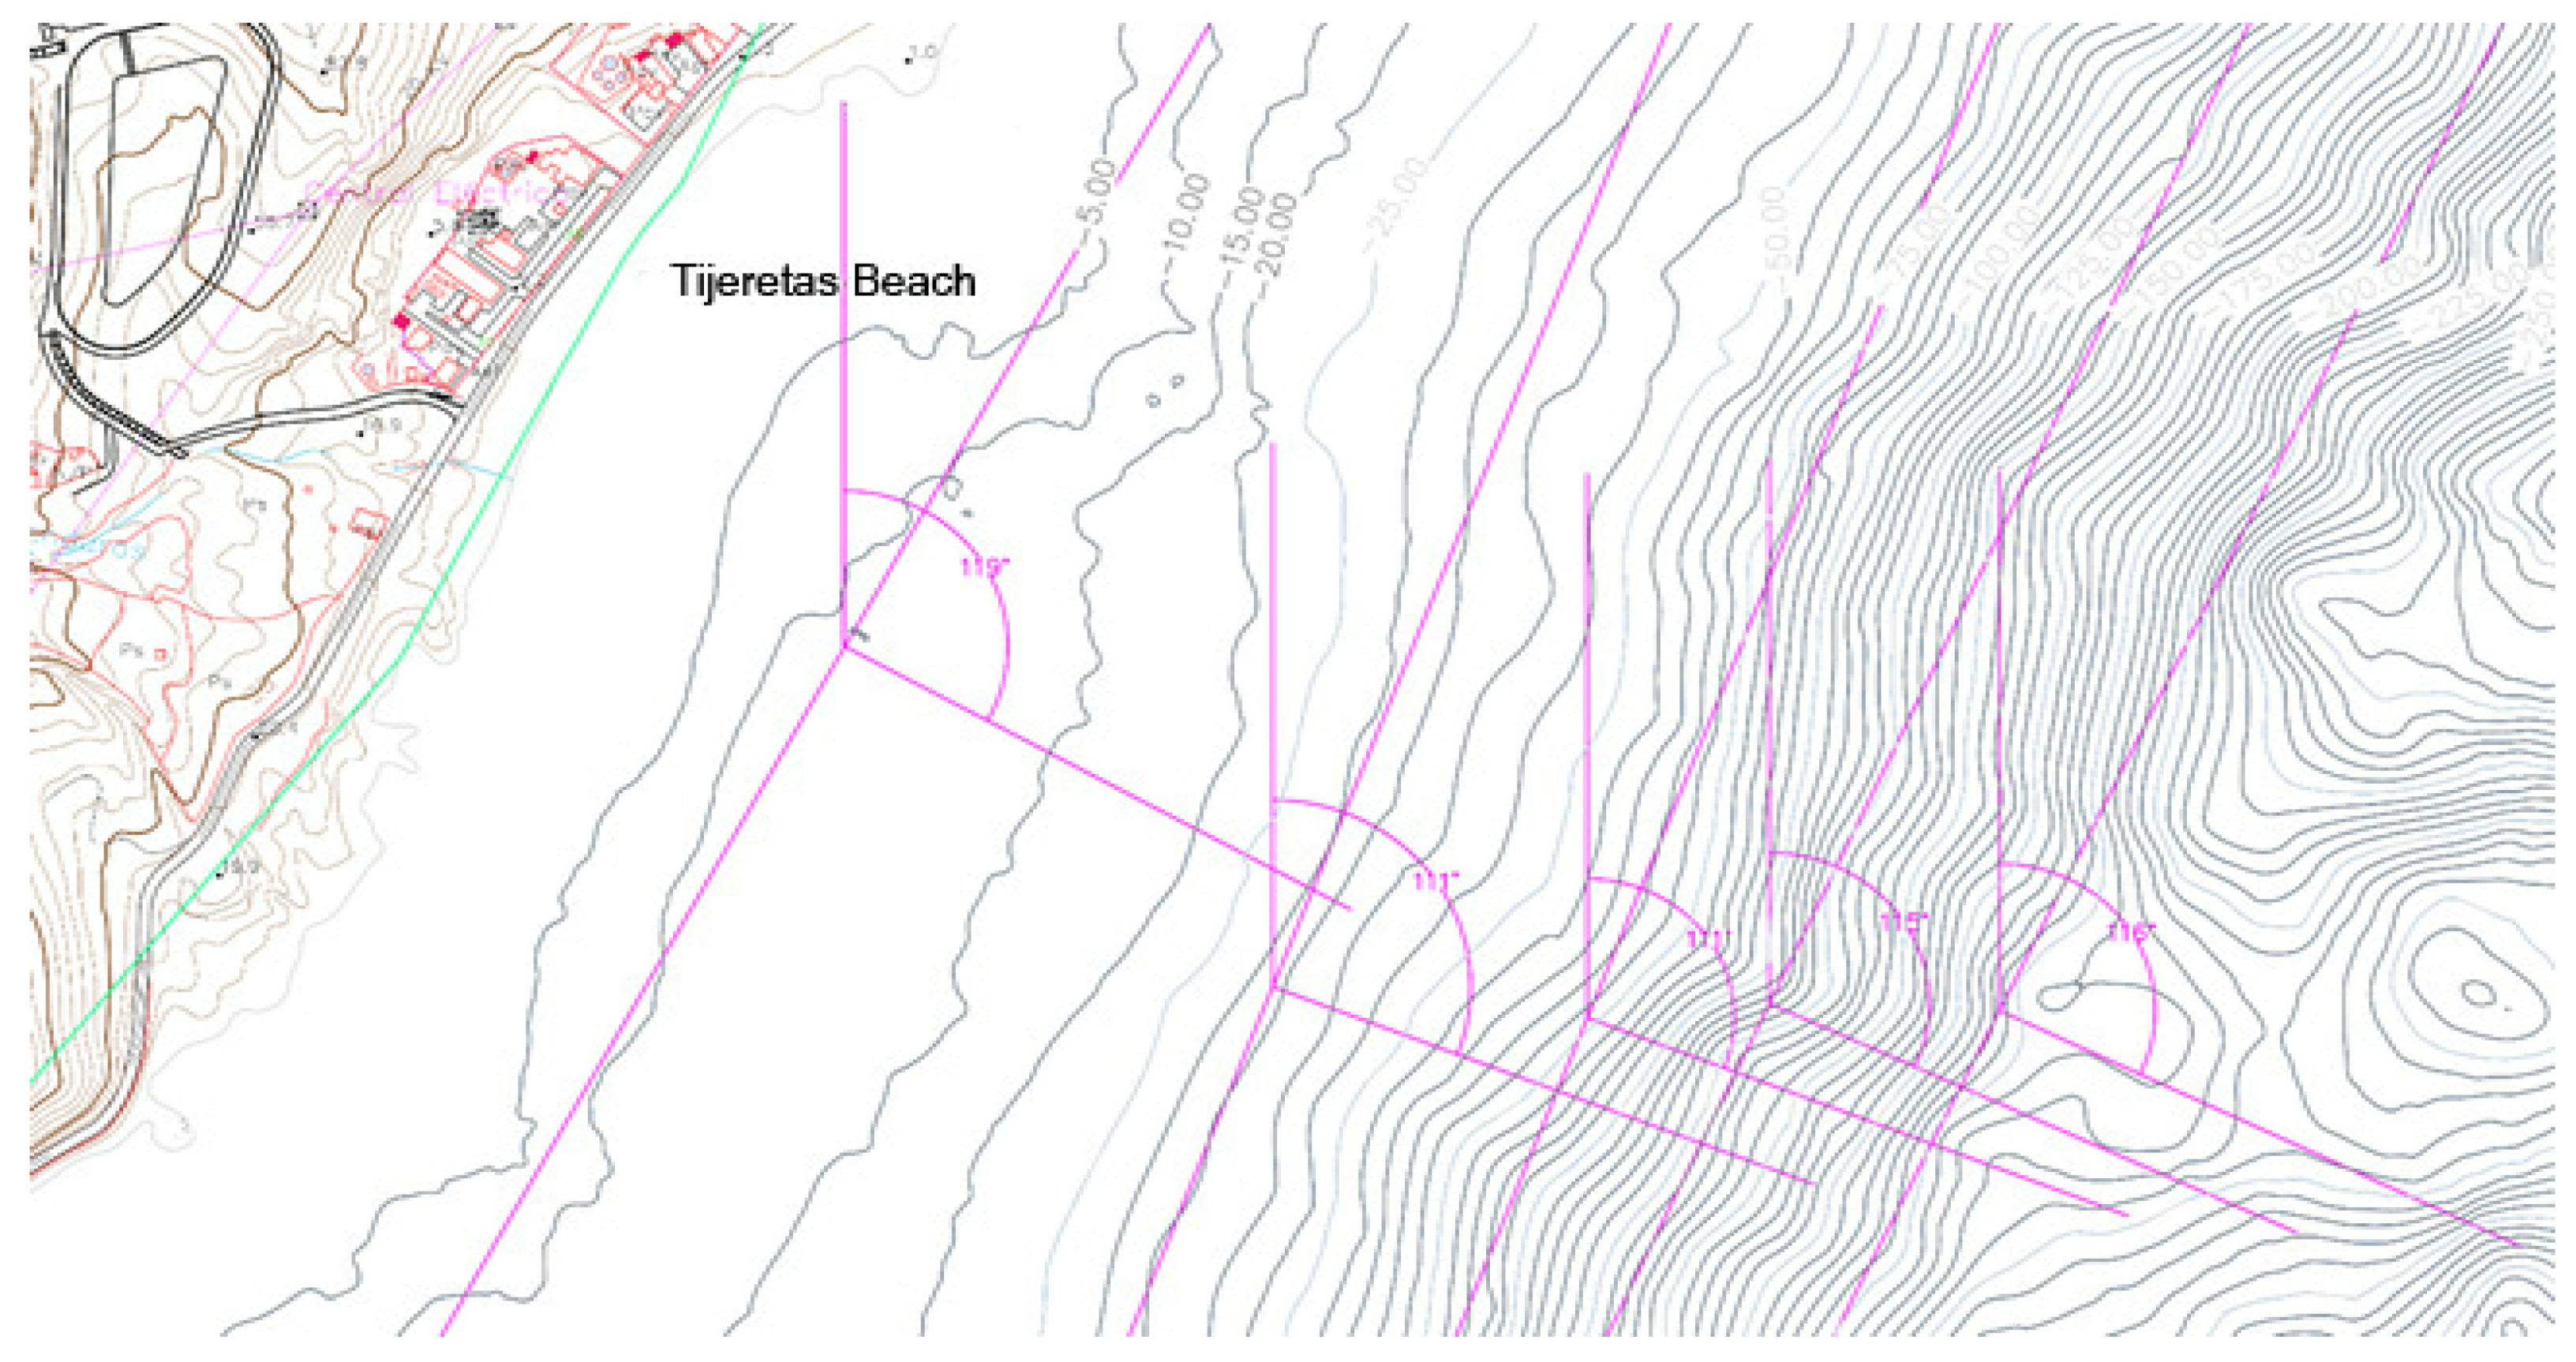
The isobath orientations corresponding to the different divisions were measured in a bathymetric plane. The result shows that the general orientation of the normal to the isobaths at the “Llanos Blancos” coast varied between 111° and 119° with respect to the N direction (
Figure 3).
To determine the characteristics of the mean wave regime that affects the structure, as mentioned previously, the propagation coefficients were used. The shoaling (
ks) and refraction (
kr) coefficients are shown in
Table 5.
The results obtained for the wave characterization at the “Llanos Blancos” coast show that the waves had a constant and sustained height and period wave over time. This result is highly favorable when it comes to siting a WEC. The significant wave height ranged from 0.2 to 5.5 m, while the peak wave period was between 3.5 and 19.5 s. The mean significant wave height was 1.41 m, and the mean peak wave period was 9.23 s. The predominant direction of the waves was clear, with the waves originating from the NNE in approximately half of the period studied.
4.3. Gross Energy Potential of the “Llanos Blancos” Coast
The main objective of this work is to propose the most appropriate location for a future WEC in the island of El Hierro. This requires calculating the annual average power of the site in question. The annual average power represents the mean of all power records calculated over the available 61-year time series.
On the island of El Hierro, the point with the greatest power is located in the northwest, as it is not protected by any other island in the archipelago. In this section, the different energy containers for each sea state were established using the proposed methodology. These results yielded an annual energy potential of 265.40 MWh/m and an annual average power of 30 kW/m. The energy potential obtained in this study demonstrates the wave resource available at the “Llanos Blancos” coast, currently untapped.
The different sea states defined in the study, as well as the energy potential of each of them, are represented graphically. On the one hand, the sea states with the highest probability of occurrence were those with a significant wave height between 1.0 and 2.0 m and a peak wave period between 6.5 and 13.5 s (
Table 6). On the other hand, the most energetic sea states, according to the study of the energy potential in a typical year on the “Llanos Blancos” coast, were those with a significant wave height between 1.5 and 2.5 m and a peak wave period between 7.5 and 14.5 s (
Table 7).
5. Conclusions
Wave energy provides an opportunity to guarantee a safe and sustainable electricity supply in islands, coastal communities, and isolated systems on the high seas, using the oceans as a great potential energy resource to supply electricity demand.
This paper presents a study of the energy potential in the coastal area of El Hierro for the future operation of a multidirectional OWC wave collector. Firstly, the territorial, geotechnical, and economic conditions of a possible wave plant installation in the island were studied in order to define the best location to install a WEC. Secondly, the average wave regime and the wave propagation coefficients in the mean regime in the coastal area were determined in order to characterize the waves at the selected area. Thirdly, a non-directional study of the gross energy potential at a selected point was conducted in order to obtain the wave energy that would be made available to an OWC wave energy converter for conversion into pneumatic energy, so that the choice of location can be justified.
The best location to install an OWC wave power plant according to this study is the “Llanos Blancos” coast, where the old diesel power plant and the lower reservoir of the hydroelectric complex are located. The main reason for this choice is the greater ease and lower economic cost of the electricity connection between a future installation and the island’s grid.
Specifically, the exact location studied in this work is located on the isobath z = −10 m, off the coast from the “Llanos Blancos” Power Plant, at the point with UTM coordinates x = 213,647.73, y = 3,075,773.37 in the 28 N zone. The selected location is on the limit of administrative zone II of “Puerto de la Estaca”. The length of the power line that would connect a future wave plant with the power plant substation is 311.09 m.
The wave characterization results obtained for the “Llanos Blancos” coast have shown that the waves have a constant and sustained height and period over time. This result is highly favorable when it comes to siting a WEC. The mean significant wave height was found to be 1.41 m and the mean peak wave period was 9.23 s. The predominant direction of the waves is clear, with the waves originating from the NNE in approximately half of the period studied.
The energy potential per year was found to be around 265.40 MWh/m, and the annual average power was 30.30 kW/m. The sea states with the highest probability of occurrence are those with a significant wave height between 1.0 and 2.0 m and a peak wave period between 7.5 and 12.5 s. Moreover, the most energetic sea states are those with a significant wave height between 1.5 and 2.5 m and a peak wave period between 7.5 and 14.5 s. These results demonstrate that the wave resource available on the “Llanos Blancos” coast is suitable for the operation of a WEC.
These results are expected to be useful in designing and installing a future multidirectional OWC energy plant that can contribute to the supply of energy needed to operate the desalination plants in El Hierro.


