
Effect of Temperature on the Electrical and Thermal Behaviour of a Photovoltaic/Thermal System Cooled Using SiC Nanofluid: An Experimental and Comparison Study

 ,
, 
 and
and 
Abstract
:1. Introduction
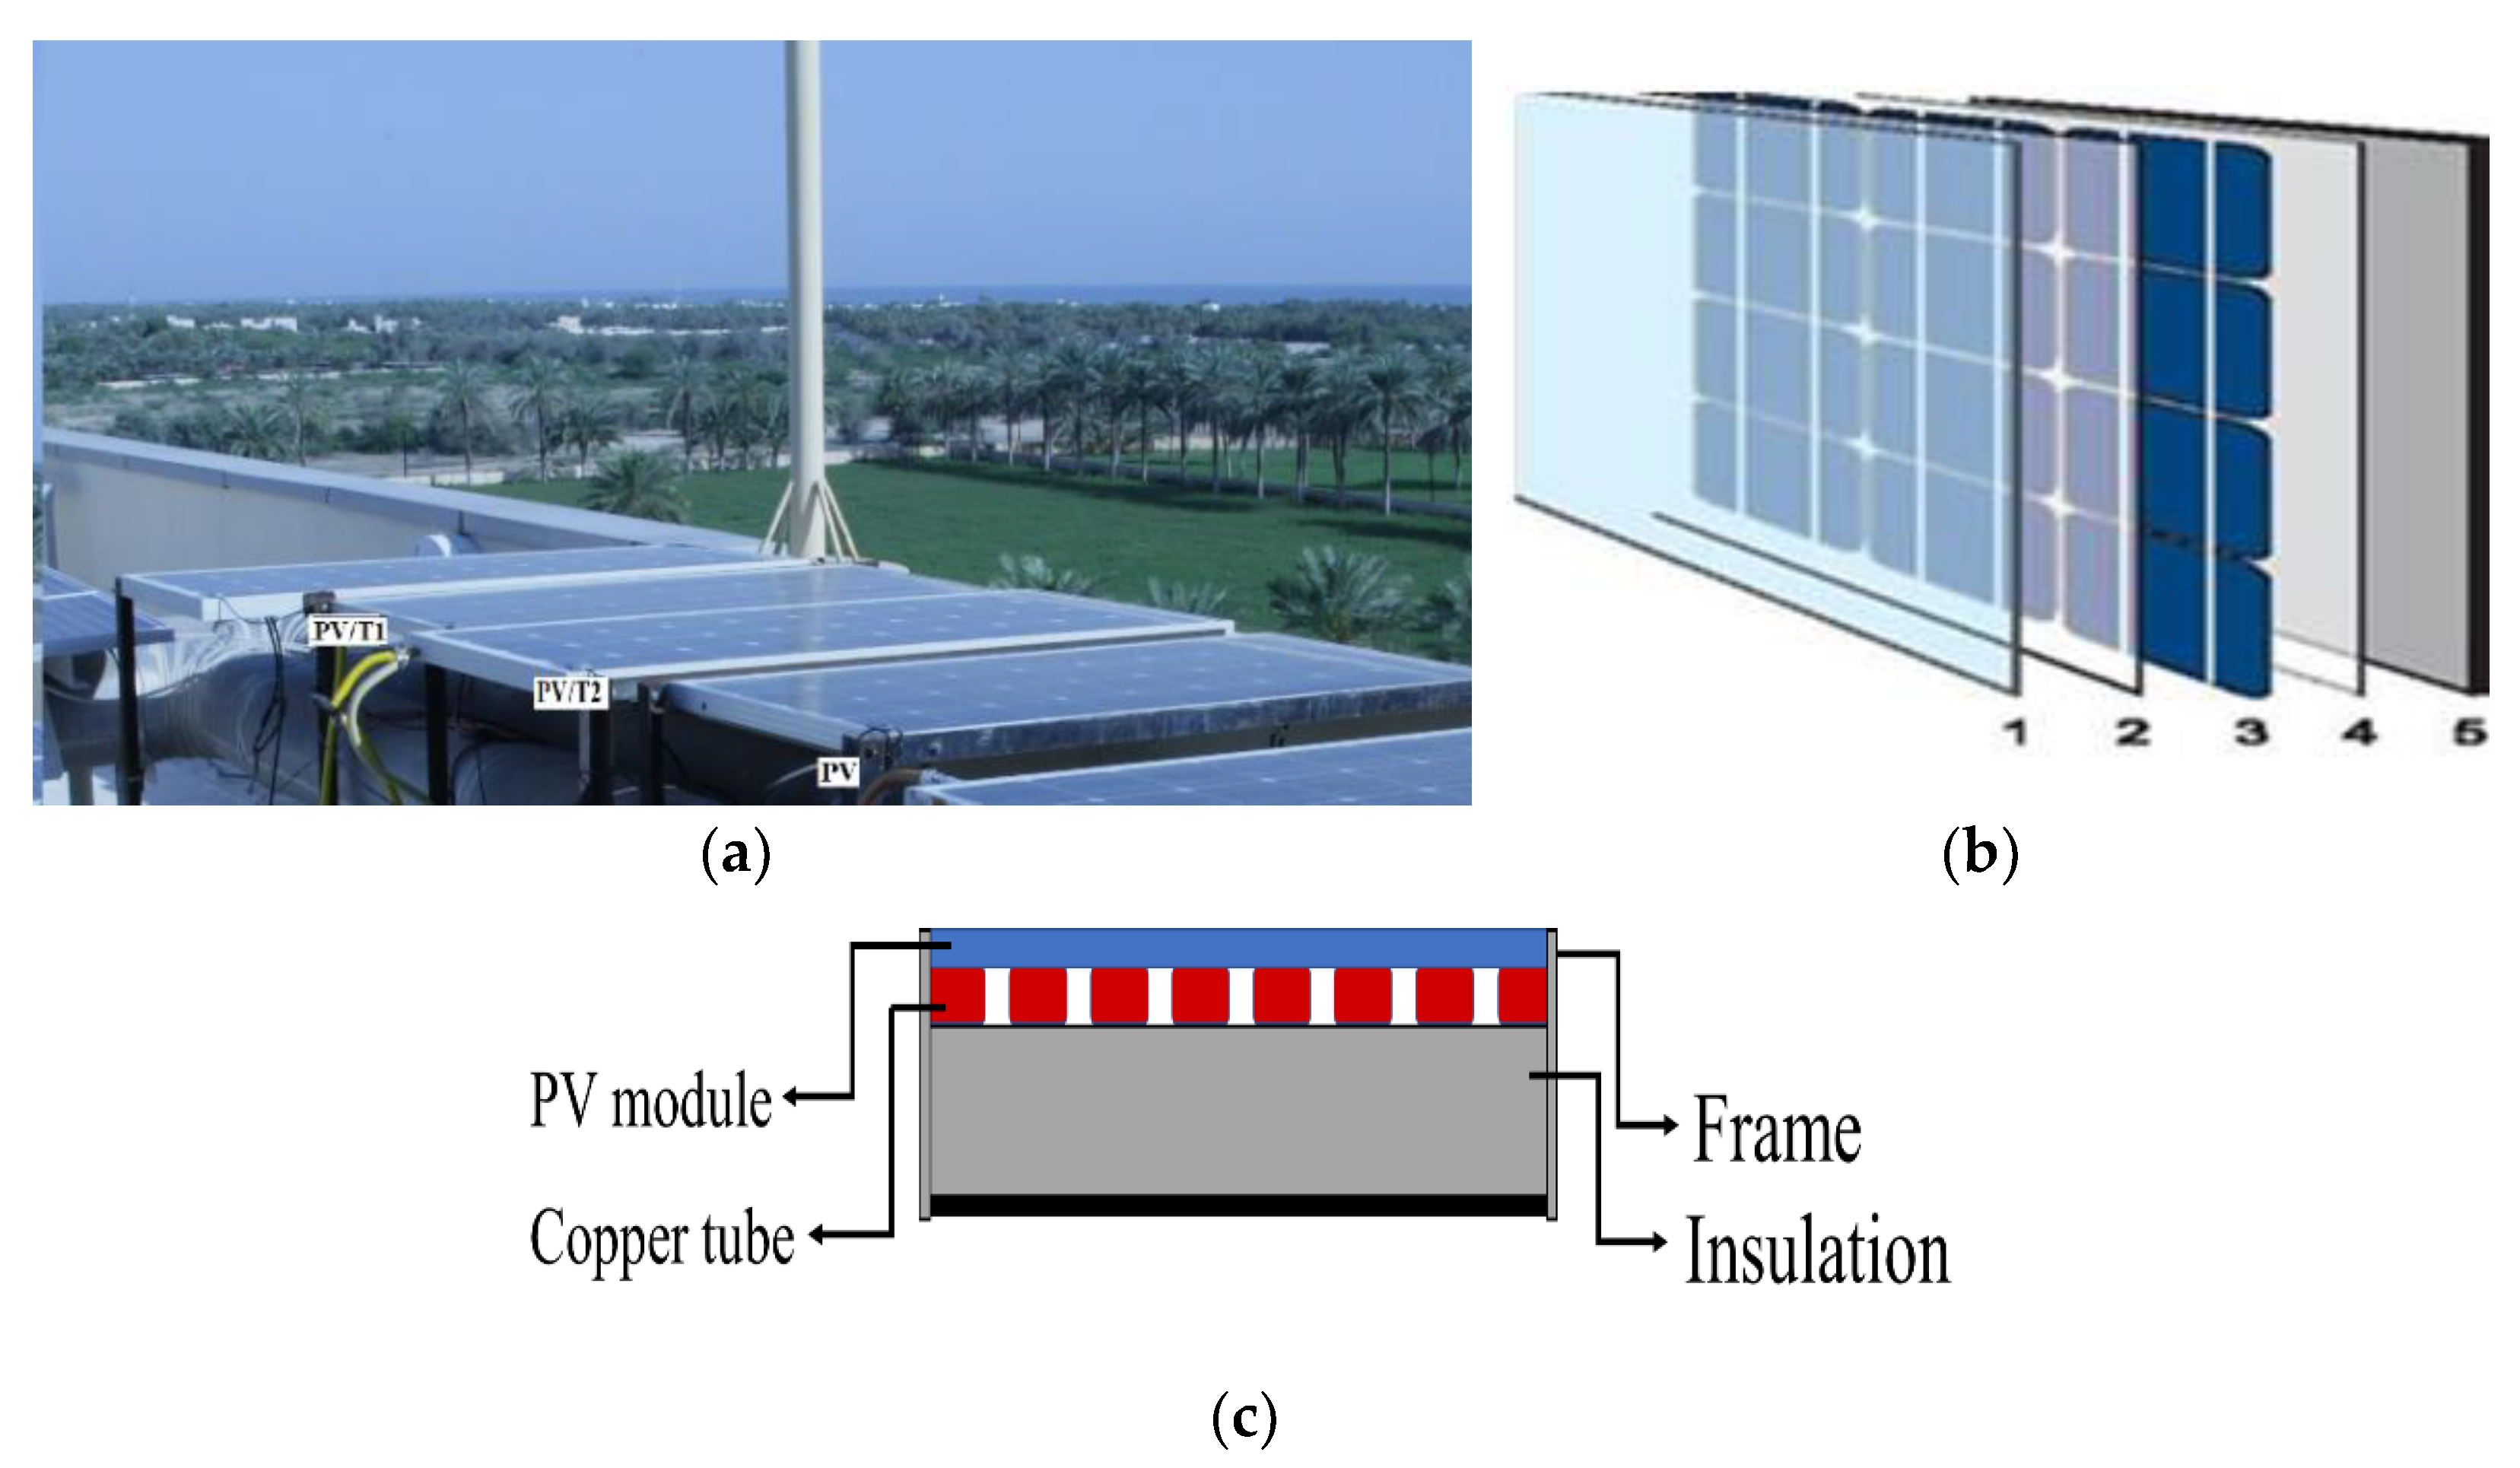
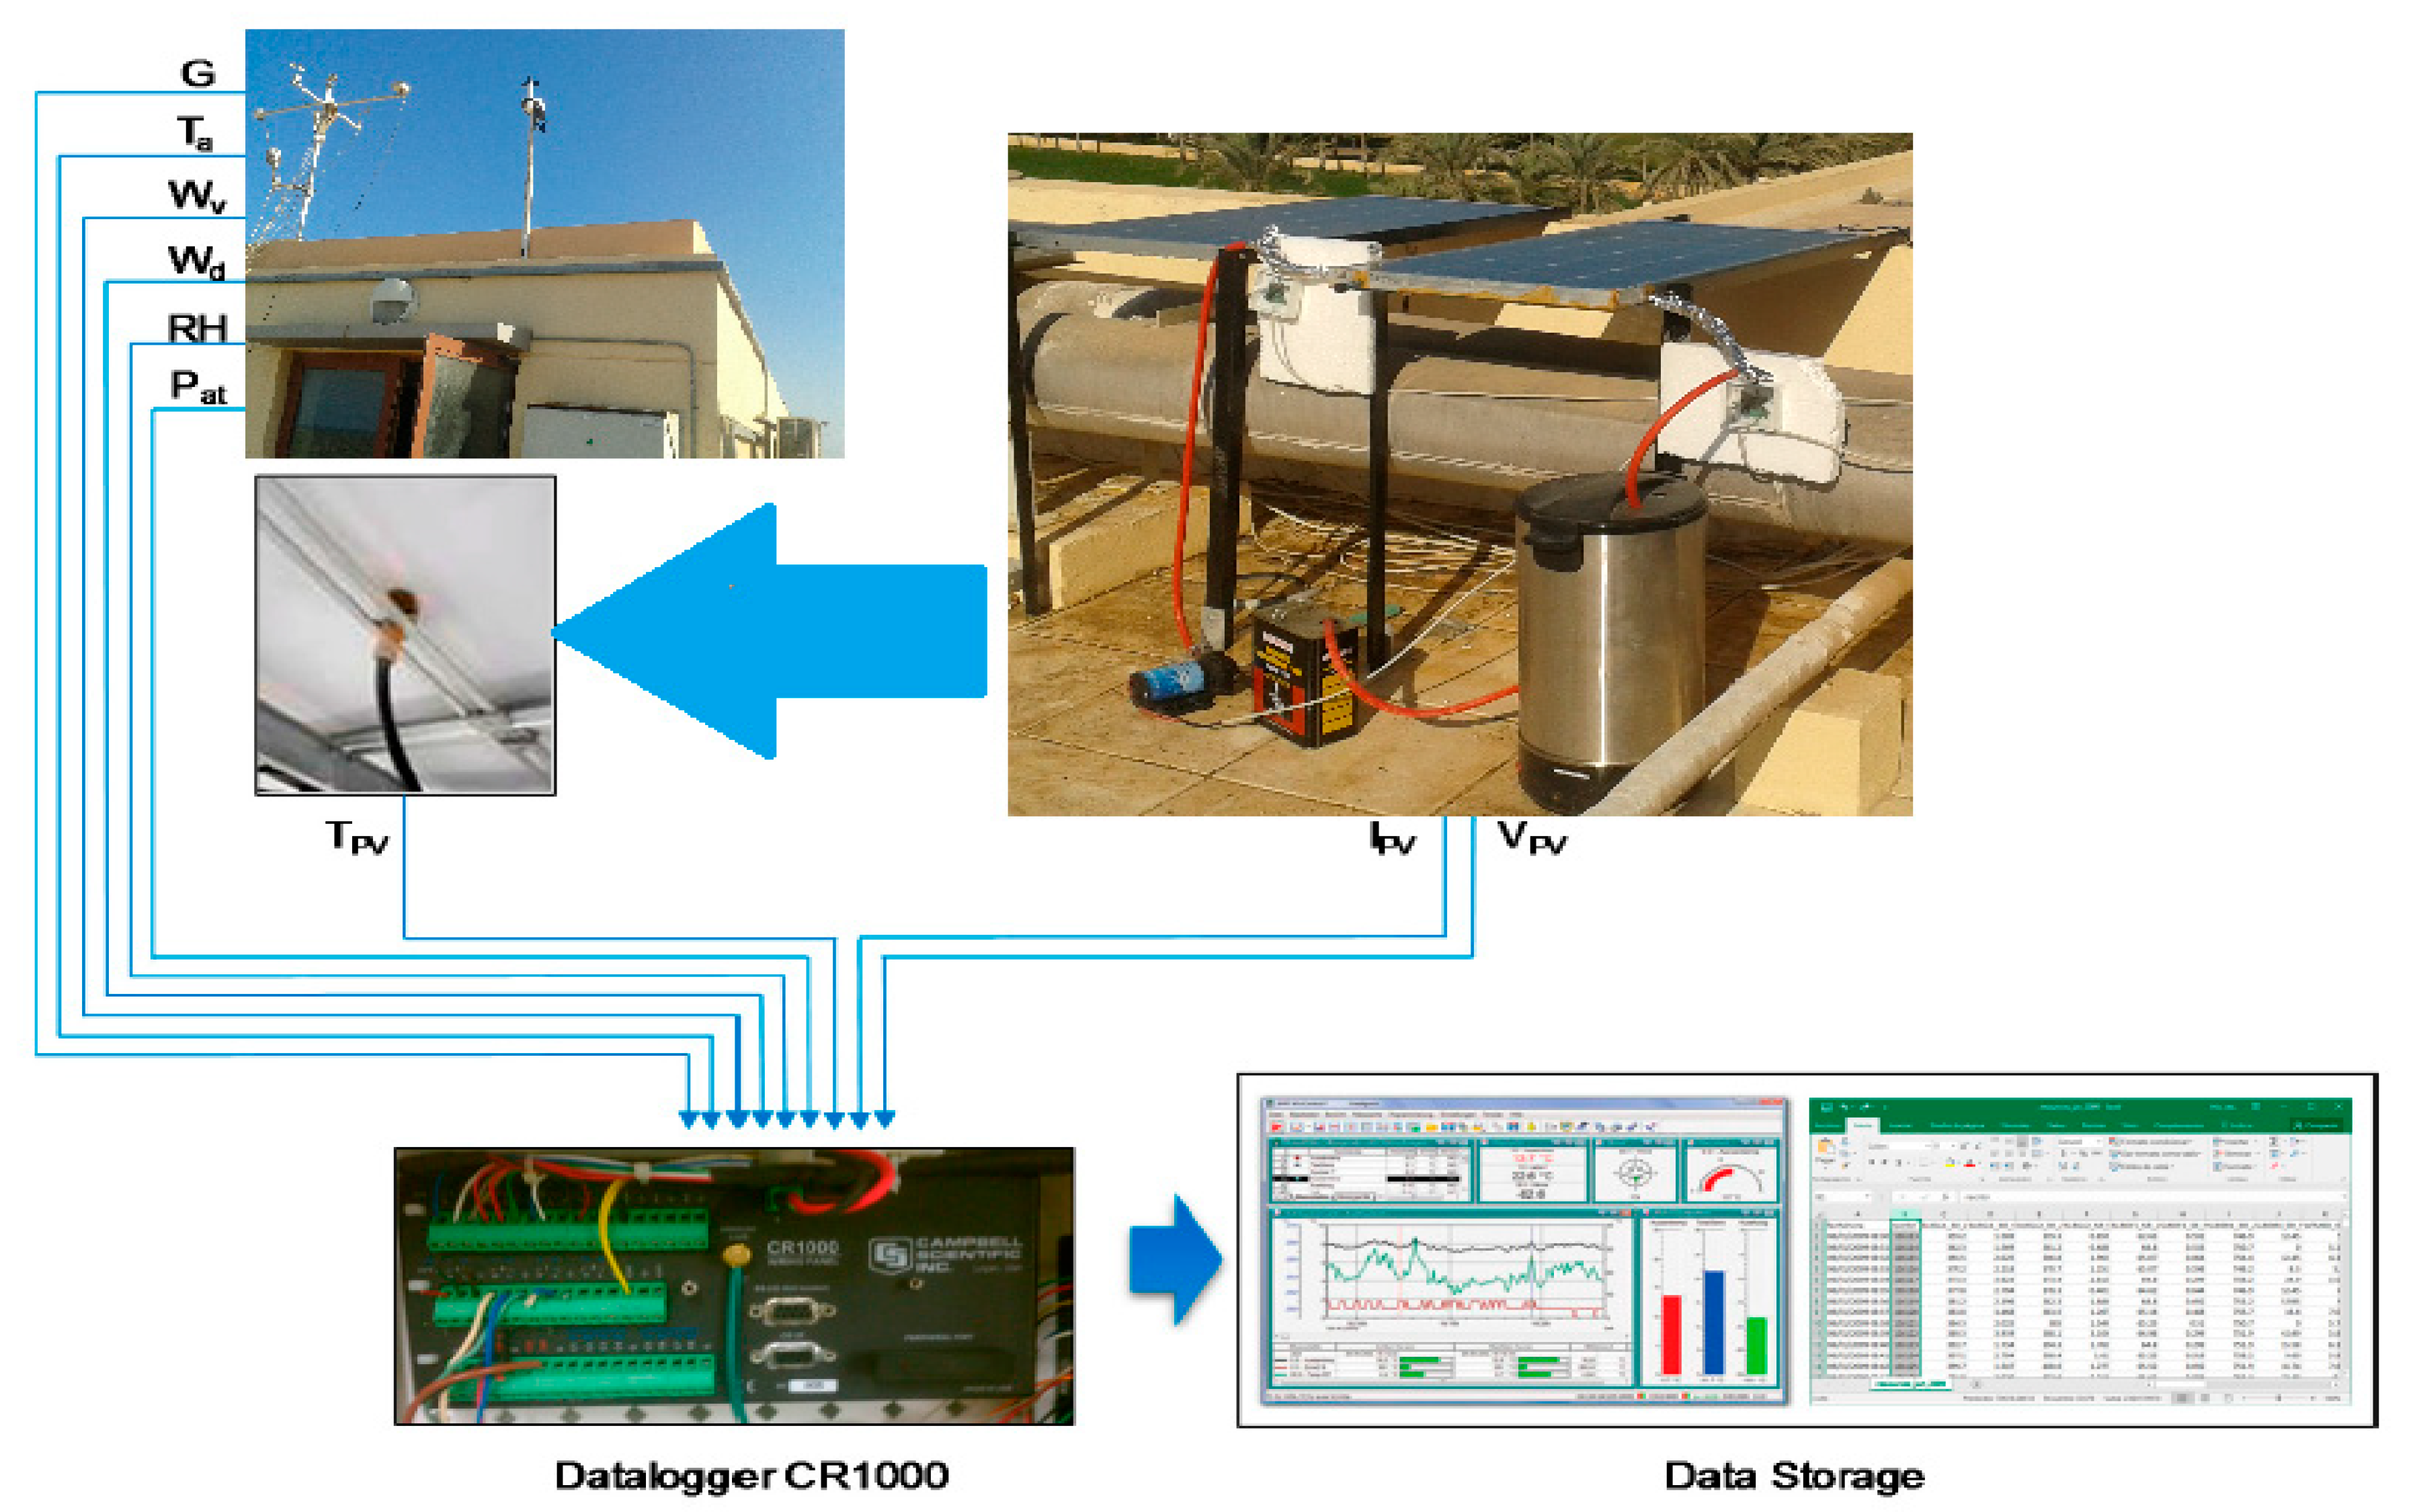
2. Experimental Setup
2.1. Sohar Metrological Data
2.2. Materials
2.3. The PV/T System Employed in the Tests
2.4. Performance Evaluation Parameters and Uncertainty
3. Results and Discussion
3.1. Thermophysical Properties
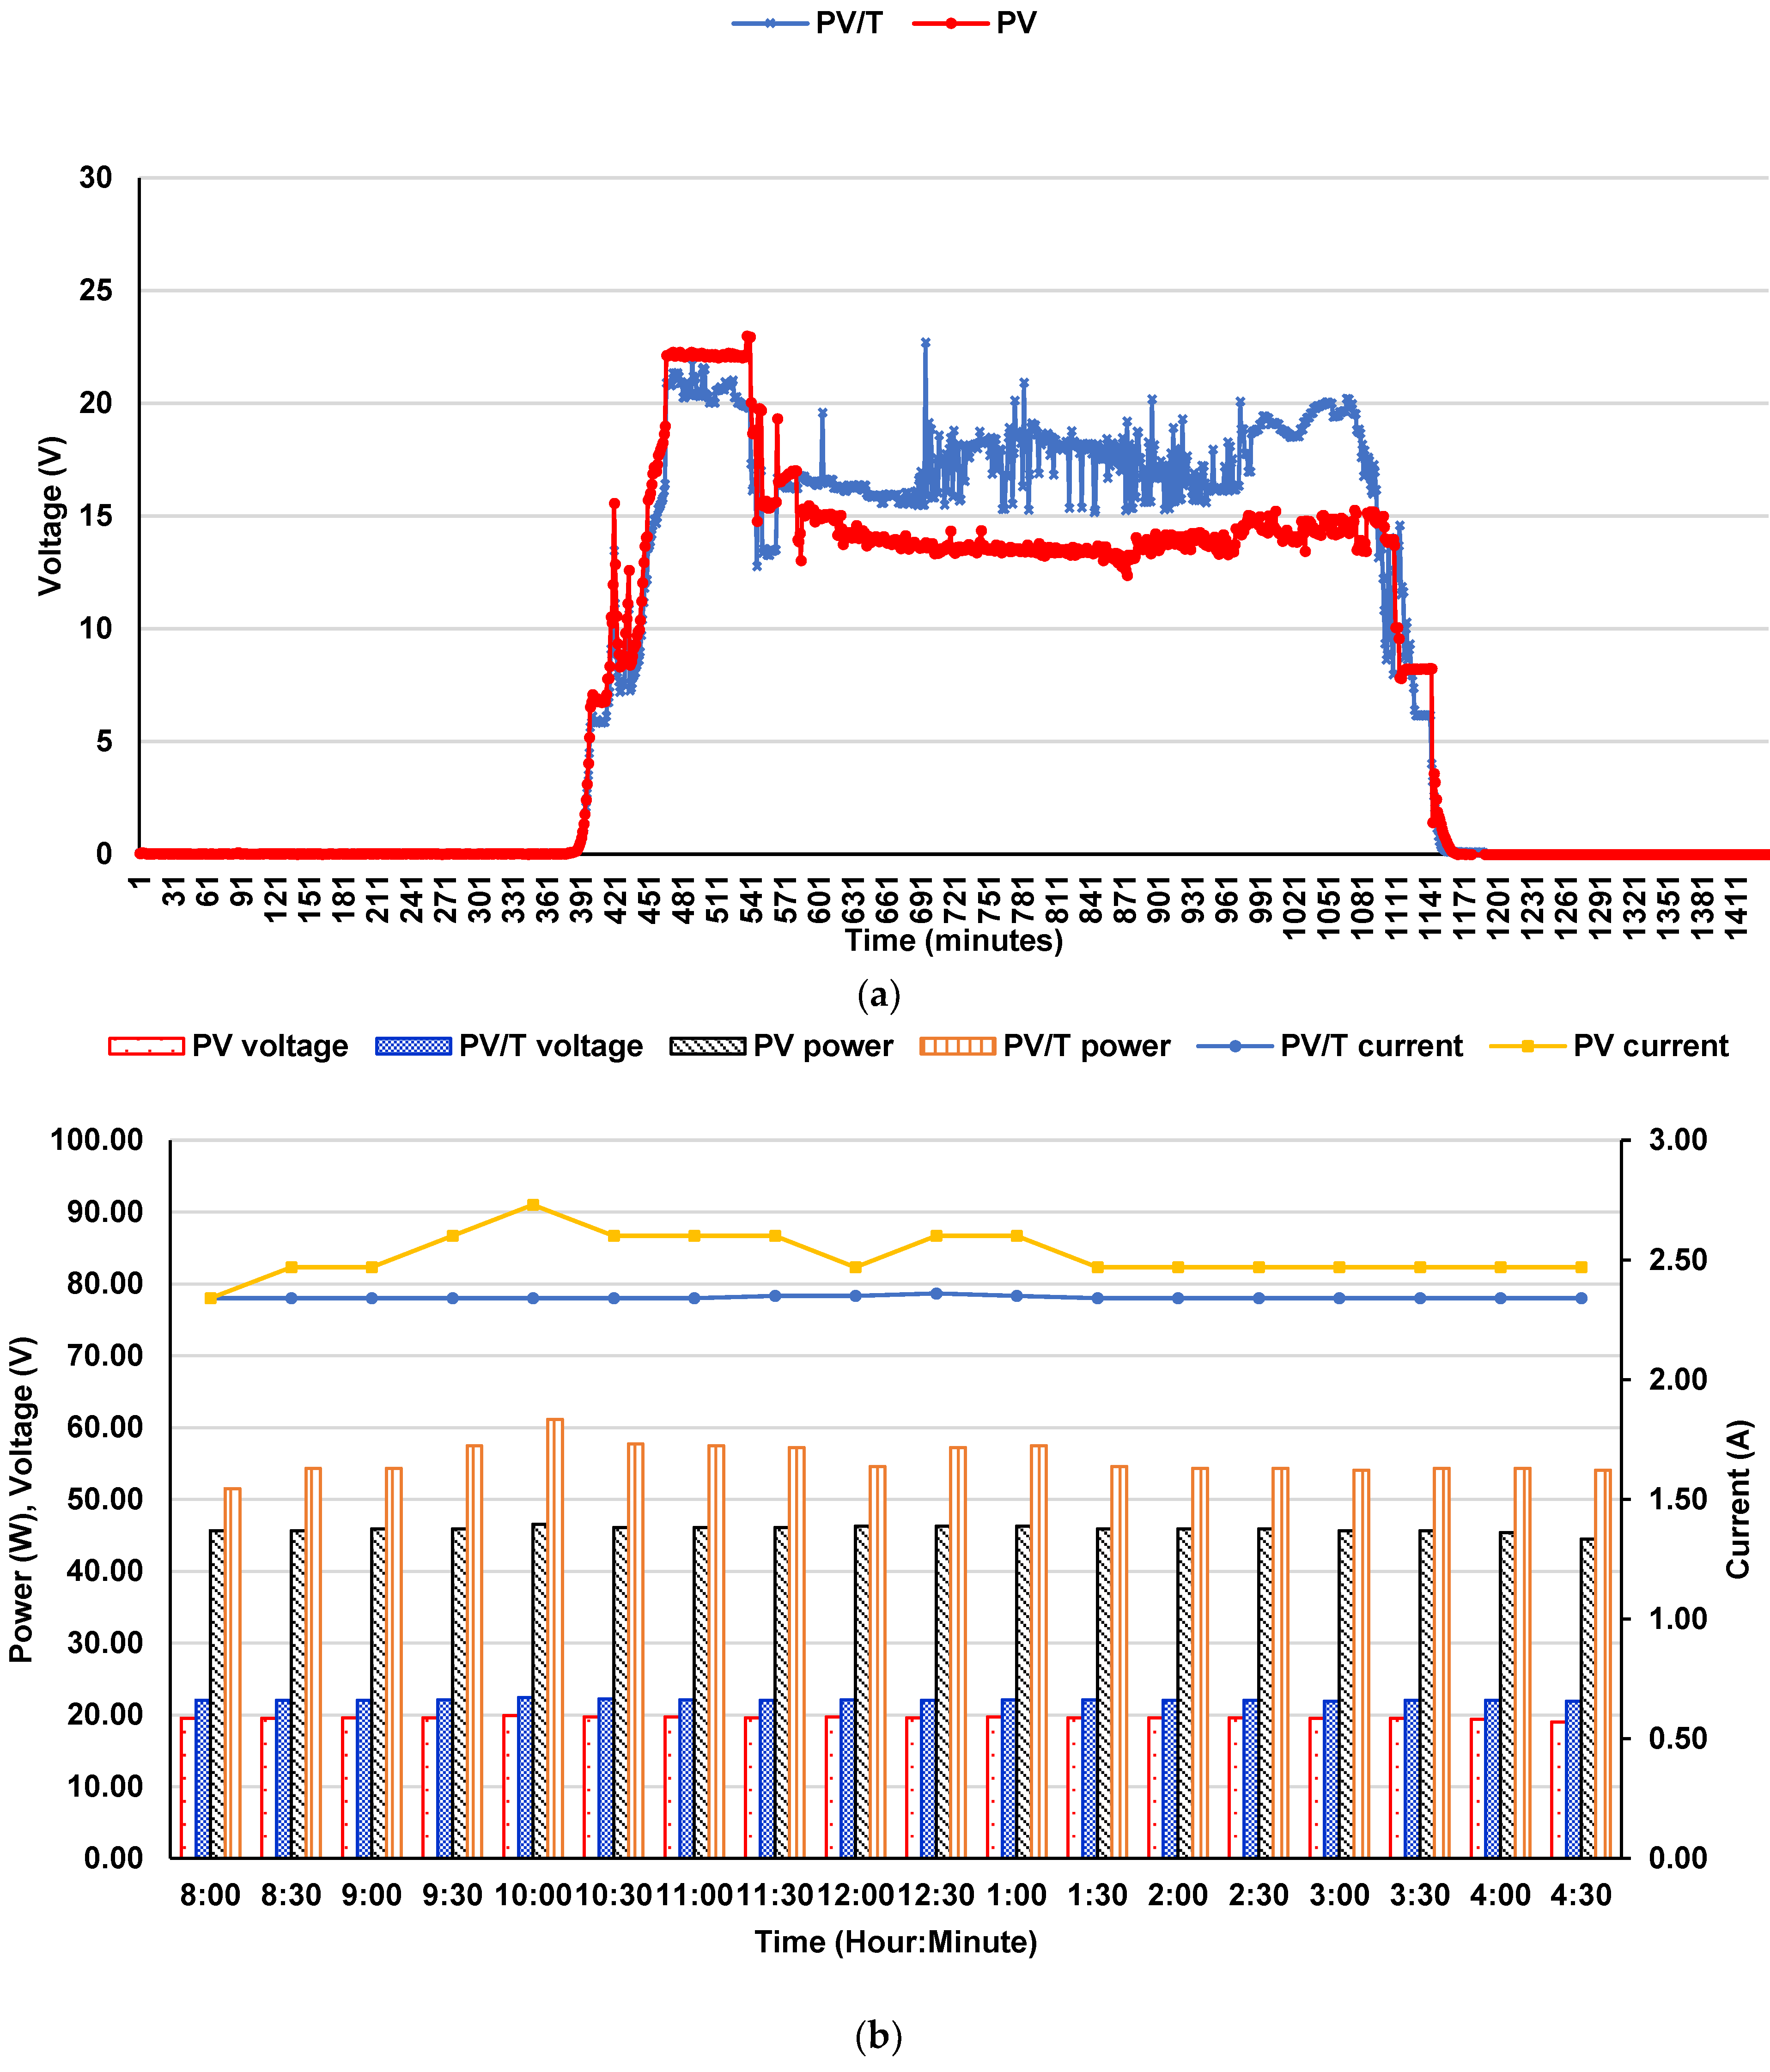
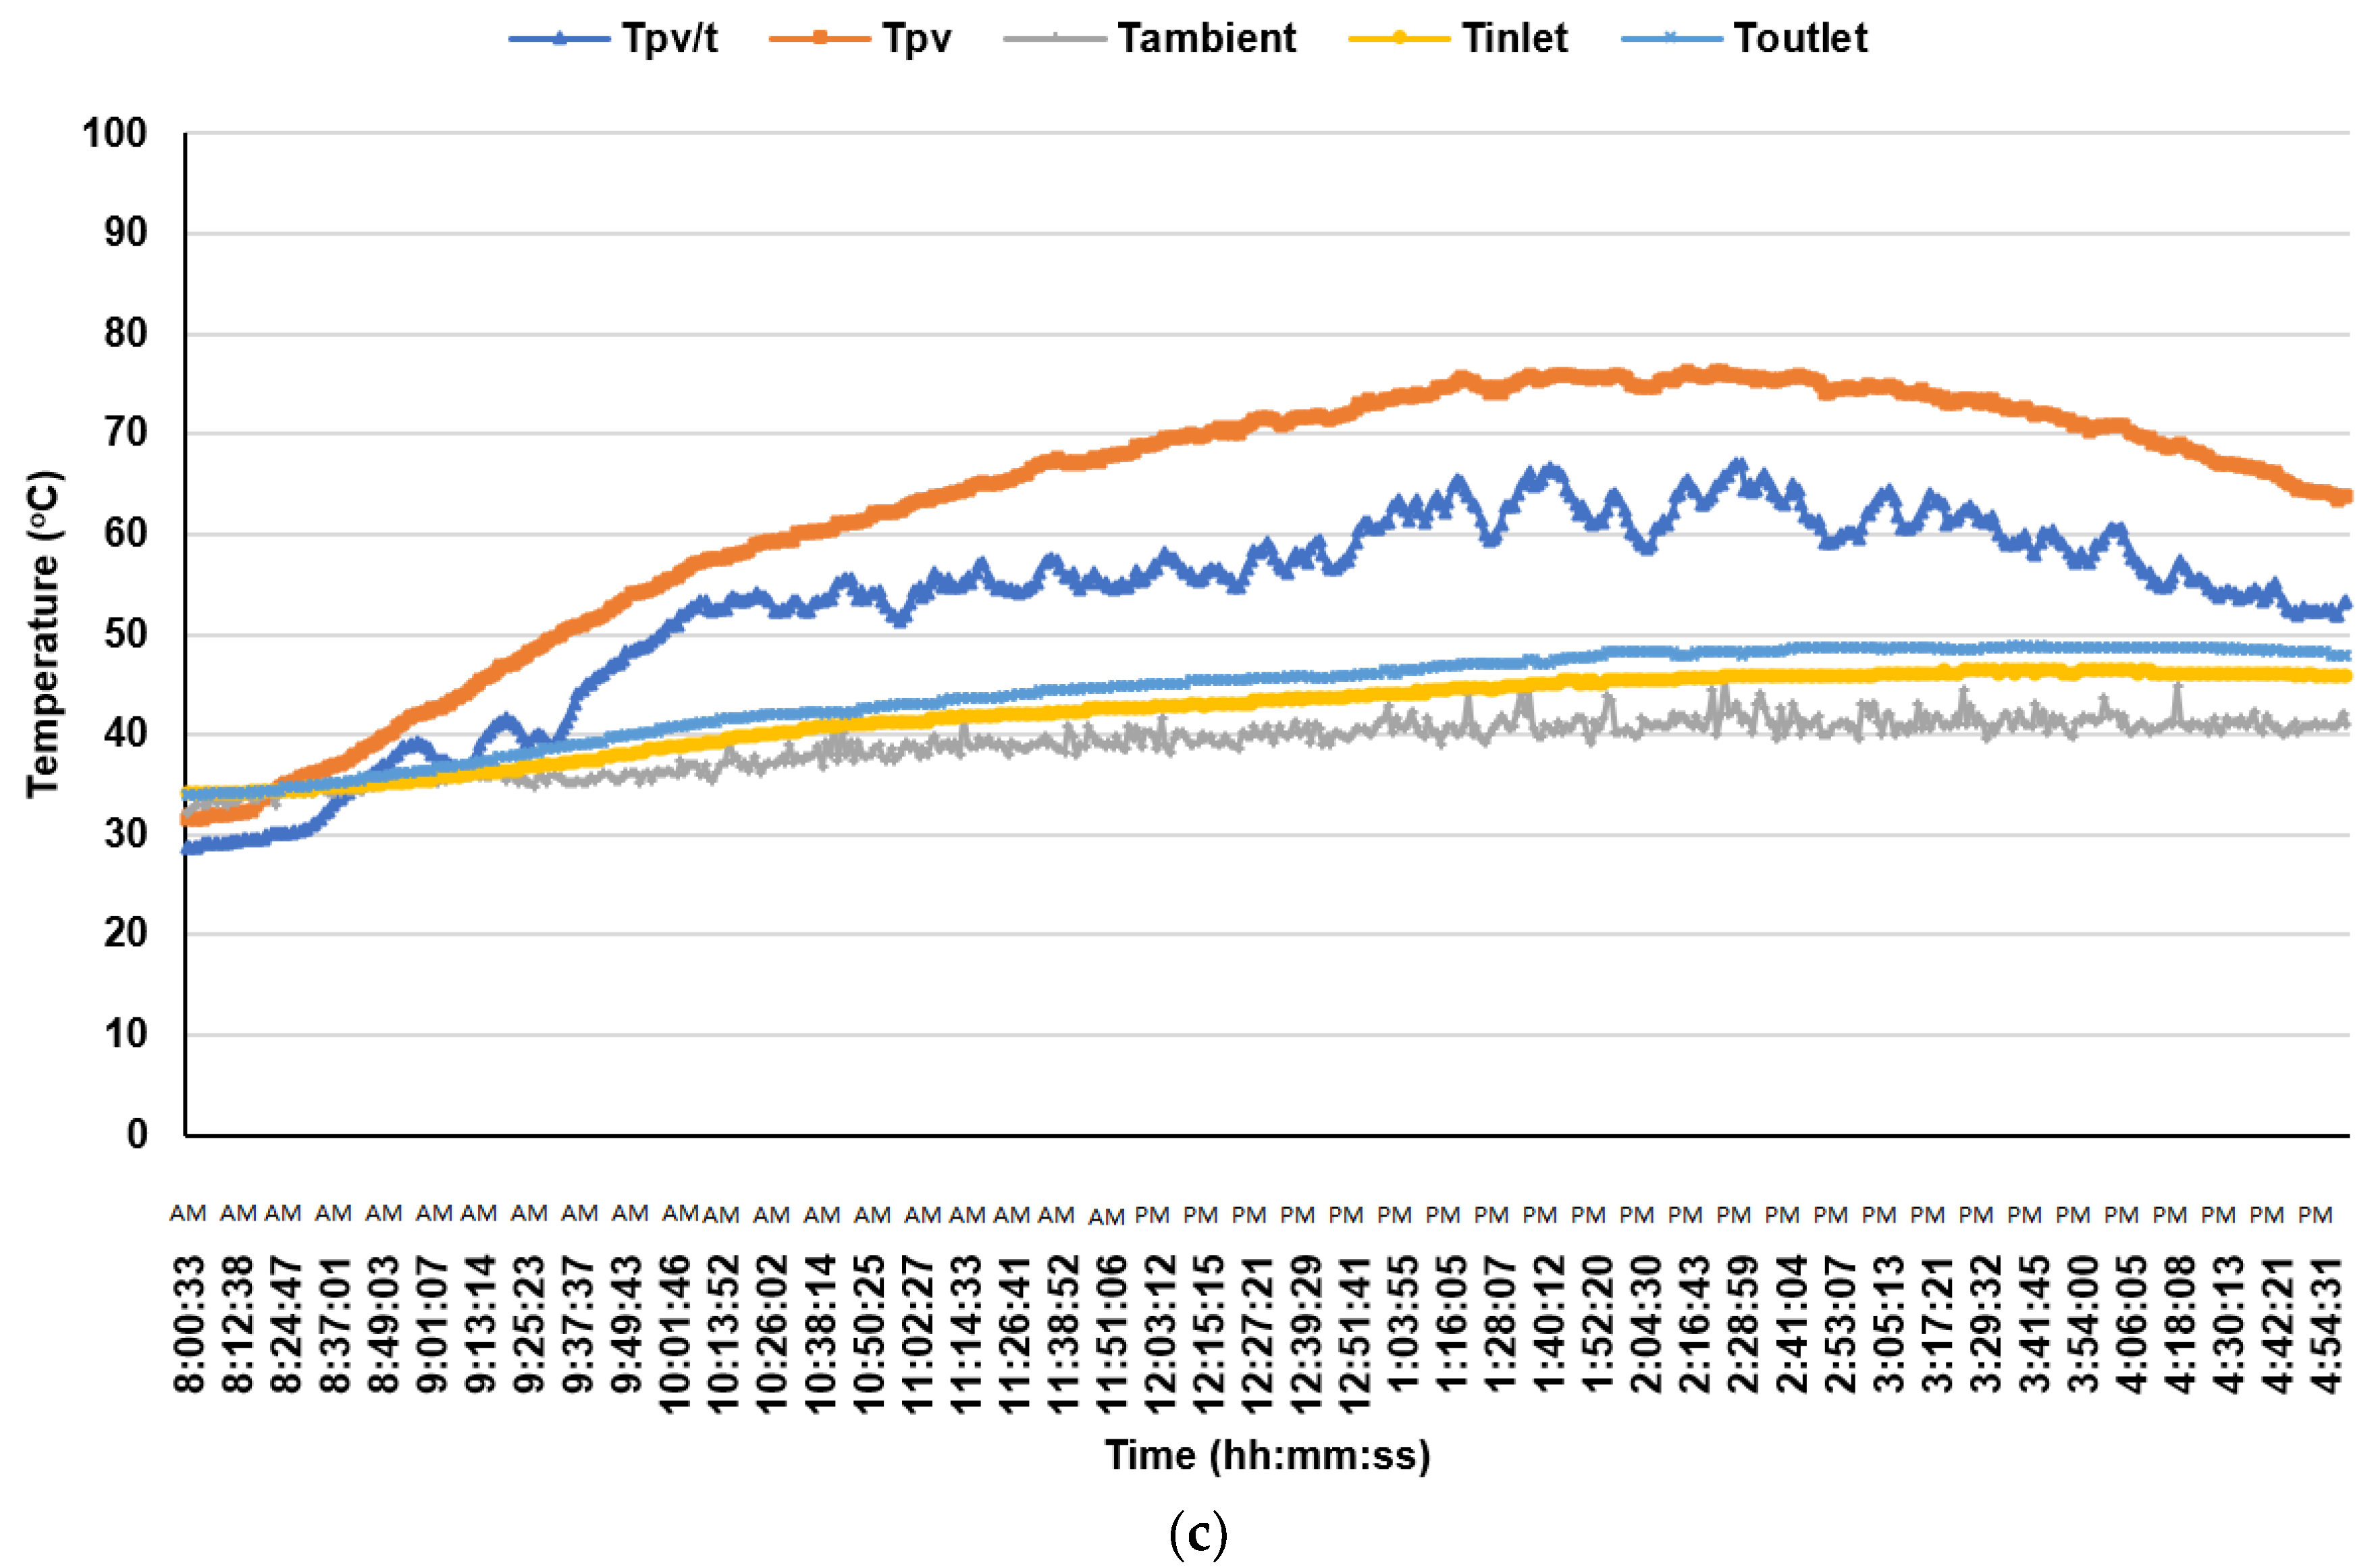
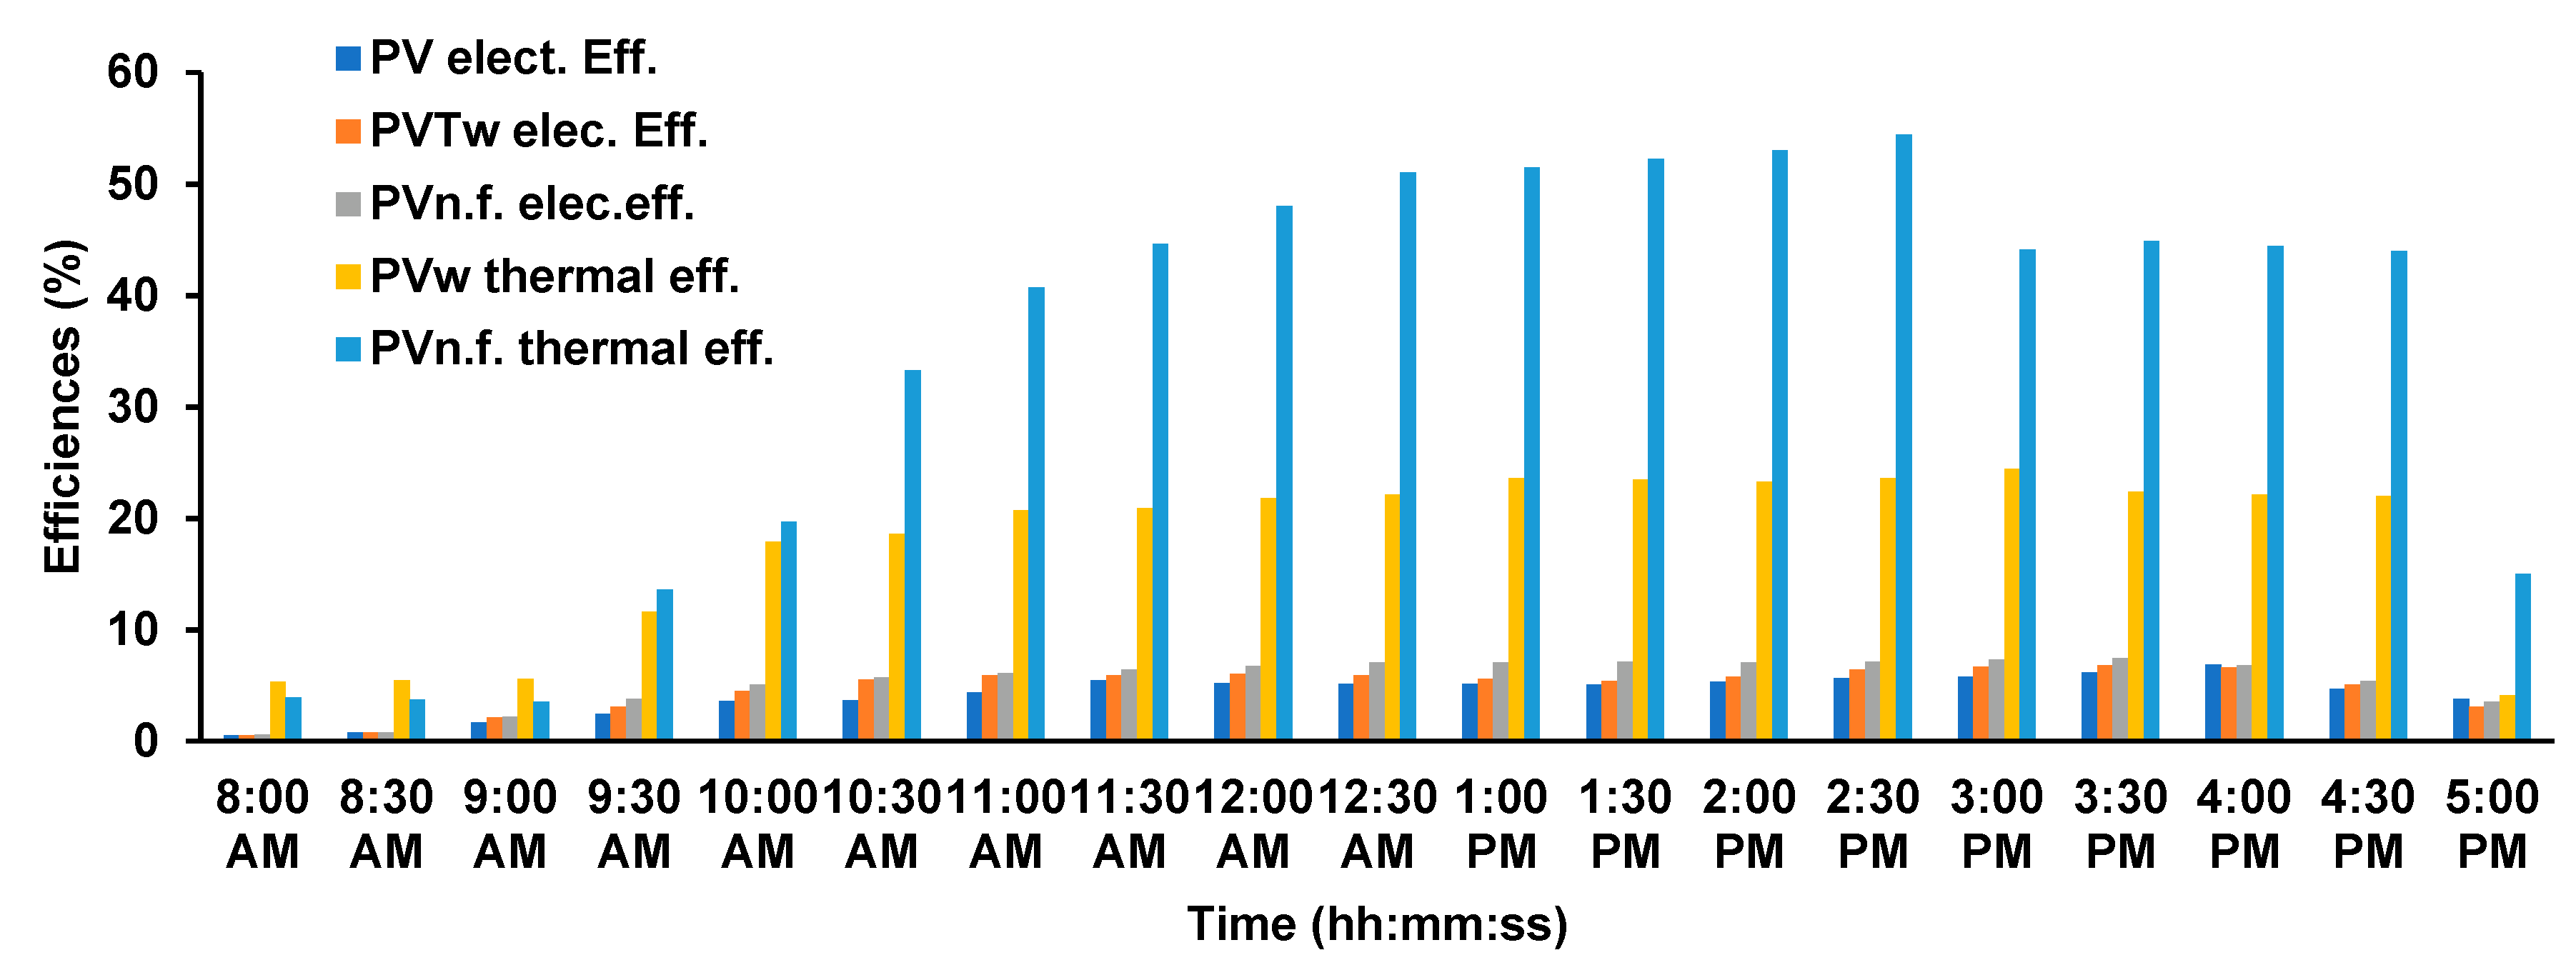
3.2. Experimental Results
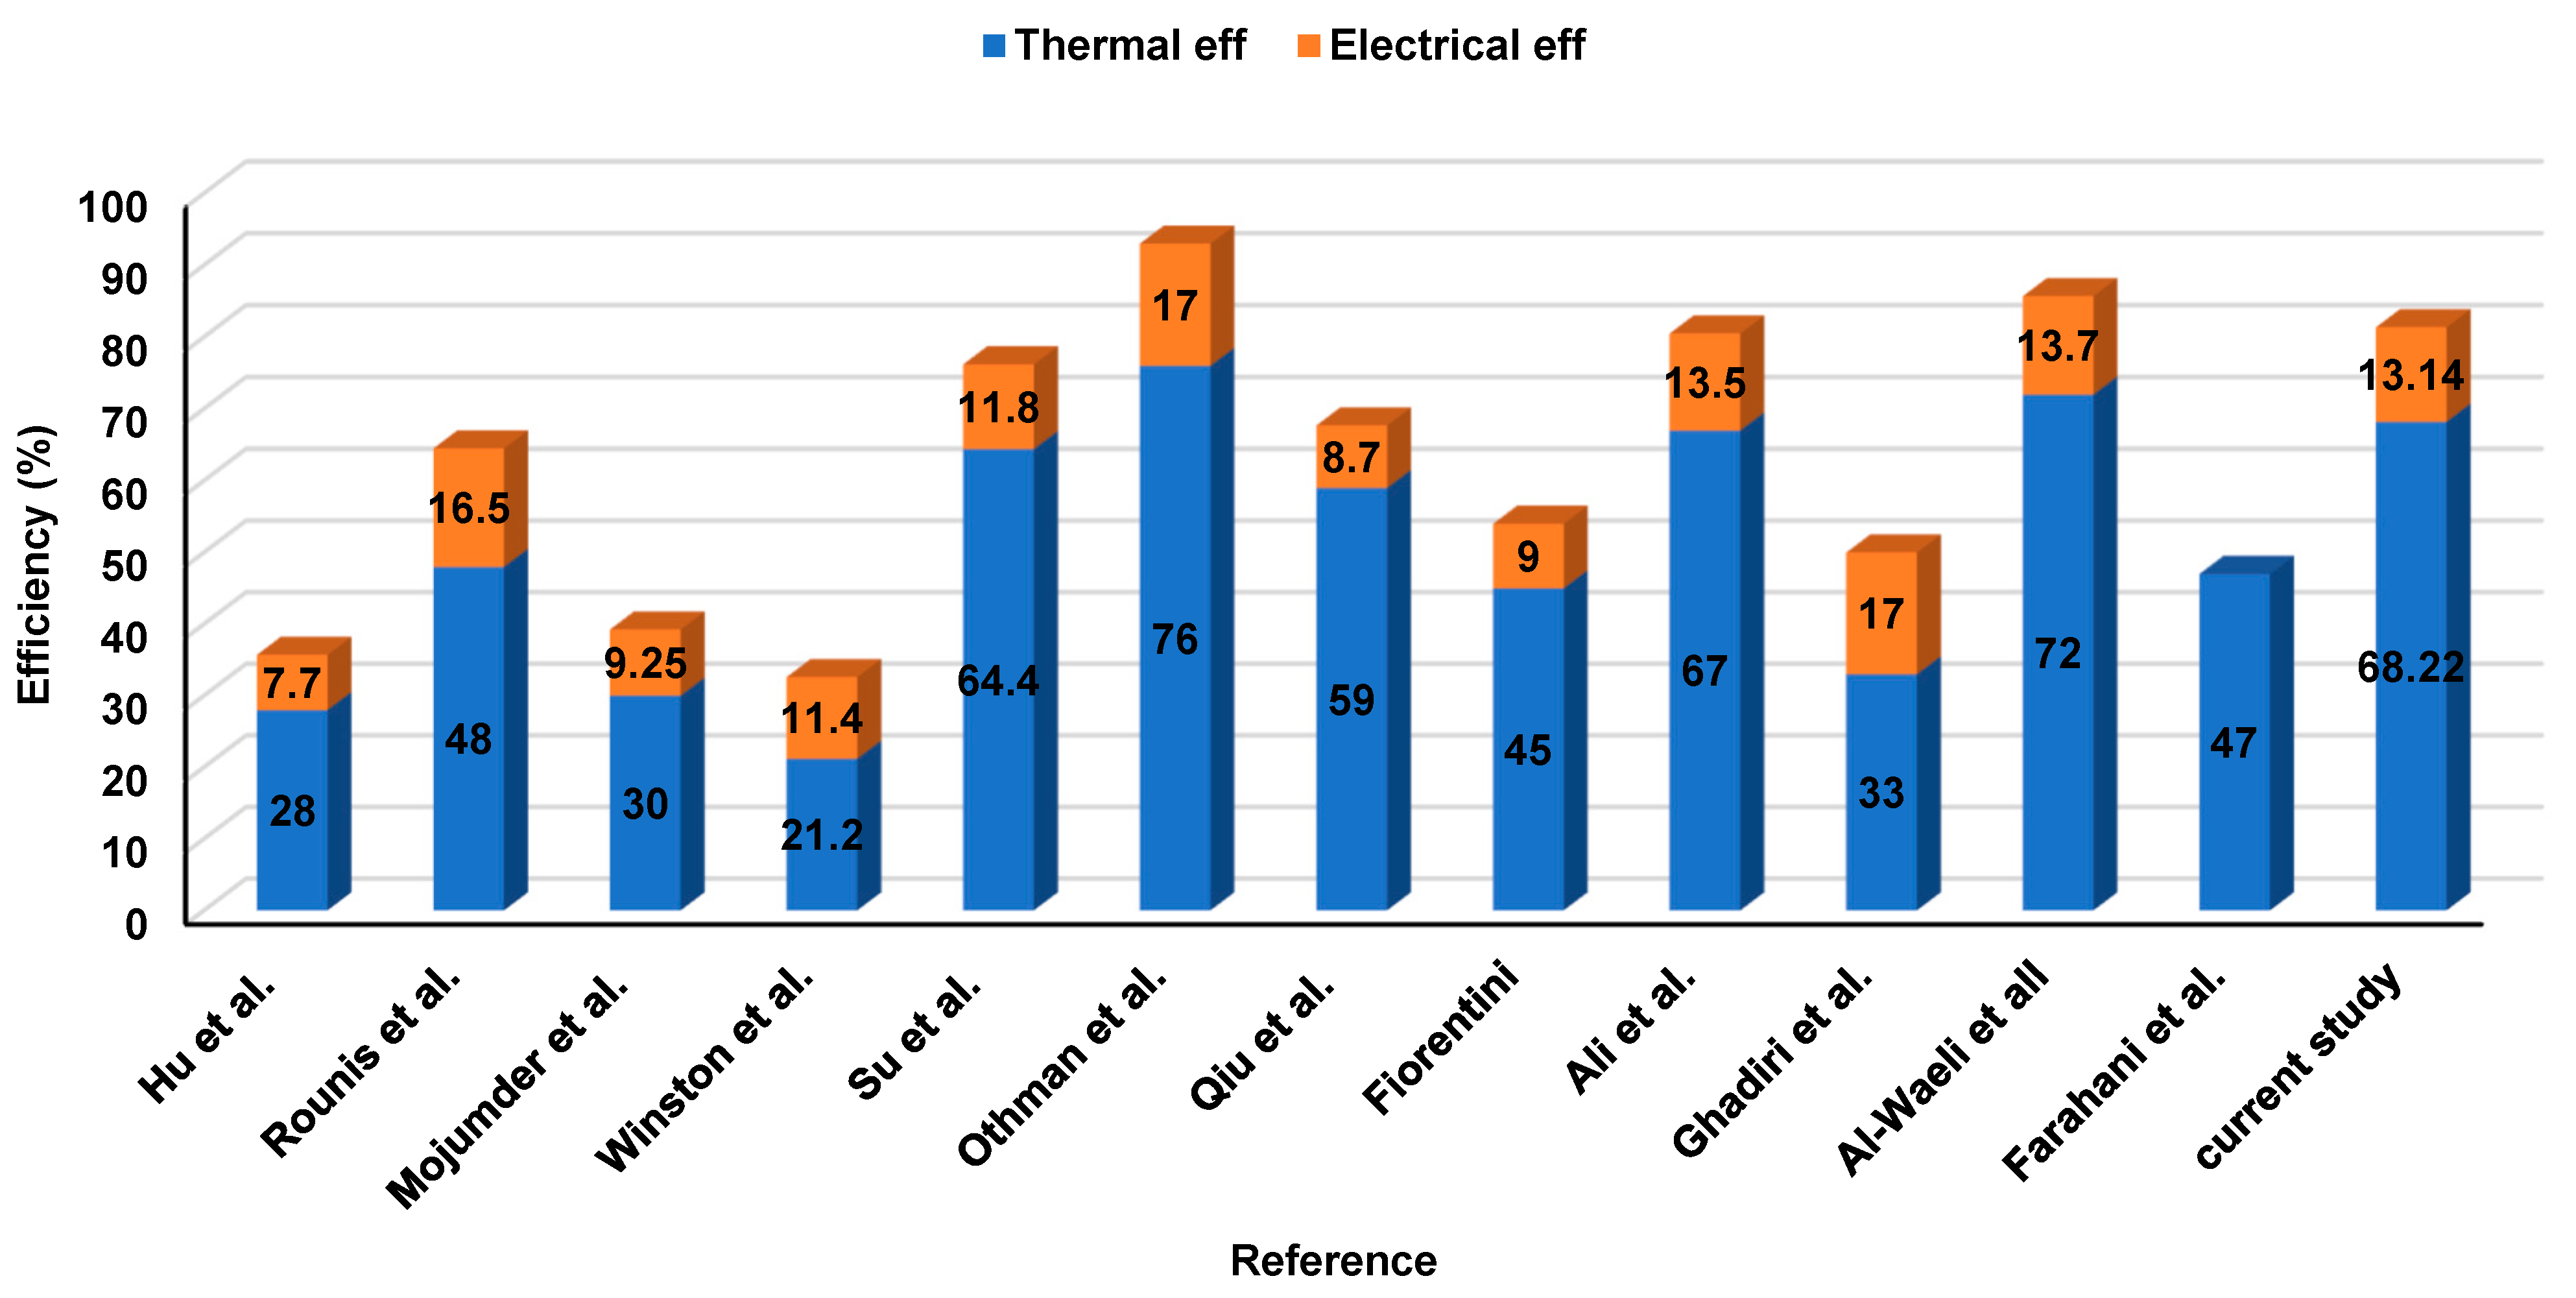
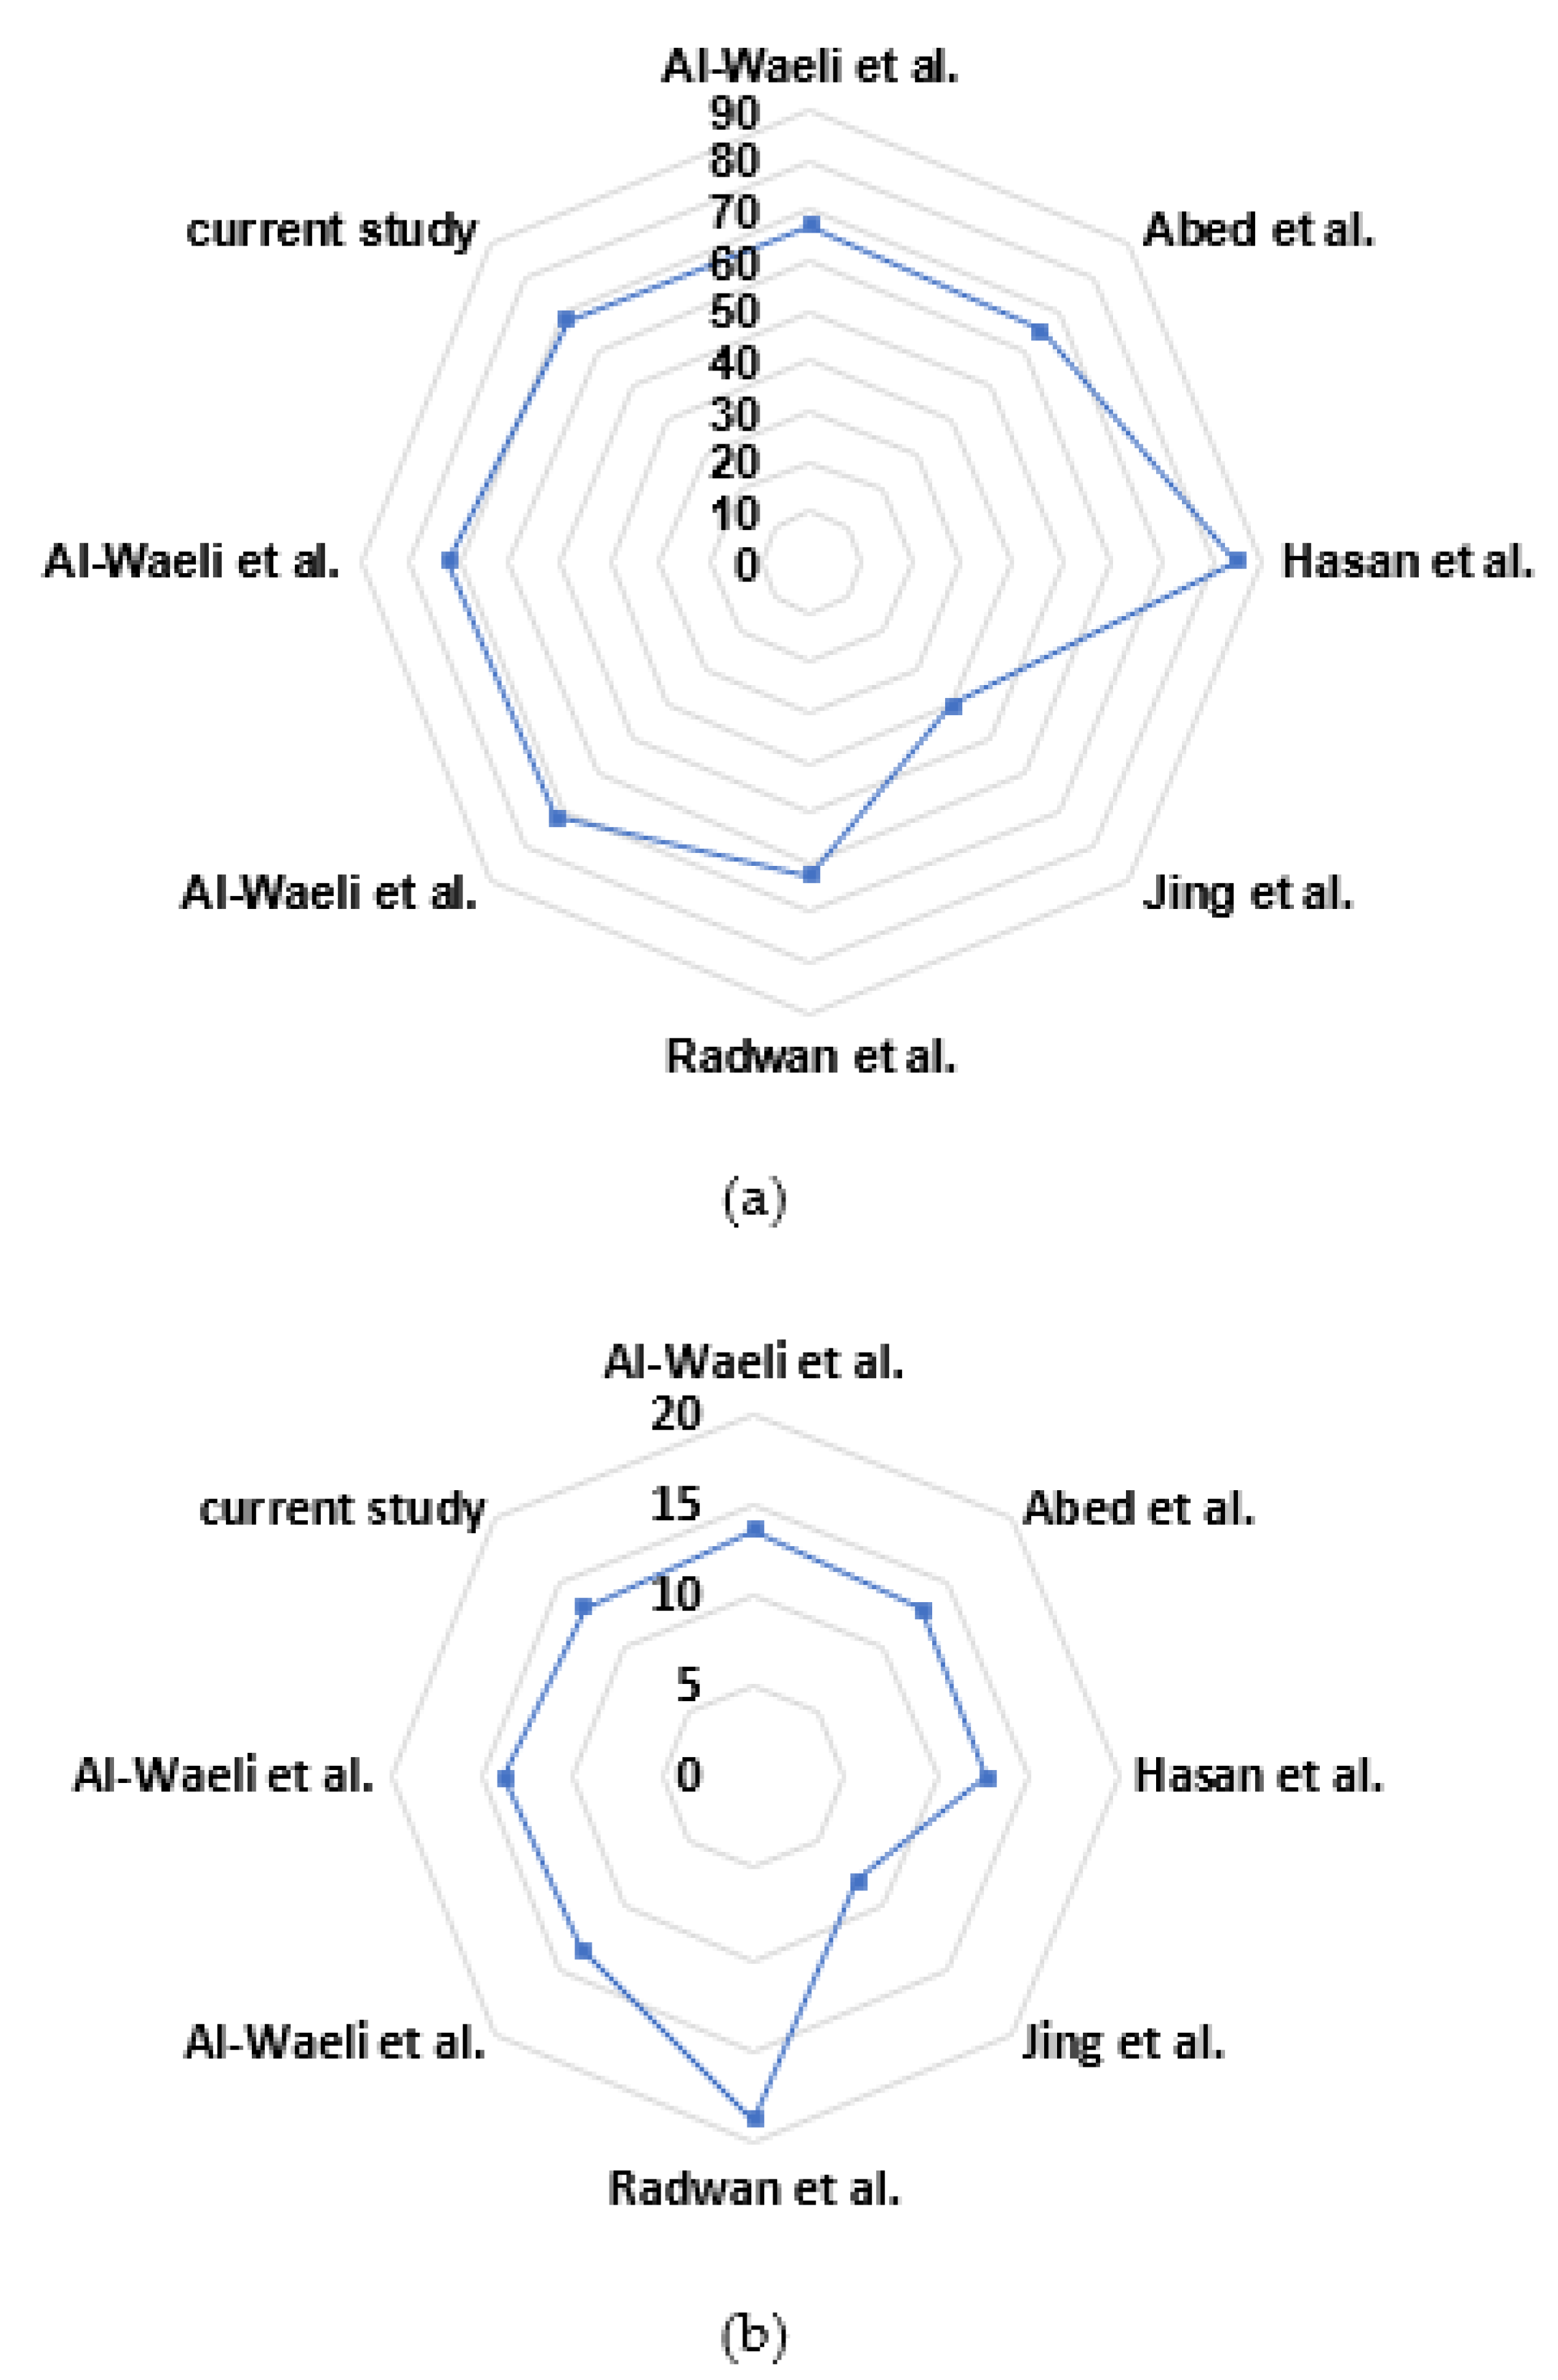
3.3. Comparison with Literature
4. Conclusions
Author Contributions
Funding
Institutional Review Board Statement
Informed Consent Statement
Data Availability Statement
Acknowledgments
Conflicts of Interest
Nomenclature
| AC and Amodule | Collector and PV areas (m2) |
| Cp | Water heat capacity (J/(K kg)) |
| G | Solar irradiance (W/m2) |
| GS | Global solar radiation (W/m2) |
| ISC and Imp | Short circuit and maximum point currents (A) |
| MF | Mass flow (kg/h) |
| PV | Photovoltaic |
| PVT | Photovoltaic/Thermal |
| Prated and Pmp | Rated and maximum point powers (W) |
| Tambient | Ambient temperature (°C) |
| TC | Cell temperature (°C) |
| Tin and Tout | Inlet and outlet temperature (°C) |
| VOC and Vmp | Open circuit and maximum point voltages (V) |
| WR | Uncertainty |
| ηelectrical and ηthermal | Electrical and thermal efficiencies (%) |
References
- Al-Waeli, A.H.; Kazem, H.A.; Chaichan, M.T.; Sopian, K. Photovoltaic/Thermal (PV/T) Systems: Principles Design and Applications; Springer Nature: Berlin, Germany, 2019. [Google Scholar]
- Elsheikh, A.H.; Sharshir, S.W.; Mostafa, M.E.; Essa, F.A.; Ali, M.K.A. Applications of nanofluids in solar energy: A review of recent advances. Renew. Sustain. Energy Rev. 2018, 82, 3483–3502. [Google Scholar] [CrossRef]
- Al-Waeli, A.H.; Sopian, K.; Kazem, H.A.; Chaichan, M.T. Photovoltaic/Thermal (PV/T) systems: Status and future prospects. Renew. Sustain. Energy Rev. 2017, 77, 109–130. [Google Scholar] [CrossRef]
- Hamzat, A.K.; Sahin, A.Z.; Omisanya, M.I.; Alhems, L.M. Advances in PV and PVT cooling technologies: A review. Sustain. Energy Technol. Assess. 2021, 47, 101360. [Google Scholar] [CrossRef]
- Kazem, H.A.; Chaichan, M.T.; Al-Waeli, A.H.; Sopian, K. Investigation of a nanofluid-based photovoltaic thermal system using single-wall carbon nanotubes: An experimental study. Int. J. Energy Res. 2021, 45, 10285–10303. [Google Scholar] [CrossRef]
- Kazem, H.A.; Al-Waeli, A.H.; Chaichan, M.T.; Al-Waeli, K.H.; Al-Aasam, A.B.; Sopian, K. Evaluation and comparison of different flow configurations PVT systems in Oman: A numerical and experimental investigation. Sol. Energy 2020, 208, 58–88. [Google Scholar] [CrossRef]
- Sathe, T.M.; Dhoble, A.S. A review on recent advancements in photovoltaic thermal techniques. Renew. Sustain. Energy Rev. 2017, 76, 645–672. [Google Scholar] [CrossRef]
- Sangeetha, M.; Manigandan, S.; Chaichan, M.T.; Kumar, V. Progress of MWCNT Al2O3 and CuO with water in enhancing the photovoltaic thermal system. Int. J. Energy Res. 2020, 44, 821–832. [Google Scholar] [CrossRef]
- Sivamurugan, P.; Srimanickam, B.; Arunprasad, J.; Thirugnanasambantham, R.; Sugumar, S.; Kannan, P. Performance analysis of hybrid solar collector employing manganese oxide-water based nano fluid coolant. Mater. Today Proc. 2022, in press. [Google Scholar] [CrossRef]
- Kim, H.; Ham, J.; Cho, H. Evaluation of solar energy absorption and photo-thermal conversion performance of SiC/ITO hybrid nanofluid. Case Stud. Therm. Eng. 2022, 35, 102151. [Google Scholar] [CrossRef]
- Elangovan, M.; Srimanickam, B.; Čep, R.; Saranya, A.; Ramachandran, M. Experimental study of a hybrid solar collector using TiO2/water nanofluids. Energies 2022, 15, 4425. [Google Scholar] [CrossRef]
- Menon, G.S.; Murali, S.; Elias, J.; Delfiya, D.A.; Alfiya, P.V.; Samuel, M.P. Experimental investigations on unglazed photovoltaic-thermal (PVT) system using water and nanofluid cooling medium. Renew. Energy 2022, 188, 986–996. [Google Scholar] [CrossRef]
- Ghadiri, M.; Sardarabadi, M.; Pasandideh-fard, M.; Moghadam, A.J. Experimental investigation of a PVT system performance using nano ferrofluids. Energy Convers. Manag. 2015, 103, 468–476. [Google Scholar] [CrossRef]
- Michael, J.J.; Iniyan, S. Performance analysis of a copper sheet laminated photovoltaic thermal collector using copper oxide–water nanofluid. Sol. Energy 2015, 119, 439–451. [Google Scholar] [CrossRef]
- Adun, H.; Adedeji, M.; Ruwa, T.; Senol, M.; Kavaz, D.; Dagbasi, M. Energy exergy economic environmental (4E) approach to assessing the performance of a photovoltaic-thermal system using a novel ternary nanofluid. Sustain. Energy Technol. Assess. 2022, 50, 101804. [Google Scholar] [CrossRef]
- Wu, Y.Y.; Wu, S.Y.; Xiao, L. Performance analysis of photovoltaic–thermoelectric hybrid system with and without glass cover. Energy Convers. Manag. 2015, 93, 151–159. [Google Scholar] [CrossRef]
- Srimanickam, B.; Elangovan, M.; Salunkhe, S.; Nasr, E.A.; Hussein, H.M.A.; Shanmugam, R. Experimental Studies on Water-Based Al2O3 Nanofluid to Enhance the Performance of the Hybrid Collector. J. Nanomater. 2022, 2022, 1–22. [Google Scholar] [CrossRef]
- Fudholi, A.; Sopian, K.; Yazdi, M.H.; Ruslan, M.H.; Ibrahim, A.; Kazem, H.A. Performance analysis of photovoltaic thermal (PVT) water collectors. Energy Convers. Manag. 2014, 78, 641–651. [Google Scholar] [CrossRef]
- Murtadha, T.K.; Hussein, A.A. Optimization the performance of photovoltaic panels using aluminum-oxide nanofluid as cooling fluid at different concentrations and one-pass flow system. Results Eng. 2022, 15, 100541. [Google Scholar] [CrossRef]
- Sopian, K.; Al-Waeli, A.H.; Kazem, H.A. Energy exergy and efficiency of four photovoltaic thermal collectors with different energy storage material. J. Energy Storage 2020, 29, 101245. [Google Scholar] [CrossRef]
- Thakare, M.S.; Priya, G.K.; Ghosh, P.C.; Bandyopadhyay, S. Optimization of photovoltaic–thermal (PVT) based cogeneration system through water replenishment profile. Sol. Energy 2016, 133, 512–523. [Google Scholar] [CrossRef]
- Poongavanam, G.K.; Sivalingam, V.; Ravichandran, S.; Thakur, A.K.; Kim, S.C. Optimized modeling and experimental investigation on the thermal/electrical characteristics of MWCNT nanofluid for effective solar thermal applications. Int. J. Energy Res. 2022, 46, 4572–4587. [Google Scholar] [CrossRef]
- Gelis, K.; Celik, A.N.; Ozbek, K.; Ozyurt, O. Experimental investigation into efficiency of SiO2/water-based nanofluids in photovoltaic thermal systems using response surface methodology. Sol. Energy 2022, 235, 229–241. [Google Scholar] [CrossRef]
- Jafaryar, M.; Sheikholeslami, M. Efficacy of magnetic field on performance of photovoltaic solar system utilizing ferrofluid. J. Magn. Magn. Mater. 2022, 562, 169798. [Google Scholar] [CrossRef]
- Hasan, H.A.; Hatem, A.A.; Abd, L.A.; Abed, A.M.; Sopian, K. Numerical investigation of nanofluids comprising different metal oxide nanoparticles for cooling concentration photovoltaic thermal CPVT. Clean. Eng. Technol. 2022, 10, 100543. [Google Scholar] [CrossRef]
- Sarsam, W.S.; Amiri, A.; Kazi, S.N.; Badarudin, A. Stability and thermophysical properties of non-covalently functionalized graphene nanoplatelets nanofluids. Energy Convers. Manag. 2016, 116, 101–111. [Google Scholar] [CrossRef]
- Esfe, M.H.; Arani, A.A.A.; Rezaie, M.; Yan, W.M.; Karimipour, A. Experimental determination of thermal conductivity and dynamic viscosity of Ag–MgO/water hybrid nanofluid. Int. Commun. Heat Mass Transf. 2015, 66, 189–195. [Google Scholar] [CrossRef]
- Colangelo, G.; Favale, E.; Miglietta, P.; Milanese, M.; de Risi, A. Thermal conductivity viscosity and stability of Al2O3-diathermic oil nanofluids for solar energy systems. Energy 2016, 95, 124–136. [Google Scholar] [CrossRef]
- Khairul, M.A.; Shah, K.; Doroodchi, E.; Azizian, R.; Moghtaderi, B. Effects of surfactant on stability and thermo-physical properties of metal oxide nanofluids. Int. J. Heat Mass Transf. 2016, 98, 778–787. [Google Scholar] [CrossRef]
- Hjerrild, N.E.; Mesgari, S.; Crisostomo, F.; Scott, J.A.; Amal, R.; Taylor, R.A. Hybrid PV/T enhancement using selectively absorbing Ag–SiO2/carbon nanofluids. Sol. Energy Mater. Sol. Cells 2016, 147, 281–287. [Google Scholar] [CrossRef]
- Rejeb, O.; Sardarabadi, M.; Ménézo, C.; Passandideh-Fard, M.; Dhaou, M.H.; Jemni, A. Numerical and model validation of uncovered nanofluid sheet and tube type photovoltaic thermal solar system. Energy Convers. Manag. 2016, 110, 367–377. [Google Scholar] [CrossRef]
- Khanjari, Y.; Kasaeian, A.B.; Pourfayaz, F. Evaluating the environmental parameters affecting the performance of photovoltaic thermal system using nanofluid. Appl. Therm. Eng. 2017, 115, 178–187. [Google Scholar] [CrossRef]
- Al-Waeli, A.H.; Sopian, K.; Chaichan, M.T.; Kazem, H.A.; Hasan, H.A.; Al-Shamani, A.N. An experimental investigation of SiC nanofluid as a base-fluid for a photovoltaic thermal PV/T system. Energy Convers. Manag. 2017, 142, 547–558. [Google Scholar] [CrossRef]
- Hussain, M.I.; Kim, J.T. Conventional fluid-and nanofluid-based photovoltaic thermal (PV/T) systems: A techno-economic and environmental analysis. Int. J. Green Energy 2018, 15, 596–604. [Google Scholar] [CrossRef]
- Al-Waeli, A.H.; Sopian, K.; Kazem, H.A.; Chaichan, M.T. Nanofluid based grid connected PV/T systems in Malaysia: A techno-economical assessment. Sustain. Energy Technol. Assess. 2018, 28, 81–95. [Google Scholar] [CrossRef]
- Abdallah, S.R.; Saidani-Scott, H.; Abdellatif, O.E. Performance analysis for hybrid PV/T system using low concentration MWCNT (water-based) nanofluid. Sol. Energy 2019, 181, 108–115. [Google Scholar] [CrossRef]
- Al-Waeli, A.H.; Chaichan, M.T.; Sopian, K.; Kazem, H.A. Influence of the base fluid on the thermo-physical properties of PV/T nanofluids with surfactant. Case Stud. Therm. Eng. 2019, 13, 100340. [Google Scholar] [CrossRef]
- Das, L.; Habib, K.; Saidur, R.; Aslfattahi, N.; Yahya, S.M.; Rubbi, F. Improved thermophysical properties and energy efficiency of aqueous ionic liquid/mxene nanofluid in a hybrid PV/T solar system. Nanomaterials 2020, 10, 1372. [Google Scholar] [CrossRef]
- Asadian, H.; Mahdavi, A.; Gorji, T.B.; Gorji-Bandpy, M. Efficiency improvement of non-crystal silicon (amorphous) photovoltaic module in a solar hybrid system with nanofluid. Exp. Tech. 2022, 46, 633–645. [Google Scholar] [CrossRef]
- Al Ezzi, A.; Chaichan, M.T.; Majdi, H.S.; Al-Waeli, A.H.; Kazem, H.A.; Sopian, K.; Fayad, M.A.; Dhahad, H.A.; Yusaf, T. Nano-iron oxide-ethylene glycol-water nanofluid based photovoltaic thermal (PV/T) system with spiral flow absorber: An energy and exergy analysis. Energies 2022, 15, 3870. [Google Scholar] [CrossRef]
- Chaichan, M.T.; Zaidi, M.A.; Kazem, H.A.; Sopian, K. Photovoltaic Module Electrical Efficiency Enhancement Using Nano Fluids and Nano-Paraffin; IOP Conference Series: Earth and Environmental Science; IOP Publishing: Bristol, UK, 2022; Volume 961, p. 012065. [Google Scholar]
- Kazem, H.A.; Chaichan, M.T. The effect of dust accumulation and cleaning methods on PV panels’ outcomes based on an experimental study of six locations in Northern Oman. Sol. Energy 2019, 187, 30–38. [Google Scholar] [CrossRef]
- Kazem, H.A.; Albadi, M.H.; Al-Waeli, A.H.; Al-Busaidi, A.H.; Chaichan, M.T. Techno-economic feasibility analysis of 1 MW photovoltaic grid connected system in Oman. Case Stud. Therm. Eng. 2017, 10, 131–141. [Google Scholar] [CrossRef]
- Al-Waeli, A.H.; Sopian, K.; Chaichan, M.T.; Kazem, H.A.; Ibrahim, A.; Mat, S.; Ruslan, M.H. Evaluation of the nanofluid and nano-PCM based photovoltaic thermal (PVT) system: An experimental study. Energy Convers. Manag. 2017, 151, 693–708. [Google Scholar] [CrossRef]
- Al-Waeli, A.H.; Chaichan, M.T.; Sopian, K.; Kazem, H.A.; Mahood, H.B.; Khadom, A.A. Modeling and experimental validation of a PVT system using nanofluid coolant and nano-PCM. Solar Energy 2019, 177, 178–191. [Google Scholar] [CrossRef]
- Kazem, H.A.; Chaichan, M.T.; Sopian, K. Design and experimental evaluation of a PV/T system cooled by advanced methods. Int. J. Energy Res. 2022, 46, 9684–9709. [Google Scholar] [CrossRef]
- Chen, Z.; Shahsavar, A.; Al-Rashed, A.A.; Afrand, M. The impact of sonication and stirring durations on the thermal conductivity of alumina-liquid paraffin nanofluid: An experimental assessment. Powder Technol. 2020, 360, 1134–1142. [Google Scholar] [CrossRef]
- Chaichan, M.T.; Kazem, H.A.; Alamiery, A.A.; Isahak, W.N.R.W.; Kadhum, A.A.H.; Takriff, M.S. Adding nano-TiO2 to water and paraffin to enhance total efficiency of a photovoltaic thermal PV/T system subjected to harsh weathers. Nanomaterials 2022, 12, 2266. [Google Scholar] [CrossRef] [PubMed]
- Pounraj, P.; Winston, D.P.; Kabeel, A.E.; Kumar, B.P.; Manokar, A.M.; Sathyamurthy, R.; Christabel, S.C. Experimental investigation on Peltier based hybrid PV/T active solar still for enhancing the overall performance. Energy Convers. Manag. 2018, 168, 371–381. [Google Scholar] [CrossRef]
- Mansour, R.B.; Galanis, N.; Nguyen, C.T. Effect of uncertainties in physical properties on forced convection heat transfer with nanofluids. Appl. Therm. Eng. 2007, 27, 240–249. [Google Scholar] [CrossRef]
- Asadi, A. A guideline towards easing the decision-making process in selecting an effective nanofluid as a heat transfer fluid. Energy Convers. Manag. 2018, 175, 1–10. [Google Scholar] [CrossRef]
- Bensalem, S.; Chegaar, M.; Aillerie, M. Solar cells electrical behavior under thermal gradient. Energy Procedia 2013, 36, 1249–1254. [Google Scholar] [CrossRef]
- Hu, J.; Chen, W.; Yang, D.; Zhao, B.; Song, H.; Ge, B. Energy performance of ETFE cushion roof integrated photovoltaic/thermal system on hot and cold days. Appl. Energy 2016, 173, 40–51. [Google Scholar] [CrossRef]
- Rounis, E.D.; Athienitis, A.K.; Stathopoulos, T. Multiple-inlet building integrated photovoltaic/thermal system modelling under varying wind and temperature conditions. Sol. Energy 2016, 139, 157–170. [Google Scholar] [CrossRef]
- Mojumder, M.S.S.; Uddin, M.M.; Alam, I.; Enam, H.K. Study of hybrid photovoltaic thermal (PV/T) solar system with modification of thin metallic sheet in the air channel. J. Energy Technol. Policy 2011, 3, 47–55. [Google Scholar]
- Rosa-Clot, M.; Rosa-Clot, P.; Tina, G.M.; Ventura, C. Experimental photovoltaic-thermal power plants based on TESPI panel. Sol. Energy 2016, 133, 305–314. [Google Scholar] [CrossRef]
- Su, D.; Jia, Y.; Huang, X.; Alva, G.; Tang, Y.; Fang, G. Dynamic performance analysis of photovoltaic–thermal solar collector with dual channels for different fluids. Energy Convers. Manag. 2016, 120, 13–24. [Google Scholar] [CrossRef]
- Othman, M.Y.; Hamid, S.A.; Tabook, M.A.S.; Sopian, K.; Roslan, M.H.; Ibarahim, Z. Performance analysis of PV/T Combi with water and air heating system: An experimental study. Renew. Energy 2016, 86, 716–722. [Google Scholar] [CrossRef]
- Qiu, Z.; Zhao, X.; Li, P.; Zhang, X.; Ali, S.; Tan, J. Theoretical investigation of the energy performance of a novel MPCM (Microencapsulated Phase Change Material) slurry based PV/T module. Energy 2015, 87, 686–698. [Google Scholar] [CrossRef]
- Fiorentini, M.; Cooper, P.; Ma, Z. Development and optimization of an innovative HVAC system with integrated PVT and PCM thermal storage for a net-zero energy retrofitted house. Energy Build. 2015, 94, 21–32. [Google Scholar] [CrossRef]
- Farahani, S.D.; Farahani, A.D.; Hajian, E. Effect of PCM and porous media/nanofluid on the thermal efficiency of microchannel heat sinks. Int. Commun. Heat Mass Transf. 2021, 127, 105546. [Google Scholar] [CrossRef]
- Sardarabadi, M.; Passandideh-Fard, M. Experimental and numerical study of metal-oxides/water nanofluids as coolant in photovoltaic thermal systems (PVT). Sol. Energy Mater. Sol. Cells 2016, 157, 533–542. [Google Scholar] [CrossRef]
- Winston, D.; Pounraj, P.; Muthu Manokar, A.; Sathyamurthy, R.; Kabeel, A.E. Experimental investigation on hybrid PV/T active solar still with effective heating and cover cooling method. Desalination 2018, 435, 140–151. [Google Scholar]
- An, W.; Wu, J.; Zhu, T.; Zhu, Q. Experimental investigation of a concentrating PV/T collector with Cu9S5 nanofluid spectral splitting filter. Appl. Energy 2016, 184, 197–206. [Google Scholar] [CrossRef]
- Khanjari, Y.; Pourfayaz, F.; Kasaeian, A.B. Numerical investigation on using of nanofluid in a water-cooled photovoltaic thermal system. Energy Convers. Manag. 2016, 122, 263–278. [Google Scholar] [CrossRef]
- Sardarabadi, M.; Passandideh-Fard, M.; Maghrebi, M.J.; Ghazikhani, M. Experimental study of using both ZnO/water nanofluid and phase change material (PCM) in photovoltaic thermal systems. Sol. Energy Mater. Sol. Cells 2017, 161, 62–69. [Google Scholar] [CrossRef]
- Murtadha, T.K.; Dil Hussein, A.A.; Alalwany, A.A.; Alrwashdeh, S.S.; Ala’a, M. Improving the cooling performance of photovoltaic panels by using two passes circulation of titanium dioxide nanofluid. Case Stud. Therm. Eng. 2022, 36, 102191. [Google Scholar] [CrossRef]
- Salem, M.R.; Elsayed, M.M.; Abd-Elaziz, A.A.; Elshazly, K.M. Performance enhancement of the photovoltaic cells using Al2O3/PCM mixture and/or water cooling-techniques. Renew. Energy 2019, 138, 876–890. [Google Scholar] [CrossRef]
- Abed, A.M.; Sopian, K.; Mohammed, H.A.; Alghoul, M.A.; Ruslan, M.H.; Mat, S.; Al-Shamani, A.N. Enhance heat transfer in the channel with V-shaped wavy lower plate using liquid nanofluids. Case Stud. Therm. Eng. 2015, 5, 13–23. [Google Scholar] [CrossRef]
- Hasan, H.A.; Sopian, K.; Jaaz, A.H.; Al-Shamani, A.N. Experimental investigation of jet array nanofluids impingement in photovoltaic/thermal collector. Sol. Energy 2017, 144, 321–334. [Google Scholar] [CrossRef]
- Jing, D.; Hu, Y.; Liu, M.; Wei, J.; Guo, L. Preparation of highly dispersed nanofluid and CFD study of its utilization in a concentrating PV/T system. Sol. Energy 2015, 112, 30–40. [Google Scholar] [CrossRef]
- Radwan, A.; Ahmed, M.; Ookawara, S. Performance enhancement of concentrated photovoltaic systems using a microchannel heat sink with nanofluids. Energy Convers. Manag. 2016, 119, 289–303. [Google Scholar] [CrossRef]


| Nanoparticles | Critical Findings | Reference |
|---|---|---|
| MWCNTs | The increase in the volumetric concentration of MWCNT in the base fluid (SG/H2O) contributed to the improvement of the thermal and electrical conductivities of the used PV/T system. The researchers determined the optimal conditions to reach the best electrical and thermal efficiencies. These conditions are an operating temperature of 66.2 °C and a concentration of MWCNT of 0.125% by volume in the nanofluid. | [22] |
| SiO2 | Nano-SiO2 was added to water in variable volume ratios (0.1–0.2–0.3%). The researchers concluded that radiation, flow rate, and nano-SiO2 volumetric concentration are the most influential factors in electrical and thermal efficiency. When comparing the experimental results with the results of the developed mathematical models for both electrical and thermal efficiency of the PV/T system, a good convergence was found between them. | [23] |
| Fe3O4 | Nano-Fe3O4 was added to the base fluid (water), and a vertical magnetic field was imposed on the flowing fluid to increase the cooling rate of the bimetallic system, thus improving its electrical and thermal efficiency. The addition of Nano-Fe3O4 lowered the PF unit temperature, which increased the electrical and thermal efficiencies by 0.05% and 0.39%, respectively. | [24] |
| SiO2, Al2O3, ZnO, and CuO | Four types of nanoparticles (SiO2, Al2O3, ZnO, and CuO) were added to water, and the produced nanofluids were used to cool the CPVT collector. The maximum increase in the heat transfer rate was when using water–nano-SiO2 then water–nano-Al2O3, water–nano-ZnO, water–nano-CuO, and finally water. The researchers found that water–nano-SiO2 transfers and dissipates heat better than other nanofluids due to its high thermal conductivity. | [25] |
| Graphene nanoplatelets (GNPs) | The study results show that the highest nanofluid stability was achieved at (1-1) SDBS-GNPs sample with 60 min of ultrasonication mixing. The thermal conductivity of nanofluid enhanced to 8.36% was compared with pure water, which has the lowest viscosity of 7.4%. | [26] |
| Mg-Ag | It was found that the hybrid nanofluid enhances the heat transfer. The study found that the prediction model shows high accuracy compared with the experimental results. | [27] |
| Fe3O4 | The authors investigated and compared a conventional PV module with a PV/T system in terms of efficiency improvement. It is found that PV/T efficiency is 52% compared with 4.4% for conventional PV. The PV/T efficiency increased up to 76% when Fe3O4 nanofluid was used with a 3% concentration. More efficiency enhancement was produced when a magnetic field was used with the nanofluid, where the efficiency improved to 79%. | [13] |
| Al2O3 | The nanofluid viscosity increased with the increase of the nanoparticles’ volume fraction. The stability of the nanofluid that contained oleic acid was less impacted by the viscosity increment. | [28] |
| Al2O3 and CuO | The authors claimed that the stability of nanofluid is highly affected by the thermal conductivity and viscosity of the nanofluid. However, the stability increased with the decrease of viscosity, and the increase of nanoparticle mass fraction will decrease the stability. | [29] |
| Ag, SiO2, and CNT | Multi-walled carbon nanotubes with SiO2 and Ag were used in the investigation. The new mixture reduced the solar cell temperature and enhanced power production. The CNT and silica added to the basic silver nano-disc enhanced the absorption of the ultraviolet rays. | [30] |
| CuO and Al2O3 | The study reveals that cooling is enhanced when distilled water is used compared with ethylene glycol-base fluid. Moreover, the Cu nanofluid shows the highest electrical, thermal, and overall efficiencies compared with Al2O3–water and Al2O3–Ethylene glycol. | [31] |
| Al2O3 | The authors found that the increase in solar irradiance will increase the PV productivity but at the same time increase temperature, which reduces the productivity. The use of Al2O3 nanofluid cooled the PV and enhanced the productivity compared with pure water cooling. | [32] |
| SiC | The study investigated SiC nanofluid and pure water for PV/T cooling. It was found that at 3% weight of SiC, the viscosity, density, and thermal conductivity increased by 5.18%, 8.2%, and 4.3%, respectively. Moreover, it was found that there is an efficiency increase of 24% compared with conventional PV modules. Finally, it was found that the heat transfer efficiency increased to 100.19% in comparison to water cooling only. | [33] |
| CuO and Al2O3 | The economic effects of using CuO and Al2O3 nanofluids to cool PV/T systems were studied. When comparing the performance of the systems with those operating with conventional liquids, the results showed that the nanofluid-cooled PV/T systems have a lower recovery period, which results in better economic savings compared to the water-cooled systems. | [34] |
| SiC | In this study, an economic evaluation of a grid-connected PV/T system cooled with a water + nano-SiC nanofluid is evaluated. The annual production factor of the studied GCPVT system ranges from 128.34 to 183.75 kWh/kW. The energy cost of this system was 0.196 USD/kWh, the payback period was 7–8 years, and the efficiency was 14.25%. | [35] |
| MWCNT | In this study, the researchers used MWCNT water added as the cooling fluid in the PVT system. The addition of MWCNT caused an increase in the cooling of the PV/T system and a decrease in the temperature of the solar panel by about 12° C and also caused a clear increase in the thermal and electrical efficiencies, bringing the total efficiency of the system to about 83.26%. | [36] |
| SiC | In this study, three types of base liquids were prepared, which were water, water + 35% ethylene glycol, and water + 35% propylene glycol, to which nano-SiC and cetyltrichromyl ammonium bromide were added. The thermal conductivity of the prepared fluids was close, while the density and viscosity of glycol fluids were higher than water. The stability of nanoparticles in glycol suspensions was more than that of water when mixed with ultrasonic vibration for a period of 4 to 6 h. | [37] |
| MWCNT, Al2O3, and CuO | The use of nanofluids in the PV/T system caused a higher electrical and thermal output compared to cooling with water. The use of a nanofluid containing MWCNT and CuO caused a temperature reduction of about 19% in PV modules’ temperatures. The electrical efficiency of PV/T systems operating with MWCNT, Al2O3, and CuO nanofluids increased by 60%, 55%, and 52% compared to conventional PV. | [8] |
| Nano-MXene (Ti3C2) | Nano-MXene (Ti3C2) with three mass fractions 0.05, 0.10, and 0.20% was added to water, and the produced nanofluid was used to cool the PV/T system. The thermal conductivity of the nanofluid when adding 0.20% mass fraction increased by 47% compared to water. The maximum electrical efficiency was 13.95%, and the maximum thermal efficiency was 81.15% when cooling with water/MXene nanofluid. | [38] |
| GNT, TiO2, and SiO2 | The PV/T system was cooled using nanofluid composed of graphene tubes, TiO2, and SiO2 nanoparticles. The maximum thermal efficiency obtained using graphene and water suspension was 89.11%. The highest increase in electrical efficiency was 24.15% compared to water cooling. | [39] |
| Fe2O3 | Nano-Fe2O3 was added to water and ethylene glycol to form a nanofluid that cooled the PEFT system. The addition of 2% of nanoparticles caused an increase in the thermal conductivity of the nanofluid by 140%, and this fluid has good stability. The highest overall system efficiency obtained was 72% higher than that of an independent single crystal PV system. When using polycrystalline PV, the highest overall efficiency increase was 77.65% compared to the standalone PV system. | [40] |
| SiC | Nano-SiC was added to water to form a nanofluid that cooled the nano-paraffin in a PV/T collector tank. The electrical efficiency of the system was greatly improved, and the electrical power output increased. The maximum electrical efficiency obtained was 13.7% compared to 7.11% for a conventional PV system. The temperature of the PV/T system panel was reduced to 39.52 °C compared to 68.3 °C for a conventional PV panel. | [41] |
| Feature | Specification |
| Supplier | Zhenxin Ferroalloy Supplier (China) |
| External shape | Black powder |
| Purity | 98.8% |
| pH | 3.5–7.5 |
| Crystal form | Cubic |
| Particles size (nm) | 20–35 |
| Density (g/cm3) | 3180 |
| Melting point (°C) | 2740 |
| Microhardness (kg/cm3) | 3280 |
| Thermal conductivity (W/m K) | 125–167 |
| Parameter | Unit | No. of Equation |
|---|---|---|
| PV/T power | W | Equation (1) |
| Collected heat | W | Equation (2) |
| Electrical efficiency | % | Equation (3) |
| Thermal efficiency | % | Equation (4) |
| PV/T efficiency | % | Equation (5) |
| No. | Measured Variable | Measuring Devise | Uncertainty (%) |
|---|---|---|---|
| 1 | Electrical variables (current and voltage) | Multi-meter | 0.96 |
| 2 | Nanofluid flow rate | Flowmeter | 0.28 |
| 3 | Temperature | Thermocouples | 0.34 |
| 4 | Irradiance | Solar radiation intensity meter | 0.91 |
| 5 | Nanoparticle mass fraction weight | Sensitive weight | 0.001 |
| 6 | Nanofluids density | Density tester | 0.42 |
| 7 | Nanofluids viscosity | Brookfield Programmer Viscometer (Model: LVDV-III Ultra-programmable) | 0.53 |
| 8 | Thermal conductivity and capacity | Hot desk Tps 500 | 0.92 |
| Property | Density (kg/m3) | Viscosity (mPs.s) | Thermal Conductivity Enhancement Rate (%) | Stability (Zeta Potential) | |
|---|---|---|---|---|---|
| Temperature (°C) | |||||
| 25 | 1.13 | 1.12 | 6.64 | 63 | |
| 35 | 1.045 | 1.07 | 6.98 | 61 | |
| 45 | 0.98 | 1.01 | 7.67 | 58.7 | |
| 55 | 0.94 | 0.985 | 7.98 | 57.3 | |
| 65 | 0.89 | 0.955 | 8.16 | 56.5 | |
| 75 | 0.85 | 0.923 | 8.72 | 55.8 | |
| Flow Type | 25 °C | 35 °C | 45 °C | 55 °C | 65 °C | 75 °C |
|---|---|---|---|---|---|---|
| Laminar flow (Equation (7)) | 0.877 | 0.98 | 1.012 | 1.046 | 1.051 | 1.148 |
| Turbulent flow (Equation (8)) | 0.805 | 0.813 | 0.886 | 0.918 | 0.943 | 0.966 |
| Ref. | Country | Thermal Efficiency (%) | Electrical Efficiency (%) | Cooling Method |
|---|---|---|---|---|
| [53] | China | 28 | 7.7 | Air |
| [54] | Canada | 48 | 16.5 | Air |
| [55] | Bangladesh | 30 | 9.25 | Water |
| [56] | Italy | 62 | 13.19 | Water |
| [57] | China | 64.4 | 11.8 | Water-air |
| [58] | China | 76 | 17 | Water-air |
| [59] | UK | 59 | 8.7 | PCM |
| [60] | Australia | 45 | 9 | PCM |
| [33] | Malaysia | 67 | 13.5 | Nanofluid |
| [13] | Iran | 33 | 17 | Nanofluid |
| [44] | Malaysia | 72 | 13.7 | Nanofluid-Nano/PCM |
| [61] | Iran | 47 | - | Nanofluid-Nano/PCM |
| Current study | Oman | 68.22 | 13.14 | SiC Nanofluid |
Publisher’s Note: MDPI stays neutral with regard to jurisdictional claims in published maps and institutional affiliations. |
© 2022 by the authors. Licensee MDPI, Basel, Switzerland. This article is an open access article distributed under the terms and conditions of the Creative Commons Attribution (CC BY) license (https://creativecommons.org/licenses/by/4.0/).
Share and Cite
Kazem, H.A.; Chaichan, M.T.; Al-Waeli, A.H.A.; Jarimi, H.; Ibrahim, A.; Sopian, K. Effect of Temperature on the Electrical and Thermal Behaviour of a Photovoltaic/Thermal System Cooled Using SiC Nanofluid: An Experimental and Comparison Study. Sustainability 2022, 14, 11897. https://doi.org/10.3390/su141911897
Kazem HA, Chaichan MT, Al-Waeli AHA, Jarimi H, Ibrahim A, Sopian K. Effect of Temperature on the Electrical and Thermal Behaviour of a Photovoltaic/Thermal System Cooled Using SiC Nanofluid: An Experimental and Comparison Study. Sustainability. 2022; 14(19):11897. https://doi.org/10.3390/su141911897
Chicago/Turabian StyleKazem, Hussein A., Miqdam T. Chaichan, Ali H. A. Al-Waeli, Hasila Jarimi, Adnan Ibrahim, and K. Sopian. 2022. "Effect of Temperature on the Electrical and Thermal Behaviour of a Photovoltaic/Thermal System Cooled Using SiC Nanofluid: An Experimental and Comparison Study" Sustainability 14, no. 19: 11897. https://doi.org/10.3390/su141911897
APA StyleKazem, H. A., Chaichan, M. T., Al-Waeli, A. H. A., Jarimi, H., Ibrahim, A., & Sopian, K. (2022). Effect of Temperature on the Electrical and Thermal Behaviour of a Photovoltaic/Thermal System Cooled Using SiC Nanofluid: An Experimental and Comparison Study. Sustainability, 14(19), 11897. https://doi.org/10.3390/su141911897