Abstract
This paper focuses on optimization of charging station capacities and locations. The proliferation of electric vehicles is inextricably linked to the deployment of charging infrastructure. Currently, there are issues with locating and sizing when it comes to the building of electric vehicle charging stations. In order to find out the capacity of charging stations, a mathematical model was developed, which includes a site survey, EV density, electricity demand analysis, load modeling, costing analysis, EV battery charging time and power quality. The proposed approach was tested in MATLAB/Simulink environment.
1. Introduction
Electric cars are a viable worldwide solution for decarbonizing the transportation sector. India is one of just a few nations to back the worldwide EV30@30 initiative, which aims for at least 30 percent of total of new automobile sales to be electrified by 2030 []. Because of the paucity of oil sources and the deterioration of environmental pollution, some countries have turned to electric automobiles as the leading sector behind the clean and sustainable energy revolution [,]. Electric automobiles, which are rapidly being manufactured, can assist in the total substitution of fuel and reduce vehicle pollution. Improving the charging infrastructure is crucial for the widespread usage of electric cars [,]. Coordinated charging stations appear to be an important part in replenishing the supply of energy for electric and hybrid vehicles and they can affect users’ daily life. The location and size of these structures might have a significant influence over how electric vehicles are used. As a consequence, a fragment of transportation must recognize complete demands and conditions for developing the right analysis of a charging station, such as transportation ease of access, operational range, safety regulations, site estimation and municipal government planning. Some parameters, such as the allowed capacities of both the distribution system as well as line operational demands, must also be considered in this section of the power flow [,]. EV automobiles, as a method of public transport system, will have an influence on public transportation patterns and lifestyles in the coming years. Considering the fact that many users can recharge their EVs at homes, there is still a high requirement of charging stations in several places []. Therefore, as a result, electric vehicles may raise new concerns about vehicle charging and management. Prior to the adoption of a specific number of electric vehicles, it has been agreed that appropriate charging stations must be available. In India, the government has agreed to spend a large amount of capital to build charging station systems. Multiple planning methodologies have been introduced in this study with the purpose of enhancing the layout of electrical charging stations [,]. As a consequence, sophisticated charging stations are essential for the quick rollout of large and growing electric vehicle network infrastructure. However, if charging station power supply infrastructures are not properly established, EVs will not be able to encourage healthy and growing circulation. Electric vehicles also have a major role in reducing pollution and conserving natural resources. Battery electric vehicles (BEVs), plug-in hybrid electric cars (PHEVs) and hybrid electric vehicles (HEVs) are the three basic kinds of electrical vehicles based on their fuel usage advanced technologies. Since they are intended to be recharged by connecting into the electricity system, both PHEVs and BEVs are plug-in electric vehicles (PEVs).
One of the greatest impediments to widespread household adoption of electric vehicles is the existing lack of public charging infrastructure. To achieve the basic charging needs, we must know how many charging stations need to be built. This is a critical subject because, as much research has shown, the availability of simple and economical recharging infrastructure has a direct impact on the customers’ buying decisions and, as a result, on the adoption of EVs [,]. Many towns and regions have begun to install electric car charging stations, but they lack a comprehensive and complex layout design system, especially given the vast scale of the project. Perhaps both utility and petrochemical companies in India have lately revealed up their personal EV charging infrastructure development plans in order to satisfy the predicted charging demands from the rising EV fleet []. As a result, charging station pattern forecasting and implementation will move into the big-picture, network age and studies into charging station designing and siting will become more urgent and significant [,]. The goal of this study is to reduce user loss on the route towards the charging station by partitioning the planning area using the grid partition method and using the OA (optimization algorithm) to choose the optimum position of each partition based on population intensity and charging terminal capacity limitations. This paper will find an acceptable charging station plan in the whole region after repeated computations and altering the exposure of every subdivision and the locations of charging stations [,].
2. Methods
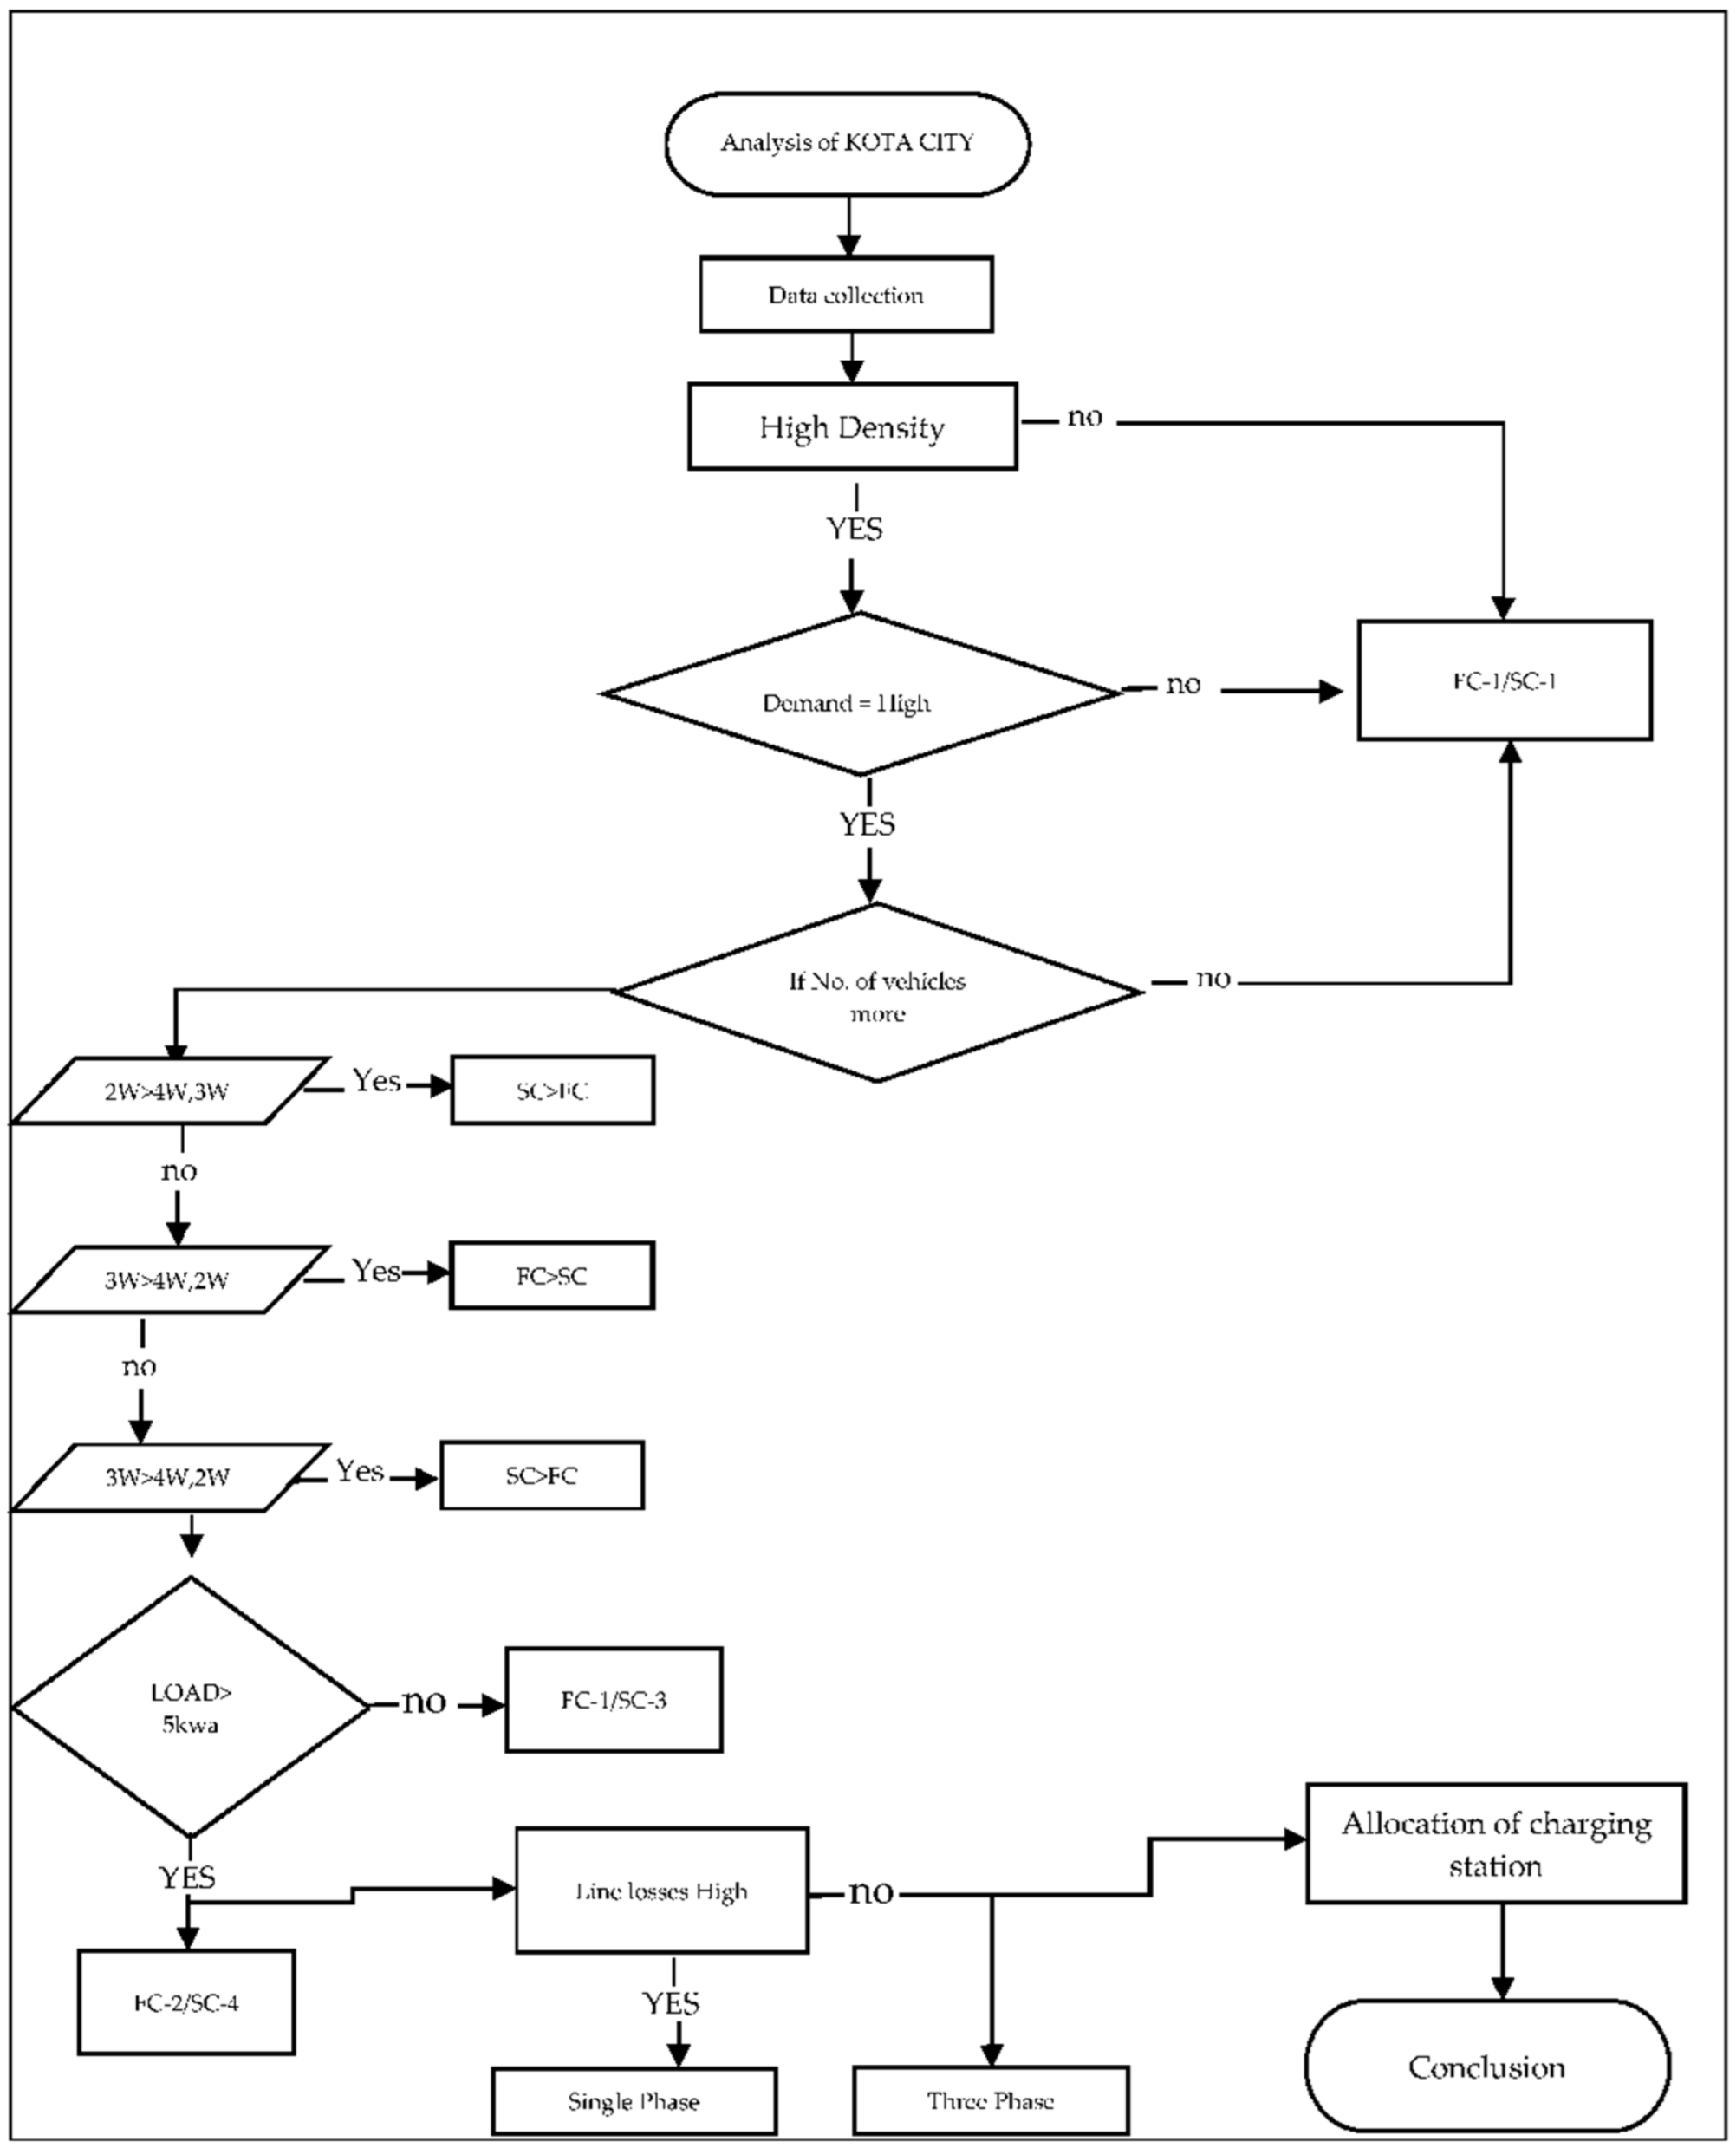
2.1. Layout Approaches for EV Charging Station Optimization
Process Design
The goal of this study on Electric vehicle charging station optimum efficiency strategy is to come up with an effective building plan to tackle the dilemma of charging station positioning as well as sizing within an area. Figure 1 depicts the proposed approach [,].
Figure 1.
Strategy approach for optimal siting of charging station.
As shown in Figure 2, we conceived determining superior locations for charging stations and studying charging stations in a newly developed region of Kota city by observing various factors and their calculation elements in this study. The elements we are looking at include geo-statistical techniques, minimum charging times and analyzing user demand based on the density and quantity of electrical vehicles and charging stations, as well as selecting specific places where the majority of driving paths may readily reach the charging station [,]. Another significant goal for charging station placement is to place charging stations in high seismic regions where charging demand is high due to population density as well as vehicular corridor densities. Research has included user-oriented, route-oriented and destination-oriented micro-scale analytical techniques of parking or even charging stations in a conceptual framework to address more than one critical element [,]. Through the analysis, we regard economy, convenience, driving distance and charging demand as factors affecting the number of charging stations and location distribution. Vehicles also include PHEVs, which also have internal combustion engines and use electricity to charge the batteries []. However, this paper considers only the following battery EVs types: two wheelers, three wheelers, four wheelers. Commercial electric two wheelers have a longer daily run and will require quick chargers. Private two wheelers, on the other hand, may be charged using household slow chargers [,]. Similarly, the majority of private automobile owners would charge their electric vehicles at home. Fast charging is required for electric three wheelers and automobiles that are utilized for greater miles each day for business purposes. The bus charging mechanism and frequency (number of times per day) would be determined by the storage capacity and daily consumption [,].
Figure 2.
Newly developed area layout within Kota City.
2.2. The Mathematical Model of Location and Sizing
2.2.1. Site Survey
As Kota is a city with a population of 1,474,243 people and 509,535 vehicles, which is fast moving toward electric vehicles to minimize pollution and improve the city’s air quality index, we decided to analyze and install our charging stations in a recently created section of the city, called Rama Krishna Puram [,]. Our goal is to provide charging stations so that everyone who needs to charge their electric vehicle may do so. With a population of 11,881 people (rate of increase in population every year is 3.03%) and a 2.23 km2 area, Ramakrishna Puram has the following density [,]:
where,
N = no. of people, (varies w.r.t Time)
A = total area in square kilometer, (Constant w.r.t time)
As the population may increase with regard to time but density of the area will not vary much because as per the urban management, the plotting of houses in this area is fixed due to which density of this area will not much differ in further year. Therefore, the density of Ramakrishna Puram currently in 2022 is ≈ 5324 people per kilometer of square area [,,]. If we consider 5 circles and 7 connecting roads together in Rama Krishna Puram area, then the site consists of n + 1 node in it; hence, we can place 13 charging stations and as we have 3 petrol pumps covering this area, we have to deploy 10 charging stations only in this area considering 3 petrol pumps will also provide charging facility for EVs [,].
2.2.2. Predicting Total Number of Electrical Vehicles
According to Equation (2), the population density of R.K Puram is approx. 5324 persons per square kilometer in 2022 and will increase by 3.03% yearly [,]. By assuming that by 2030 each individual will have one vehicle (such as 2w, 3w, 4w), we may deduce from Equation (2) that if we wish to put EVCS system in each square kilometer, i.e., in a 1 × 1 km area and according to prediction of government of Rajasthan’s electric department, 30 percent of the population will be driving electric cars by 2030, the total electric vehicles () in the region will be
TEV↑ = N↑
A = Constant w.r.t Time
N = ↑ at rate of 3.03% per year.
Then, in each kilometer square of land, there will be 1948 future automobile owners charging their electric vehicles [].
The charging stations to be constructed inside the road network were the focus of this research. Users determine the fastest route between road network nodes and any charging stations. Before calculating, the factors must be established [,]. Assume that one customer charges once per day and spends 17 min doing so; the percentage of charging time may be determined as follows: Equation (3). On the contrary, the average regular required to charge probabilities of electric vehicles and the financing rate are determined by (4) and (5).
2.2.3. Analyzing Power and Demand of Charging Stations
To anticipate charging station demand, we must first identify and calculate the many impacting elements of electric car charging stations [,]. Charger capacity restraints mean that the primary requirement for building a charging station would be that the capacities be sufficient to fulfil all of the users’ demands. The services supplied by EV charging stations are defined by the amount of charging units and the available time, as the demand for charging is indicated by the variable vehicle-hour [,]. Thus, every charger has the greatest possible accessible runtime of 24 h per day. However, in order to account for the charging system’s utilization rate, this available time must be multiplied by a value smaller than 1. Thus, an equation is used to compute the number of charging times per day for an electric car (6).
In Equation (6),
Ma = yearly average mileage of an EVs in kilometers,
N = daily charging time of an electric car,
Dn = number of driving days per year of an electric vehicle
SD = driving range of an EV battery in kilometers; 120 km is ideal, based on current battery technology.
As per the formula, with the help of average charging time, power of EV at CS as well as by range of EV, we can determine the rotational routine of every electrical vehicle coming for charging at PCS and also predict total EVs which can be charged on a daily basis. As the Table 1 shows the different categories of charger with specifications, the power rating of fast chargers is 10 kW/15 kW/30 kW/50 kW or even greater capacity, according to Bharat DC Charging Specifications [,].
Table 1.
Different categories of charger with specifications.
Charge time can also be calculated using the formula:
where
= charging Power (kW)
E = energy stored in a battery, expressed in watt-hours
V = voltage of the battery
Q = battery capacity, measured in amp-hours.
The amount of time it takes to charge a battery is determined by its capacity and charging power. Basically, the charging pace is determined by the charging level, which is determined by the voltage control of the energy storage devices and charger equipment in the vehicle [,].
The equation of equilibrium for an electric vehicle’s power system may be generated using the queuing model M/M/s [,].
In Equation (9), is the possibility that ‘n’ electric vehicles accept charging services. s is the number of charging stations. The number of electric vehicles that accepted service of charge is n. The average arriving rate for each charging station is λ, which can be calculated using Equations (10) and (11). Then in Table 2 we have analyzed various electric vehicles in Indian market to estimate charging station demand.
Table 2.
Analysis of various EVs in Indian Market.
= time of electric vehicle arriving and departure from one charging station.
= charging time.
To estimate charging station demand, we must first identify and monitor the many influencing elements in electric car charging stations. If the owner is willing for charging, then the correction factor will be considered as 1 or else it is considered as zero. The link of both the computational elements and the mathematical model, based on the forecast of vehicular usage, must, therefore, be developed [,,]. Finally, we discovered a suitable size for an electric car charging station. Perhaps the charging network’s demand forecasting methodology is as follows:
where
= predicted number of electric vehicles.
= correction factor with a range ranging from 0 to 1.
= electric vehicle charging power demand (in kVA).
= is the power of a single electric vehicle in kVA.
= is the charging time of an electric vehicle per day.
2.2.4. Analysis the Number of Electric Vehicle Charging Stations
: the charging station’s maximum capacity.
: the charging station’s minimum capacity.
the planned area’s entire charging demand.
The and can be used to estimate the number of charging stations (NC): NC ∈ [,] and there are two types of advancements in electric vehicles. The first (bus, utility vehicle, taxi, etc.) is under government control. The market, on the other hand, decides (e.g., private vehicle). In the charging station, there are a total of:
In the equation, ‘’ is the number of chargers in charging station. ‘’ is the capacity margin of the station. ‘P’ is charging power of the chargers. ‘k’ is the efficiency of chargers. ‘t’ is the effective charging time of the station.
2.2.5. Load Modeling
To examine charging station capacity, the load density estimating technique is used. To begin, the proposed territory should be split into N conceptual zones based on convention and actuality [,]. The load density datasets in this work are chosen from the residential area load density by practice and the projected load (q = 1, 2…, N) of each segment, as well as the fundamental total load LTotal, produced by using load density technique [,].
BESCOM states that the current fixed charges per kW for high-voltage lines are INR 190 per kW for high-voltage line and INR 60 per kW for low tension (LT) voltage (AC—slow chargers). No matter how much electricity is consumed by electric cars, the tariff per kWh unit is INR 5. Assuming that an average of 15 units of power are used each day to charge EVs, the cost of charging would be about INR 75 each day for batteries with an average capacity of 30 kWh.
When building a charge station’s specified capacity, the ease of electric vehicle charging should be considered []. The total number of electric vehicles (Nev) will be obtainable from the Department of Transportation’s data. The formula for determining an EV charging station’s capacity () is as follows:
where signifies EV charging simultaneity or the ratio of charging EVs to total EV quantity in statistical likelihood. stands for the average charging power [,]. The power supply for R.K Puram region of Kota city is shown in Figure 3, according to which this region is being supplied 3 × 5 MVA power rating (i.e., total of 15 MVA) which is sufficient to fulfill EV users’ charging demand. We can extend the range of power as per requirement as this region has its own bus bar and distribution system which is powered by 132/33 kv Mahaveer Nagar GSS substation (40,150 MVA). Distribution network power losses are the normal I2 R losses of the line []. A mathematical formula is used to calculate the line losses. The electrical power distribution system charges the battery of an electric vehicle. Due to non-linearity, the increased power consumption has an impact on the system’s stability. An EV’s power need may be represented as in Equation (17).
where
Figure 3.
Diagram of load sharing in R.K Puram, Kota.
CB = capacity of battery placed in EV.
CT = time taken for charging EV.
Whether the EV uses a lot or little electricity depends on the battery SOC. The total power demand for all EVs is calculated by adding their individual power demands together and this is denoted in Equation (18).
Harmonics are the increase in high-frequency voltage and current components relative to the fundamental frequency. Harmonics alter the voltage and current waveforms, which has an impact on the quality of the electricity. Total harmonic distortion (THD) of both voltage and current can be used to measure it. Total harmonic distortion (THD) is expressed in Equations (19) and (20), for current and voltage, respectively. THDV will be lower for slow charging than with quick charging for THDI. As a result, the EV of low SOC has a high likelihood of producing harmonics [].
The voltage magnitude of the bus in the power system that fulfils power balance is analyzed using Newton’s approach in the Newton–Raphson power flow analysis. The power balance equations are
Here, In the Equations (21) and (22), bus , , and abbreviations stand for the demand and generations at the bus. () and () refer to the functions that represent flow from bus I into the system in terms of voltage magnitudes and angles, respectively.
The majority of owners have vehicles that can be charged in one session. These chargers operate at 230 volts with a 16-amp electric current. The chargers typically have a maximum charging speed of 3.7 kW. You may switch your fuse box to a 3-phase charging connection to charge at greater amps. Workload for the three-phase charger is 400 volts and 16 amps of electricity. Further, 11 kW, which is three-times quicker than the one-phase charger, is the maximum charging speed offered by these chargers [,]. Although single-phase charging is still advised for EVs, 3-phase charging is still the best option for delivering a high-power charge. Single-phase chargers offer quick and effective charging. There are more automobiles using these chargers than those using 3-phase chargers. Clearly, 3-phase chargers are more expensive than 1-phase ones. There are several benefits to 3-phase charging. They can charge numerous electric vehicles and are more practical and flexible than single-phase chargers.
2.3. Estimation of Cost of Charging Infrastructure
The total cost of establishing charging infrastructure for electric vehicles comprises the cost of equipment, installation charges, plus operational and maintenance expenditure. With a rise in EV adoption in 2030 and subsequent years, the percentage of EVs will increase and, therefore, the cost of equipment will fall. The cost of EV charging device varies significantly across manufacturers. Aside from the oems cost, installation costs for the charger and grid connectivity are necessary []. The cost of semi-public chargers with low to moderate power ratings ranges from Rs 36,000 to Rs 87,000, while public chargers, which demand a lot of electricity, have a significant cost of installation, spanning from Rs 174,000 to Rs 262,000. It is possible that the cost of maintenance and operation will account for 10 percent of the overall cost of installation []. The Ministry of Energy announced “Charging Stations for Electric Vehicles—Standards and Guidelines” on 14 December 2018, which were later changed on 10 January 2019. Following careful deliberation, it was agreed to make a number of changes to the amended Guidelines [,]. The appropriate Commission will set the pricing for energy supply to EV Public Charging Stations in accordance with the current Tariff Policy announced within Section iii of the Electricity Act 2003. Only if the Tariff policy specifies otherwise, the tariff should not exceed the estimated price of supply adding fifteen percent.
3. Results
In order to illustrate the methods and models, a study is constructed. There are 12 intersection points, 18 road sections in this area and the planning area is 2.23 km2, in which 11,881 people live, having 5324 vehicles in this area; the regional road net and the node coordinates and typical area data is shown in Figure 4. Here, we perceive the area and population and the power supply chain in the area by which we can conclude and predict the requirement and demand of the area.
Figure 4.
Map of population and transformers in newly developing area of Kota City.
As for the data collected, we divided the newly developing area of Kota city in two parts of approx. 1 × 1 km2 area, in which the density of population living is 5324, approx., in 2022, which, according to statics, is increasing by approx. 3.03% per year so, in the targeted year, 2030, the population of this area might be 12,560 and as the number of targeted vehicles to be electrified by the guidelines of government in 2030 is 30%, the foreseen electrical vehicles calculated in this area will be around 1948 in 2030, including two wheeler, three wheeler and four wheeler vehicles [,]. This will provide the target to analyze the demand and density of this area, by which we will able to understand demand and site the electric vehicles charging stations to fulfill the needs of electrical vehicles owners. Table 3, below, shows the status population and market growth status of electric vehicles in future years in the R.K Puram region.
Table 3.
Population and vehicle growth in R.K Puram.
In the graph shown in Figure 5, a clear vision of increasing demand of vehicles and population can be observed, which shows that the charging station build must need to be planned. As such, it can upgrade its power load and capacity with regard to time after a certain period of years to maintain the service to fulfill public demand.
Figure 5.
Statistical prophesied data of population/vehicles in R.K Puram.
To refine the calculation and prediction values for charging stations, EVs are divided into subcategories according to their size in the form of wheels and to know the status of the type of public marketing choice in EVs, we analyzed the sales ratio as per type of EV demand in market of the newly developing area of Kota city []. Table 4 shows analysis of sales ratio of various types of EVs in the R.K Puram region.
Table 4.
Marketing demand statics of EVs in Kota city.
In the pie chart shown in Figure 6, as Kota is also known as a student area, the quantity of students is higher in this city and there are around three main colleges, namely Rajasthan technical university, Vardhman Mahaveer open university and Government medical college, as well as three schools located in this area, so many people here prefer two wheelers so that their children can easily go for studies. As seen in Figure 6, the percentage of people buying two wheelers are 76%, three wheelers are 22% and four wheelers is 2% [,]. Therefore, as the slow chargers are affordable in comparison to fast chargers, most of the people will use slow chargers in their home because, normally, at night, they can easily charge their vehicles at home. Therefore, there will be less rush for charging EVs with public chargers.
Figure 6.
Chart showing the market demand for various types of electric vehicles.
We can envisage that the area will require a greater amount of slow chargers as compared to fast chargers to charge electric vehicles, as the number of two wheelers in the area is higher in percentage than the three wheelers and four wheelers.
According to the technical values from Table 5, the average capacity of batteries in four wheelers is 31.4 kWh, which can be charged completely within 67 min (by FC) and in 6 h 25 min (by SC), i.e., overnight, which is a great deal to charge and go for a ride. The range of four wheelers, normally, on average, is 270 km, which is enough to ride within a city for 2–3 days without next charge and same applies for 2 W and 3 W vehicles because the distance of one corner to another corner in Kota city is small, so the fully charged vehicles can be used for 2–3 days. Therefore, from this study, we can analyze the charging demand, which will be only 1/2 number of EVs per day of the total EVs in this area. As the total EVs forecasted in this region is 1948, the EVs arriving for charge in a single day will be 974, out of which some EVs will charge in the morning and some at night. Therefore, we can assume that at a time, there will be approx. 500 EVs arriving for charge. Now, according to India’s policy, there should be 1 charger for 10 EVs in the market so, according to the rules and guidelines from the government, we can derive that there must be five charging ports at each charging station, in which four must be slow chargers and one must be a fast charger, which is declared in Table 6.
Table 5.
Average specifications of electrical vehicles and battery for charging.
Table 6.
Estimated number of charging slots and capacity of EV charging station.
As the ratio of 2 ws and 3 ws is higher than 4-w vehicles, which need fast chargers, there must be a greater number of slow chargers placed as compared to fast chargers in the region [,]. We also placed EVSC stations at petrol pumps so that any outsider who comes from long travel can charge their vehicles at a petrol pump and can relax while charging. As the slot has to be free fast, there must be two fast chargers and two slow chargers to charge the EVs rapidly.
In this research, we analyzed various parameters of various factors to allocate and size the charging stations in R.K.Puram. We can size the EVCS by the assistance of the following flow chart, shown in Figure 7, in which we can perceive from the collected data where we can provide charging stations and where it is not required to place the charging station and, if the density is low, we can provide one single fact charger and one single slow charger, whereas if the density is high, we can analyze the demand of the area, as if the demand is high, we can predict the number of vehicles in that area and if the no. of vehicles in that area is high, we can analyze by the data type of vehicles present in that area and on the basis of power supply, load and line losses, we can allocate and size EVCS accordingly in that particular area.
Figure 7.
Estimated flow chart of siting and sizing of the charging stations.
According to the demand and geographical observations of the newly developed region of Kota city, we allocated the charging stations at major points by analyzing traffic flow with the help of Google Maps. In Figure 8, we placed the charging stations (CS no. 2, 8, 7) at three major circles of R.K Puram area for autos and other public transport or bikes, etc. [], and three fast charging stations (CS no. A, B, C) at the petrol pump for the instant charge-and-go model. We also placed four charging stations (CS no. 3, 4, 5, 6) in between living areas, so people can charge their vehicles within walking distance from their houses and two charging stations (EVCS no. 1, 10).
Figure 8.
Siting and allocation of the charging stations.
For sizing the charging station, it is significant to know the target to be accomplish and fulfill public demand, so that they will never run out of power in their vehicles. Here, in Figure 9, according to the survey, we located charging stations in a triangular manner as the distribution made in this shape will provide easy access to the maximum number of EV users from their homes in this area and will cover the maximum area in the minimum no. of EVSCs []. As for locating charging stations, we calculated the average values of charging potentials to be fulfilled, so that we can predict the maximum and minimum number of vehicles that can be charged in a single day. Thus, by analyzing these data, we can forecast the accurate number of charging ports to be placed in EVCS stations.
Figure 9.
Geometrical placement of the charging stations.
4. Conclusions
The proposed approach is to find out the suitable locations of charging stations in specific areas of Kota City, as well as to assess the impact of various EV adoption rates on the increased capacity and charging growing demand. Numerous parameters and anticipated values were estimated for establishing charge stations in the R.K Puram region in order to successfully provide charging facilities to the largest number of consumers by 2030. As, until 2030, EV penetration of 30% will necessitate an increase in daily power demand, the number of charging facilities with slow or fast charging options must be considered. The proposed scheme accomplished a satisfactory power distribution planning methodology, which includes beneficial placement and optimizing of EV charging stations to enhance substantial numbers of EVs in the major newly developed region of Kota City. The study results relying on the node system demonstrate that the complete prototype can actually accomplish an acceptable management strategy for a distribution system.
Author Contributions
Conceptualization, P.S., S.K.S. and R.V.; methodology, P.S., S.K.S. and R.V.; software, P.S., S.K.S. and R.V.; validation, P.S. and S.K.S.; formal analysis, P.S. and Sharma S.K; investigation, R.V., P.S.; resources, R.V., P.S.; data curation, P.S.; writing—original draft preparation, R.V.; writing—review and editing, P.S. and R.V.; visualization, P.S.; supervision, S.K.S.; project administration, A.R.A.A. and J.K.B.; funding acquisition, A.R.A.A. and J.K.B. All authors have read and agreed to the published version of the manuscript.
Funding
King Khalid University, Saudi Arabia through the Research Group Program under Grant No: RGP 2/91/43.
Institutional Review Board Statement
Not applicable.
Informed Consent Statement
Not applicable.
Data Availability Statement
Not applicable.
Acknowledgments
The authors extend their appreciation to the Deanship of Scientific Research at King Khalid University, Saudi Arabia for funding this work through the Research Group Program under Grant No: RGP 2/91/43.
Conflicts of Interest
The authors declare no conflict of interest.
Nomenclature
| EV | Electric Vehicles |
| PCS | Electric Vehicles Charging Station |
| PM10 | Particulate Matter |
| Density | |
| N | no. of people |
| A | total area in square kilometer |
| total electric vehicles in the region | |
| daily charging time of an electric car | |
| yearly average mileage of an EVs in kilometers | |
| number of driving days per year of an electric vehicle | |
| SD | driving range of an EVs battery in kilometer’s |
| Charge time | |
| Charging Power (kW) | |
| E | Energy stored in a battery, expressed in watt-hours |
| V | voltage of the battery |
| Q | battery capacity, measured in amp-hours |
| possibilityof that n electric vehicles accept charging services | |
| S | the number of charging stations |
| λ | average arriving rate for each charging station |
| time of electric vehicle arriving and departure from one charging station | |
| predicted amounts of electric vehicles | |
| Correction factor with a range ranging from 0 to 1 | |
| Electric vehicle charging power demand (in kVA). | |
| power of a single electric vehicle in kVA. | |
| charging time of an electric vehicle per day | |
| minimum number of Electric Vehicles Charging Station | |
| maximum number of Electric Vehicles Charging Station | |
| charging station’s maximum capacity | |
| charging station’s minimum capacity | |
| planned area’s entire charging demand | |
| number of chargers in charging station | |
| capacity margin | |
| P | charging power of the chargers. |
| K | efficiency of chargers |
| t | effective charging time of the station |
| projected load | |
| LTotal | fundamental total load |
| EV charging station’s capacity | |
| ratio of charging EVs to total EV quantity in statistical likelihood | |
| stands for the average charging power | |
| CB | Capacity of battery placed in EV |
| CT | Time taken for charging EV |
| power demand by an EV | |
| The total power demand for all EVs | |
| Total Harmonic Distortion for current | |
| Total Harmonic Distortion for voltage | |
| SOC | State of Charge |
References
- Khan, W.; Ahmad, F.; Ahmad, A.; Alam, M.S. Feasibility Analysis of Electric Vehicle Charging Infrastructure Deployment in India Synthesis of Polyaniline and Highly Conducting Nanocomposite by In-Situ Polymerization and Its Characterization View Project Wireless Charging of Electric Vehicle View Project. 2017. Available online: https://www.researchgate.net/publication/316472497 (accessed on 8 March 2017).
- Archana, A.N.; Rajeev, T. EV Charging Station Allocation in a Distribution Network Based on Power Quality. In Proceedings of the 2021 IEEE Power and Energy Conference at Illinois (PECI), Urbana, IL, USA, 1–2 April 2021; pp. 1–6. [Google Scholar] [CrossRef]
- Chen, L.; Xu, C.; Song, H.; Jermsittiparsert, K. Optimal sizing and sitting of EVCS in the distribution system using metaheuristics: A case study. Energy Rep. 2021, 7, 208–217. [Google Scholar] [CrossRef]
- Lin, X.; Sun, J.; Ai, S.; Xiong, X.; Wan, Y.; Yang, D. Distribution network planning integrating charging stations of electric vehicle with V2G. Int. J. Electr. Power Energy Syst. 2014, 63, 507–512. [Google Scholar] [CrossRef]
- Teawnarong, A.; Angaphiwatchawal, P.; Sompoh, C.; Chaitusaney, S. Optimal Size of Electric Vehicle Charging Stations in Distribution System with Consideration of Bus Voltage and Line Capacity Limits. In Proceedings of the 2022 19th International Conference on Electrical Engineering/Electronics, Computer, Telecommunications and Information Technology (ECTI-CON), Prachuap Khiri Khan, Thailand, 24–27 May 2022; pp. 1–4. [Google Scholar] [CrossRef]
- Reddy, M.S.K.; Panigrahy, A.K.; Selvajyothi, K. Minimization of Electric Vehicle charging Stations influence on Unbalanced radial distribution system with Optimal Reconfiguration using Particle Swarm Optimization. In Proceedings of the 2021 International Conference on Sustainable Energy and Future Electric Transportation (SEFET), Hyderabad, India, 21–23 January 2021; pp. 1–6. [Google Scholar] [CrossRef]
- Schroeder, A.; Traber, T. The economics of fast charging infrastructure for electric vehicles. Energy Policy 2012, 43, 136–144. [Google Scholar] [CrossRef]
- Chen, Y.; Wei, W.; Zhang, F.; Liu, C.; Meng, C. Design of PV hybrid DC/AC microgrid for electric vehicle charging station. In Proceedings of the 2017 ITEC Asia-Pacific Conference, Harbin, China, 7–10 August 2017; pp. 1–6. [Google Scholar]
- Gabbar, H.A. Requirement Analysis of Fast-Charging Stations; Springer: Cham, Switzerland, 2022. [Google Scholar] [CrossRef]
- Ma, J.; Zhang, L. A deploying method for predicting the size and optimizing the location of an electric vehicle charging stations. Information 2018, 9, 170. [Google Scholar] [CrossRef]
- DISCOM. Charging Infrastructure for Electric Vehicles-Guidelines and Standards-Regarding; DISCOM: Osaka, Japan, 2020. [Google Scholar]
- Cui, Y.; Hu, Z.; Duan, X. Optimal Pricing of Public Electric Vehicle Charging Stations Considering Operations of Coupled Transportation and Power Systems. IEEE Trans. Smart Grid 2021, 12, 3278–3288. [Google Scholar] [CrossRef]
- Alkawsi, G.; Baashar, Y.; Abbas, U.D.; Alkahtani, A.A.; Tiong, S.K. Review of Renewable Energy-Based Charging Infrastructure for Electric Vehicles. Appl. Sci. 2021, 11, 3847. [Google Scholar] [CrossRef]
- Varghese, S.; Joos, G.; Ali, S.Q. Load Management Strategy for DC Fast Charging Stations. In Proceedings of the 2021 IEEE Energy Conversion Congress and Exposition (ECCE), Vancouver, BC, Canada, 10–14 October 2021; pp. 1620–1626. [Google Scholar] [CrossRef]
- Garcia-Villalobos, J.; Zamora, I.; San Martin, J.I.; Asensio, F.J.; Aperribay, V. Plug-in electric vehicles in electric distribution networks: A review of smart charging approaches. Renew. Sustain. Energy Rev. 2014, 38, 717–731. [Google Scholar] [CrossRef]
- Madathodika, A.; Shareef, H.; Achikkulath, P. Optimal Fast Charging Station Development Model Using Real Time Traffic Information. 2022. Available online: https://www.researchgate.net/publication/361137069_Optimal_Fast_Charging_Station_Development_Model_Using_Real_Time_Traffic_Information (accessed on 7 June 2022).
- Machiels, N.; Leemput, N.; Van Roy, J.; Geth, F.; Driesen, J. Design criteria for electric vehicle fast charge infrastructure based on Flemish mobility behavior. IEEE Trans. Smart Grid 2014, 5, 320–327. [Google Scholar] [CrossRef]
- Araújo, D.N.; Araujo, A.P.V.G.; Vasconcelos, A.S.M.; Castro, J.F.D.C.; Junior, W.D.A.S.; De Medeiros, L.H.A.; Da Conceicao, J.B.R.; Ji, T. Optimum Design of On-Grid PV-BESS for Fast Electric Vehicle Charging Station in Brazil. In Proceedings of the 2021 IEEE PES Innovative Smart Grid Technologies Conference—Latin America (ISGT Latin America), Virtual Event, 15–17 September 2021; pp. 1–5. [Google Scholar] [CrossRef]
- Ugirumurera, J.; Haas, Z.J. Optimal capacity sizing for completely green charging systems for electric vehicles. IEEE Trans. Transp. Electrif. 2017, 3, 565–577. [Google Scholar] [CrossRef]
- You, P.; Yang, Z. Efficient optimal scheduling of charging station with multiple electric vehicles via V2V. In Proceedings of the 2014 IEEE International Conference on Smart Grid Communications, Venice, Italy, 3–6 November 2014; pp. 716–721. [Google Scholar]
- Chartsuk, N.; Marungsri, B. Optimal fast charging station for Electric Vehicles (EVs) in Muang District, Nakhon Ratchasima, Thailand. GMSARN Int. J. 2019, 13, 26–35. [Google Scholar]
- Leone, C.; Longo, M.; Fernández-Ramírez, L. Optimal Size of a Smart Ultra-Fast Charging Station. Electronics 2021, 10, 2887. [Google Scholar] [CrossRef]
- Lokhandwala, M.; Cai, H. Siting charging stations for electric vehicle adoption in shared autonomous fleets. Transp. Res. Part D Transp. Environ. 2020, 80, 102231. [Google Scholar] [CrossRef]
- Tayyab, M.; Helm, S.; Hauer, I.; da Silva, L.N. New sizing methodology of energy storage and PV systems for electric vehicle charging stations considering voltage compensation in a low voltage grid. NEIS 2021. In Proceedings of the Conference on Sustainable Energy Supply and Energy Storage Systems, Hamburg, Germany, 13–14 September 2021; pp. 1–6. [Google Scholar]
- Abbasi, M.H.; Zhang, J. Joint Optimization of Electric Vehicle Fast Charging and DC Fast Charging Station. In Proceedings of the 2021 International Conference on Electrical, Computer and Energy Technologies (ICECET), Cape Town, South Africa, 9–10 December 2021; pp. 1–6. [Google Scholar] [CrossRef]
- Zechun, H.U. Optimal Siting and Sizing of Electric Vehicle Charging Stations; IEEE: Piscataway, NJ, USA, 2020. [Google Scholar]
- Zhu, Z.; Gao, Z.; Zheng, J.; Du, H. Charging Station Planning for Plug-In Electric Vehicles. J. Syst. Sci. Syst. Eng. 2018, 27, 24–45. [Google Scholar] [CrossRef]
- Abdullah, H.M.; Gastli, A.; Ben-Brahim, L.; Mohammed, S.O. Planning and Optimizing Electric-Vehicle Charging Infrastructure Through System Dynamics. IEEE Access 2022, 10, 17495–17514. [Google Scholar] [CrossRef]
- Ma, T.-Y.; Xie, S. Optimal fast charging station locations for electric ridesharing with vehicle-charging station assignment. Transp. Res. Part D Transp. Environ. 2021, 90, 102682. [Google Scholar] [CrossRef]
- Khaksari, A.; Tsaousoglou, G.; Makris, P.; Steriotis, K.; Efthymiopoulos, N.; Varvarigos, E. Sizing of electric vehicle charging stations with smart charging capabilities and quality of service requirements. Sustain. Cities Soc. 2021, 70, 102872. [Google Scholar] [CrossRef]
- Ge, S.; Feng, L.; Liu, H. The Planning of Electric Vehicle Charging Station Based on Grid Partition Method. 2019. Available online: https://www.sciencedirect.com/science/article/pii/S1876610219300803 (accessed on 15 March 2019).
- Goswami, R.; Tripathi, G.C. Augmentation of charging infrastructure for electric vehicles growth in India Augmentation of charging infrastructure for electric vehicles. Int. J. Electr. Hybrid Veh. 2020, 12, 44–58. [Google Scholar] [CrossRef]
Publisher’s Note: MDPI stays neutral with regard to jurisdictional claims in published maps and institutional affiliations. |
© 2022 by the authors. Licensee MDPI, Basel, Switzerland. This article is an open access article distributed under the terms and conditions of the Creative Commons Attribution (CC BY) license (https://creativecommons.org/licenses/by/4.0/).