Article

Cooperative Operation Model of Wind Turbine and Carbon Capture Power Plant Considering Benefit Distribution

School of Economics and Management, North China Electric Power University, Beijing 102206, China
*
Author to whom correspondence should be addressed.
Sustainability 2022, 14(18), 11627; https://doi.org/10.3390/su141811627
Submission received: 28 August 2022 / Revised: 12 September 2022 / Accepted: 14 September 2022 / Published: 16 September 2022

Abstract

:
Increasing systematic carbon sinks and clean energy generation proportion are the main ways to reduce the carbon emission of power system. In order to promote wind power accommodation and reduce system carbon emissions, a cooperative operation model of wind turbine and carbon capture power plant (CCPP) is constructed. Then, the model is equivalently transformed into two sub-problems. One is the operation optimization sub-problem of cooperative alliance with the goal of maximizing the alliance benefit. The other is the benefit distribution sub-problem with the goal of fair distributing cooperative benefit. To protect participants’ privacy, the alternating direction method of multipliers (ADMM) is used to realize the distributed solution of the two sub-problems. Finally, the effectiveness of the proposed model is verified by an example, and the sensitivity analysis of the alliance benefit and system carbon emission is carried out with carbon price and carbon capture cost as the sensitivity factors. The example results show that: (1) By providing up and down regulation services to wind turbines, CCPP can obtain ancillary service income and help to reduce the declaration deviation of wind turbines, which can realize multi-win-win situation. (2) Carbon price affects both thermal power units and carbon capture equipment. So, compared with carbon costs, the carbon emissions and the alliance benefit are both more sensitive to carbon price. The model of the paper is constructed under the deviation punishment mechanism, and subsequent research can be expanded in combination with a more detailed imbalance settlement mechanism.

1. Introduction

Since the 1980s, the growth of carbon emissions has led to an about 1.1 degrees Celsius increase in the average temperature of the earth. Global warming means more frequent and severe acute disasters such as heat waves and floods and intensified chronic disasters such as drought and sea-level rise. At present, many countries have made commitments to carbon neutrality. Take China as an example, the goal of carbon neutrality is endogenizing carbon constraints in the process of clean and efficient development of energy. Specifically, by 2060, the power sector will achieve deep decarburization or even negative emission [1]. To achieve this goal, the first is to develop clean energy vigorously. The second is to increase carbon sinks and carbon removal. Carbon sinks mainly refer to natural carbon sinks that fix carbon through natural ecosystems, also including technical carbon sinks. From 2010 to 2016, terrestrial ecosystem carbon sinks averaged 11.1 ± 3.8 billion tons annually in China. In the future, natural carbon sinks will increase slightly but it is difficult to double [2]. It is expected that the energy-related carbon emission in China will fall to 1.4 billion tons in 2060. However, if non-energy carbon emissions are added, it is impossible to completely rely on natural carbon sinks to achieve carbon neutrality, therefore, it is necessary to develop technical carbon sinks [3].
For the rapidly developing renewable energy represented by wind power and photovoltaics, due to the influence of natural factors such as season, terrain and weather, the output of renewable energy units is highly uncertain, resulting in a large deviation between the actual output and the planned output. The late-mover output deviation increases the difficulty and cost of power system scheduling, which will lead to the problem of energy abandonment [4]. The system dispatchers will allocate the scheduling cost to the deviation-responsibility units in the form of punishment, which will affect the income of generating units [5,6]. For carbon capture power plant (CCPP) introducing carbon capture and storage (CCS) technology, there is no process coupling between the power generation system and the carbon capture system. By controlling the energy distribution between the various units of the CCPP, the power generation and the carbon capture level can be independently adjusted. The structural characteristics and operation mechanism of the CCPP make it have good peak shaving performance and standby characteristics [7,8,9]. However, the high cost is still the main reason for restricting the large-scale construction of CCPP. The initial investment cost of carbon capture equipment is still high at present, although there is a large potential for cost reduction, from the current point of view, carbon price is difficult to cover the cost of carbon capture. For the above problems, combined with the operation characteristics of renewable energy units and CCPP, how to improve the benefit of CCPP while reducing the uncertainty of renewable energy output through the cooperative operation of them. Studying this issue is of practical significance for the green development and safe supply of power system, as well as the achievement of the carbon neutrality goals.
Under the background above, this paper constructs a cooperative operation model of wind turbine and CCPP under the deviation punishment mechanism for wind turbines. And the model is equivalently transformed into two sub-problems, which are operation optimization sub-problem and benefit distribution sub-problem. The former corresponds to the global operation optimization problem of cooperative alliance with the goal of maximizing cooperative benefit. The latter corresponds to the fair distribution of cooperative benefit. In order to protect the privacy of each subject, the alternating direction method of multipliers (ADMM) is used to realize the distributed solution to two sub-problems. The effectiveness of the proposed model and method is verified by an example. Finally, taking carbon price and carbon cost as sensitive factors, the sensitivity analysis of the alliance benefit and carbon emission of the system is carried out.

2. Literature Review

In the studies of the internal operation mechanism and flexibility enhancement mechanism of CCPP, Ref. [9] quantitatively evaluated the operational flexibility brought by carbon capture technology to traditional thermal power plants systematically and analyzed the factors affecting the flexibility of power plants. Refs. [10,11] modelled and simulated the CO2 adsorption process of the capture system after combustion in a carbon capture power plant, but they mainly focused on the internal chemical dynamic process of the adsorber. Refs. [12,13,14] studied the internal energy flow and effective operating range of CCPP and analyzed their peak shaving performance and benefits. The above studies suggest that compared with traditional thermal power plants, the flexibility improvement of CCPP mainly comes from the flexible adjustment of carbon capture equipment capturing energy consumption. Based on the studies of the operation mechanism of CCPP. Ref. [15] established a carbon capture level optimization model considering the loss of electricity sales, and used this model to calculate the carbon emission price sensitive range of CCPP, thereby realizing the optimal operation of CCPP under different carbon emission prices. Ref. [16] defined the relative carbon capture degree, by optimizing the relative carbon capture degree, decision makers can select the operation strategy of carbon capture equipment in a wider range according to actual needs and realize the flexible operation of CCPP. However, most of the above studies focus on the operation analysis and decision optimization from the independent perspective of CCPP, and lack of research on the dynamic characteristics of their participation in system scheduling.
In the studies of CCPP participating in power system scheduling, Refs. [17,18] analyzed the CCPP optimal decision-making models considering the system peak regulation service and reserve service, respectively. Ref. [19] proposed a multi-objective optimal power flow model considering CCPP, by taking the lowest coal consumption costs, carbon emissions and network loss as the research objectives. Based on the flexible operation mechanism of CCPP, the active power output characteristics and carbon emission characteristics of CCPP were analyzed in Refs. [20,21], which were incorporated into the low-carbon dispatching model. The above studies are mostly based on the perspective of independent power system dispatchers for system optimization, furthermore, when CCPP are associated with renewable energy units, it is necessary to consider the multi-agent decision-making perspective for operation optimization combined with the dynamic characteristics of CCPP.
In the studies of multi-agent decision-making in CCPP and renewable energy combined system, Refs. [22,23,24,25] taking CCPP as a flexible adjustment resource, established a combined optimization model of carbon capture unit, heat storage device, cascade hydropower stations, wind turbines, photovoltaic units, and other power resources. The results show that by flexibly adjusting the output of CCPP, the investment capacity of energy storage battery can be reduced, the utilization rate of renewable energy can be improved, and obvious emission reduction benefits and economic benefits can be obtained. Refs. [26,27] combining CO2 treatment with wind power abandonment, analyzed the direct and indirect wind power accommodation capacity of CCPP. Refs. [28,29] proposed a combined cycle operation system of carbon capture technology and electro-to-gas technology, which can realize the recycling of CO2. The basic operation mode and flexible operation mode of CO2 circulation system were also defined. The calculation results in [29] show that the combined operation of carbon capture and P2G (power-to-gas) can reduce 40% of wind curtailment and 20% of carbon emissions. Although the above studies involve the operation optimization, emission reduction effect analysis and economic benefit analysis of the joint operation system with CCPP, they pay less attention to the benefit distribution after the joint operation of CCPP and renewable energy. In fact, renewable energy generators and CCPP usually belong to different stakeholders, it is necessary to study their benefit distribution methods.

3. Operation Optimization Model of Wind Turbine and CCPP Considering Deviation Penalty

Figure 1 shows a typical energy system composed of wind turbine, thermal power unit, and carbon capture equipment, and assuming their belong to different stakeholders. In cooperative operation mode, thermal power unit and carbon capture equipment can provide up-regulation and down-regulation services to reduce wind power deviation.

3.1. Wind Turbines Operation Model

To maintain the real-time balance of the power system, the electric power dispatching center needs to call other callable units for peak regulation and frequency modulation when there is a deviation between the declared and the actual electricity quantity, which increases the dispatching cost of the system. This part of the cost is caused by the power deviation of the high-uncertainty units, and the power system scheduler will penalize the deviation of the responsible unit to compensate for the system dispatch cost. Therefore, the power deviation will affect the power sales profit of the unit. If not combined with other flexible resources, the wind turbine cannot avoid its randomness, the objective function of the wind turbine electricity declaration optimization model is maximizing the total profit expected from on-grid electricity.
max U w , 0 , * = max   n = 1 N t = 1 T λ n ( p t w 2 g g t w 2 g p t w 2 g , + g t , n w 2 g , 0 , + p t w 2 g , - g t , n w 2 g , 0 , - ) ,
where, U w , 0 , * is total electricity sales profit of wind turbine without other flexible resources; λ n is the probability that sample n occurs, n = 1 , 2 , , N , N is the number of random samples; p t w 2 g is the unit price of electricity sales to power grid by wind turbine during t period; g t w 2 g is the electric quantity sold to power grid by wind turbines without other flexible resources during t period; p t w 2 g , + and p t w 2 g , - are the penalty prices of power grid enterprises for the positive and negative electric quantity deviation respectively to wind turbines; g t , n w 2 g , 0 , + and g t , n w 2 g , 0 , - are the positive and negative deviation electric quantity of wind turbines respectively without other flexible resources in t period under the nth sample; g t w 2 c is electric quantity sold to carbon capture equipment from the wind turbine in t period; g t , n w is the forecasted power generation of wind turbines in the nth sample during t period.
In the objective function, both positive deviation and negative deviation are positive numbers, and at least one of them is 0, so:
g t , n w 2 g , 0 , + = max { g t , n w g t w 2 g , 0 } , t ,
g t , n w 2 g , 0 , - = max { g t w 2 g g t , n w , 0 } , t .
Combining with the objective function, Equations (2) and (3) can be transformed into linear constraint conditions:
g t , n w 2 g , + 0 ,
g t , n w 2 g , - 0 ,
g t , n w 2 g , 0 , + g t , n w g t w 2 g ,
g t , n w 2 g , 0 , - g t w 2 g g t , n w .
In addition, constraint conditions include the upper and lower limit constraints to unit output and ramp rate constraints:
0 g t w 2 g g w , max ,
g t + 1 w 2 g g t w 2 g Δ g w , u , max , t ,
g t w 2 g g t + 1 w 2 g Δ g w , d , max , t ,
where, g w , max is max power generation of wind turbines in unit time. Equations (9) and (10) are ramp rate constraints. Δ g w , u , max and Δ g w , d , max are allowable max rise variation and max decline variation respectively of power generation in unit time.
Thus, the original optimization model of wind turbines can be expressed as:
max n = 1 N t = 1 T λ n ( p t w 2 g g t w 2 g p t w 2 g , + g t , n w 2 g , 0 , + p t w 2 g , - g t , n w 2 g , 0 , - ) ,
In addition to this, the model (11) also includes constraints Equations (4)–(10).
When there are negative deviations, the actual power generation of wind turbines is less than the planned. When there are positive deviations, the actual power generation of wind turbines is greater than the planned. To avoid deviation penalty, combined wind turbines obtain the up and down regulation services from thermal power unit and carbon capture equipment, respectively. Wind turbines need to pay for ancillary services. Therefore, the operation model is as follows:
max U w = U w 2 g U h 2 w U c 2 w ,
U w 2 g = n = 1 N t = 1 T λ n ( p t w 2 g g t w 2 g p t w 2 g , + g t , n w 2 g , + p t w 2 g , - g t , n w 2 g , - )   ,
U h 2 w = t = 1 T g t w 2 h p w 2 h ,
U c 2 w = t = 1 T g t w 2 c p w 2 c ,
g t , n w 2 g , + g t , n w g t w 2 g g t w 2 c ,
g t , n w 2 g , - g t w 2 g g t , n w g t w 2 h ,
g t , n w 2 g , + 0 , g t , n w 2 g , - 0 ,
g t w 2 c 0 , g t w 2 h 0 ,
where, U w is profit of wind turbine after combined with other flexible resources; U w 2 g is the income of wind turbines electricity sold to power grid after combined with other flexible resources; U c 2 w is the income obtained by carbon capture equipment selling down-regulation service to wind turbine; U h 2 w is the income obtained by thermal power units selling up- regulation service to wind turbines; g t , n w 2 g , + and g t , n w 2 g , - are positive and negative deviation of wind turbine after combined with other flexible resources, respectively, under the sample n in t period; g t w 2 h is the electric quantity of up- regulation service purchased by wind turbines from thermal power units during t period; p w 2 h is the unit price of up-regulation service purchased by wind turbines from thermal power units; g t w 2 c is the electric quantity of down-regulation service purchased by wind turbines from carbon capture equipment during t period; p w 2 c is the unit price of down- regulation service purchased by wind turbines from carbon capture equipment.

3.2. Thermal Power Unit Operation Model

The regulation electric quantity sold to wind turbines is essentially incremental electric quantity for thermal power unit and carbon capture equipment. So, they need to maximize the incremental profit of the electric quantity. The profit model of thermal power units is:
max U h = U h 2 w t = 1 T g t h 2 w ( c h + δ h p t c ) ,
0 g t h + g t h 2 w g h , max ,
g t + 1 h + g t + 1 h 2 w ( g t h + g t h 2 w ) Δ g h , u , max ,
g t h + g t h 2 w ( g t + 1 h + g t + 1 h 2 w ) Δ g h , d , max ,
where, U h is the incremental profit of thermal power unit; g t h 2 w is the up- regulation electric quantity sold to wind turbines by thermal power unit in t period; δ h is carbon emission intensity of thermal power unit; c h is the unit electric cost of thermal power units; p t c is carbon price in t period carbon market. g t h is planned power generation of thermal power unit in t period; g h , max is the max power generation in unit time of thermal power unit; Δ g h , u , max is the max up-regulation power generation in unit time of thermal power unit; Δ g h , d , max the max down-regulation power generation in unit time of thermal power unit.

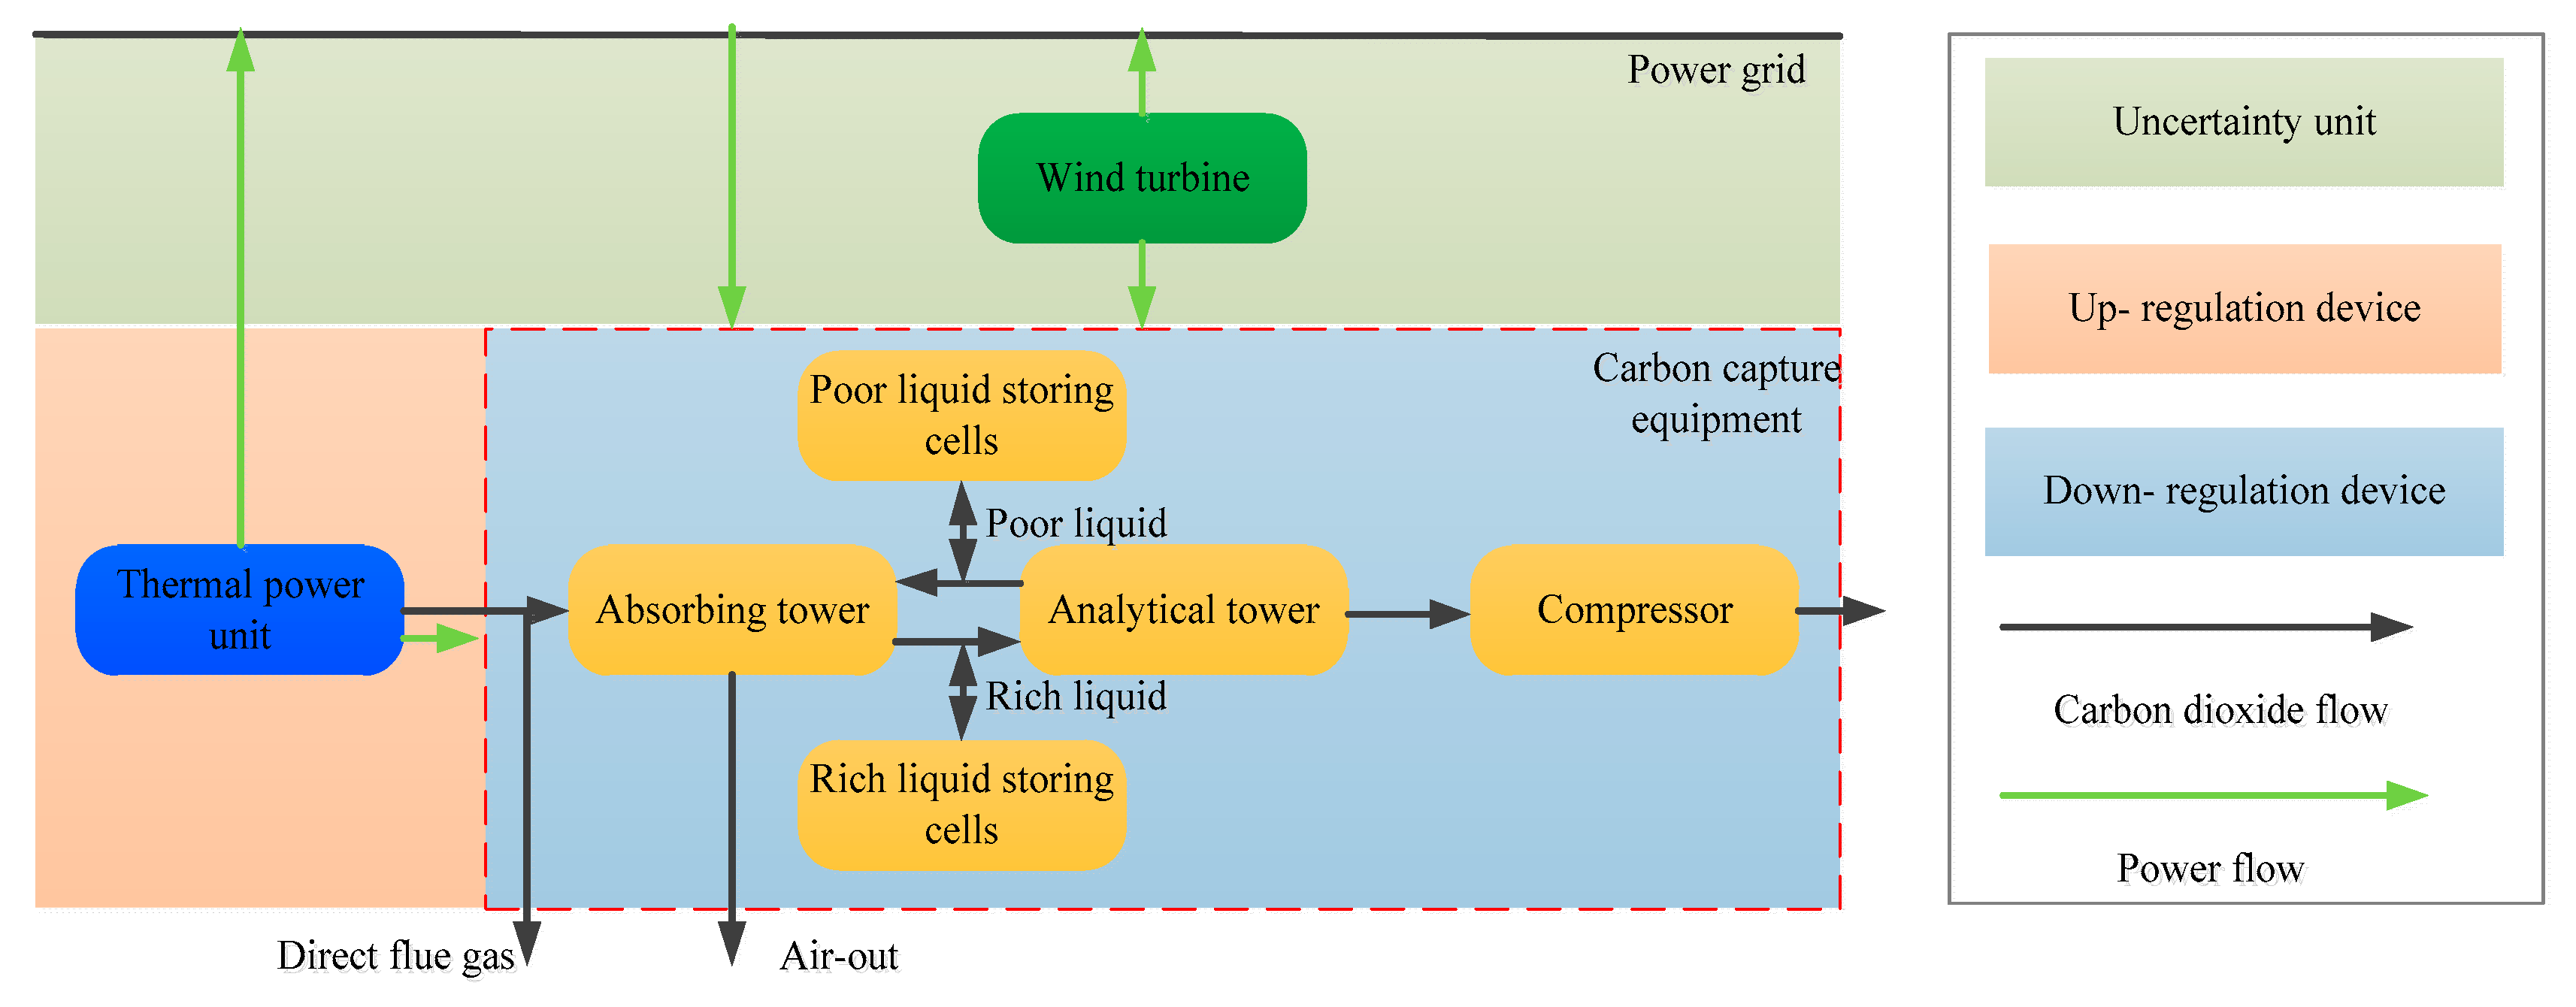
3.3. Carbon Capture Equipment Operation Model

Carbon capture equipment needs to maximize the incremental profit of selling down- regulation services. Its profit model is:
max U c = U c 2 w + t = 1 T g t c 2 w δ c ( p t c + s c c c ) ,
0 g t c + g t c 2 w g c , max ,
g t + 1 c + g t + 1 c 2 w ( g t c + g t c 2 w ) Δ g c , u , max ,
g t c + g t c 2 w ( g t + 1 c + g t + 1 c 2 w ) Δ g c , d , max ,
where, U c is the incremental profit of carbon capture equipment; g t c 2 w is the down- regulation electric quantity sold to wind turbine by carbon capture equipment in t period; δ c is the electricity-CO2 transformation factor of carbon capture equipment; s c is the unit subsidy for carbon capture equipment capturing CO2; c c is the unit cost of carbon capture equipment capturing CO2; g t c is planned electricity consumption of carbon capture equipment; g c , max is the max electricity consumption of carbon capture equipment in unit time; Δ g c , u , max is the max up-regulation electricity consumption of carbon capture equipment in unit time; Δ g c , d , max is the max down-regulation electricity consumption of carbon capture equipment in unit time.

4. Multi-Agent Cooperative Nash Bargaining Model of Wind Turbine and CCPP

As independent rational individuals, all participants hope to reach a consensus through negotiations, and seek a balanced strategy to maximize the benefits of all participants. How to determine the transaction electricity and transaction price reasonably is the focus of all participants.

4.1. The Basic Principle of Nash Bargaining

Nash bargaining theory belongs to the cooperative game, which can take into account both individual and collective interests. The solution that maximizes the Nash product in Equation (28) is the equilibrium solution of the Nash bargaining game problem. The Nash bargaining solution can make participants of cooperative alliance obtain the Pareto optimal benefits.
{ max i = 1 I ( U i U i 0 ) s . t . U i U i 0 ,
where, I is the count of participants in negotiations; U i is benefits of participant i; U i 0 is the disagreement point, namely the benefit before the cooperation negotiation of participants; U i U i 0 represents the benefit of negotiation participants i is enhanced through cooperation. The goal of Nash bargaining is to maximize the benefit enhancements for all partners.

4.2. Wind Turbine and CCPP Cooperative Operation Nash Bargaining Model

Using Nash bargaining principle to research the cooperative operation among wind turbine, thermal power unit, and carbon capture equipment:
{ max i = 1 I ( U w U w , 0 , * ) U h U c s . t . U w U w , 0 , * U h 0 U c 0 ,
where, U w , 0 , * is the optimal operating profit of the wind turbine without cooperation, namely Nash bargaining disagreement point. Thermal power unit and carbon capture equipment consider profit increment in negotiation, so their disagreement point is zero. In addition, the model (29) also includes Equations (12)–(27).

4.3. Equivalent Conversion of Cooperative Operation Nash Bargaining Model

Essentially, the Nash bargaining cooperative game model Equation (29) is a non-convex nonlinear optimization problem, which is difficult to solve directly. In this paper, a series of equivalent transformations of the model was done. Then, the model was converted into the following two easily solved sub-problems, which are operation optimization sub-problem and benefit distribution sub-problem. The optimal solution of the original problem Equation (29) can be obtained by solving two subproblems in turn.
When finding the maximum value of model (29), it needs to satisfy three conditions for the mean inequality: variables in the inequality are positive, the sum of variables in the inequality is constant, and when variables in the inequality equaling, the inequality becomes a equality. It is easy to know that the objective function of model (29) satisfies the first condition. If the value of ( U w U w , 0 , * ) + U h + U c is a constant, namely satisfying the second condition, the objective function of model (29) can obtain the maximum. Because U w , 0 , * is constant, and:
( U w U w , 0 , * ) + U h + U c = U w + U h + U c U w , 0 , * .
So, if U w + U h + U c is constant, the condition to make the inequality become an equality can be satisfied. Furthermore, the larger the value of U w + U h + U c , the larger the objective function value of model (29) is. Introduce process variables ω h , ω w and ω c :
{ ω h = t = 1 T g t h 2 w ( c h + δ h p t c ) ω w = U w 2 g ω c = t = 1 T g t c 2 w δ c ( p t c + s c c c ) ,  
Then:
( U w U w , 0 ) + U h + U c = ω w + ω h + ω c U w , 0 .
Thus, the alliance benefit maximization problem can be transformed into operation optimization sub-problem.
{ max ω w + ω h + ω c s . t . ω h = t = 1 T g t h 2 w ( c h + δ h p t c ) ω w = U w 2 g ω c = t = 1 T g t c 2 w δ c ( p t c + s c c c ) g t c 2 w = g t w 2 c g t h 2 w = g t w 2 h .
In addition to this, Model (33) also includes constraints Equations (13), (16)–(19), (21)–(23), (25)–(27). Model (33) essentially maximizes the overall benefits of the multi-agent cooperative alliance. It can be seen from Equations (32) and (33) that in the alliance benefit maximization model, regulation service transaction volume g t h 2 w and g t c 2 w offset each other in the superposition process. So, if establishing the total benefit maximization model of the alliance directly, regulation service transactions volume among the participants will offset in superposition, which induces the sum of regulated service transactions cannot be determined. It is one of the necessary reasons for introducing the Nash bargaining model in this paper. By solving sub-problem 2, the regulation service transaction price and transaction amount can be determined. Values ω w , * , ω h , *   and ω c , * can be obtained by solving sub-problem 1. Insert them into Equation (28):
{ max ( ω w , * U h 2 w U c 2 w U w , 0 , * ) ( ω h , * + U h 2 w ) ( ω c , * + U c 2 w ) s . t . ω w , * + U w 2 c U h 2 w U w , 0 , * ω h , * + U h 2 w 0 ω c , * + U c 2 w 0 .
In addition to this, the model (34) also includes Equations (14) and (15).
The natural logarithmic function is a strictly monotonically increasing convex function. Take the logarithm of Equation (34) and convert the original problem from maximizing to minimizing. Then, model (34) is equivalent to the following benefit distribution sub-problem.
{ min [ ln ( ω w , * U h 2 w U c 2 w U w , 0 , * ) + ln ( ω h , * + U h 2 w ) + ln ( ω c , * + U c 2 w ) ]   s . t . ω w , * + U w 2 c U h 2 w U w , 0 , * ω h , * + U h 2 w 0 ω c , * + U c 2 w 0 .
In addition to this, the model (35) also includes Equations (14) and (15).

5. Solution of Wind Turbine and CCPP Cooperative Nash Bargaining Model

To protect the privacy of the participants involved in the negotiation, the alternating direction multiplier method (ADMM) is used to solve the sub-problems. Because the ADMM algorithm has good convergence, simple form and strong robustness, it is often used to solve the optimization problem with separable variables. The detailed solution idea is shown in reference [30].

5.1. Solution of Operation Optimization Sub-Problem Based on ADMM

For the alliance benefit maximization model (33), first, ream that:
{ g ¯ t h 2 w = g t h 2 w g ¯ t c 2 w = g t c 2 w g ¯ t w 2 h = g t w 2 h g ¯ t w 2 c = g t w 2 c .
where, g ¯ t h 2 w and g ¯ t c 2 w are regulation electricity quantity sold to wind turbine by carbon capture equipment and thermal power unit respectively in t period; g ¯ t w 2 h and g ¯ t w 2 c are regulation electricity quantity purchased by wind turbine from carbon capture equipment and thermal power unit respectively in t period. When g ¯ t h 2 w = g ¯ t w 2 h and g ¯ t c 2 w = g ¯ t w 2 c , it shows that they negotiate a consensus on regulation services trade.
Then, take the inverse value of the objective function in (33), and convert the model from maximizing to minimizing. By introducing Lagrange multipliers and penalty factors, the augmented Lagrangian function of the model (33) objective function can be obtained.
L = ( ω w + ω h + ω c ) + t = 1 T λ t wc ( g ¯ t c 2 w g ¯ t w 2 c ) + t = 1 T λ t wh ( g ¯ t h 2 w g ¯ t w 2 h ) + ρ wc 2 t = 1 T g ¯ t c 2 w g ¯ t w 2 c 2 2 + ρ wh 2 t = 1 T g ¯ t h 2 w g ¯ t w 2 h 2 2
According to the principle of ADMM algorithm, the Equation (37) can be decomposed to obtain the distributed optimization operation models of wind turbine, thermal power unit, and carbon capture equipment:
(1)
Distributed optimal operation model of wind turbine
min n = 1 N t = 1 T λ n ( g t , n w c w p t w 2 g g t w 2 g + p t w 2 g , + g t , n w 2 g , + + p t w 2 g , - g t , n w 2 g , - ) + t = 1 T λ t wc ( g ¯ t c 2 w g ¯ t w 2 c ) + t = 1 T λ t wh ( g ¯ t h 2 w g ¯ t w 2 h ) + ρ wc 2 t = 1 T g ¯ t c 2 w g ¯ t w 2 c 2 2 + ρ wh 2 t = 1 T g ¯ t h 2 w g ¯ t w 2 h 2 2
In addition to this, the model (38) also includes Equations (16)–(19).
(2)
Distributed optimal operation model of thermal power unit
min t = 1 T g t h 2 w ( c h + δ h p t c ) + t = 1 T λ t wh ( g ¯ t h 2 w g ¯ t w 2 h ) + ρ wh 2 t = 1 T g ¯ t h 2 w g ¯ t w 2 h 2 2 .
In addition to this, the model (39) also includes Equations (21)–(23).
(3)
Distributed optimal operation model of carbon capture equipment
min t = 1 T g t w 2 c δ c ( c c p t c ) + t = 1 T λ t wc ( g ¯ t c 2 w g ¯ t w 2 c ) + ρ wc 2 t = 1 T g ¯ t c 2 w g ¯ t w 2 c 2 2 .
In addition to this, the model (40) also includes Equations (25)–(27).
First, the distributed algorithm 1 is established for the operation optimization sub-problem of cooperative alliance, the specific steps are as follows:
(1) Setting the max iterations times is k max = 50 . Convergence precision is ξ = 10 5 . Penalty factors are ρ wc = ρ wh = 10 4 . Iteration times is initialized to k = 0 . Initial regulation service electricity expected by carbon capture equipment and thermal power unit to wind turbine are g ¯ t , k c 2 w = g ¯ t , k h 2 w = 0 . Lagrange multipliers are λ t wc = λ t wh = 0 .
(2) For wind turbine, according to regulation service electricity g ¯ t , k c 2 w and g ¯ t , k h 2 w expected by carbon capture equipment and thermal power unit to provide, solve model (38) and obtain regulation service electricity g ¯ t , k + 1 w 2 h and g ¯ t , k + 1 w 2 c expected to be purchased.
(3) For thermal power unit, according to up-regulation service electricity g ¯ t , k + 1 w 2 h expected by wind turbine to purchase, solve model (39) and obtain regulation service electricity g ¯ t , k + 1 h 2 w expected to be sold.
(4) For carbon capture equipment, according to down- regulation service electricity g ¯ t , k + 1 w 2 c expected by wind turbine to purchase, solve model (39) and obtain regulation service electricity g ¯ t , k + 1 c 2 w expected to be sold.
(5) Update Lagrange multipliers according to Equation (41):
{ λ t , k + 1 wh = λ t , k wh + ρ wh ( g ¯ t , k + 1 h 2 w g ¯ t , k + 1 w 2 h ) λ t , k + 1 wc = λ t , k wc + ρ wc ( g ¯ t , k + 1 c 2 w g ¯ t , k + 1 w 2 c ) .
(6) Update iterations times: k = k + 1;
(7) Judging convergence of the algorithm, if the termination condition (42) of iterative is satisfied, the iteration terminates.
{ max ( t = 1 T g ¯ t c 2 w g ¯ t w 2 c 2 2 , t = 1 T g ¯ t h 2 w g ¯ t w 2 h 2 2 ) < ξ or k > k max ,
Otherwise step 2 is repeated, until the convergence condition or the max iterations times is satisfied.

5.2. Solution of Benefit Distribution Sub-Problem Based on ADMM

By solving the operation optimization sub-problem, the optimal expected transaction regulation electricity between wind turbine and carbon capture, wind turbine and thermal can be obtained as g ¯ t w 2 c , * and g ¯ t w 2 h , * simultaneously.
According to Equations (14), (15), and (36), regulation electricity trading volume U h 2 w and U c 2 w can be expressed as:
{ U h 2 w = t = 1 T g ¯ t w 2 h , * p w 2 h U c 2 w = t = 1 T g ¯ t w 2 c , * p w 2 c ,
Substituting Equation (43) into benefit distribution model (35), it can obtain:
{ min [ ln ( ω w , * t = 1 T g ¯ t w 2 c , * p w 2 c t = 1 T g ¯ t w 2 h , * p w 2 h U w , 0 , * ) + ln ( ω h , * + t = 1 T g ¯ t w 2 h , * p w 2 h ) + ln ( ω c , * + t = 1 T g ¯ t w 2 c , * p w 2 c ) ]   s . t . ω w , * + t = 1 T g ¯ t w 2 c , * p w 2 c t = 1 T g ¯ t w 2 h , * p w 2 h U w , 0 , * ω h , * + t = 1 T g ¯ t w 2 h , * p w 2 h 0 ω c , * + t = 1 T g ¯ t w 2 c , * p w 2 c 0
With the principle of ADMM algorithm, introducing ancillary variable p ¯ w 2 c , p ¯ w 2 c , p ¯ c 2 w and p ¯ h 2 w to decouple transaction price. p ¯ w 2 c and p ¯ w 2 c are unit price of regulation service expected by wind turbine to purchase from carbon capture equipment and thermal power unit respectively; p ¯ c 2 w and p ¯ h 2 w are the unit price of regulation service expected by carbon capture equipment and thermal power unit to wind turbine. So, the augmented Lagrangian function of the model (44) objective function can be expressed as:
min [ ln ( ω w , * + t = 1 T g ¯ t w 2 c , * p ¯ w 2 c t = 1 T g ¯ t w 2 h , * p ¯ w 2 h U w , 0 , * ) + ln ( ω h , * + t = 1 T g ¯ t w 2 h , * p ¯ h 2 w ) + ln ( ω c , * t = 1 T g ¯ t w 2 c , * p ¯ c 2 w ) ] + t = 1 T γ t wc ( p ¯ c 2 w p ¯ w 2 c ) + t = 1 T γ t wh ( p ¯ h 2 w p ¯ w 2 h ) + ψ wc 2 t = 1 T p ¯ c 2 w p ¯ w 2 c 2 2 + ψ wh 2 t = 1 T p ¯ h 2 w p ¯ w 2 h 2 2
According to the principle of ADMM algorithm decomposition, Equation (45) can be decomposed to obtain the distributed optimization models for the regulation service price of wind turbine, thermal power unit, and carbon capture equipment:
(1)
Distributed optimal operation model of wind turbine
{ min [ ln ( ω w , * + t = 1 T g ¯ t w 2 c , * p ¯ w 2 c t = 1 T g ¯ t w 2 h , * p ¯ w 2 h U w , 0 , * ) + t = 1 T γ t wc ( p ¯ c 2 w p ¯ w 2 c ) + t = 1 T γ t wh ( p ¯ h 2 w p ¯ w 2 h ) + ψ wc 2 t = 1 T p ¯ c 2 w p ¯ w 2 c 2 2 + ψ wh 2 t = 1 T p ¯ h 2 w p w 2 h 2 2 s . t . ω w , * + t = 1 T g ¯ t w 2 c , * p ¯ w 2 c t = 1 T g ¯ t w 2 h , * p ¯ w 2 h U w , 0 , * .
(2)
Distributed optimal operation model of thermal power unit
{ min ln ( ω h , * + t = 1 T g ¯ t w 2 h , * p ¯ h 2 w ) + t = 1 T γ t wh ( p ¯ h 2 w p ¯ w 2 h ) + ψ wh 2 t = 1 T p ¯ h 2 w p ¯ w 2 h 2 2 s . t . ω h , * + t = 1 T g ¯ t w 2 h , * p ¯ h 2 w 0 .
(3)
Distributed optimal operation model of carbon capture equipment
{ min ln ( ω c , * t = 1 T g ¯ t w 2 c , * p ¯ c 2 w ) + t = 1 T γ t wc ( p ¯ c 2 w p ¯ w 2 c ) + ψ wc 2 t = 1 T p ¯ c 2 w p ¯ w 2 c 2 2 s . t . ω c , * t = 1 T g ¯ t w 2 c , * p ¯ c 2 w 0 .
The distributed algorithm 2 is established for benefit distribution sub-problem. The specific steps are as follows:
(1) Setting the max iterations times is k max = 50 . Convergence precision is ξ = 10 8 . Penalty factors are ψ wc = ψ wh = 1 . Iteration times is initialized to k = 0 . Initial regulation service price expected by carbon capture equipment and thermal power unit to wind turbine are p ¯ k c 2 w = p ¯ k h 2 w = 0 . Lagrange multipliers are γ t wc = γ t wh = 0 .
(2) For wind turbine, according to regulation service price p ¯ k h 2 w and p ¯ k c 2 w expected by carbon capture equipment and thermal power unit, solve model (46) and obtain regulation service price p ¯ k + 1 w 2 h and p ¯ k + 1 w 2 h expected to pay.
(3) For thermal power unit, according to the regulation service price p ¯ k + 1 w 2 h expected by wind turbine, solve model (47) and obtain the regulation service price p ¯ k + 1 h 2 w expected to sell.
(4) For carbon capture equipment, according to the regulation service price p ¯ k + 1 w 2 c expected by wind turbine, solve model (48) and obtain the regulation service price p ¯ k + 1 c 2 w expected to sell.
(5) Update Lagrange multipliers according to Equation (49):
{ γ t , k + 1 wh = γ t , k wh + ψ wh ( p ¯ k + 1 h 2 w p ¯ k + 1 w 2 h ) γ t , k + 1 wc = γ t , k wc + ψ wc ( p ¯ k + 1 c 2 w p ¯ k + 1 w 2 c ) .
(6) Update iterations times: k = k + 1;
(7) Judging convergence of the algorithm, if the termination condition (50) of iterative is satisfied, the iteration terminates.
{ max ( t = 1 T p ¯ c 2 w p ¯ w 2 c 2 2 , t = 1 T p ¯ h 2 w p ¯ w 2 h 2 2 ) < ξ or k > k max ,
Otherwise step 2 is repeated, until the convergence condition or the max iterations times is satisfied.

6. Case Analysis

6.1. Optimization Results of Independent Operation

In this paper, a 200 MW wind turbine was selected as the analysis object. The average value of typical daily wind speed in 12 months of a city was selected as the mean value of wind speed probability distribution. The standard deviation of wind speed data in each period was set to 0.65~0.95 m/s. The relationship between a wind turbine output and the wind speed shows as Equation (A1). Then, 1000 groups of sample data were generated by Monte Carlo simulation.
Based on the parameters of the wind turbine, the output of each period under 1000 sets of samples was calculated. IBM SPSS Statistics 21 software was used to cluster the wind turbine output data by k-means clustering method. 10 groups of basic sample data were generated by clustering and the corresponding probability values of different samples were calculated. The parameters of wind turbine and 10 groups of basic output sample data are in Table A1, Table A2 and Table A3.
Based on the above clustering samples, Matlab R2020a software and Yalmip optimization toolbox were used to optimize the uncombined wind turbine electricity quantity declaration firstly. The optimization results are shown in Table 1:
In Table 1, based on the generation data and price data of the wind turbine in this paper, when the wind turbine was not combined with other flexible resources, decision makers of wind turbine chose to declare according to the maximum output during 12–24 periods. Further, based on the optimal declaration of electricity quantity, the positive and negative deviation electricity quantity in each period (based on the weighted results of sample occurrence probability) is as follows:
From Figure 2 and Figure 3, the on-grid electricity benefit of the uncombined wind turbine is 302,320 yuan. However, when the wind turbine pursuits profit maximized, there would be a large deviation between the declared electricity quantity and the actual electricity quantity, which would increase the cost of power system rescheduling and be disadvantageous to the safe and stable operation of power system. In addition, under the same penalty price for positive and negative deviation, the declared electricity quantity of the wind turbine was virtually high, that was, the negative deviation was significantly higher than the positive deviation.

6.2. Optimization Results of Cooperative Operation

Assuming that the planned power generation/consumption is half of the maximum power generation/consumption, the ADMM algorithm was used to realize the distributed solution of the two sub-problems. Relevant parameters for thermal power unit and carbon capture equipment were set out in Table A4. Figure 4 shows convergence results of various participants’ benefit and alliance benefit. The algorithm converges after 12 iterations and the solving is highly efficient.
The total benefit of the alliance is 454,241 yuan in cooperative operation. Because thermal power unit and carbon capture equipment had incremental benefits, the total benefit of the combined system increased by 151,921 yuan. For the combined system, its increased benefit was from the decreased deviation penalty to the wind turbine, that was, the declaration deviation of the wind turbine was decreased in the case of thermal power unit and carbon capture equipment providing regulation services. The electricity declaration positive and negative deviation of the wind turbine are shown in Figure 5 and Figure 6.
When the wind turbine was not combined with other resources, the weighted sum of the wind turbine declaration positive deviation and declaration negative deviation were 114.31 MWh and 2032.70 MWh, respectively, with a total of 2147.01 MWh. After the wind turbine combined with thermal power unit and carbon capture equipment, the weighted sum of the wind turbine declaration positive deviation and declaration negative deviation were 599.49 MWh and 746.42 MWh, respectively, with a total of 1345.91 MWh. Compared with the uncombined case, the declaration deviation of the wind turbine was reduced by 801.10 MWh after combination.
The up-regulation electricity provided by thermal power unit and the down-regulation electricity provided by carbon capture equipment (expressed by negative number) are shown in Figure 7. To obtain more on-grid electricity income, the wind turbine had more negative deviation of electricity declaration before the league. So, thermal power unit provided a lot of up-regulation service to the wind turbine in period with more negative deviation, the trading volume was greater. Similarly, the wind turbine chose to trade with carbon capture equipment in 1, 3–9 periods with large positive deviation. By providing up and down regulation services, thermal power unit and carbon capture equipment obtained ancillary service income and reduced the declaration deviation of the wind turbine, which achieved tripartite win-win. In addition, the randomness of the wind turbine was reduced, which would also reduce the difficulty of power system rescheduling and improve the safety and reliability of power system.
Furthermore, Figure 8 shows the convergence results of regulation service transaction price in benefit distribution sub-problem. It can be seen that the algorithm converges after 11 and 14 iterations, respectively, which shows that the distributed algorithm, based on the ADMM, has good convergence characteristics for solving both operation optimization problem and benefit distribution problem. By the algorithm, the distributed and efficient solution of the two sub-problems can be realized while protecting the privacy information of each participant.
According to the convergence results, the transaction price of up-regulation service between the wind turbine and thermal power unit was 415.455 ¥/MWh. The transaction price of down-regulation service between the wind turbine and carbon capture equipment was 191.562 ¥/MWh. On the transaction electricity quantity of each participant, it could be calculated that the increased income of the wind turbine, thermal power unit and carbon capture equipment, which were 17,875 yuan, 120,770 yuan and 13,275 yuan, respectively. All participants had increased income.

6.3. Sensitivity Analysis

As an emerging technology, carbon capture has high technical iteration speed and great potential for cost reduction. According to the Annual Report of China Carbon Dioxide Capture Utilization and Storage (2021), the post-combustion capture cost in China will fall from 230–310 ¥/ton in 2025 to 190–280 ¥/ton and 70–120 ¥/ton in 2030 and 2060, respectively. In addition, for carbon capture projects, policy subsidy is an important part of cost recovery and an important way to reduce costs, especially in the early stages of technological development. In May 2021, China National Development and Reform Commission issued Pollution Control and Energy Conservation and Carbon Reduction within the Central Budget Investment Special Management Approach, which pointed out that investment in energy saving and carbon reduction projects did not exceed 15 per cent of total investment, and the central and national authorities provide full subsidies of 15 per cent for related projects. That is, China will provide subsidies for energy saving and carbon reduction projects, including carbon capture projects, up to 15% of the investment. In carbon capture revenue, the main revenue source is carbon market transactions. At present, carbon price level is low in China. According to the 2020 China Carbon Price Survey jointly issued by China Carbon Forum and ICF International Consulting Company, the average price of carbon market in China is expected to rise from 49 ¥/ton in 2020 to 71 ¥/ton in 2025, and to 93 ¥/ton in 2030.The average price expected in 2050 is 167 ¥/ton.
Unit cost and benefits of thermal power unit and wind turbine are relatively fixed, and their future changes will not be large. So, taking carbon cost and carbon price as sensitive factors, the corresponding changes of the system total benefit and carbon emissions under the sensitive factors changing were analyzed respectively. Carbon cost is essentially the difference between carbon capture costs and subsidy. The calculation results are shown in Figure 9.
Figure 9 shows corresponding changes of the system carbon emissions with carbon cost and carbon price changing. The carbon emissions show a downtrend. At the carbon price of 150–200 ¥/ton, the system carbon emission was negative, that is, the carbon captured quantity of carbon capture system was greater than the emission of thermal power unit at this point. In this time, the system was in increasing carbon sink state, and the system carbon emission was relatively insensitive to carbon cost. This was because compared with carbon cost, carbon price affects both thermal power unit and carbon capture equipment.
Figure 10 shows corresponding changes of the alliance benefit with carbon cost and carbon price changing. Same as system carbon emissions, the alliance benefit was also more sensitive to carbon price. With the carbon price increasing, the alliance benefit decreased significantly. When the carbon price and carbon cost were 200 ¥/ton, the alliance benefit reached the lowest level, which was 316,627 yuan. However, due to the premise of Nash equilibrium, the lowest alliance benefit was more than the independent operation benefit of wind turbine (302,320 yuan). Alliance participants were still profitable.
In summary, it can be known that compared with carbon cost decreasing, carbon price is the key factor affecting carbon emission and benefit of the alliance. Since thermal power unit are also affected by carbon prices, it can also be extended to the following conclusion. Under the goal to minimize carbon emissions of the alliance of wind turbines and CCPP, the policy-based emission-reducing effect by simply subsidizing to increase carbon sinks is worse than the market-based emission-reducing effect by improving carbon price. Further, the primary task of promoting the development of carbon capture technology is to promote the development of the carbon market and attract more entities to participate in carbon trading, so that carbon capture equipment can obtain reasonable benefits to support its sustainable development.

7. Conclusions

(1)
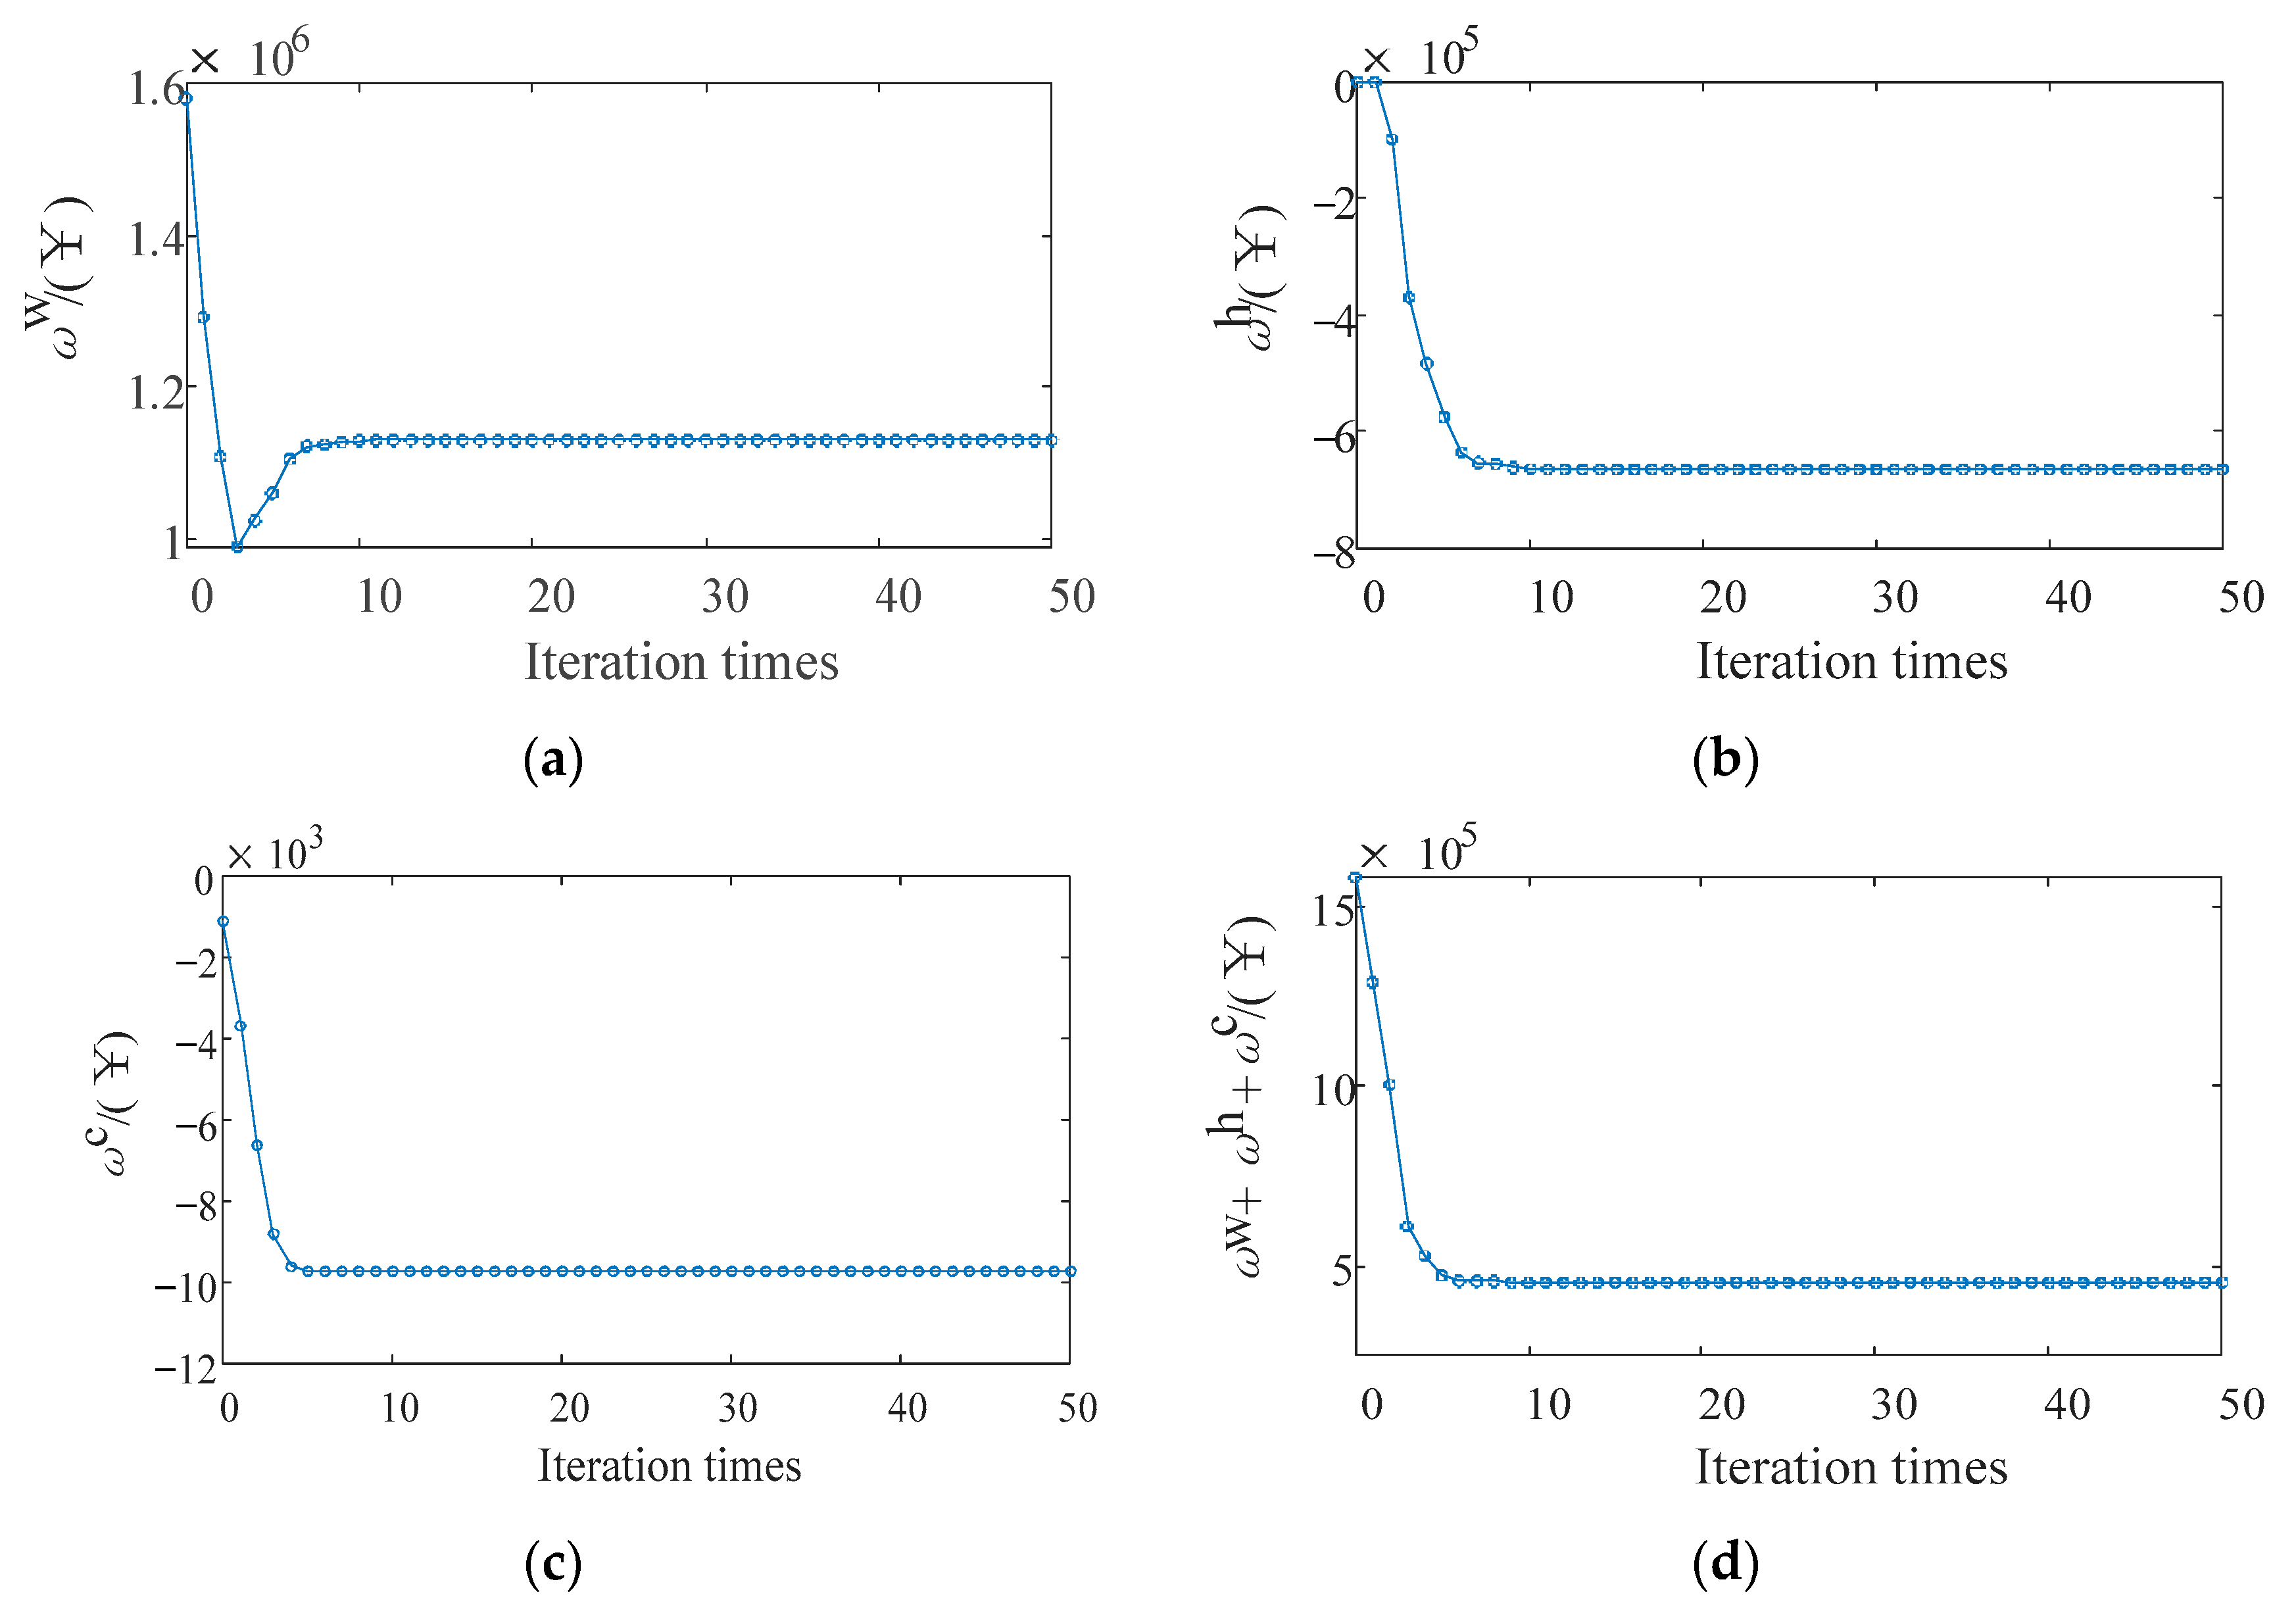
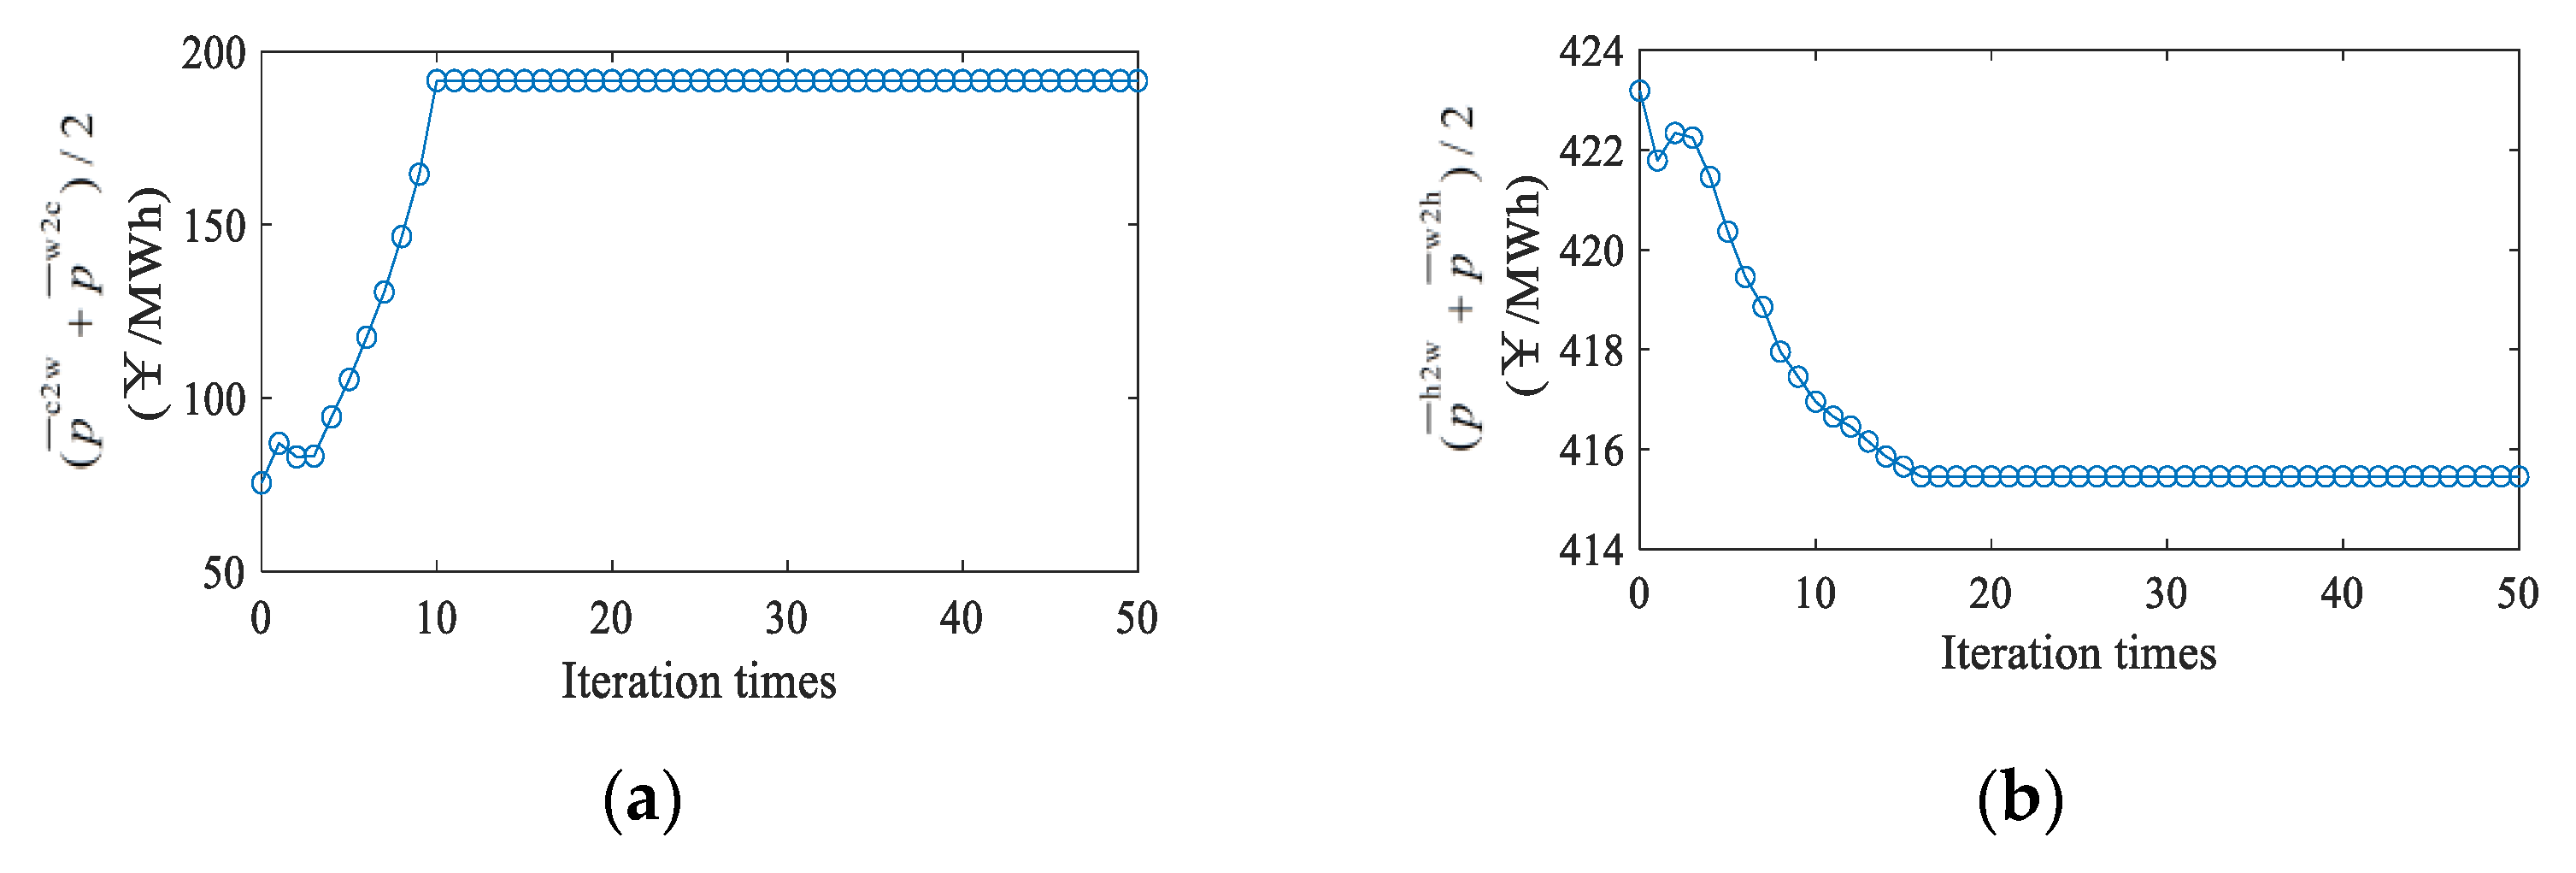
In this paper, the cooperative operation model of wind turbine and CCPP is converted into the operation optimization sub-problem and the benefit distribution sub-problem. The proposed distributed algorithm, based on the ADMM, has good convergence characteristics for solving above problems and can make the distributed and efficient solution of the two sub-problems realized while protecting the privacy information of each participant.
(2)
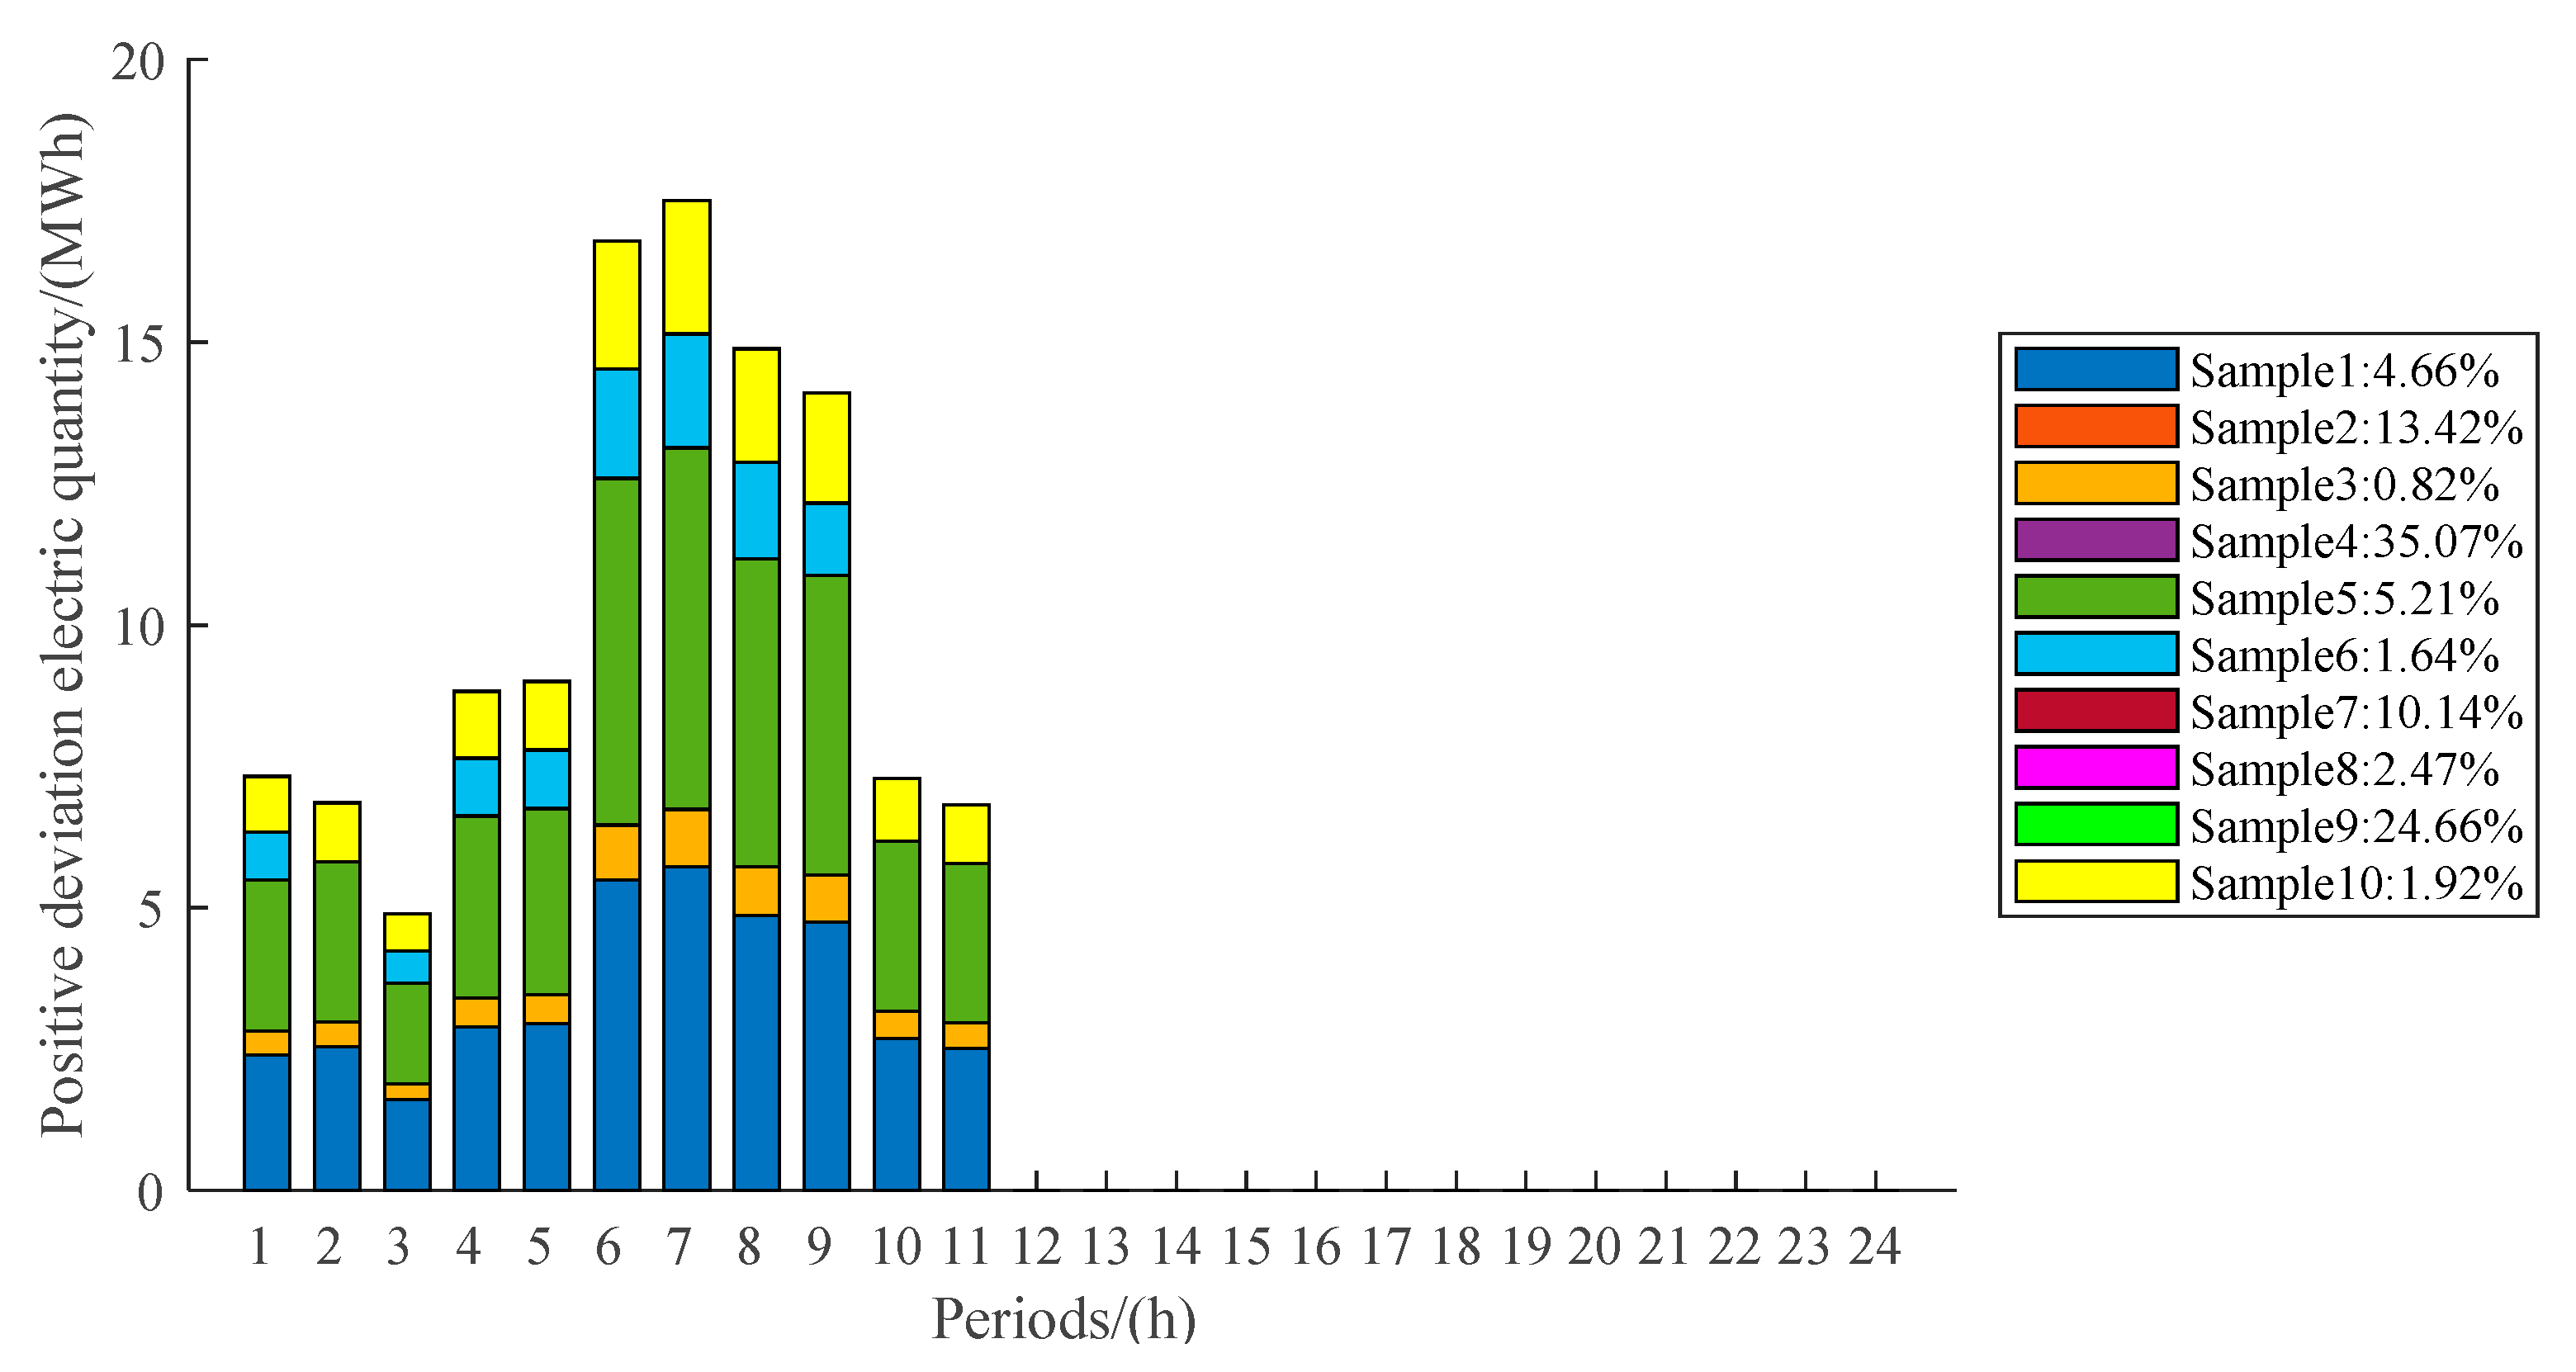
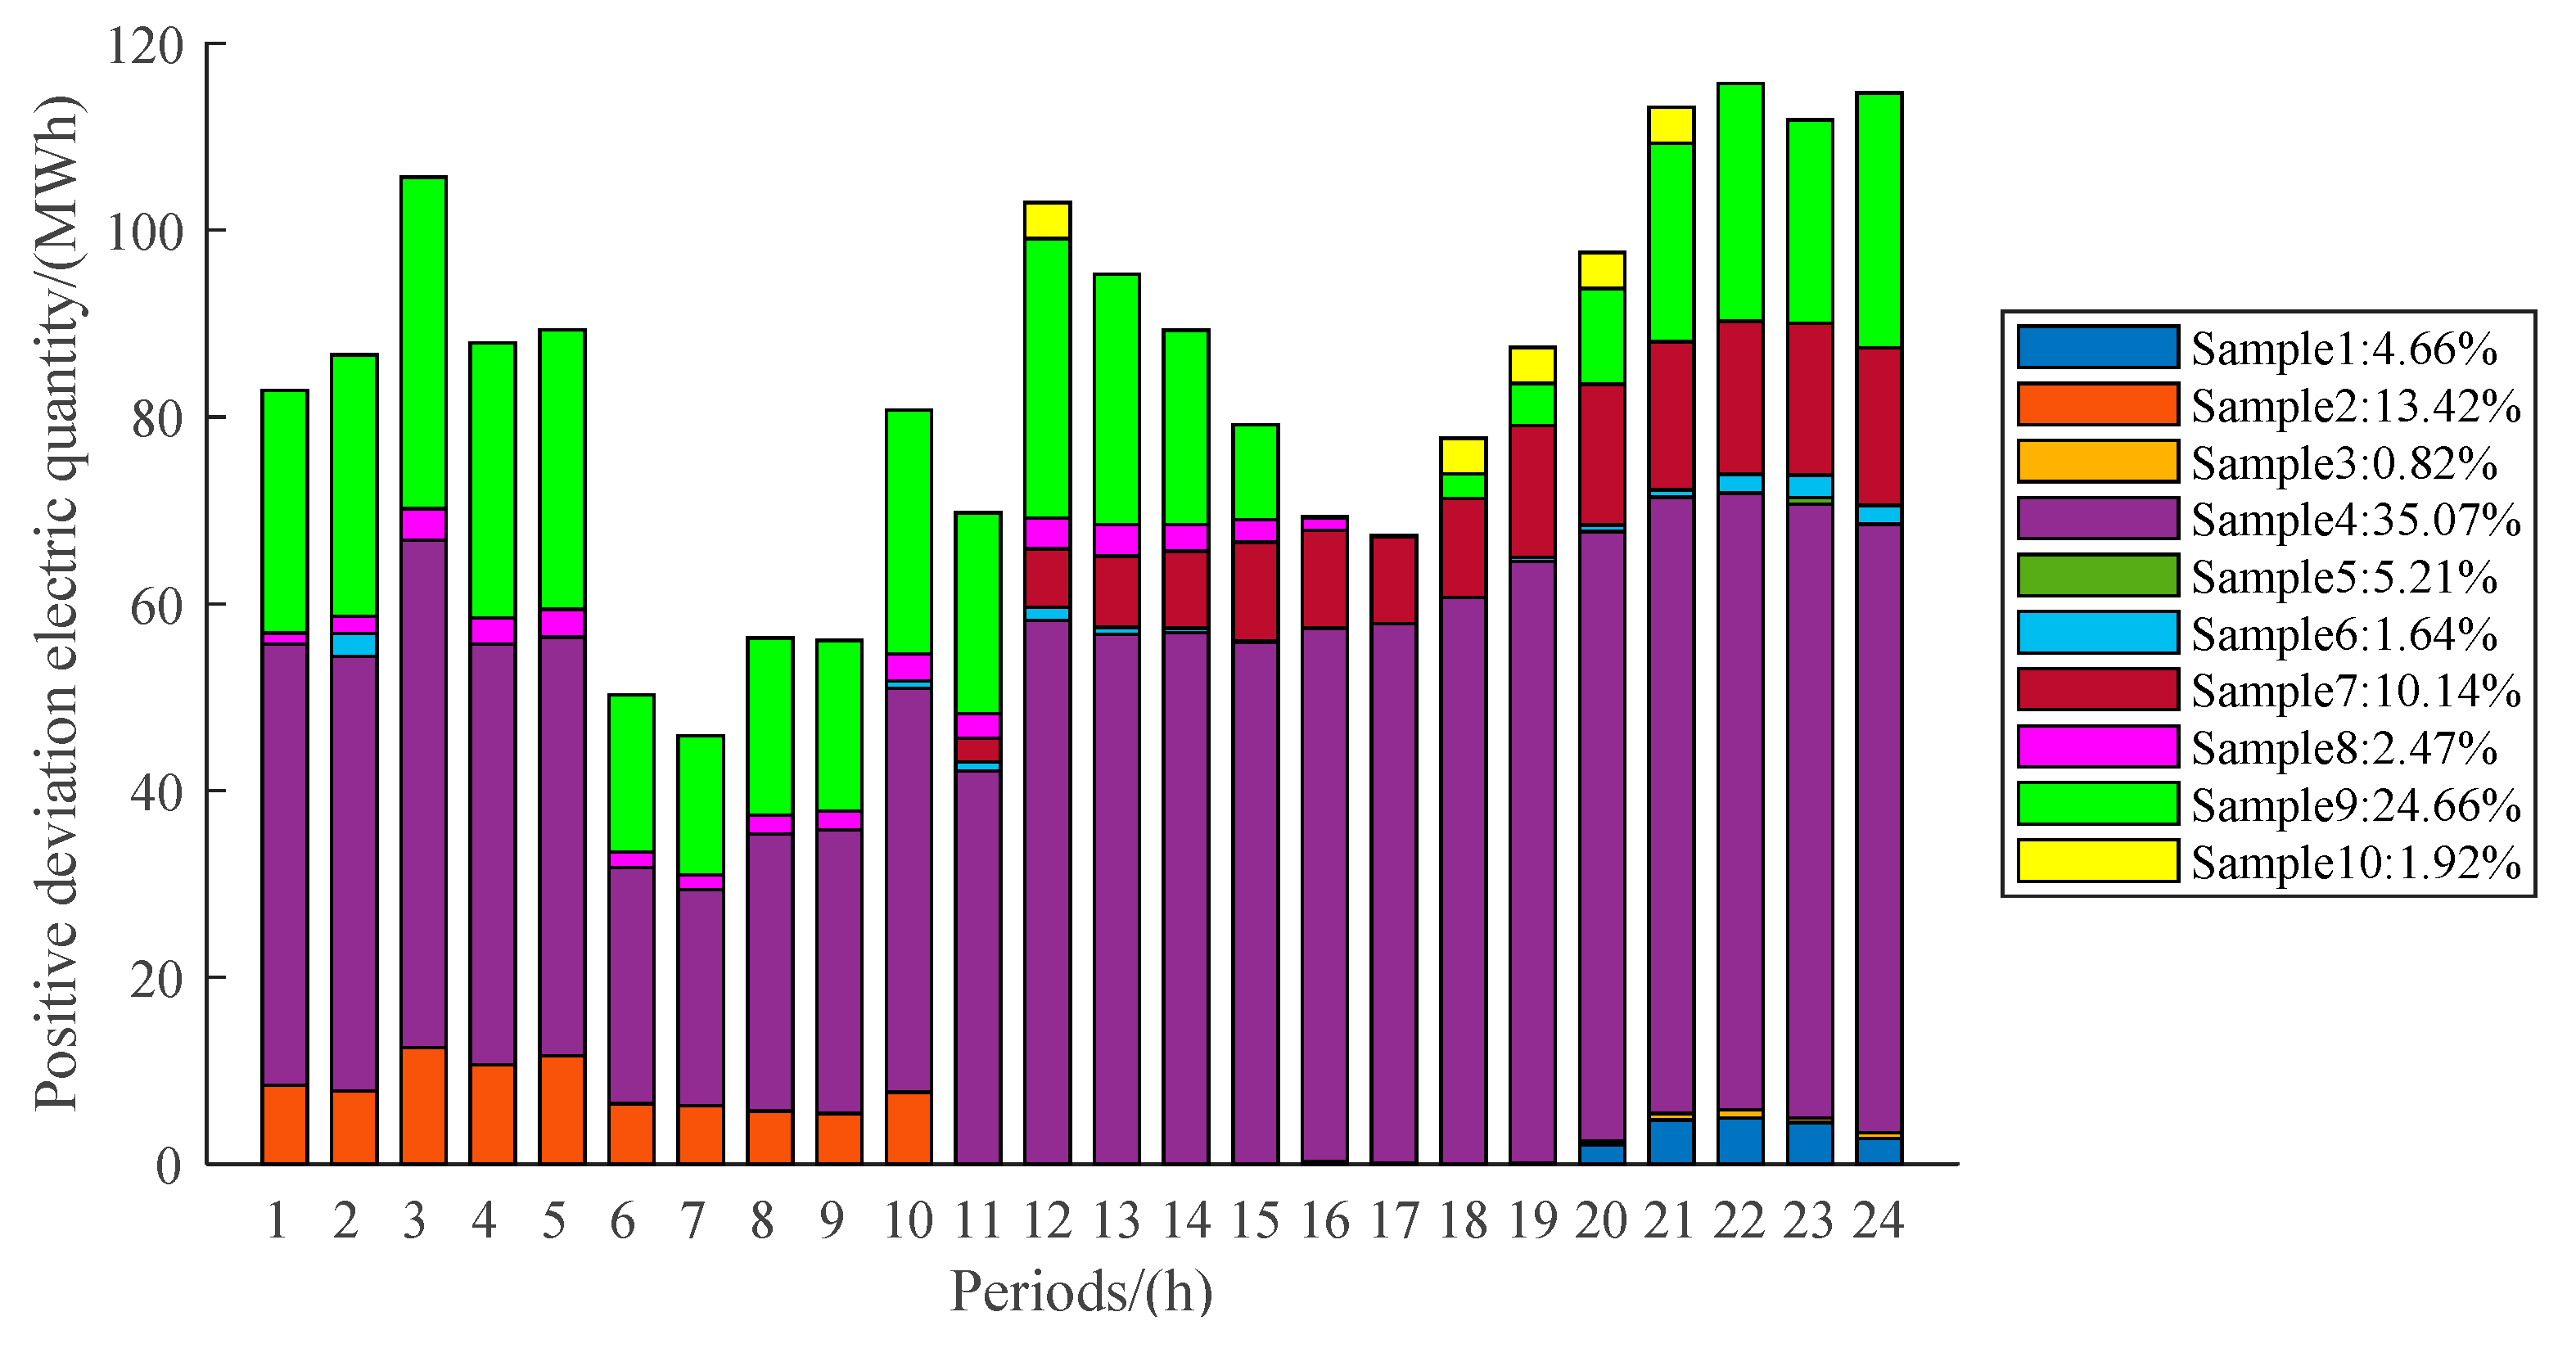
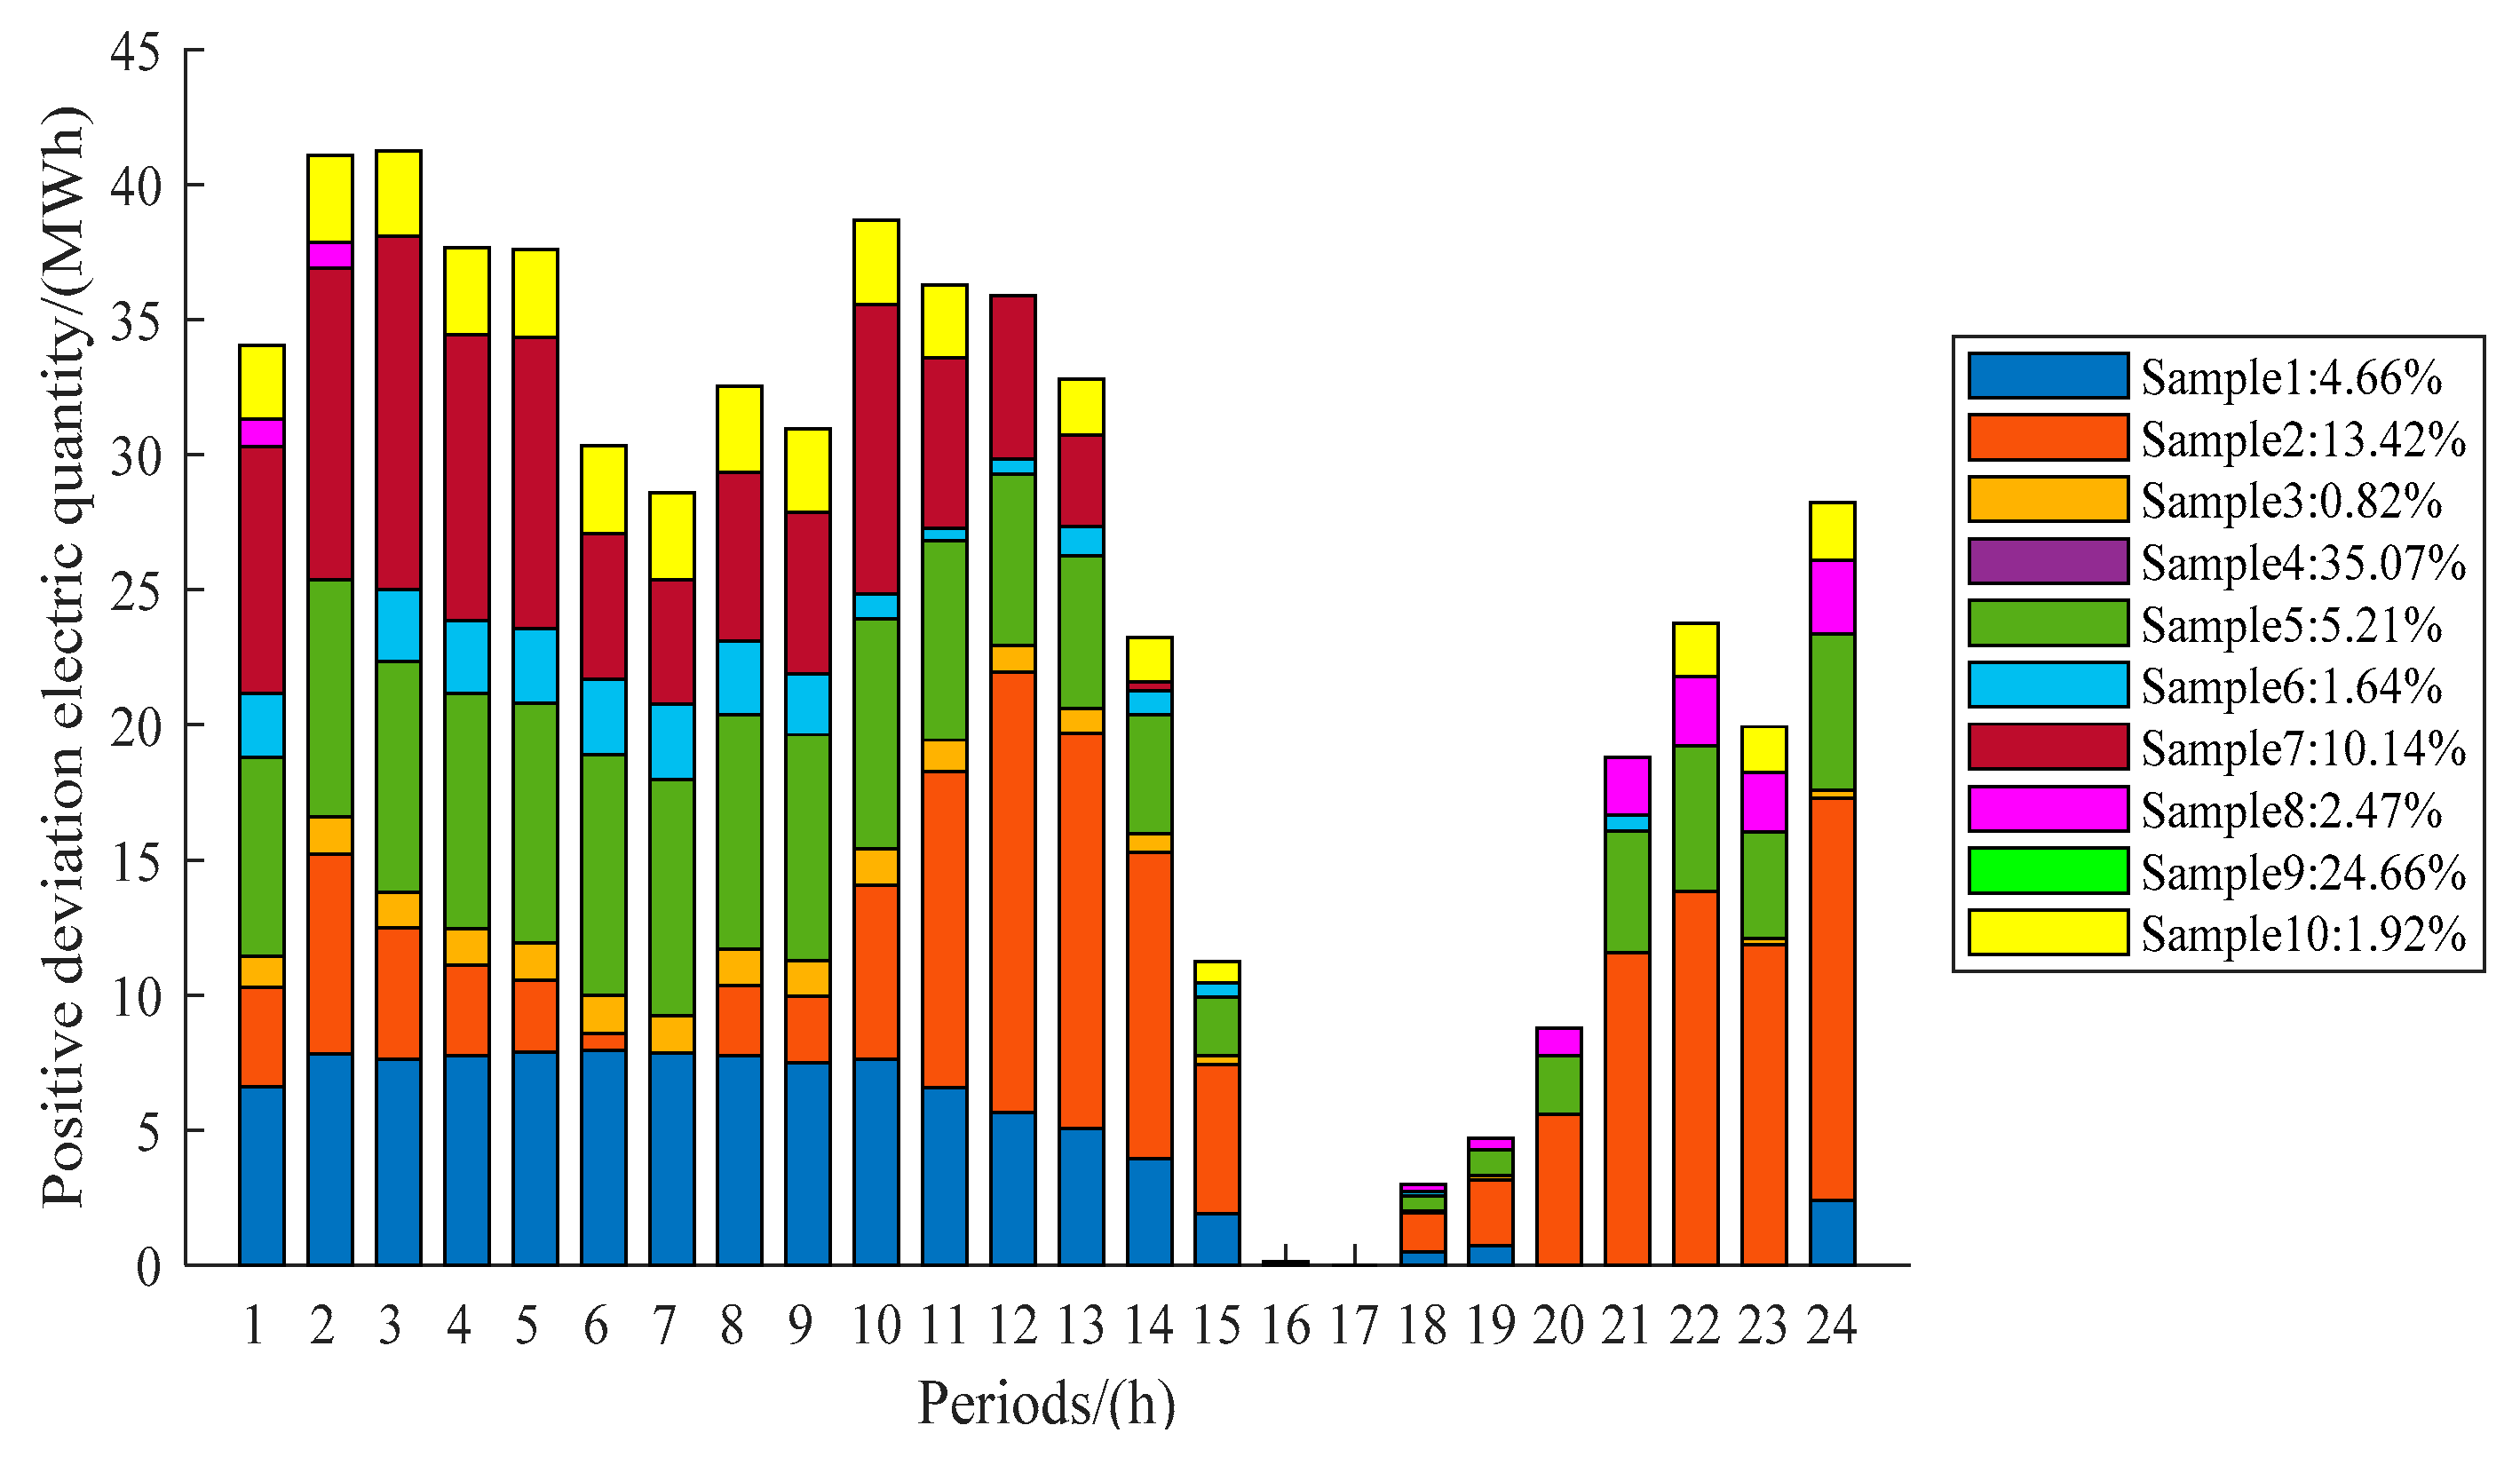
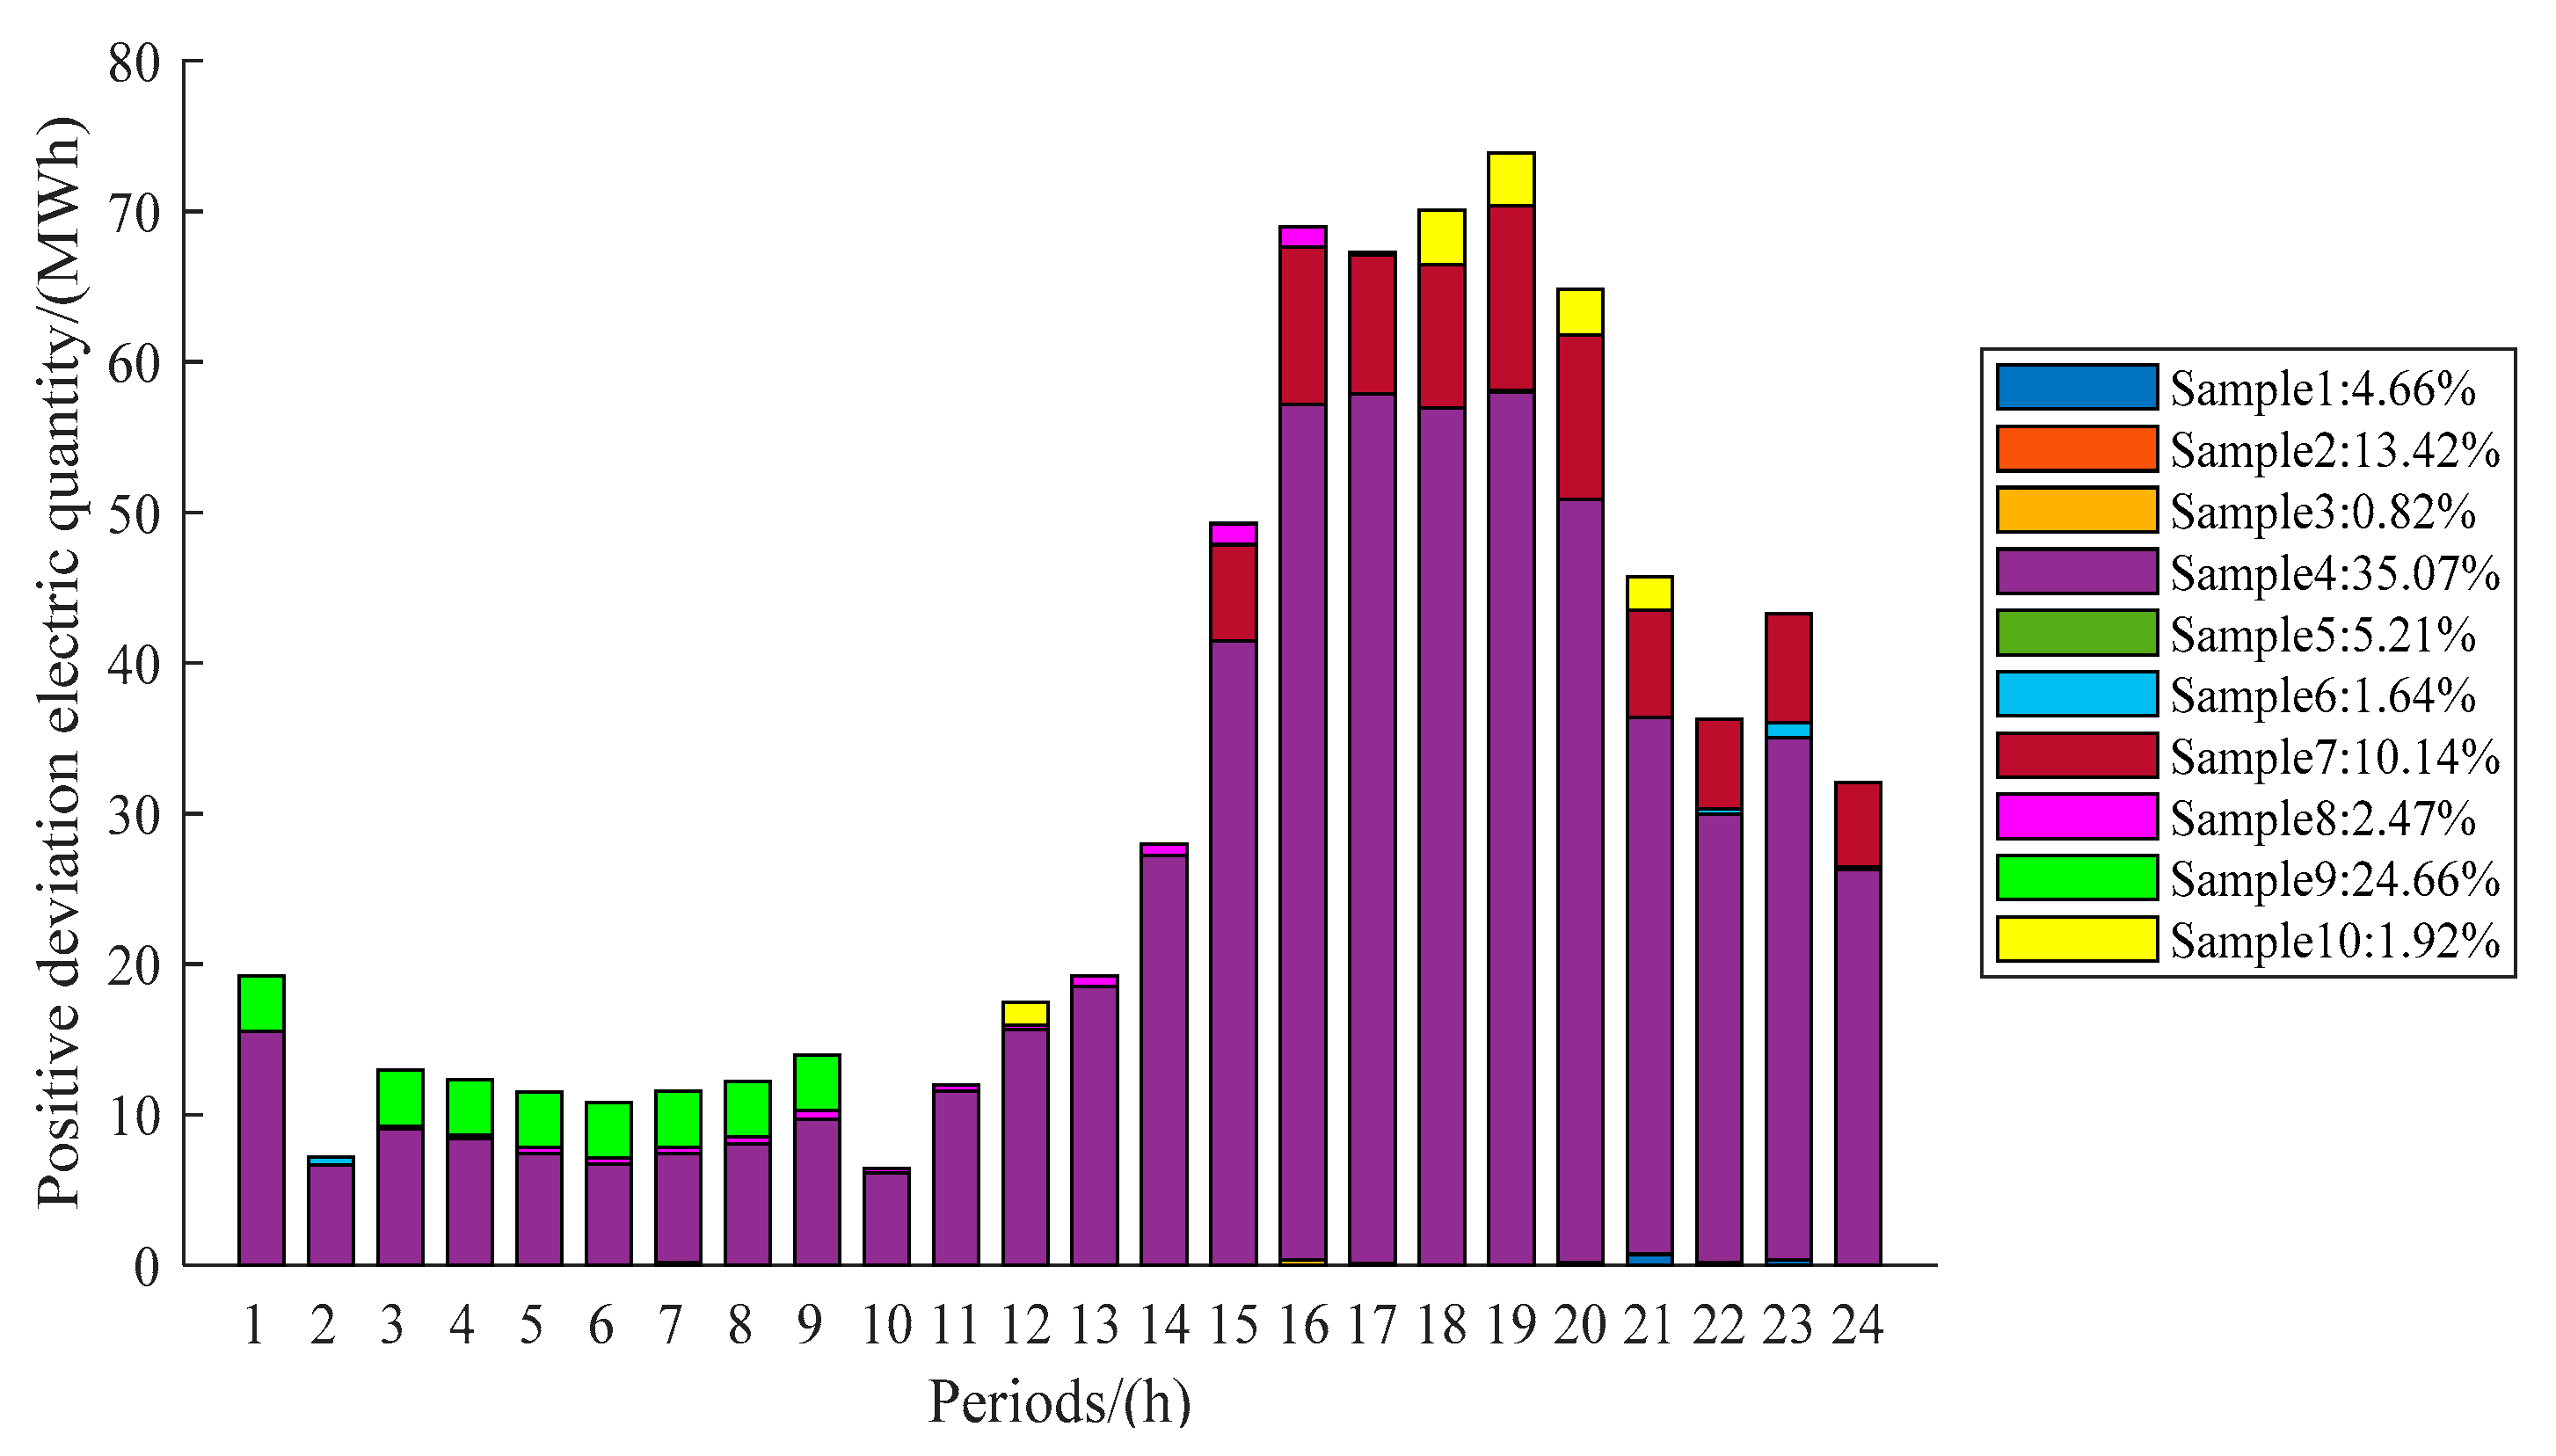
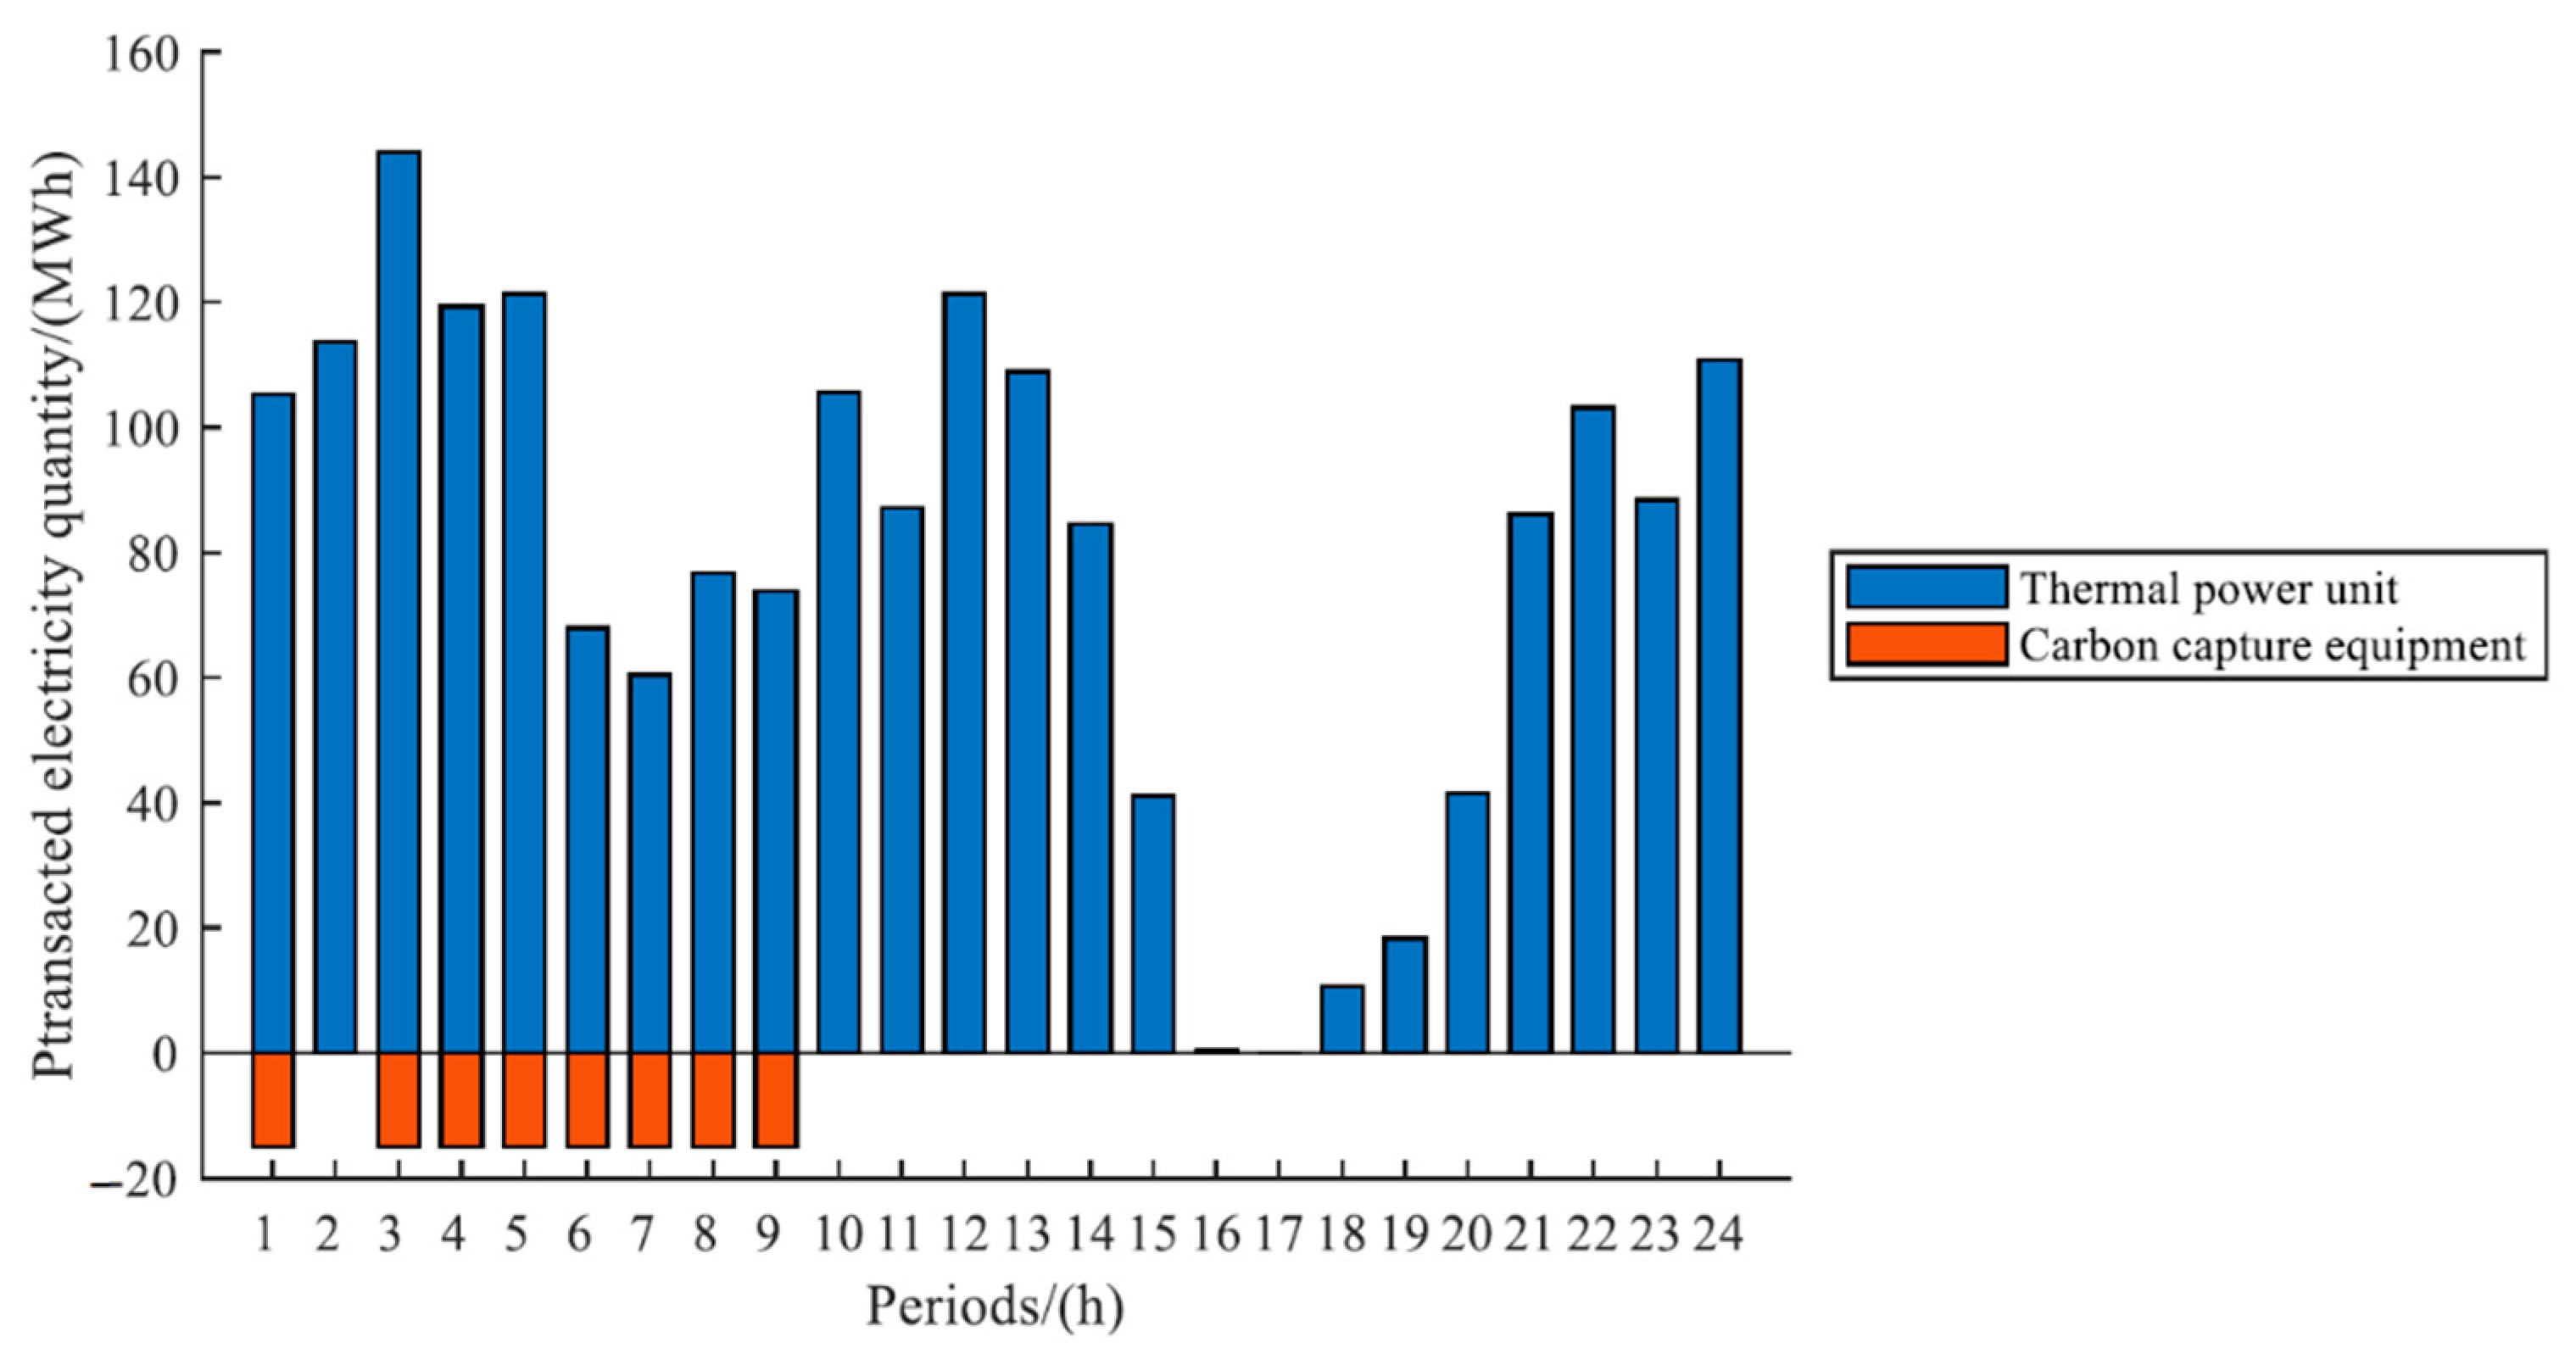
Under the deviation punishment mechanism, there are a lot of positive and negative deviations between the declared electricity and the actual electricity generation of wind turbine. By providing up and down regulation services to wind turbine, thermal power unit and carbon capture equipment can obtain ancillary service income and reduce the declaration deviation of wind turbine, which realizes multi-win-win situation.
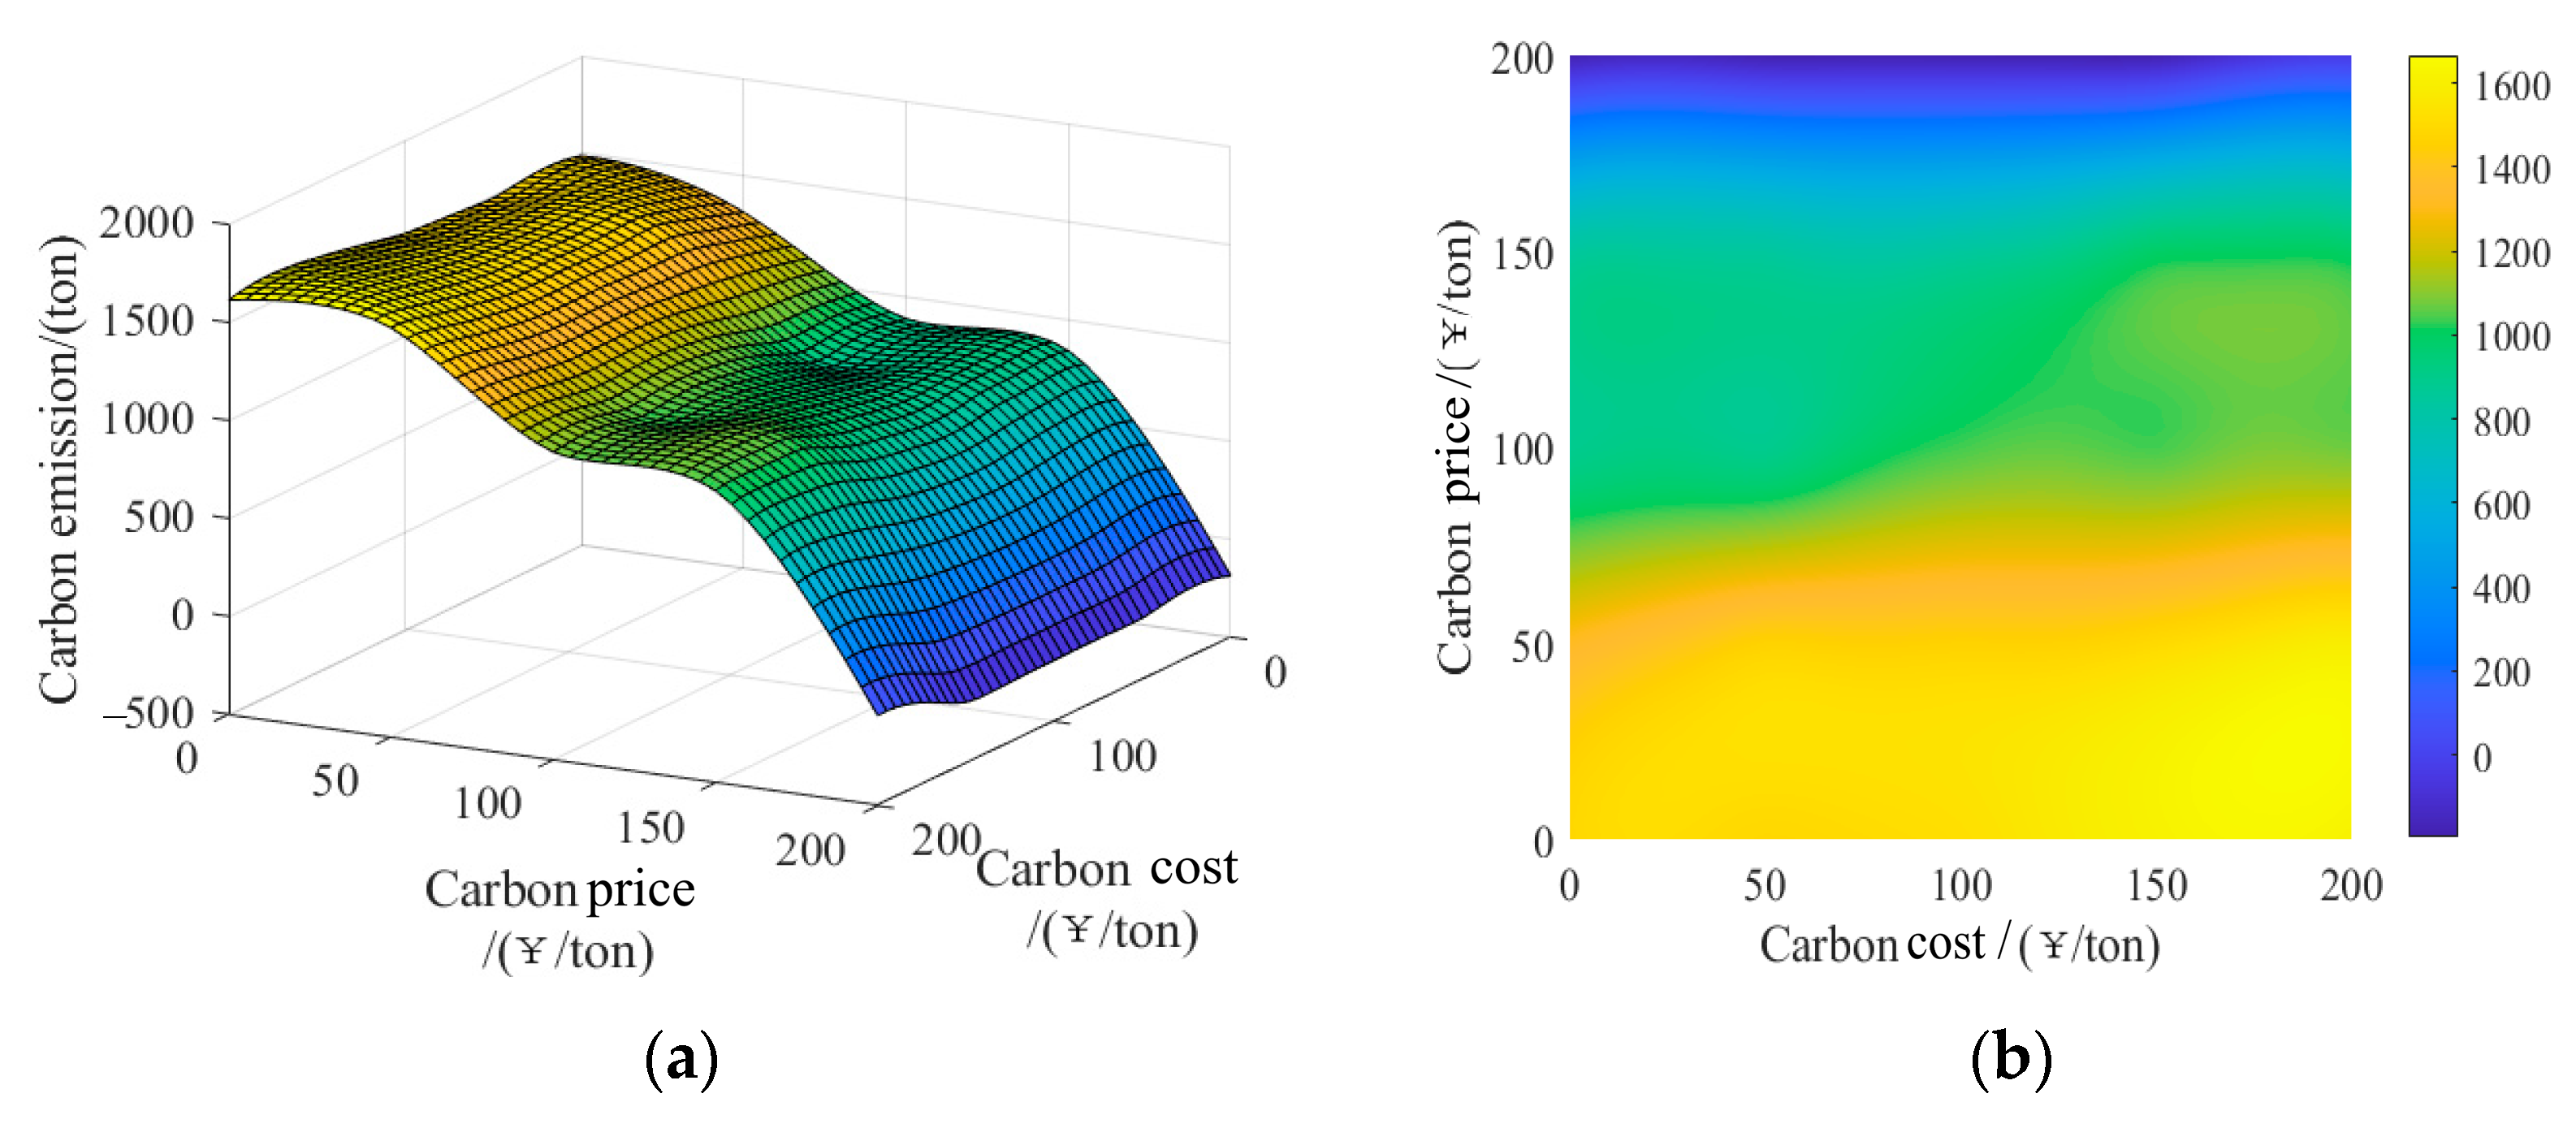
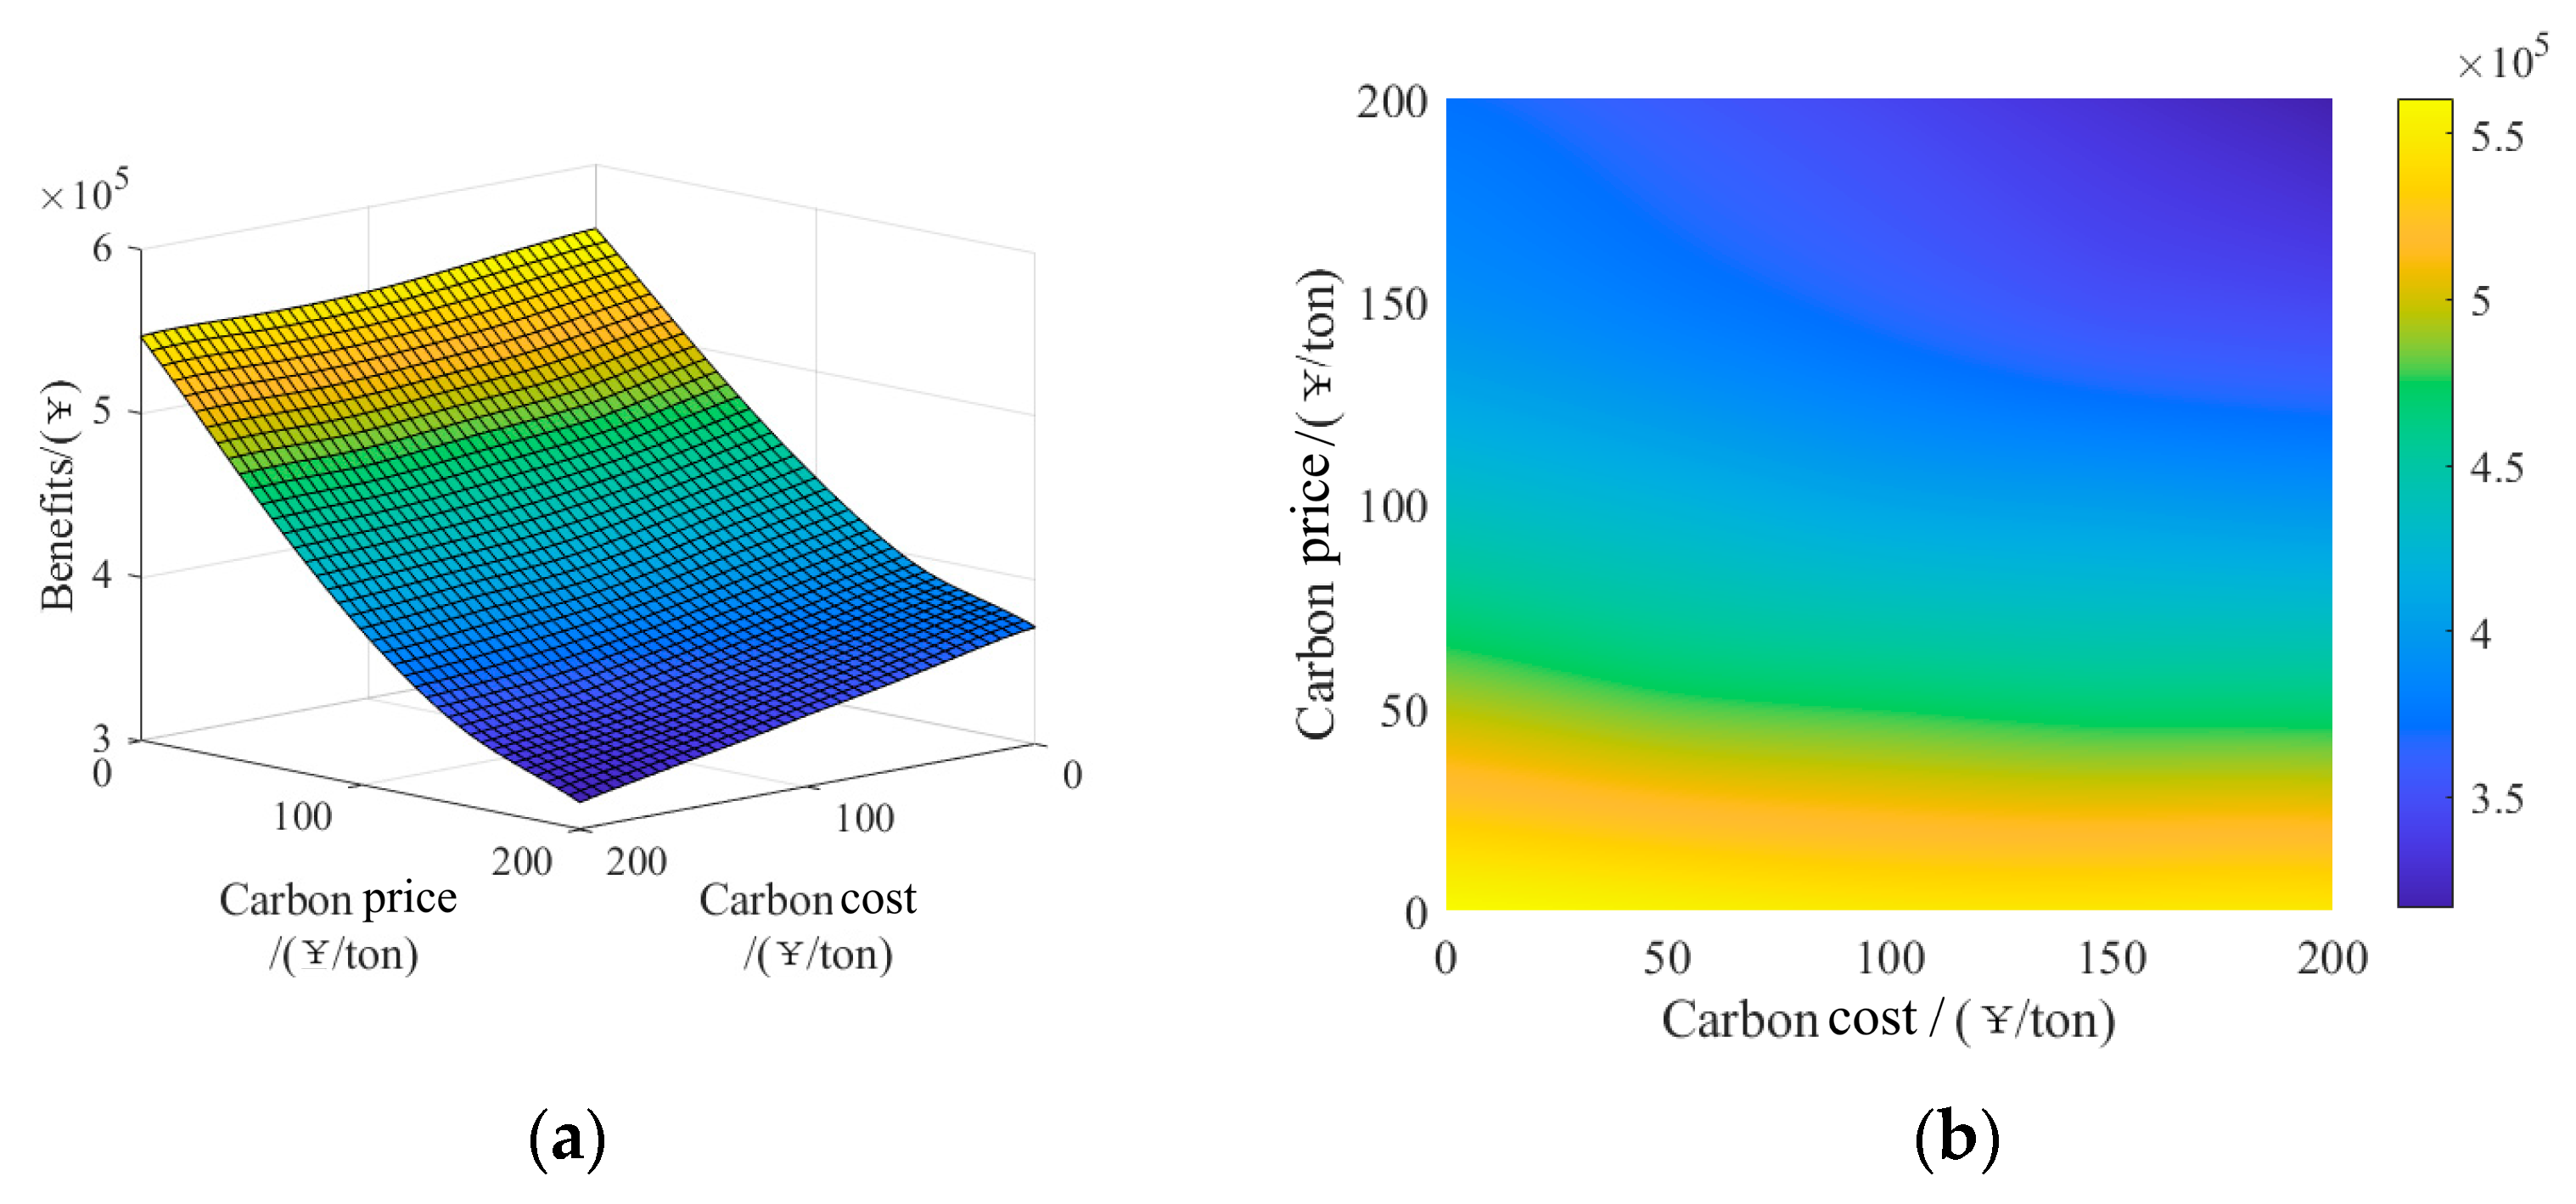
(3)
Carbon price affects both thermal power unit and carbon capture equipment. So, compared with carbon cost, the carbon emission and the alliance benefit are both more sensitive to carbon price. Thus, for alliance of wind turbine and CCPP, the policy-based emission-reducing effect by simply subsidizing to increase carbon sinks is worse than the market-based emission-reducing effect by improving carbon price.

Author Contributions

Conceptualization, Z.T.; methodology, J.Y.; software, J.Y.; validation, Z.T.; formal analysis, Z.T.; investigation, Z.T.; resources, Z.T.; data curation, H.Z.; writing—original draft preparation, J.Y.; writing—review and editing, F.L.; visualization, J.Y.; supervision, Z.T.; project administration, X.L.; funding acquisition, Z.T. All authors have read and agreed to the published version of the manuscript.

Funding

This research was funded by the Key Projects of Philosophy and Social Sciences Research, Ministry of Education, China (18JZD032); National Natural Science Foundation of China (72174062).

Data Availability Statement

The data used to support the findings of this study are available from the corresponding author upon request.

Acknowledgments

I would like to express my sincere thanks to the funding agencies.

Conflicts of Interest

The authors declare that they have no known competing financial interests or personal relationships that could have appeared to influence the work reported in this paper.

Appendix A

Relationship between a wind turbine output and the wind speed shows as follows:
g t w = { 0 , 0 v t v ci v t > v co g wr v re 3 v ci 3 v t 3 v ci 3 v re 3 v ci 3 g wr , v ci v t < v re g wr , v re v t v co ,  
where, g t w is wind power generation in t period; v t is actual wind speed in t period; v ci is cut-in wind speed; v co is cut-out wind speed; g wr is the wind turbine rated power; v re is rated wind speed of the wind turbine.

Appendix B

Table A1. Basic parameters of the wind turbine.
Rated Power/(MW)Cut-in Wind Speed/(m/s)Cut-out Wind Speed/(m/s)Rated Wind Speed/(m/s)Climbing Limit/(MW/h)
Value2002.822.812.560
Table A2. Clustering results of wind turbine power output.
PeriodPower Output of the Wind Turbine/(MW)
Sample1Sample2Sample3Sample4Sample5Sample6Sample7Sample8Sample9 Sample10
1200 86 200 14 200 200 149 99 43 200
2200 87 200 13 200 0 146 71 32 200
3200 73 200 11 200 200 166 29 22 200
4200 59 200 10 200 200 138 23 19 200
5200 50 200 9 200 200 137 15 15 200
6200 34 200 10 200 200 82 13 14 200
7200 31 200 11 200 200 77 14 17 200
8200 53 200 11 200 200 96 14 19 200
9200 58 200 12 200 176 98 16 24 200
10200 85 200 19 200 91 142 24 37 200
11200 146 200 26 200 86 121 40 59 200
12200 200 200 34 200 113 138 66 79 0
13200 200 200 38 200 156 125 65 91 200
14200 200 200 38 200 169 119 85 115 200
15200 200 200 41 200 192 96 101 159 200
16200 200 161 37 200 200 96 146 200 200
17200 200 188 35 200 200 109 195 200 200
18200 200 200 27 200 200 96 200 189 0
19197 200 200 16 200 173 61 200 182 0
20155 200 154 14 200 158 51 200 158 0
2199 200 110 12 200 151 44 200 114 0
2294 200 94 12 200 77 38 200 97 200
23104 200 141 13 187 51 40 200 112 200
24141 200 125 14 200 77 34 200 89 200
Table A3. Cluster center probability of wind turbine output.
Sample1Sample2Sample3Sample4Sample5Sample6Sample7Sample8Sample9Sample10
Probability4.66%13.42%0.82%35.07%5.21%1.64%10.14%2.47%24.66%1.92%
Table A4. Other basic parameters.
ParametersValueParametersValue
p t w 2 g /(¥/MWh)400 g h , max /(MWh)300
p t w 2 g , + /(¥/MWh)600 Δ g h , u , max /(MWh)125
p t w 2 g , - /(¥MWh)600 Δ g h , d , max /(MWh)−125
g w , max /(MWh)200 δ c /(ton/MWh)0.76
Δ g w , u , max /(MWh)60 s c /(¥/ton)105
Δ g w , d , max /(MWh)−60 c h /(¥/ton)270
δ h /(ton/MWh)0.841 g c , max /(MWh)30
c h /(¥/MWh)302.4 Δ g c , u , max /(MWh)30
p t c /(¥/ton)58.5 Δ g c , d , max /(MWh)−30

References

  1. China’s Long-term Low-Carbon Development Strategies and Pathways. Available online: https://www.efchina.org/Reports-zh/report-lceg-20210711-zh (accessed on 7 November 2021).
  2. China 2050: A Fully Developed Rich Zero-Carbon Economy. Available online: https://www.energy-transitions.org/publications/china-2050-a-fully-developed-rich-zero-carbon-economy/ (accessed on 1 January 2022).
  3. Wang, J.; Feng, L.; Palmer, P.I. Large Chinese land carbon sink estimated from atmospheric carbon dioxide data. Nature 2020, 586, 720–723. [Google Scholar] [CrossRef] [PubMed]
  4. Morales, J.M.; Conejo, A.J.; Pérez-Ruiz, J. Short-term trading for a wind power producer. IEEE Trans. Power Syst. 2010, 25, 554–564. [Google Scholar] [CrossRef]
  5. Poplavskaya, K.; Lago, J.; Vries, L.D. Effect of market design on strategic bidding behavior: Model-based analysis of European electricity balancing markets. Appl. Energy 2020, 270, 115130. [Google Scholar] [CrossRef]
  6. Johannes, V.; Stefan, L.; Raimund, M. Multi-unit multiple bid auctions in balancing markets: An agent-based Qlearning approach. Energy Econ. 2021, 93, 105035. [Google Scholar]
  7. Edenhofer; Pichs, M. Contribution of Working Group III to the Fifth Assessment Report of the Intergovernmental Panel on Climate Change; Cambridge University Press: Cambridge, UK, 2014. [Google Scholar]
  8. Abdilahi, A.M.; Mustafa, M.W.; Abujarad, S.Y. Harnessing flexibility potential of flexible carbon capture power plants for future low carbon power systems: Review. Renew. Sustain. Energy Rev. 2018, 81, 3101–3110. [Google Scholar] [CrossRef]
  9. Saboori, H.; Hemmati, R. Considering Carbon Capture and Storage in Electricity Generation Expansion Planning. IEEE Trans. Sustain. Energy 2016, 7, 1371–1378. [Google Scholar] [CrossRef]
  10. Kvamsdal, H.; Jakobsen, J.; Hoff, K. Dynamic modeling and simulation of a CO2 absorber column for post-combustion CO2 capture. Chem. Eng. Process. 2009, 48, 135–144. [Google Scholar] [CrossRef]
  11. Lawal, A.; Wang, M.; Stephenson, P. Dynamic modeling of CO2 absorption for post combustion capture in coal-fired power plants. Fuel 2009, 88, 2455–2462. [Google Scholar] [CrossRef]
  12. Wu, X.; Wang, M.; Liao, P.; Shen, J.; Li, Y. Solvent-based Post combustion CO2 Capture for Power Plants: A Critical Review and Perspective on Dynamic Modelling, System Identification, Process Control and Flexible Operation. Appl. Energy 2020, 257, 113941. [Google Scholar] [CrossRef]
  13. Chalmers, H.; Gibbins, J. Initial evaluation of the impact of post combustion capture of carbon dioxide on supercritical pulverized coal power plant part load performance. Fuel 2007, 86, 2109–2123. [Google Scholar] [CrossRef]
  14. Chalmers, H.; Lucquiaud, M.; Gibbins, J.; Leach, M. Flexible operation of coal fired power plants with post-combustion capture of carbon dioxide. J. Environ. Eng. 2009, 135, 449–458. [Google Scholar] [CrossRef]
  15. Zhou, R.J.; Liu, Y.S.; Cheng, T.L.; Pan, Z. Carbon Capture Level Optimization Modeling Considering Sensitive Internals of Carbon Emission Allowance. Autom. Electr. Power Syst. 2013, 37, 46–50. [Google Scholar]
  16. Zhang, X.H.; Yang, L.; Li, X.P.; Lu, Z.G. Analysis on Relative Capture Degree Based Multi-objective Optimization Decision of Flexible Operation of Carbon Capture Plan. Autom. Electr. Power Syst. 2014, 38, 143–149. [Google Scholar]
  17. Chen, D.P.; Wang, J.; Jing, Z.X. Decision model of carbon capture power plant to provide reserve service under flexible operation. Autom. Electr. Power Syst. 2017, 41, 138–145. (In Chinese) [Google Scholar]
  18. Lou, S.; Lu, S.; Wu, Y.; Kirschen, D.S. Optimizing spinning reserve requirement of power system with carbon capture plants. IEEE Trans. Power Syst. 2015, 30, 1056–1063. [Google Scholar] [CrossRef]
  19. Akbari-Dibavar, A.; Mohammadi-Ivatloo, B.; Zare, K.; Khalili, T.; Bidram, A. Economic-Emission Dispatch Problem in Power Systems With Carbon Capture Power Plants. IEEE Trans. Ind. Appl. 2021, 57, 3341–3351. [Google Scholar] [CrossRef]
  20. Lu, S.; Lou, S.; Wu, Y.; Yin, X. Power system economic dispatch under low-carbon economy with carbon capture plants considered. IET Gener. Transm. Distrib. 2013, 7, 991–1001. [Google Scholar] [CrossRef]
  21. Ji, Z.; Kang, C.; Chen, Q.; Xia, Q.; Jiang, C.; Chen, Z.; Xin, J. Low-carbon power system dispatch incorporating carbon capture power plants. IEEE Trans. Power Syst. 2013, 28, 4615–4623. [Google Scholar] [CrossRef]
  22. Lu, Z.; He, S.; Feng, T.; Li, X.; Guo, X.; Sun, X. Robust Economic/emission Dispatch Considering Wind Power Uncertainties and Flexible Operation of Carbon Capture and Storage. Int. J. Electr. Power Energy Syst. 2014, 63, 285–292. [Google Scholar] [CrossRef]
  23. Zhang, R.F.; Jiang, T.; Bai, L.Q. Adjustable robust power dispatch with combined wind-storage system and carbon capture power plants under low-carbon economy. Int. J. Electr. Power Energy Syst. 2019, 113, 772–781. [Google Scholar] [CrossRef]
  24. Qadir, A.; Manaf, N.A.; Abbas, A. Analysis of the integration of a steel plant in Australia with a carbon capture system powered by renewable energy and NG-CHP. J. Clean. Prod. 2017, 168, 97–104. [Google Scholar] [CrossRef]
  25. Shirmohammadi, R.; Aslani, A.; Ghasempour, R.; Romeo, L.M.; Petrakopoulou, F. Techno-economic assessment and optimization of a solar-assisted industrial post-combustion CO2 capture and utilization plant. Energy Rep. 2021, 7, 7390–7404. [Google Scholar] [CrossRef]
  26. Chen, X.H.; Wu, X.; Lee, K.Y. The mutual benefits of renewables and carbon capture: Achieved by an artificial intelligent scheduling strategy. Energy Convers. Manag. 2021, 233, 113856. [Google Scholar] [CrossRef]
  27. Li, J.; Zhao, J. Low carbon unit commitment for power system with wind farms and carbon capture devices based on DE-BBO algorithm. In Proceedings of the International Conference on Renewable Power Generation (RPG 2015), Beijing, China, 17 October 2015. [Google Scholar]
  28. He, L.; Lu, Z.; Zhang, J.; Geng, L.; Zhao, H.; Li, X. Low-carbon economic dispatch for electricity and natural gas systems considering carbon capture systems and power-to-gas. Appl. Energy 2018, 224, 357–370. [Google Scholar] [CrossRef]
  29. Yang, J.; Zhang, N.; Cheng, Y.; Kang, C.; Xia, Q. Modeling the operation mechanism of combined P2G and gas-fired plant with CO2 recycling. IEEE Trans. Smart Grid 2019, 10, 1111–1121. [Google Scholar] [CrossRef]
  30. Ma, T.F.; Pei, W.; Xiao, H.; Li, D.X.; Lv, X.Y.; Hou, K. Cooperative Operation Method for Wind-solar-hydrogen Multi-agent Energy System Based on Nash Bargaining Theory. Proc. CSEE 2021, 41, 25–39+395. [Google Scholar]
Figure 1. Wind–thermal–carbon capture combined system.
Sustainability 14 11627 g001
Figure 2. Positive deviation of the uncombined wind turbine electricity quantity declaration.
Sustainability 14 11627 g002
Figure 3. Negative deviation of the uncombined wind turbine electricity quantity declaration.
Sustainability 14 11627 g003
Figure 4. Convergence results of distributed algorithm operation optimization: (a) benefits of wind turbine; (b) benefits of thermal power unit; (c) benefits of carbon capture equipment; (d) alliance benefit.
Sustainability 14 11627 g004
Figure 5. Positive deviation of the wind turbine in cooperative operation.
Sustainability 14 11627 g005
Figure 6. Negative deviation of the wind turbine in cooperative operation.
Sustainability 14 11627 g006
Figure 7. Regulation electricity transaction results by thermal power unit and carbon capture equipment with the wind turbine respectively.
Sustainability 14 11627 g007
Figure 8. Convergence results of distributed algorithm for benefit distribution: (a) transaction price of wind- carbon capture; (b) transaction price of wind-thermal.
Sustainability 14 11627 g008
Figure 9. Sensitivity analysis of system carbon emissions: (a) three-dimensional display; (b) concentration display.
Sustainability 14 11627 g009
Figure 10. Sensitivity analysis of alliance benefit:(a) three-dimensional display; (b) concentration display.
Sustainability 14 11627 g010
Table 1. Optimization results of wind turbine output declaration in independent operation.
PeriodElectricity Quantity
Declaration/(MWh)
PeriodElectricity Quantity
Declaration/(MWh)
PeriodElectricity Quantity
Declaration/(MWh)
114999817200
21461014218200
31661114619200
41381220020200
51371320021200
6821420022200
7771520023200
8961620024200
Publisher’s Note: MDPI stays neutral with regard to jurisdictional claims in published maps and institutional affiliations.

