Article

Systems Dynamics and the Analytical Network Process for the Evaluation and Prioritization of Green Projects: Proposal That Involves Participative Integration

by
Julian Andres Castrillon-Gomez
1,
Gerard Olivar-Tost
2 and
Johnny Valencia-Calvo
2,*
1
Departamento de Ingeniería Eléctrica y Electrónica, Universidad Nacional Colombia Sede Manizales, Manizales 170001, Colombia
2
Departamento de Ciencias Naturales y Tecnología, Universidad de Aysén, Coyhaique 5950000, Chile
*
Author to whom correspondence should be addressed.
Sustainability 2022, 14(18), 11519; https://doi.org/10.3390/su141811519
Submission received: 12 August 2022 / Revised: 31 August 2022 / Accepted: 6 September 2022 / Published: 14 September 2022

Abstract

:
This research proposes a methodology for evaluating and prioritizing green projects based on an integrated approach between system dynamics modeling and the analytical network process. The methodology is presented in three stages: First of all, we show the citizen factors and obtain the data from the zone through community participation. Then, in the second stage, the model of system dynamics is consolidated and calibrated, which allows the generation of relevant information for experts by simulating model variables. In the third stage, considering the dependency and feedback relationships of the system, the model is translated to a complex network of many opinions which makes the decision making through peer review easier. The application of the methodology is presented using a case study undertaken in the California county that belongs to the Magdalena region in Colombia. The results allow to conclude that the proposed methodology makes the evaluation process and the prioritization of the projects easier because it is possible to advise the experts with respect to the variables that maximize investments and based on this select environmental initiatives that maximize investments and the environmental, social, or economic initiatives that best respond to the needs of the community. Likewise, we can demonstrate that the methodology can be applied to any rural community adjusting parameters and calibration variables to reflect the new conditions, both for natural resources and for particular policies and actions in such a way that the most appropriate project can be selected.

1. Introduction

In Colombia, the era of the postwar period has opened the door for public and private resources to finance development projects in the affected communities. The set of agreements expressed in [1] are focused on contributing to the realization of human rights, so citizen participation in the construction of peace is very important, and likewise, as proposed in [2], we can make plans during the tasks of planning, execution, and monitoring of plans and programs in a way that guarantees socio-economic sustainability; likewise, the good use of natural resources such as water, rural ground in the general of axes of territorial development.
However, as we can see in [3], when we talk about sustainability and green projects, the importance is highlighted not only for protecting the areas of environmental interest but also for articulating efforts to improve the labor, economic, and welfare conditions for men and women belonging to these communities so we can contribute the reduction of the gap between urban and rural areas. Therefore, for the evaluation and prioritization of projects, it is necessary to start from the review and analysis of the conditions, needs, and characteristics of an environmental, economic, social, and cultural nature, which make each territory and each community, as we said in [4], unique scenarios that must be considered so that decision-making is carried out in a comprehensive, coordinated, and adapted way for each case.
Therefore, the evaluation and prioritization of projects, in the postwar period in Colombia, are shown as the dilemma of where to direct investment decisions by not only local governments but also the central government, with the view of an effective reparation of the damage caused to the community [5], and, therefore, allows to overcome the backwardness of decades of war and inattention of the state [6].
However, often current rural and urban agendas respond more to political and/or economic commitments and obligations, and the problems, needs, and expectations of the community are left aside [7]. The above allows us to formulate the hypothesis of this research, according to which it is possible to evaluate and prioritize green projects in communities of the postwar period, using a multivariate participatory model (qualitative and quantitative) that integrates social knowledge and through which relevant information is generated at a social, environmental, and economic level, so it can be used by the experts to guide decision making.
In this way, the proposed methodology proposes, in the first instance, the construction of a model of system dynamics [8,9] that allows to integrate citizen factors (determined through the participatory rural diagnosis [10,11]) and generate information in the short, medium, and long term that can facilitate decision making and, in the second instance, the translation to a complex network of multiple criteria that allows the evaluation and prioritization of alternatives through peer review, as exposed by the analytical network process method (ANP) [12,13].
At present, there are limited applications where the modeling methodologies in system dynamics are integrated with the multicriteria evaluation ANP [14], and it has been very difficult to find research related to the evaluation and prioritization of projects.
The document is structured as follows: Section 2 shows the model of system dynamics; in Section 3 we can see the creation of the structure of the ANP network starting with the identification of the clusters and nodes in the model of system dynamics; Section 4 displays the application of the evaluation and prioritization methodology through a case study; afterwards, Section 5 shows the results of the methodology; then, Section 6 presents the discussion; and, finally, Section 7 presents the conclusion and comments regarding the perspective of the future research.

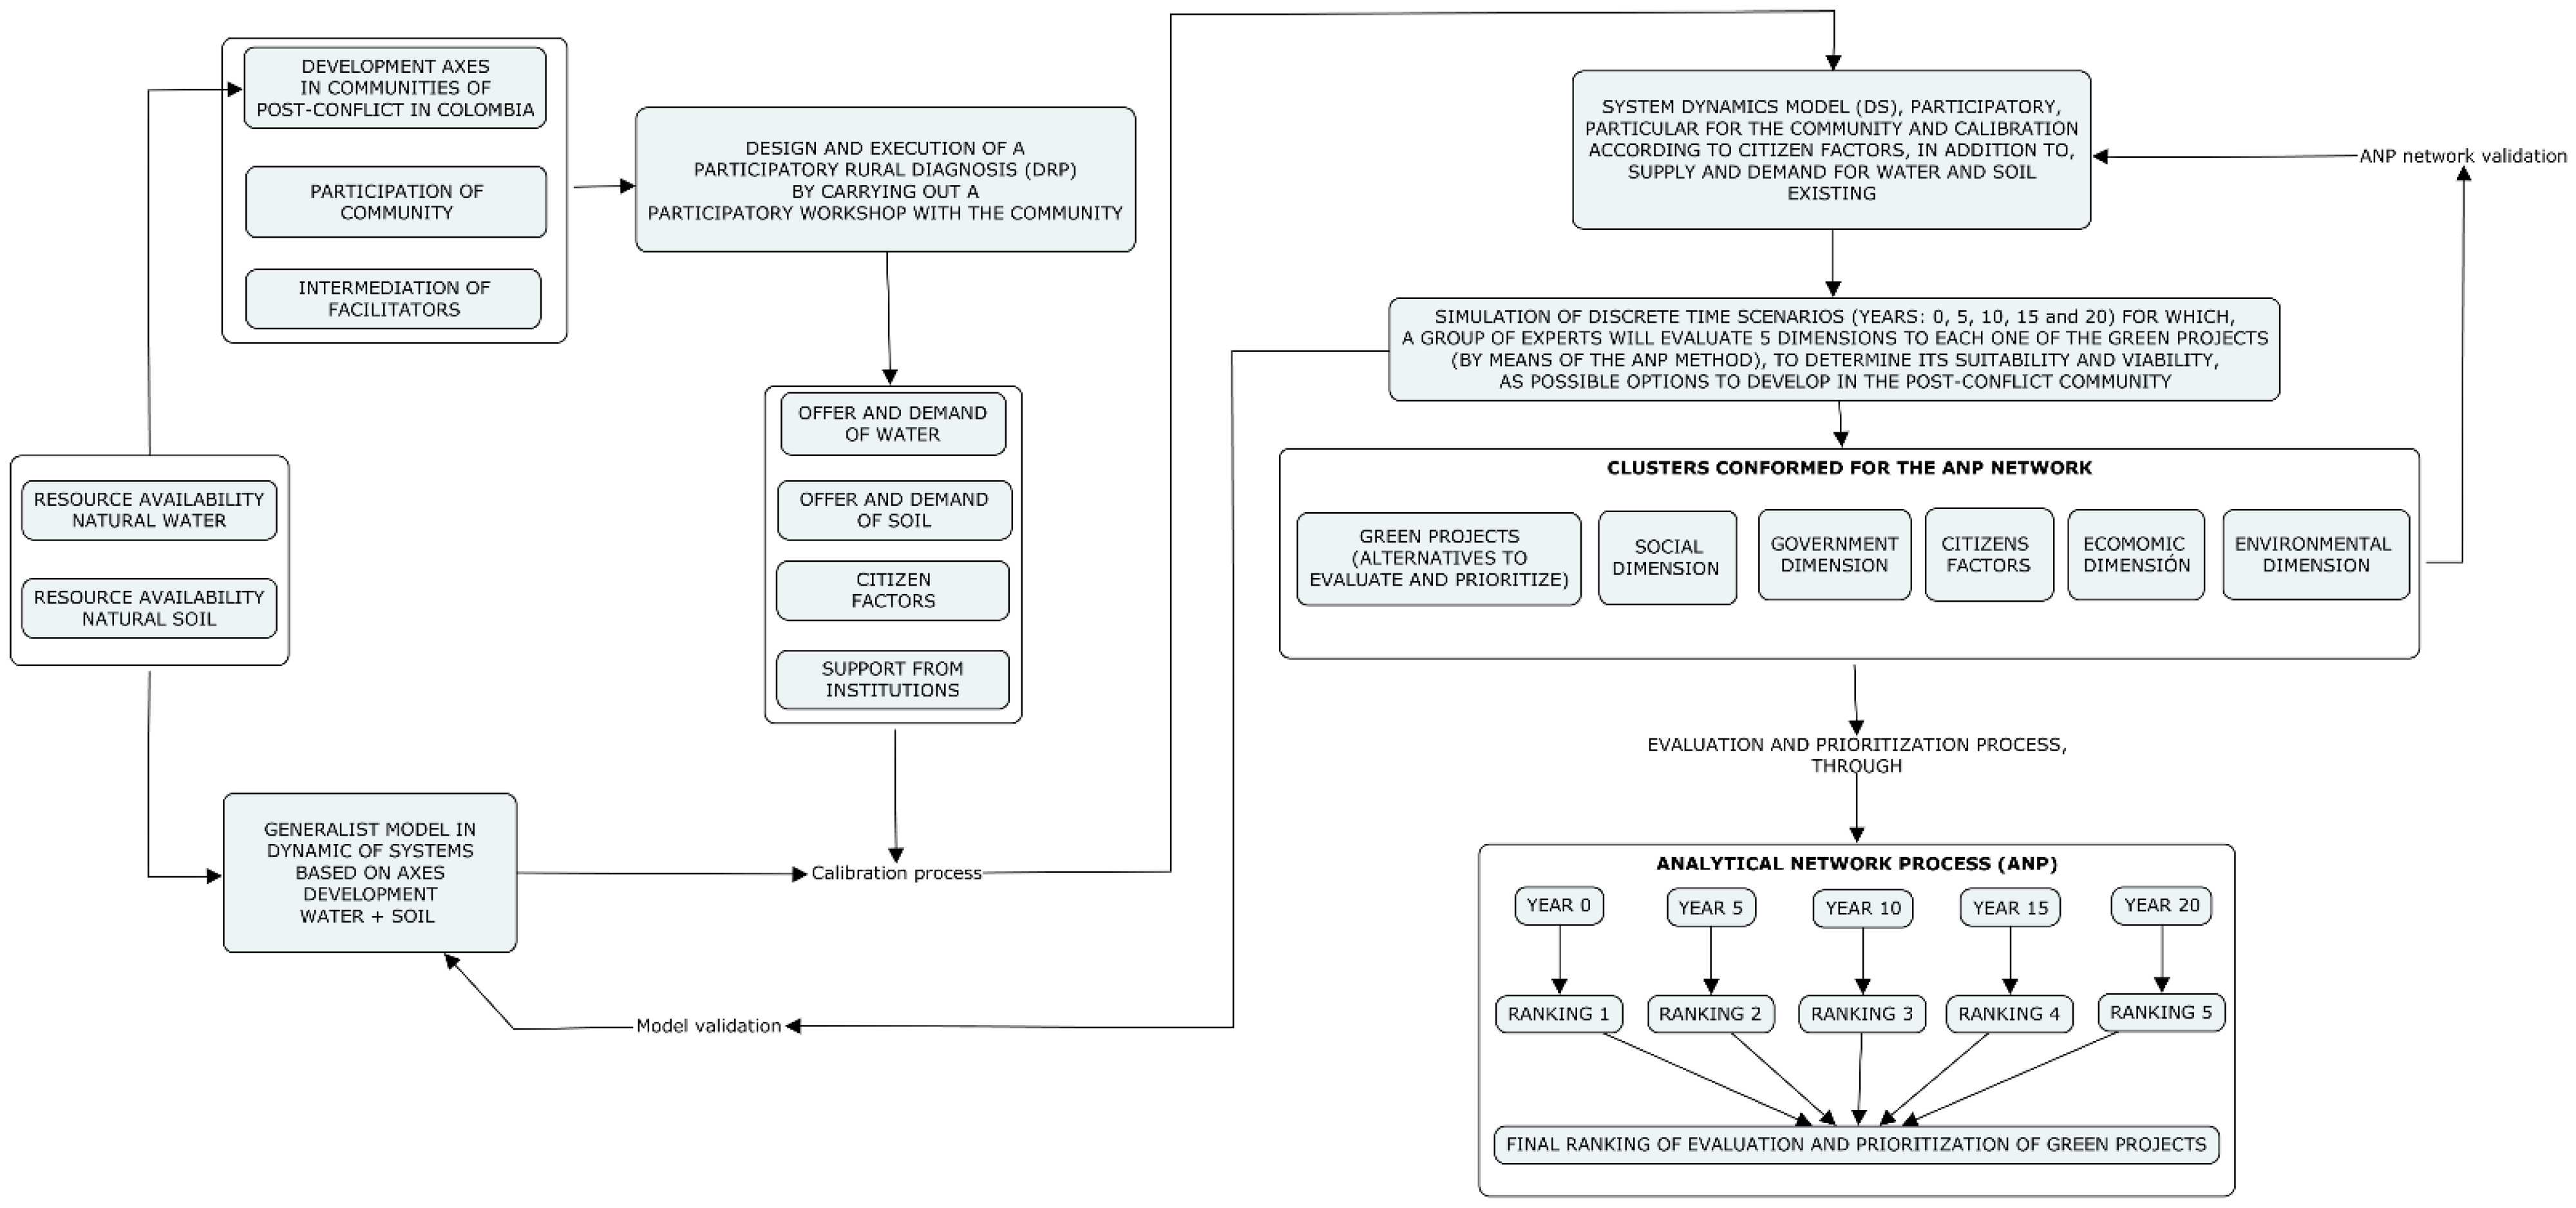
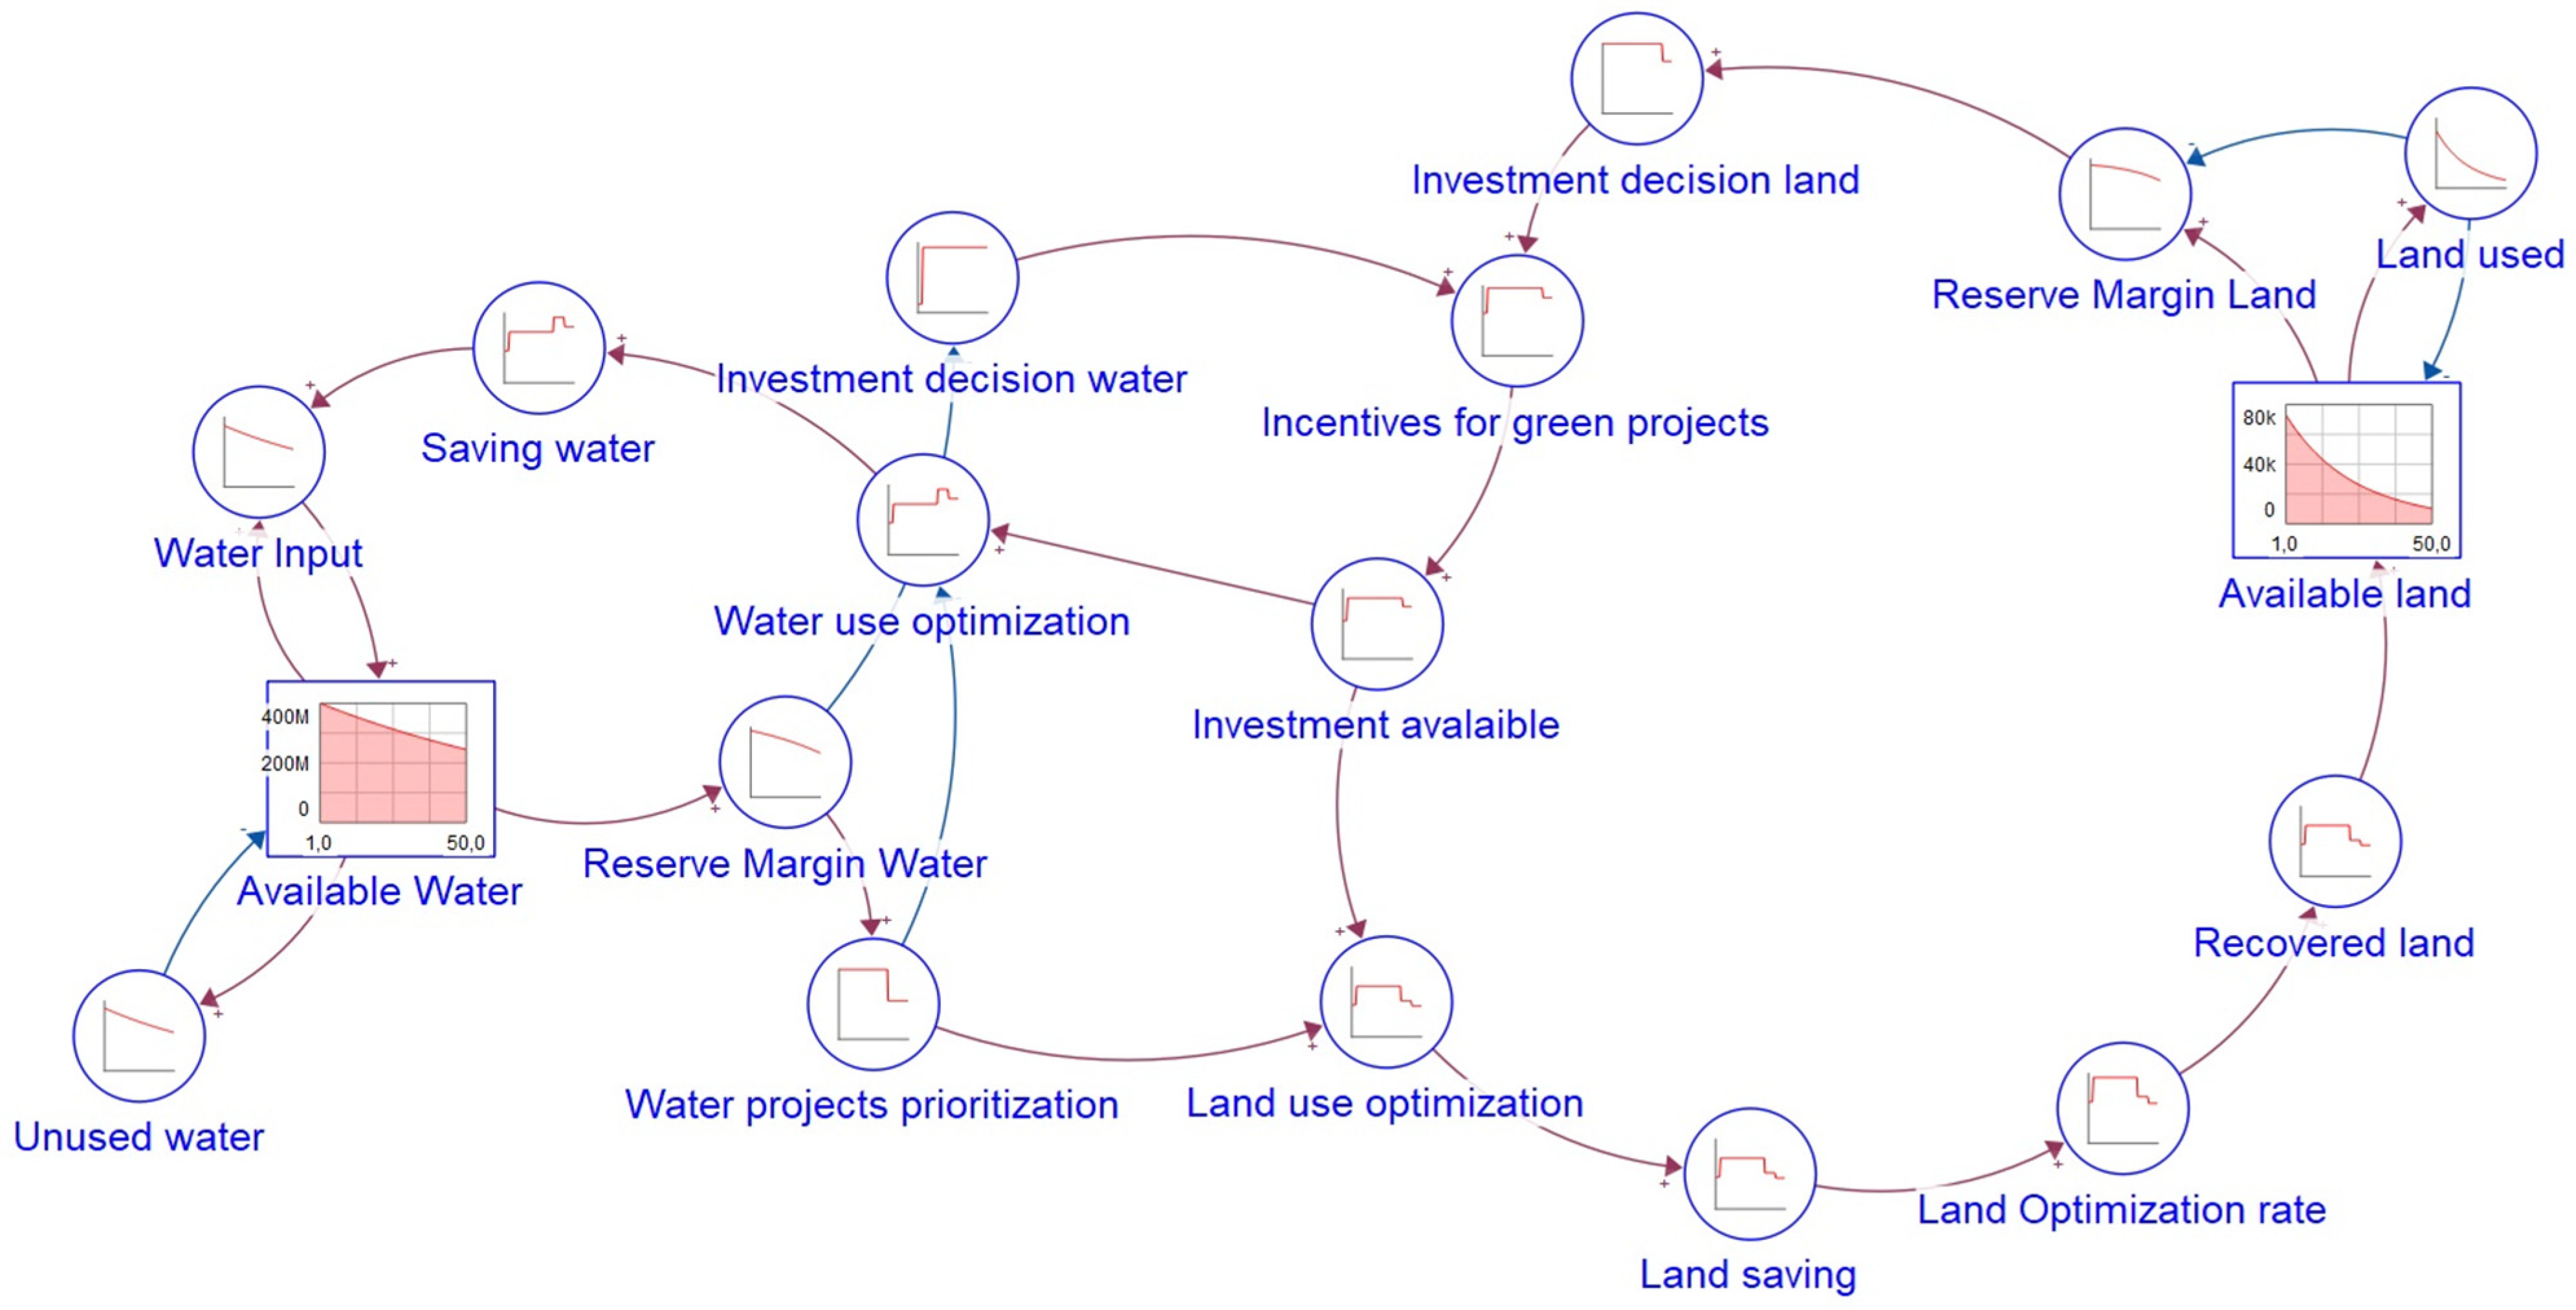
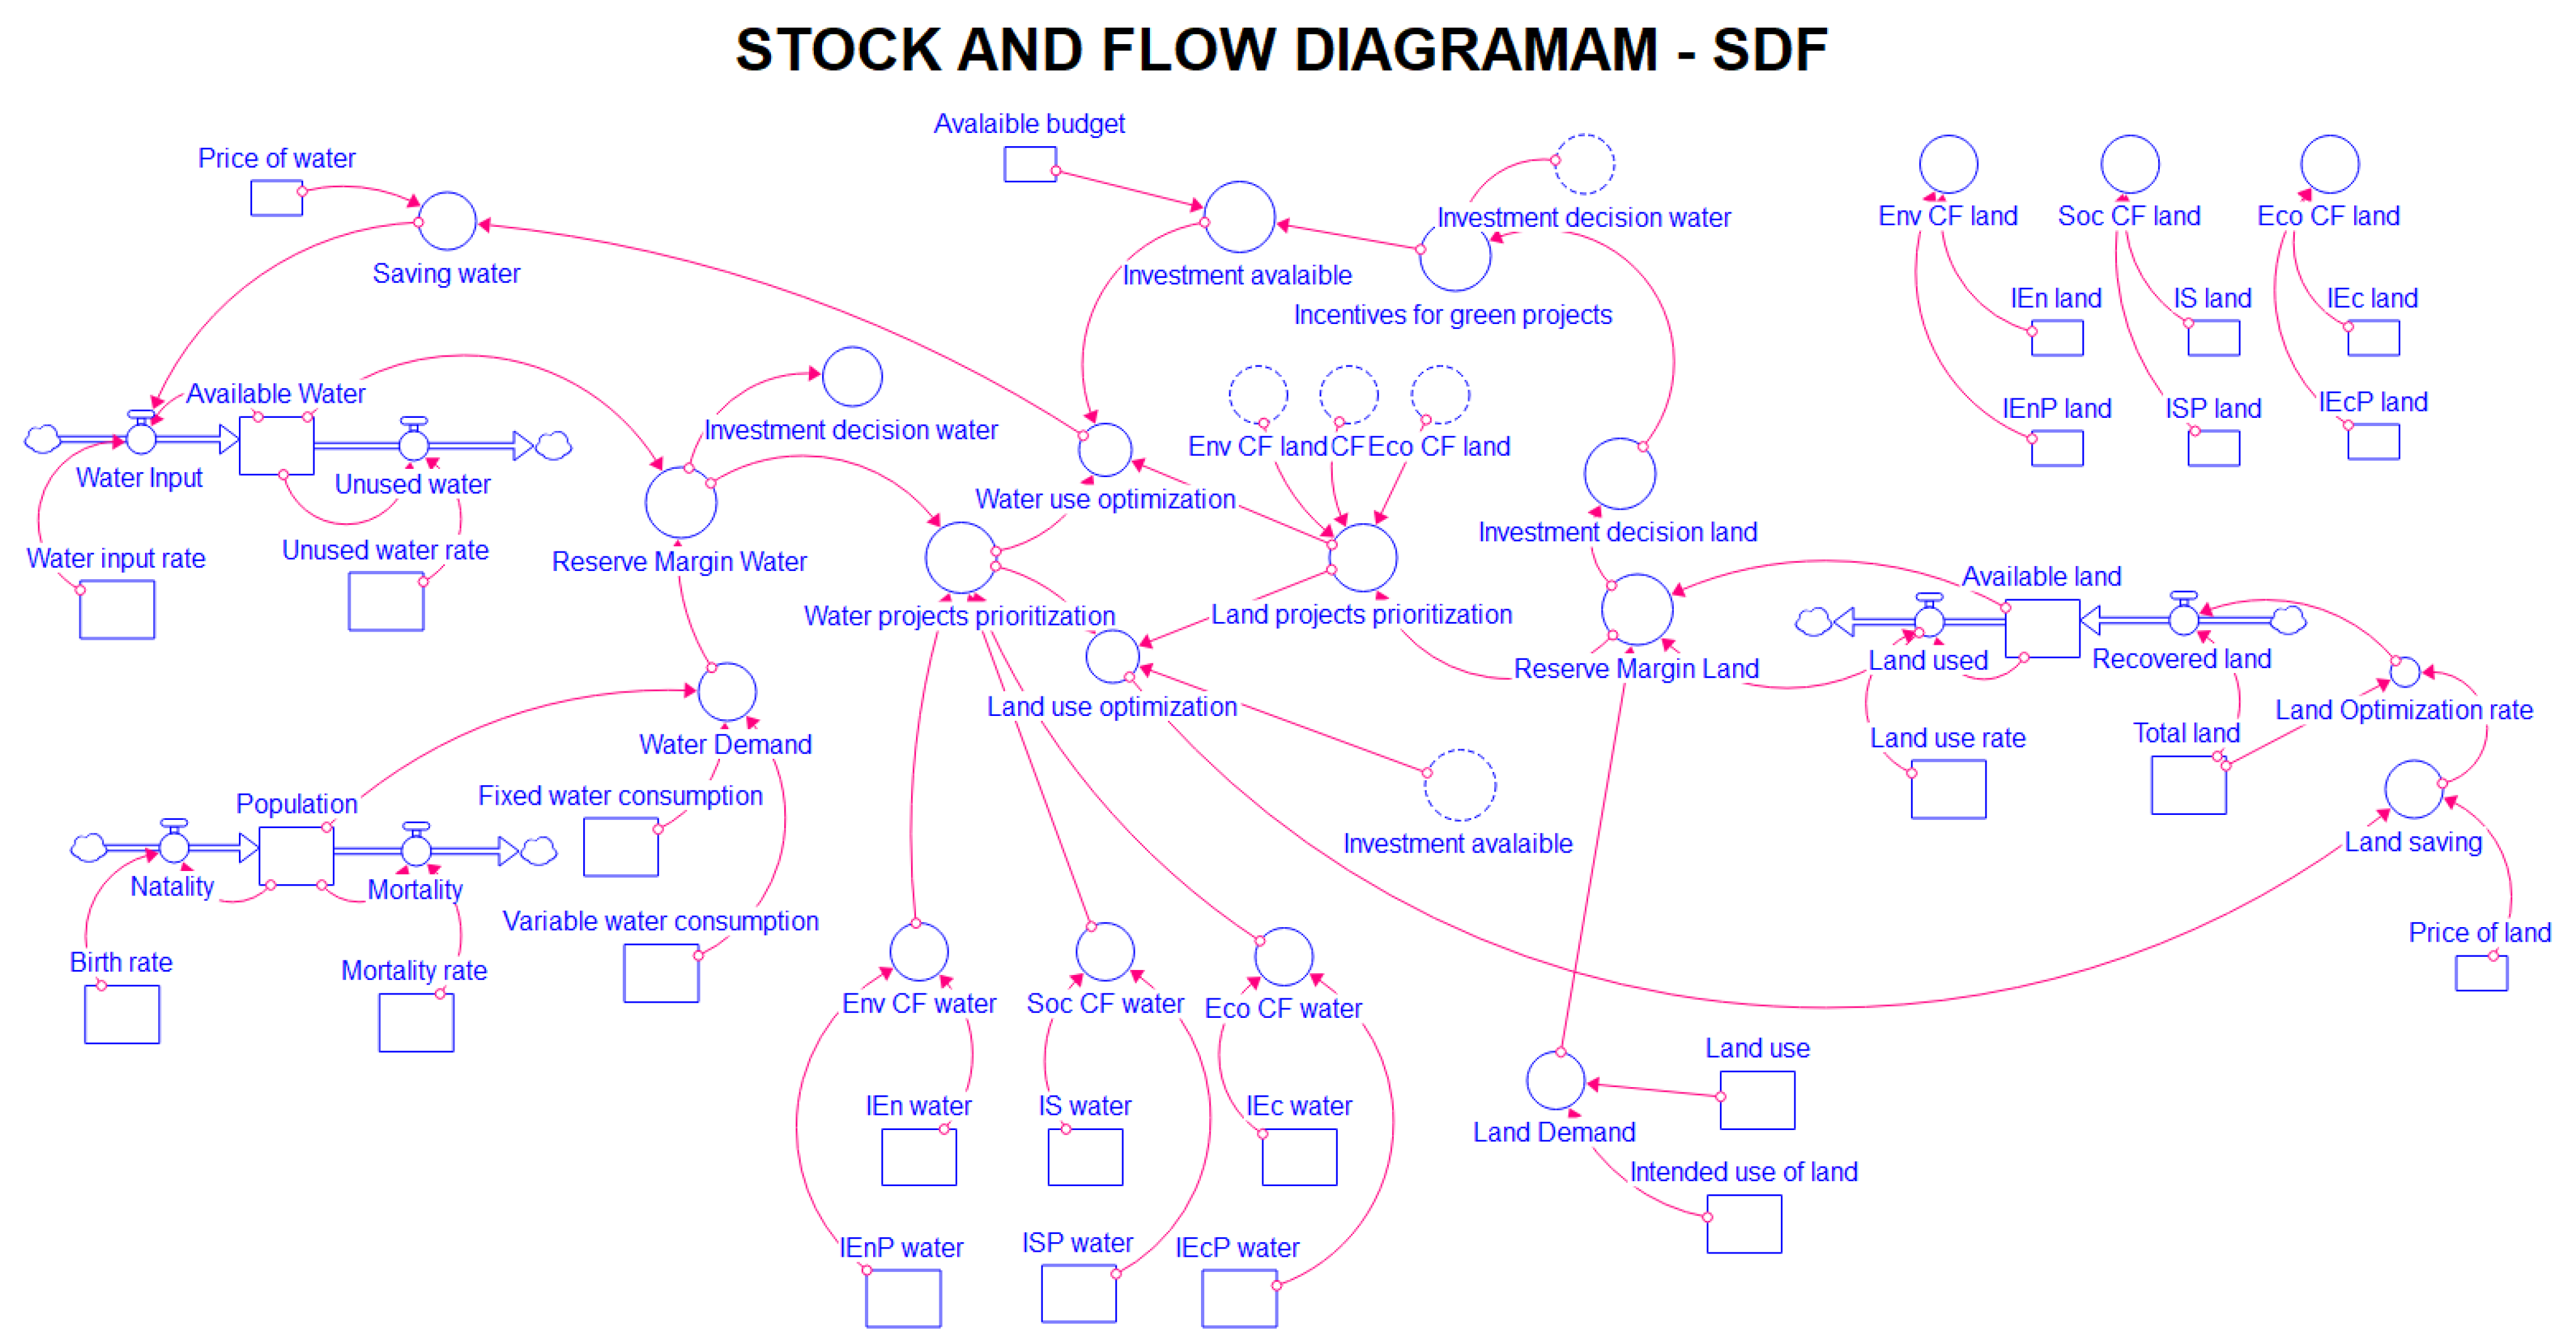
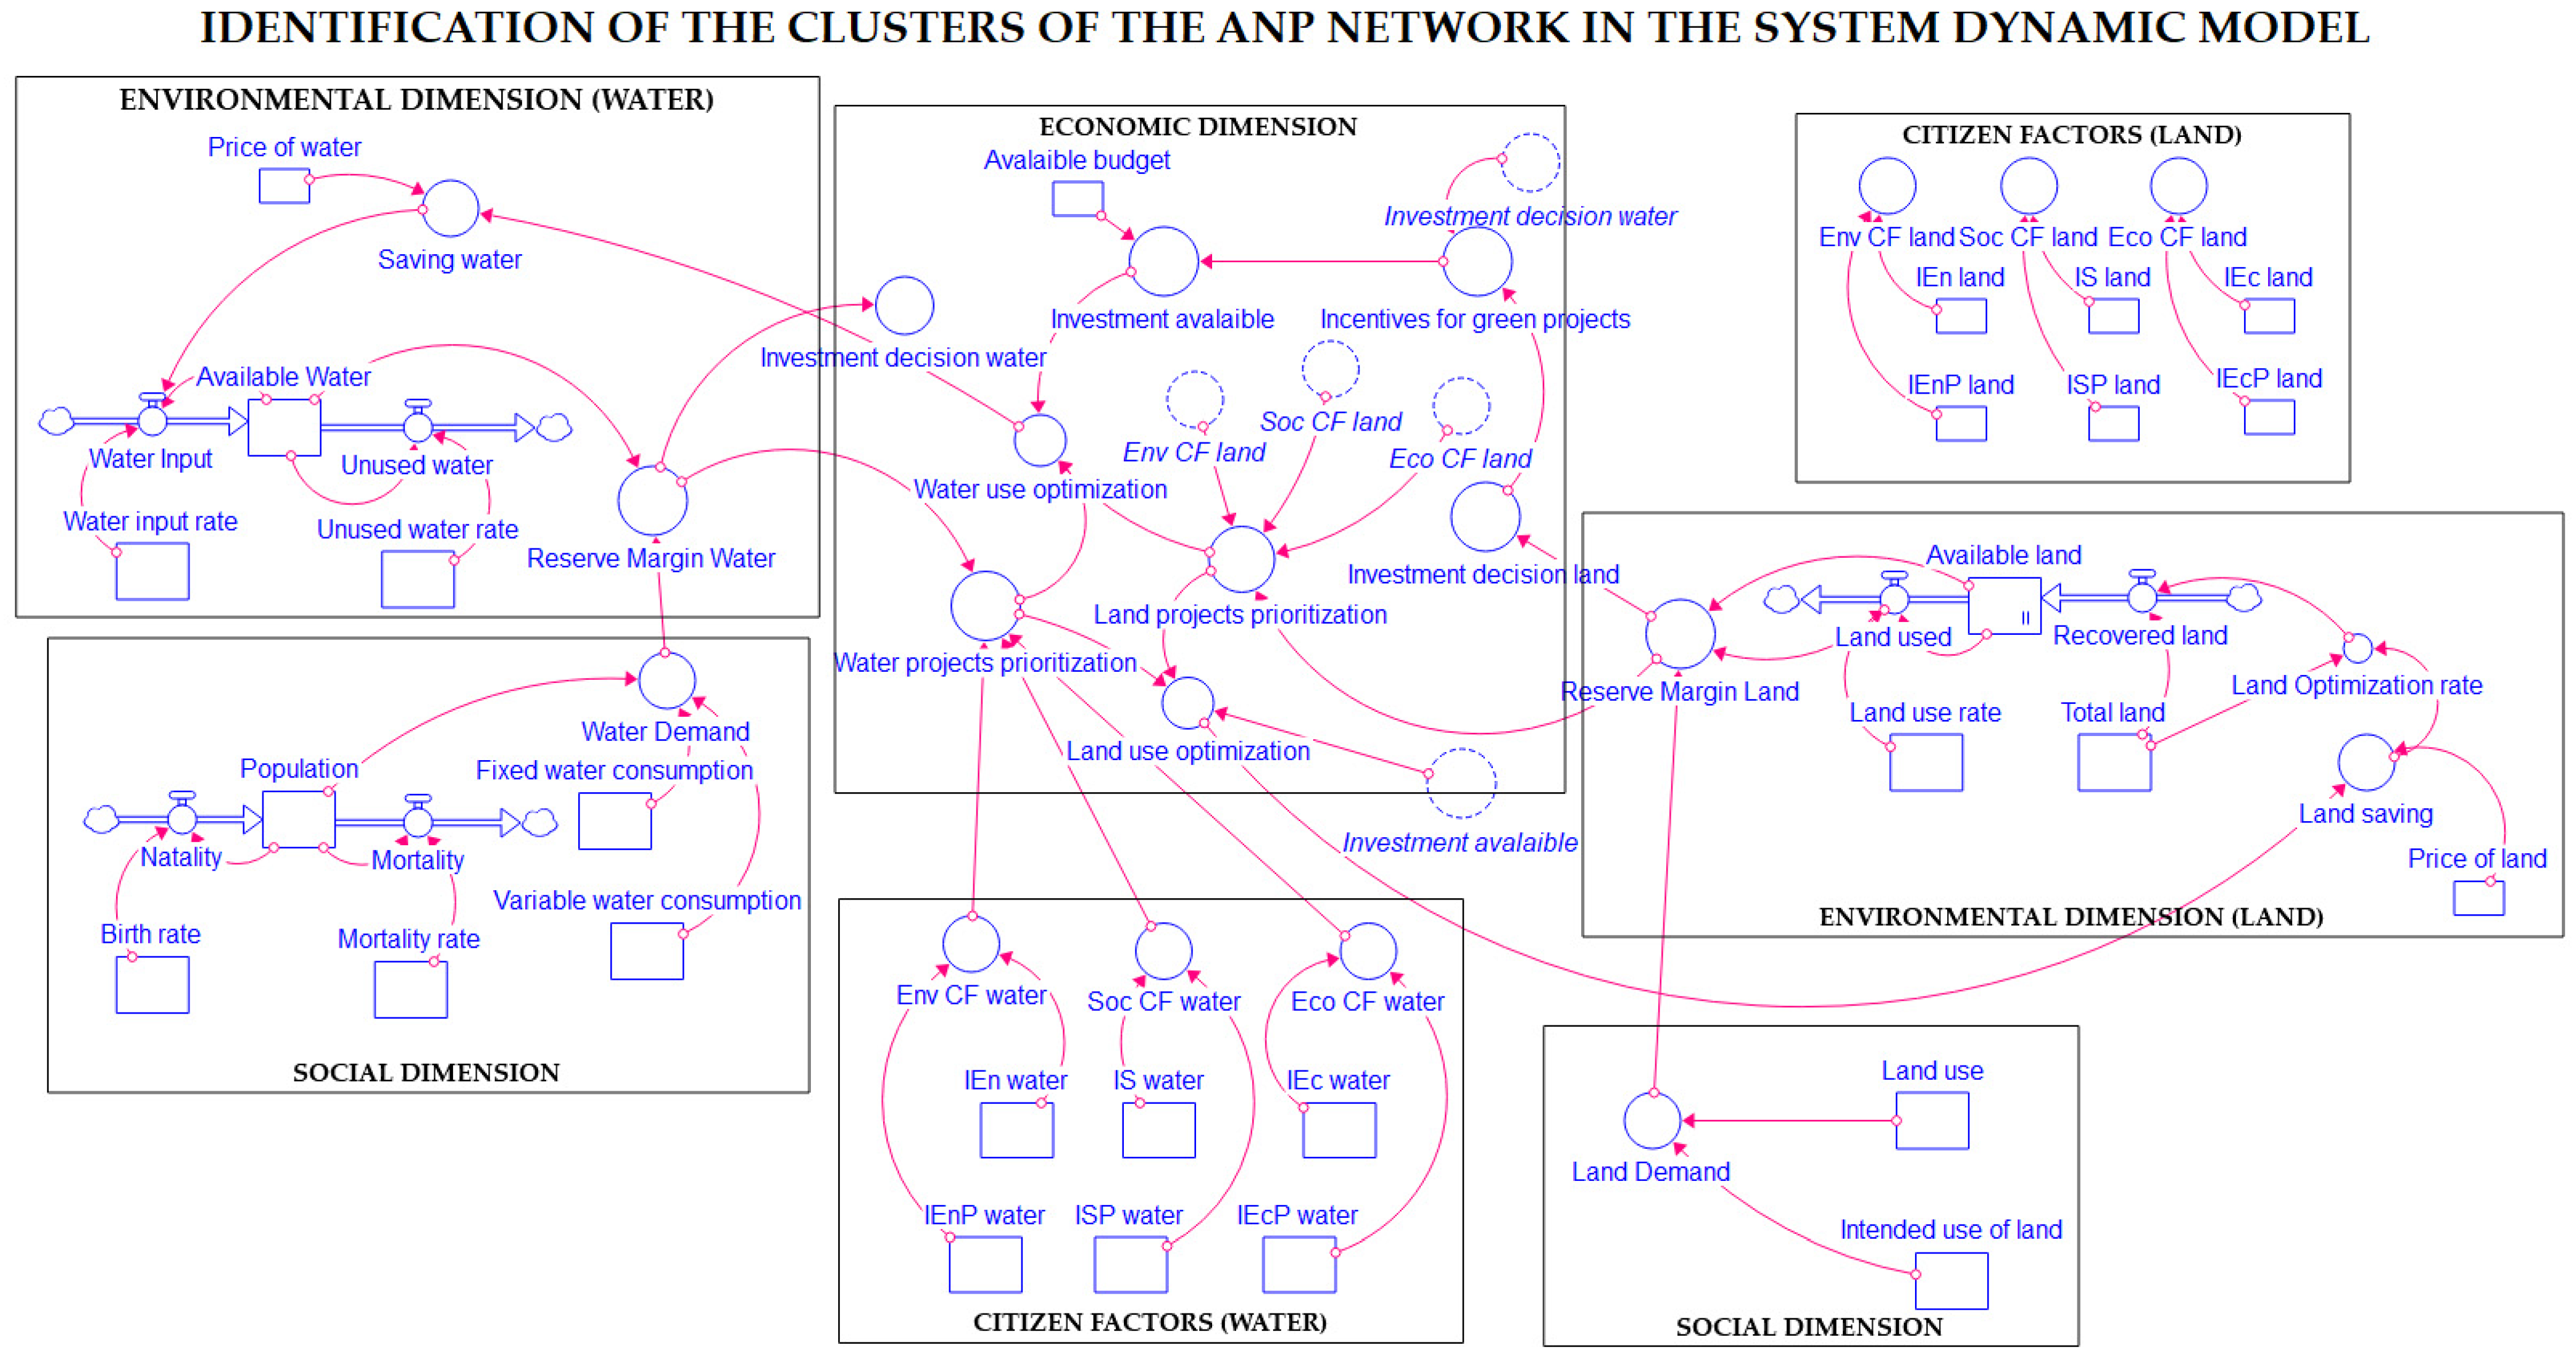
2. System Dynamic Model

The proposed methodology was carried out using a two-stage structure. Figure 1 shows the general approach of its application and adaptation to the specific case study. The first stage consists of the elaboration of the model using system dynamics through different steps.
The first step in the creation of the modeling is the problem identification. In our case, the problem lies in how to improve the ability to evaluate and prioritize green projects, knowing previously that the main problems and the development delay of the communities that belong to the post-conflict period in Colombia [6,15] are related to the availability and the use of the natural resources such as water and land [1,3]. That evaluation and prioritization capacity is understood as the selection of the most appropriate projects that can respond to the problems, needs, and expectations of the community [16,17].
The second step was the hypothesis planning, through which it was exposed that it is possible to anticipate where and at what moment of time to direct investments in green projects; keeping in mind, first, the availability and the use of the natural resources of water and land (supply and demand relationship), and in second place, citizen factors determined directly with the community through participation workshops.
In the third step for the creation of the modeling, we made the casual loop diagram or CLD (Figure 2) [18,19], in which we identified the relationships between state variables (supply and demand for water; supply and demand for land; and, of course, population), and the different parameters, among them the citizen factors. The fourth step was the creation of the stock and flow diagram or SFD (stock and flow diagram, Figure 3) [20,21], in which the casual loop diagram is complemented by secondary variables and parameters in order to simulate the behavior of the system over time.

3. Validation of the Model Using System Dynamics

There are three cases of sensibility analysis for the models based on system dynamics: numerical sensitivity, mode of behavior sensitivity, and policy implementation sensitivity. After defining the model that will be applied to generate scenarios for the evaluation and prioritization of green projects, it is very interesting to explore the numerical sensitivity because with this it is possible to show the adjustments that are required to be carried out in order to validate the hypotheses initially raised.
The numerical sensibility occurs when changes in the assumptions alter the numerical results. For example, if the water input rate in the model is changed, how the output is altered in the Available Water level variable will be observed. All the models show numerical sensibility [18] and it is possible to observe how a reduced set of scalar factors can characterize the multidimensional uncertainty in a summarized but exhaustive way [22,23]. The proposed model for this thesis shows two parameters that are of interest and that are directly related to the level variables, the water input rate in the Available Water level variable and the land use rate in the Available Land level variable. To carry out the numerical sensitivity analysis, a window was used for the water inlet rate between 0.0 and 0.45, a window for land use rate between 0 and 0.20, and the Monte Carlo method that is included in the simulation package Vensim Pro was used; Figure 4, Figure 5, Figure 6, Figure 7, Figure 8 and Figure 9 show the results. Due to solution map being very big, the Vensim Pro software was configured to make at least 2000 executions of the algorithm so that the results were consistent and cover all possible numerical solutions for the parameter ranges. It is important to mention that, for the sensitivity analysis, the uniform random distribution was used by means of which a fixed variation of the parameters is guaranteed.
In Figure 4 and Figure 5, the sensitivity analysis of the variables Available Water and Available Land manages to establish a range in which the dynamics of the system evolves and makes the projects that can be developed according to the assumed parameters feasible and those that were obtained with the help of the community in the participatory workshops were carried out. In this way, the model provides to the experts a first selection criterion and becomes a filter that can be exploited by decision makers during the development of the peer evaluations proposed in the analytical network process (ANP) and that will be shown in the next section. Once the projects are framed within this range, analysis efforts can be concentrated on the other variables of the system that account for other important factors within the complete evaluation and prioritization process.
The sensitivity analysis of the variables available water level and available ground level shows the percentage of accumulation of solutions in each of the bands that appear. For example, in the case of Figure 2 and Figure 3, the blue curved line represents the solution business as usual, that is, the model solution is shown with the initial configuration unchanged. However, the blue, green, and yellow stripes represent the percentage of accumulation of solutions found for this case, the graph indicates that 95% of the results of the 2000 simulations are in the blue band, 75% of results are in the green band, 50% of the results are in the yellow band, and the gray stripe indicates the possible scenario of all simulations, that is, 100% of the simulations are located from the gray band to the other bands that overlap it.
Now, in Figure 6 and Figure 7, the sensitivity analysis focuses on the variables called reserve margins, both water and soil. This time the sensitivity shown by these variables accounts for the narrow margin that exists between the use and abuse of natural resources of water and land, which, in turn, can mean their abundance or scarcity. Therefore, this analysis could also guide investment decision-making regarding one project or another, depending on the community and depending on the availability of resources in the area.
As we said previously, in Figure 6 and Figure 7 the sensitivity analysis focuses on variables called reserve margins, both water and soil. This time, the sensitivity shown by these variables shows the narrow margin that exists between the use and abuse of natural resources of water and land; at the same time they can show the abundance or scarcity. Therefore, that analysis could also guide investment decision-making regarding one project or another, depending on the community and depending on the availability of resources in the area.
For the case of Figure 6, the simulation indicates that at some point there could be a zero margin, but not a negative margin. This statement coincides with the dynamic hypothesis raised in the model from the beginning, where it is not considered that there may be missing water. However, if this case occurs in the sensitivity analysis, what could be assumed is that there is an unattended demand or perhaps an excess demand for the resource.
However, as we explained previously, 95% of the simulations are in the blue band and that stage shows us that only 5% of the solutions would lead to a shortage. For the rest of the cases, the sensitivity analysis shows a scenario under which the reserve margin has a limit between 30% and 100% approximately, according to the conditions.
On the other hand, when the project prioritization variables are analyzed, Figure 8 and Figure 9, a lower degree of sensitivity is evidenced, that is, more monotonous behaviors in the system, because such variables are directly influenced by the factors citizens. However, everything will depend, again, on the availability of natural resources in the area at the time of evaluating and prioritizing the projects, and the problems and needs of the community that can be quantified in the citizen factors, with which the model is calibrated.
Additionally, 75% of the simulations are in the green band. This indicates that between 95% and 75% of the solutions found, the reserve margins show scenarios under which there is no shortage of supplies compared to the current policy; that is, with the conditions that were raised, the model has a behavior scenario where all the solutions will move within that margin. Therefore, if the sensitivity range is restricted or moved, the gap or scenario of possibilities should be closed.

Exploitation of the Model

Validation techniques tend to identify whether the model that is available is faithfully coupled to the real system or phenomenon that is being analyzed. However, when behavior patterns change as model assumptions change, we talk about sensitivity in the way of behavior [24]. These changes in assumptions can occur during the model optimization process, when it is necessary to modify a pattern that has been diagnosed as inconvenient or negative. Faced with the new alternatives, the model could go from an oscillatory behavior to a monotonic behavior. At this point, it is then also possible to use the tools that come with software such as Vensim Pro, Stella Architect, or any other type of software based on system dynamics, in order to obtain a more rigorous analysis of the system.
In short, it is possible to use these tools in models that can be represented by systems of ordinary differential equations and that additionally present no smoothness or jumps in their functional expressions. The tools provided by Vensim Pro and Stella Architect allow to show some phenomena associated with the use of stepped functions and thus evaluate alternatives and additional information in order to exploit the model in a better way.
For the model shown in the Figure 3, the auxiliary variables Optimization of Water Projects and Optimization of Land Projects are step functions, which in turn depend on the Reserve Margins (water and land, respectively) which are equally non-smooth. Hence, it is of great interest to evaluate what happens with investment decisions and the optimization of water and land use, when citizen factors are altered. In Figure 10 and Figure 11 we can see that for each value of each one of the citizen factors in the interval between 0 and 1, the output of the variables Water Projects Prioritization and Land Projects Prioritization shows a variation of less than 50% during the first 30 years, but varies substantially during the last 20 which is the time in which it is most affected by the alteration of the variables related to the reserve margins (MRA and MRS) which are very important at the time of evaluating and prioritize possible projects to be carried out. In this case, projections are made on these auxiliary variables to understand how they are affected by specific values in the parameters of citizen factors. The greater variation at the end of time implies changes in investment decisions, which would lead decision makers to move towards other types of investments, such as social or environmental, that respond to the conditions of the moment. With this tool given by Vensim Pro sensitivity two types of behavior are examined, that is, for values around 0 the dynamics system is monotonous, meanwhile for values above 0.5 oscillations occur. It is worth mentioning that these behaviors are within the possible intervals that a rural community would face in a post-conflict period, which is characterized by a monotonous and slow behavior associated with the speed of development. Therefore, for decision makers regarding the evaluation and prioritization of green projects, it is very important to know what happens before a change in the parameters in the medium and long term and is not normally undertaken when studying dynamic systems in their stationary state
To finish model validation, a policy sensitivity analysis is presented that consists of making changes in the hypotheses in order to reverse the impacts or convenience of a proposed policy. For example, in the case of the model for the evaluation prioritization of green projects, it is proposed to change the diagram under which investment decisions are calculated (water and land), analyzing two possible scenarios.
In the first test model, to calculate the value of the variable Incentives for Green Projects, a greater weight is given to the variable Investment Decision Water maintaining no changes in the variable Investment Decision Water, and a greater weight is given to the variable Investment Decision Land. Now, exploring extreme cases, a second test model is proposed, in which one of the variables could be Investment Decision Water or Investment Decision Land becomes zero, in order to observe the changes in the variables Water Use Optimization and Land Use Optimization.
When carrying out the sensitivity analysis before the policies of the diagrams in the first, second, and third test models, it can be seen that when the weight varies in the variable Investment Decision Water or Investment Decision Land, for the first test model, it presents greater variability than the second and third test models, see Figure 12, Figure 13, Figure 14 and Figure 15.
If it is possible to establish the weights of the variables regarding the investment decision for which the maximization of the variable incentive for green projects is achieved, the dynamic flow of this system evolves without having to change between investment and non-investment decisions. In this way, the variability in the decisions of the entities in charge of evaluating and prioritizing the projects for this community is reduced. Additionally, if we compare the variables Investment Decision Water and Investment Decision Land (weighted), with the variables Water Project Prioritization and Land Use Optimization, it is clearer that the parameters associated with these, that is, the citizen factors, are the ones that significantly affect the behavior of the system. Therefore, sensitivity analysis efforts can be concentrated on them to obtain more out of the model.
In conclusion, according to the results of the validation it is possible to say that the model is valid because in front of a variation in parameters in the specific ranges determined above, it is shown that all the simulations used for the sensitivity analysis respond consistently with the dynamic hypothesis proposed for this research.

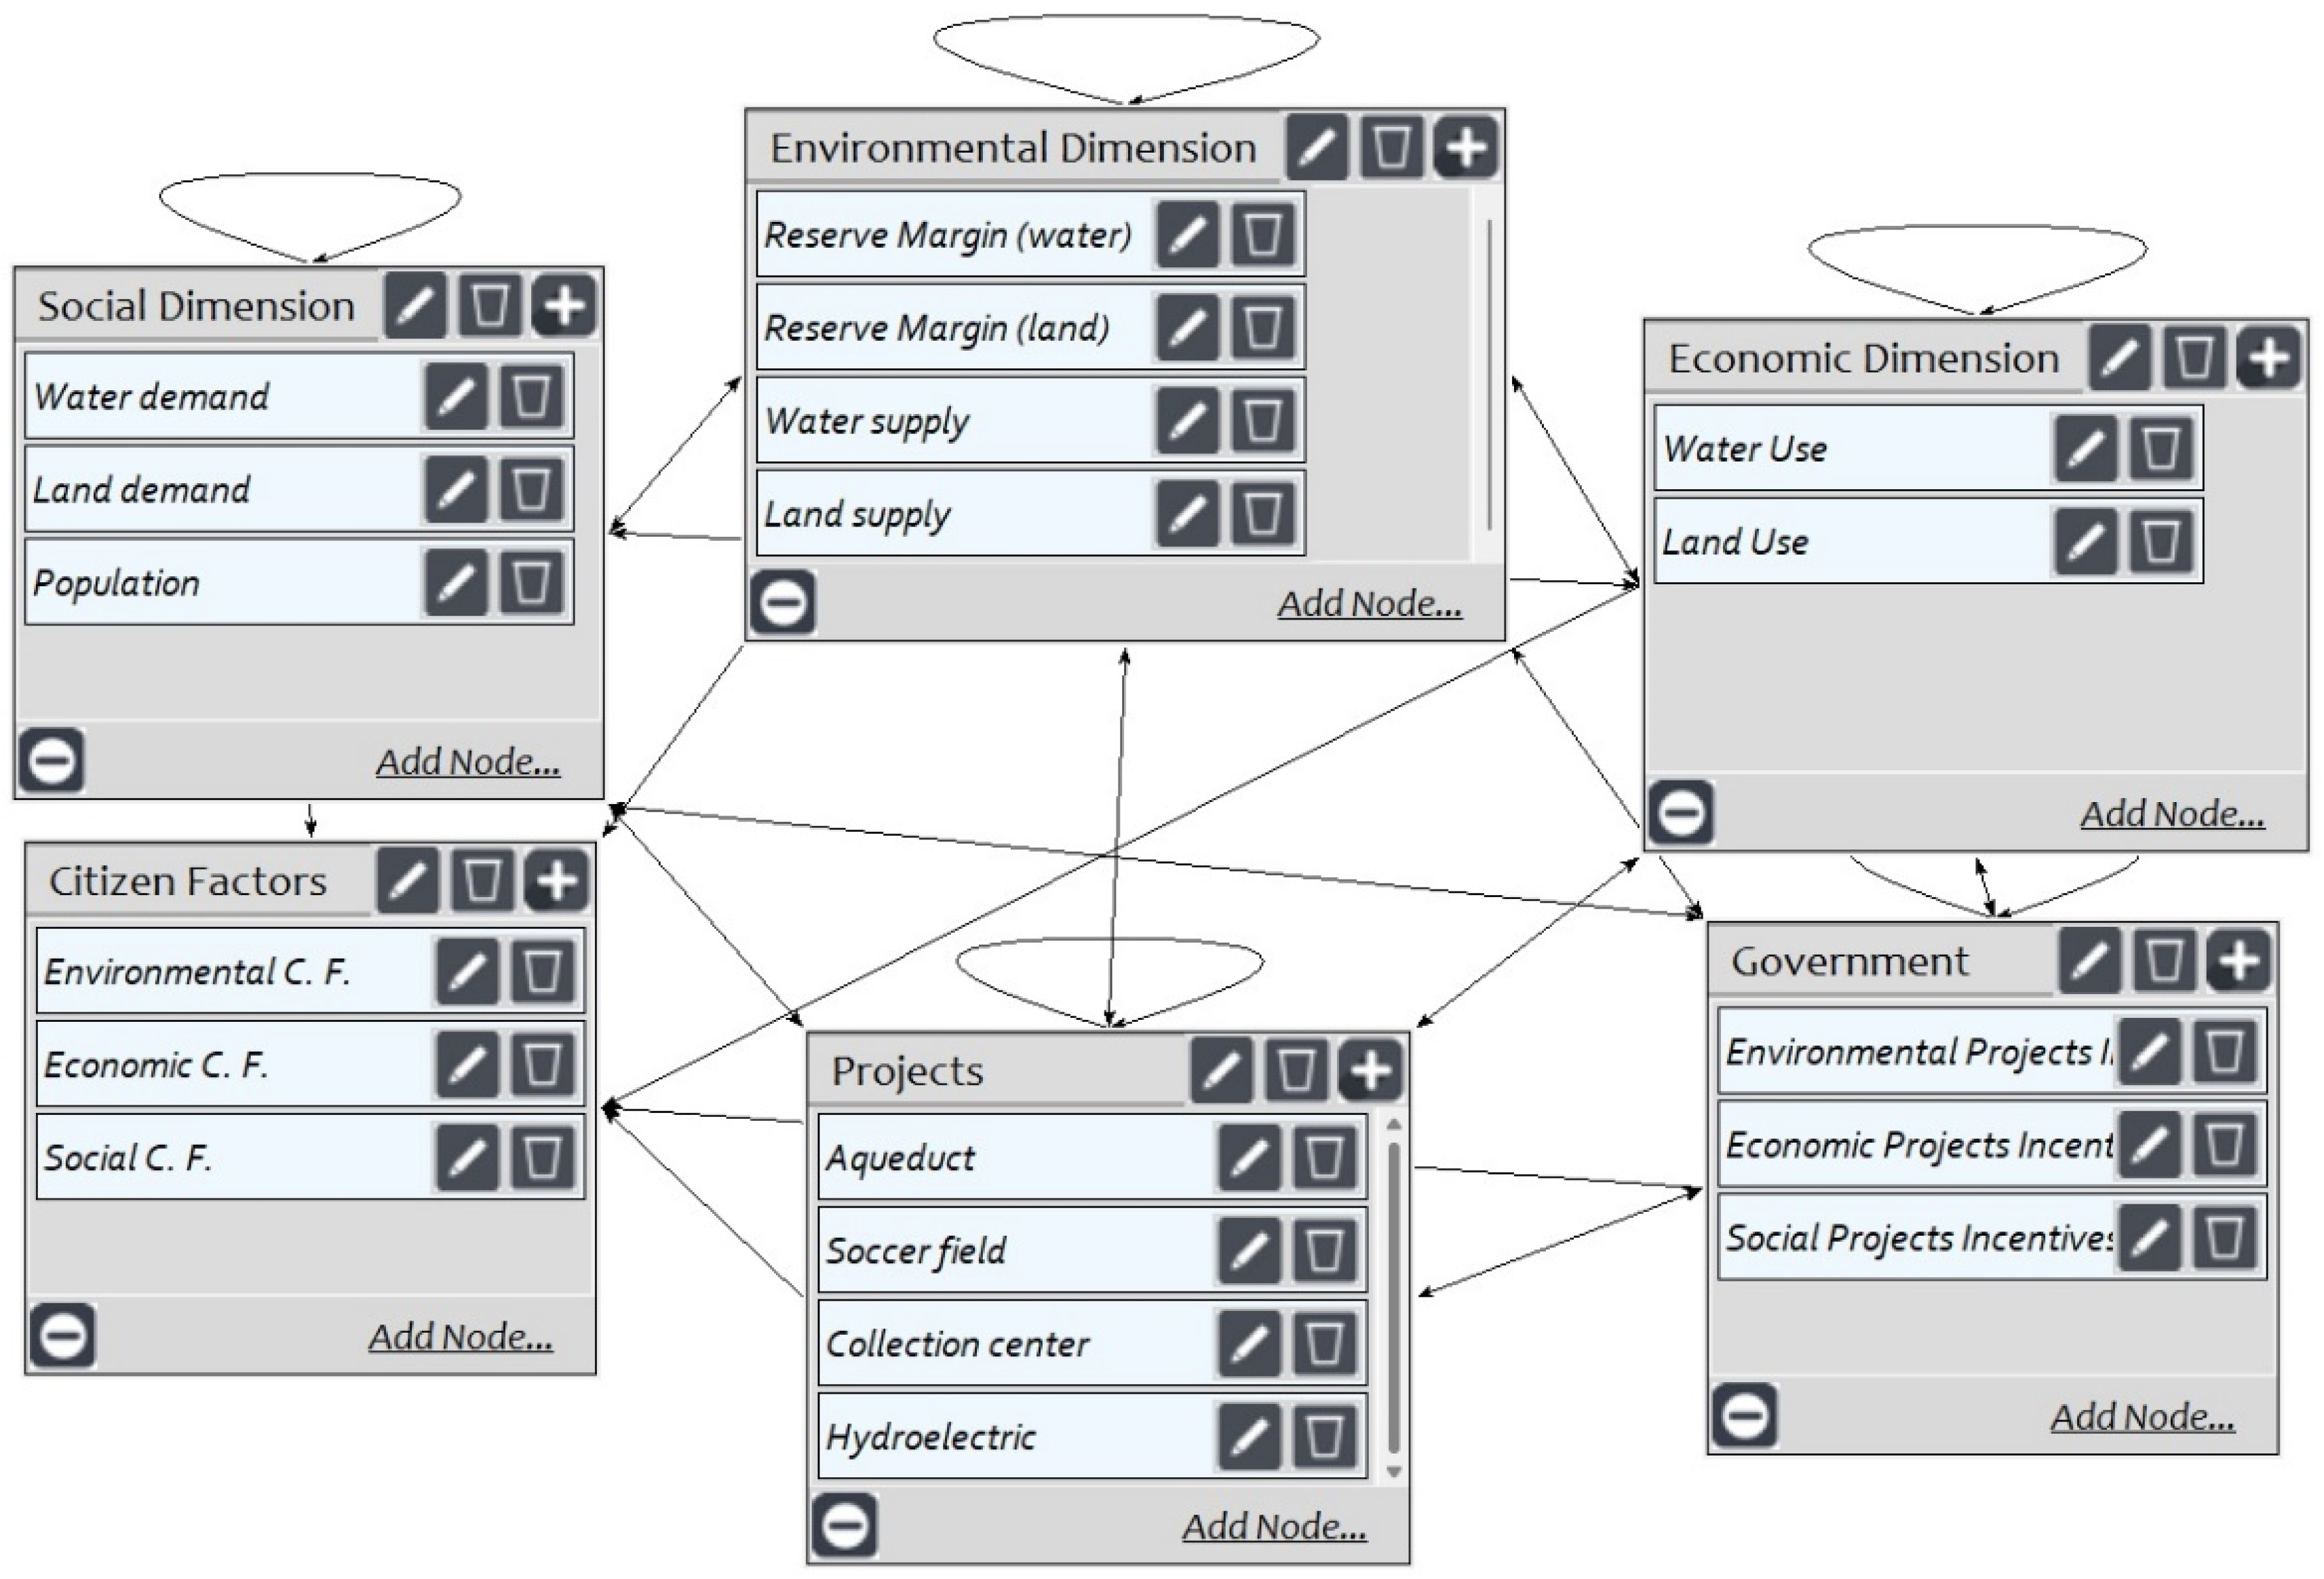
4. ANP Network Structure

The second phase of the proposed methodology corresponds to the evaluation and prioritization of projects through the multi-criteria decision method ANP (network analytical process) [7,25,26]. The ANP method allows to identify and consider mutual dependencies between the different evaluation criteria [13]. Therefore, it is possible to structure a cluster and node network and, therefore, define the interrelationships that occur between them [27]. The general structure of a network ANP is composed of source nodes and destination nodes (drain) that are determined when the paths of influence are established [28]. The connections between nodes and elements can occur through feedback to components of other elements by ringlets to the same components [29]. Due to the large number of interdependencies and interactions in the proposed system dynamics model, likewise, the impossibility of structuring it hierarchically, we decided to use the ANP method like the method for the evaluation and prioritization of the projects (alternatives). The creation of the structure of the ANP network started from the system dynamics model and was carried out in different steps.
The first step consisted of the identification, in the model in DS, of the clusters that would make up the ANP structure. At this point we identified six clusters that corresponded to the social, environmental, and economic dimensions. In addition to the citizen factors and the government dimension, the ANP structure was completed with the cluster that belongs to the alternatives or projects to be evaluated and prioritized, as shown in Figure 16.
The second step consisted of the identification of the nodes and elements that make up each cluster. In this way, those variables and parameters of the model that were found were established as elements inside each identified cluster in the previous step. Likewise, the interconnections and dependency relationships were established according to the existing relationships in the model in DS. In Figure 17 we can see the complete structure of the ANP network.

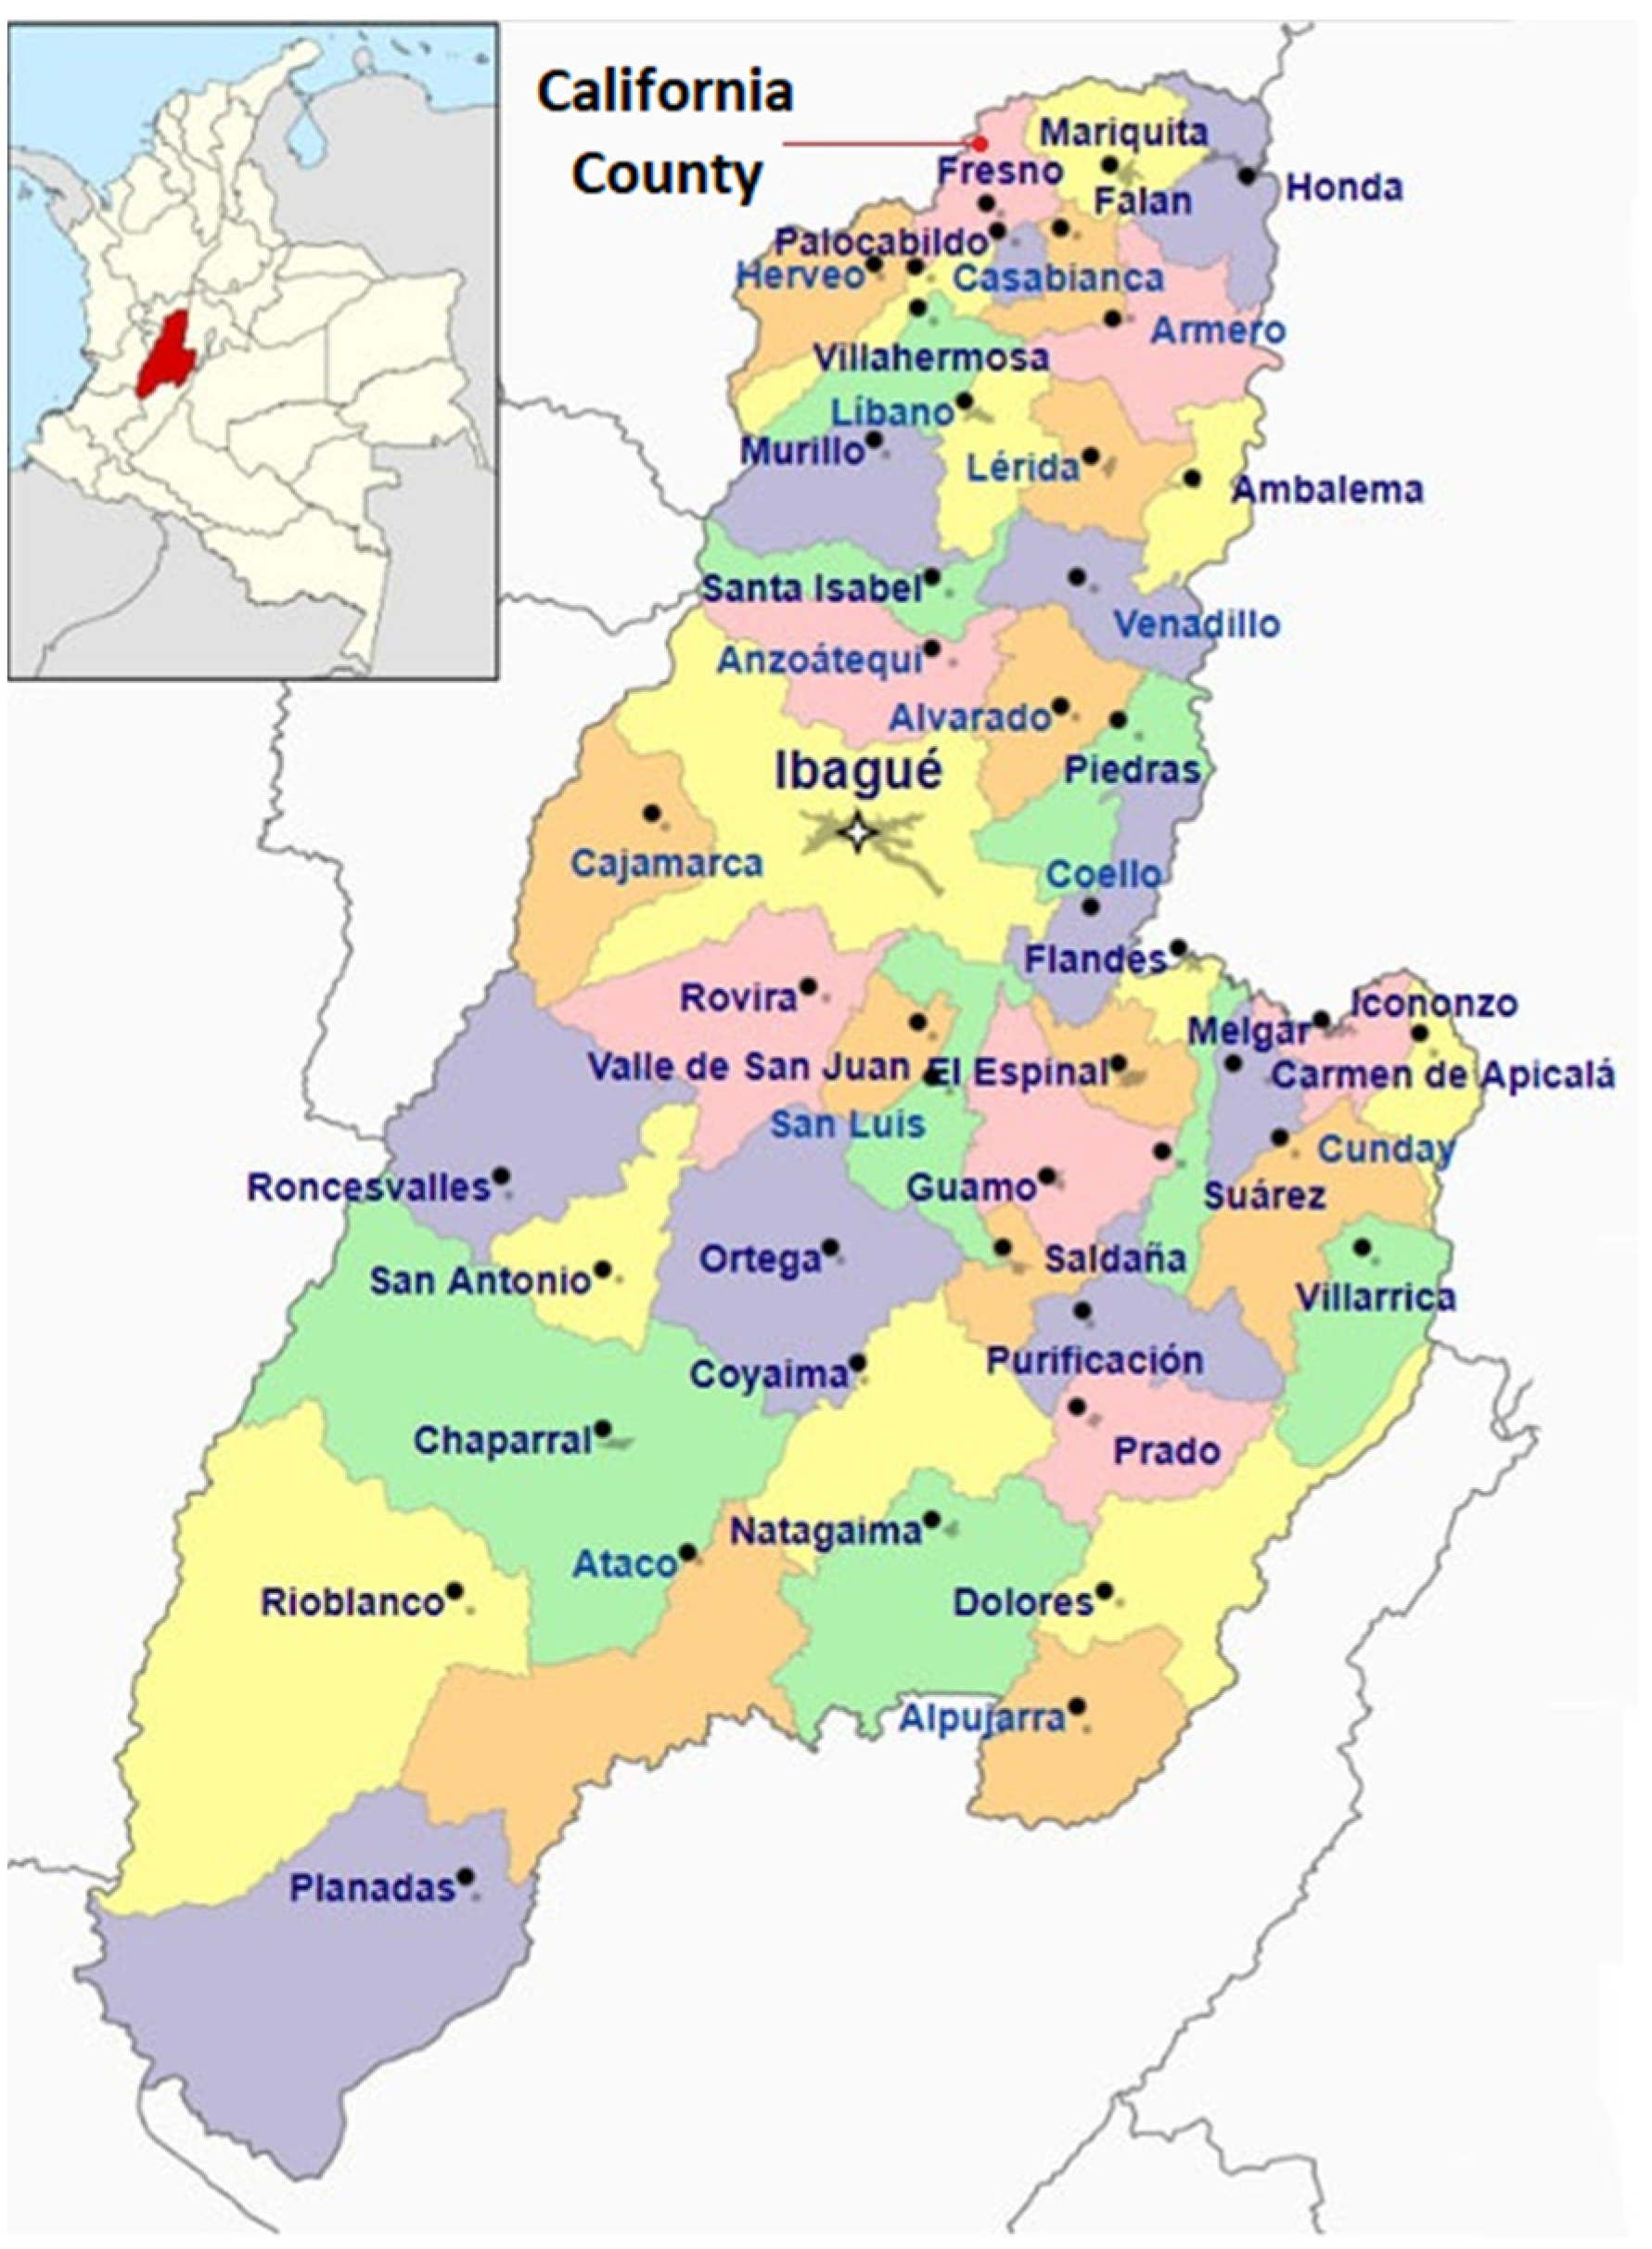
5. Study Case California County (Fresno, Tolima)

The application of the proposed methodology was carried out through a case study in the county California, located in the Tolima department in Colombia (see Figure 18). Therefore, this zone belongs to the region of the downtown of the Magdalena region historically affected by the Colombian conflict until 2016 in which the peace agreement was signed. The county extends over 150 hectares and is located on the eastern slope of the Central mountain range at an elevation of 1800 m above sea level and belongs to the Guarinó river basin, an important tributary of the Magdalena river, one of the most important rivers of the country.

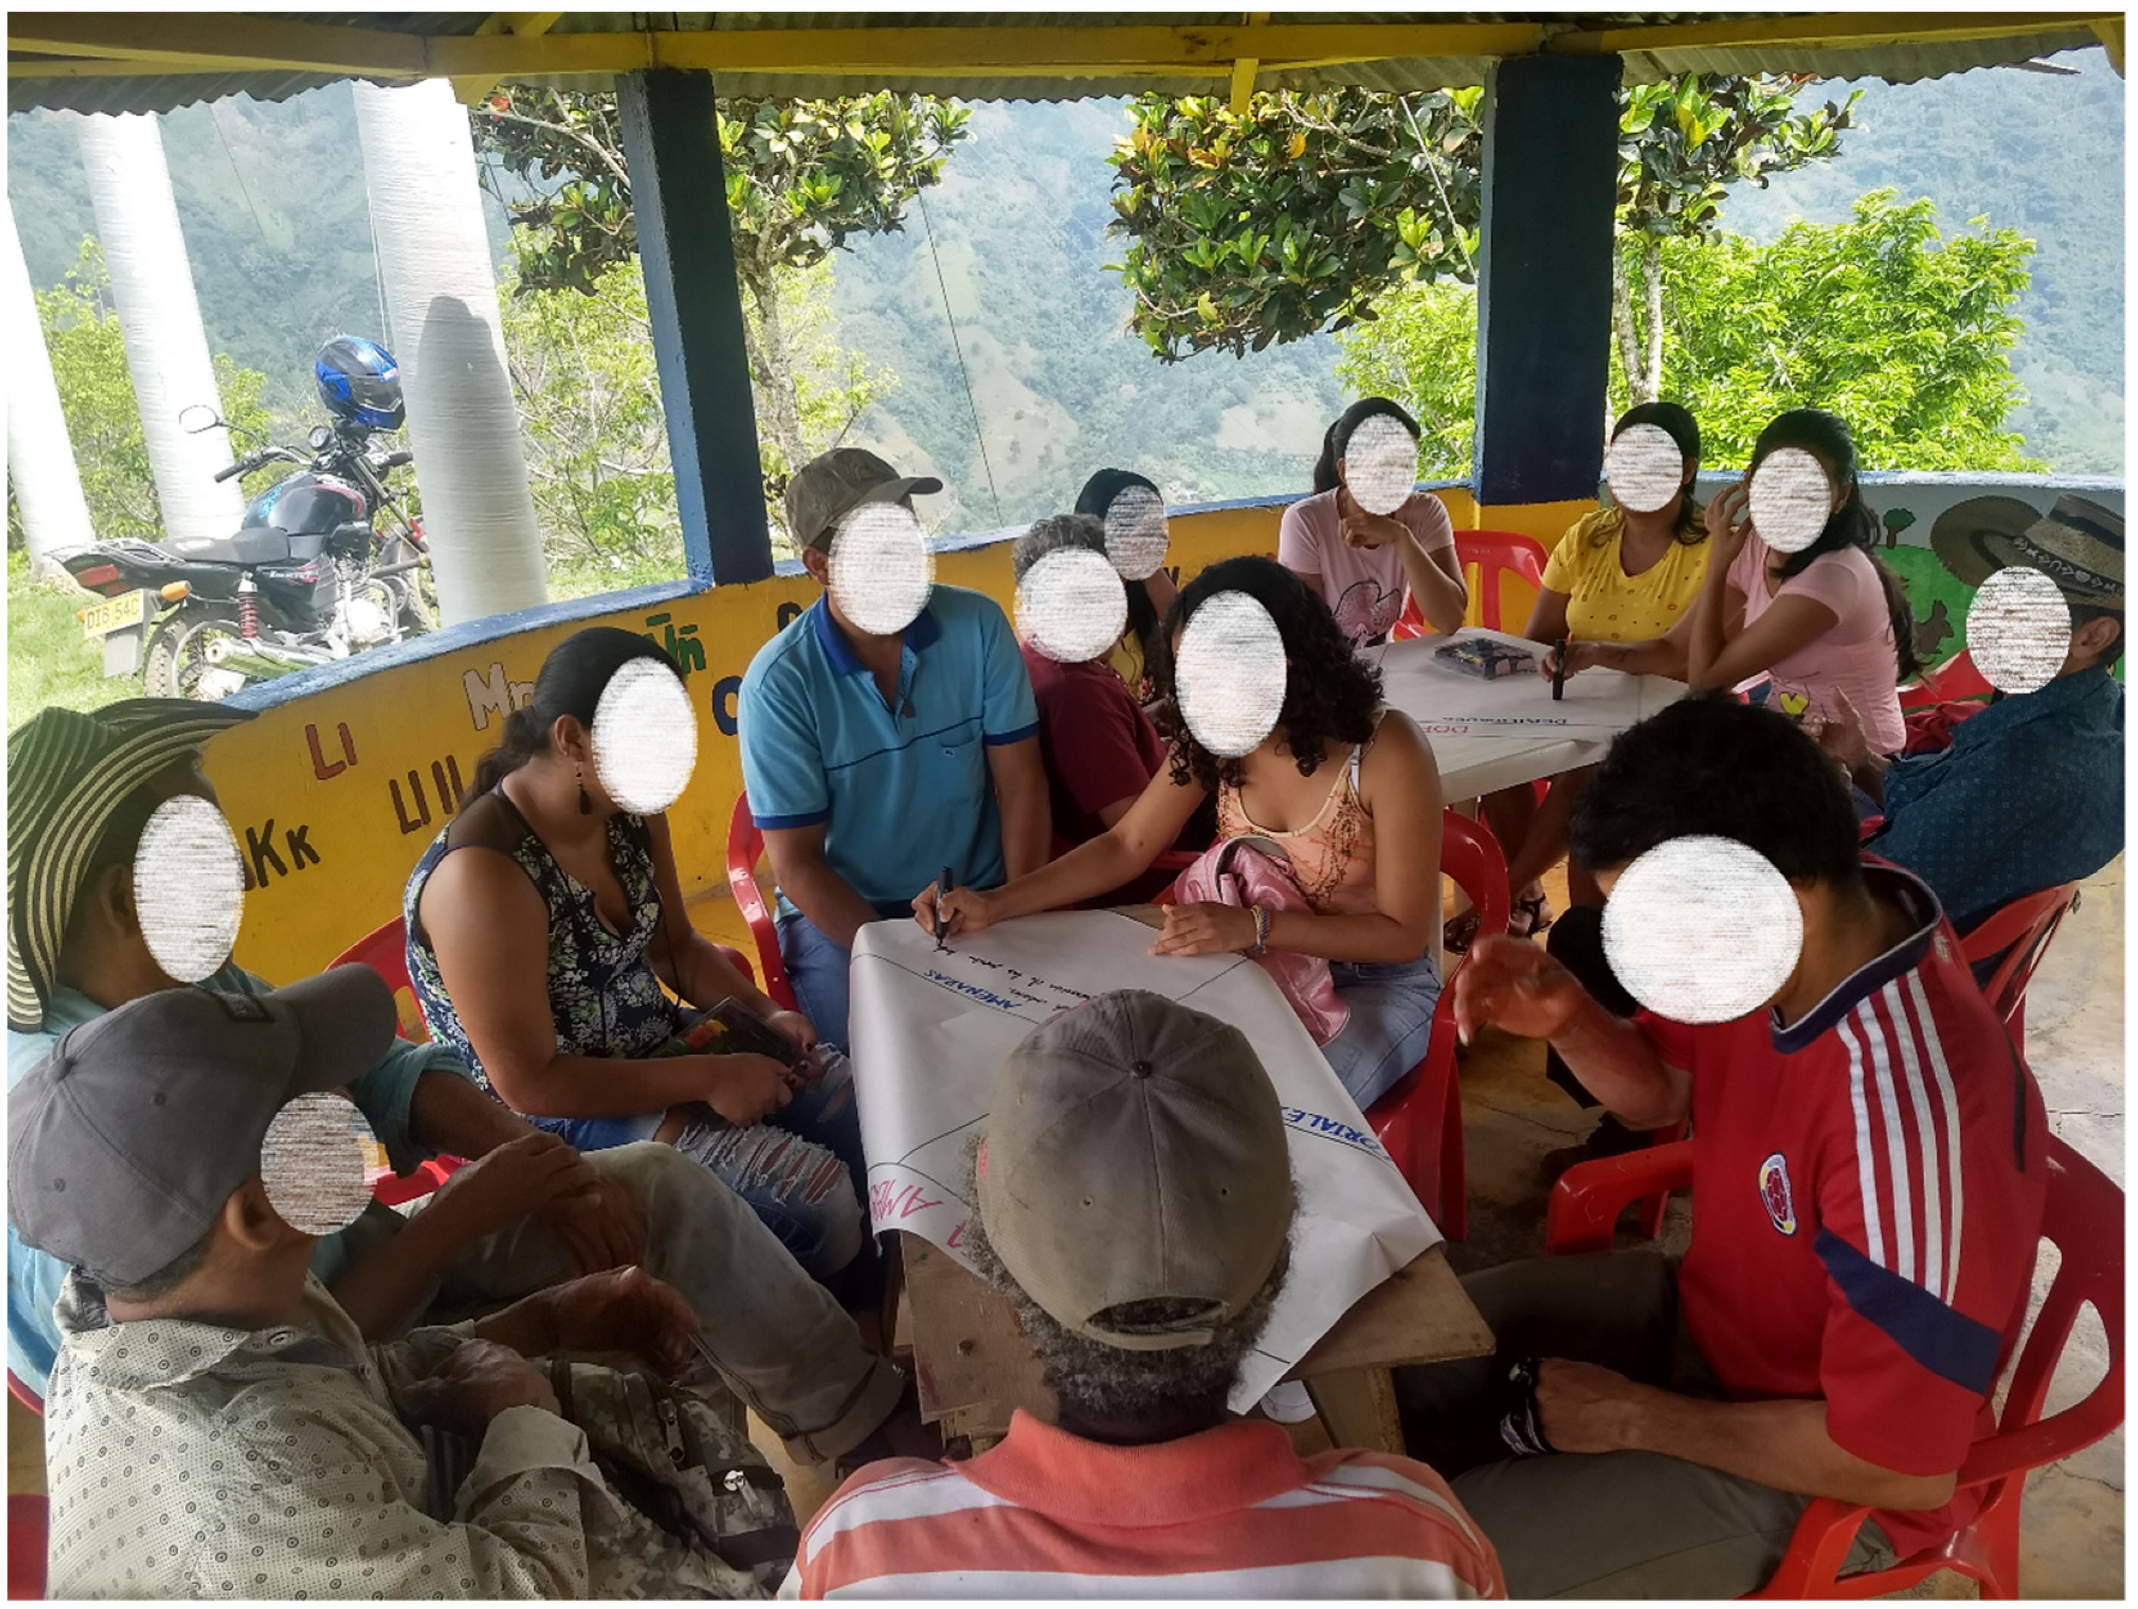
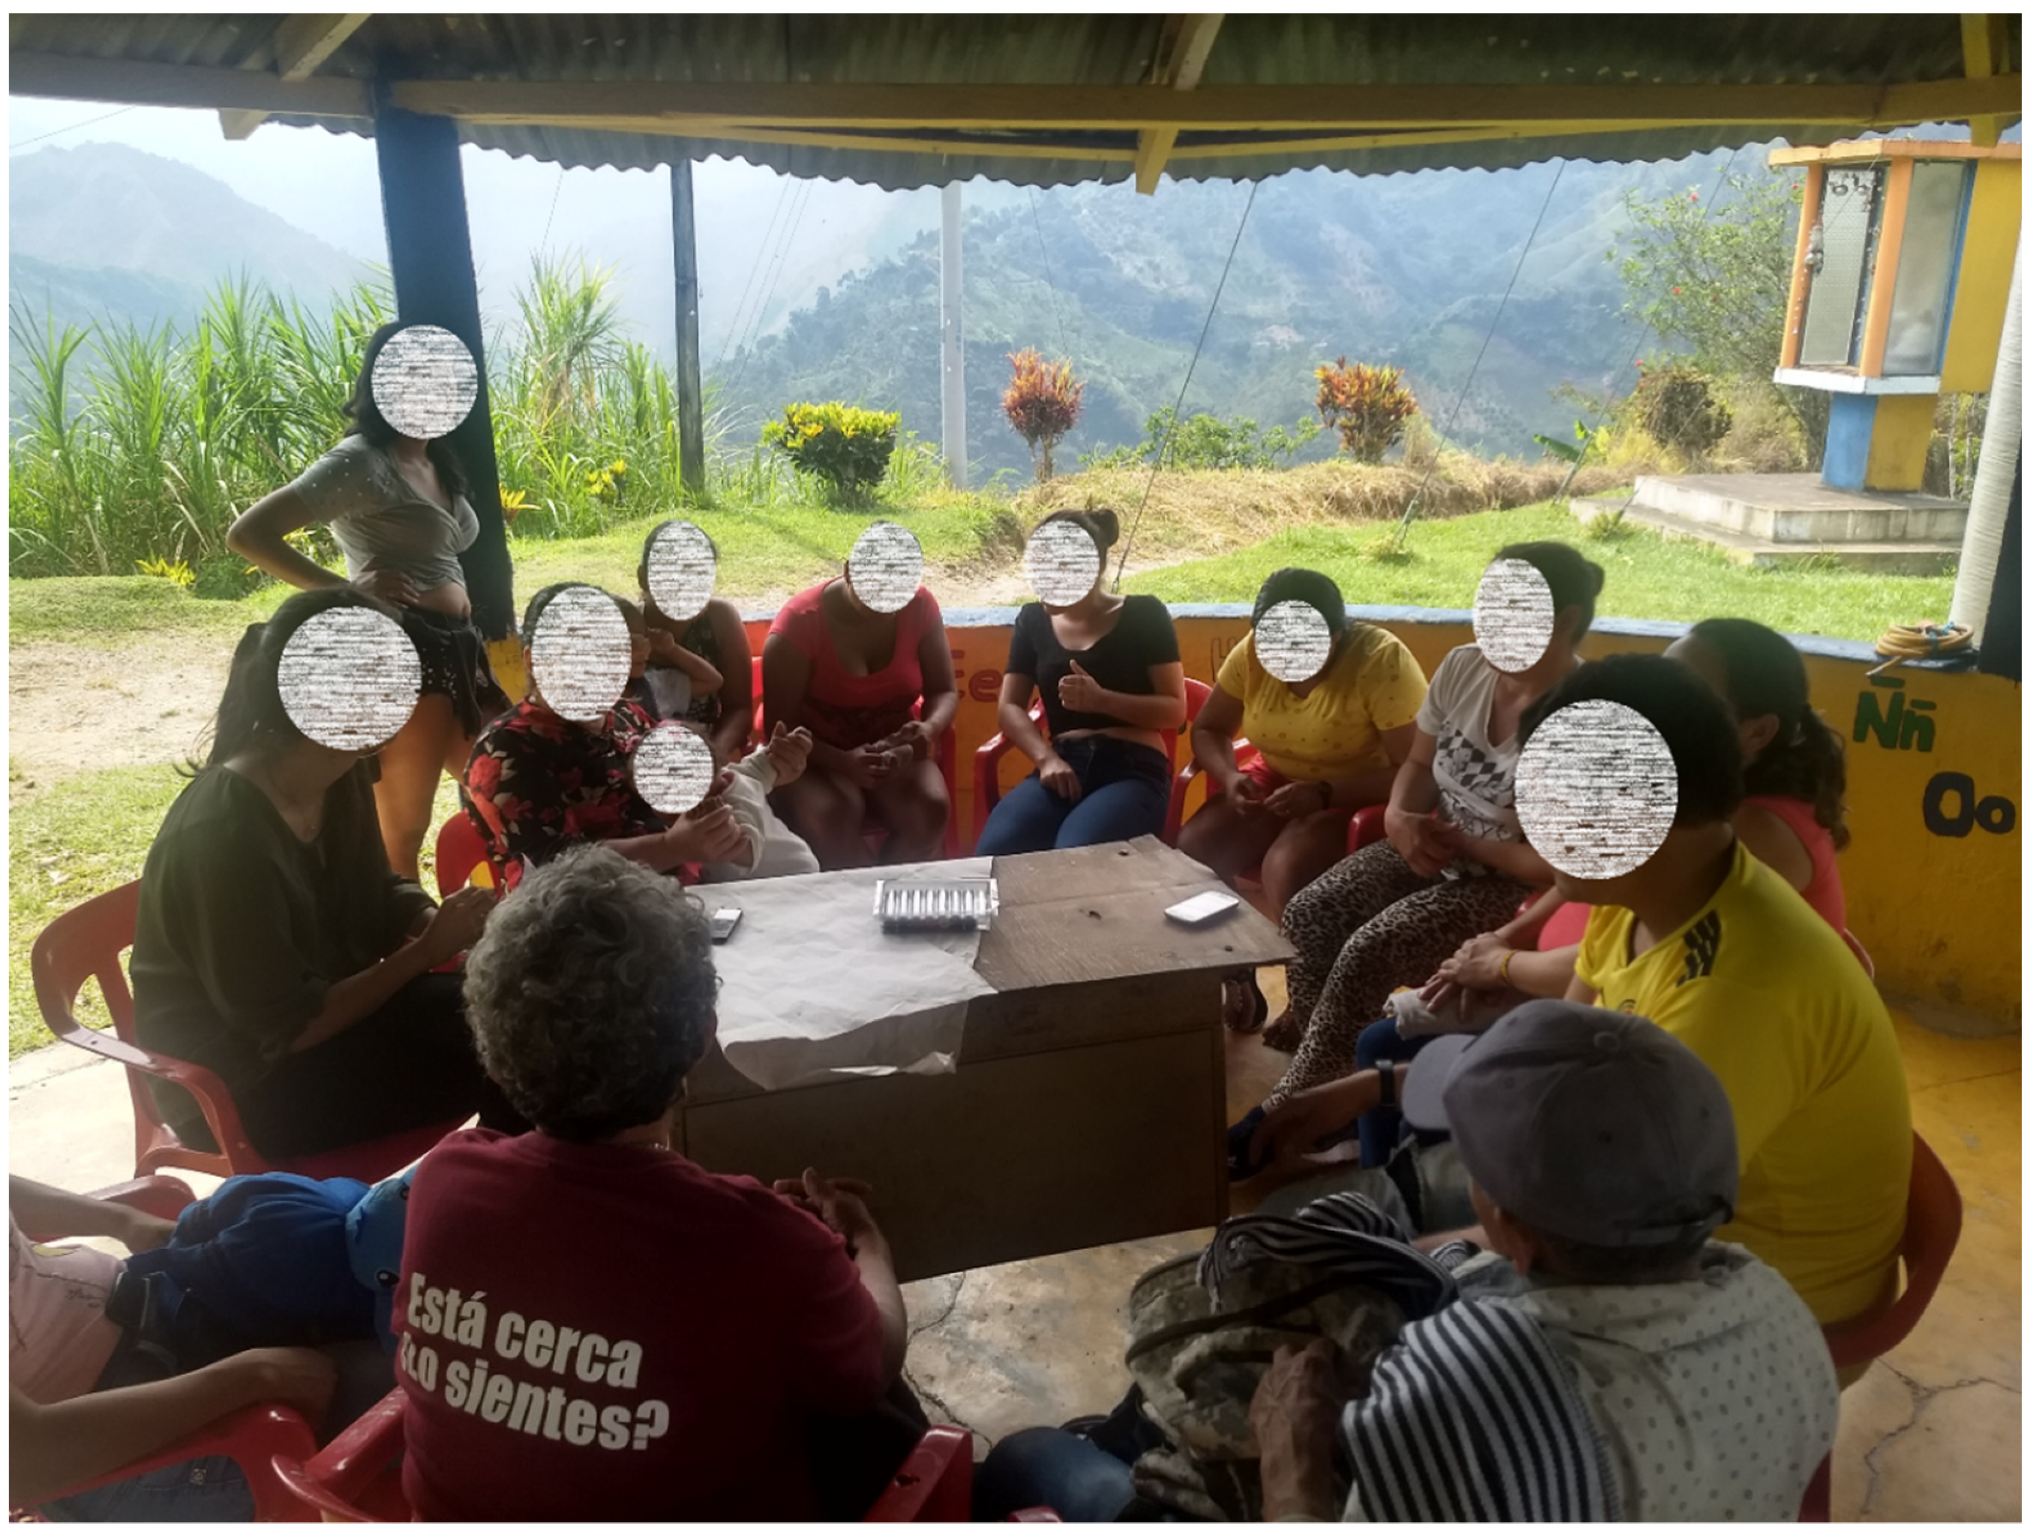
5.1. Participatory Workshop (Participatory Rural Appraisal—PRA)

Through the participatory workshop carried out with the community of the county, it was possible to gather the necessary information to calibrate the balance model in system dynamics, according to the variables and parameters proposed related to the supply and demand of water and land; likewise the citizen factors and support from local and national government, as well as other funding institutions. The workshop with the community was used the method called participatory rural diagnosis [11]. Table 1 shows the main findings, classified according to the dimension (clusters of the network ANP) to which they correspond (social, environmental, economic, and government). Therefore, the citizen factors that were determined by the facilitating team of the workshop were presented after finishing it and the alternatives, that is, the different projects to be evaluated and prioritized which also belong to the six clusters of the network. Figure 19 and Figure 20 show images of the workshop in the community hall.

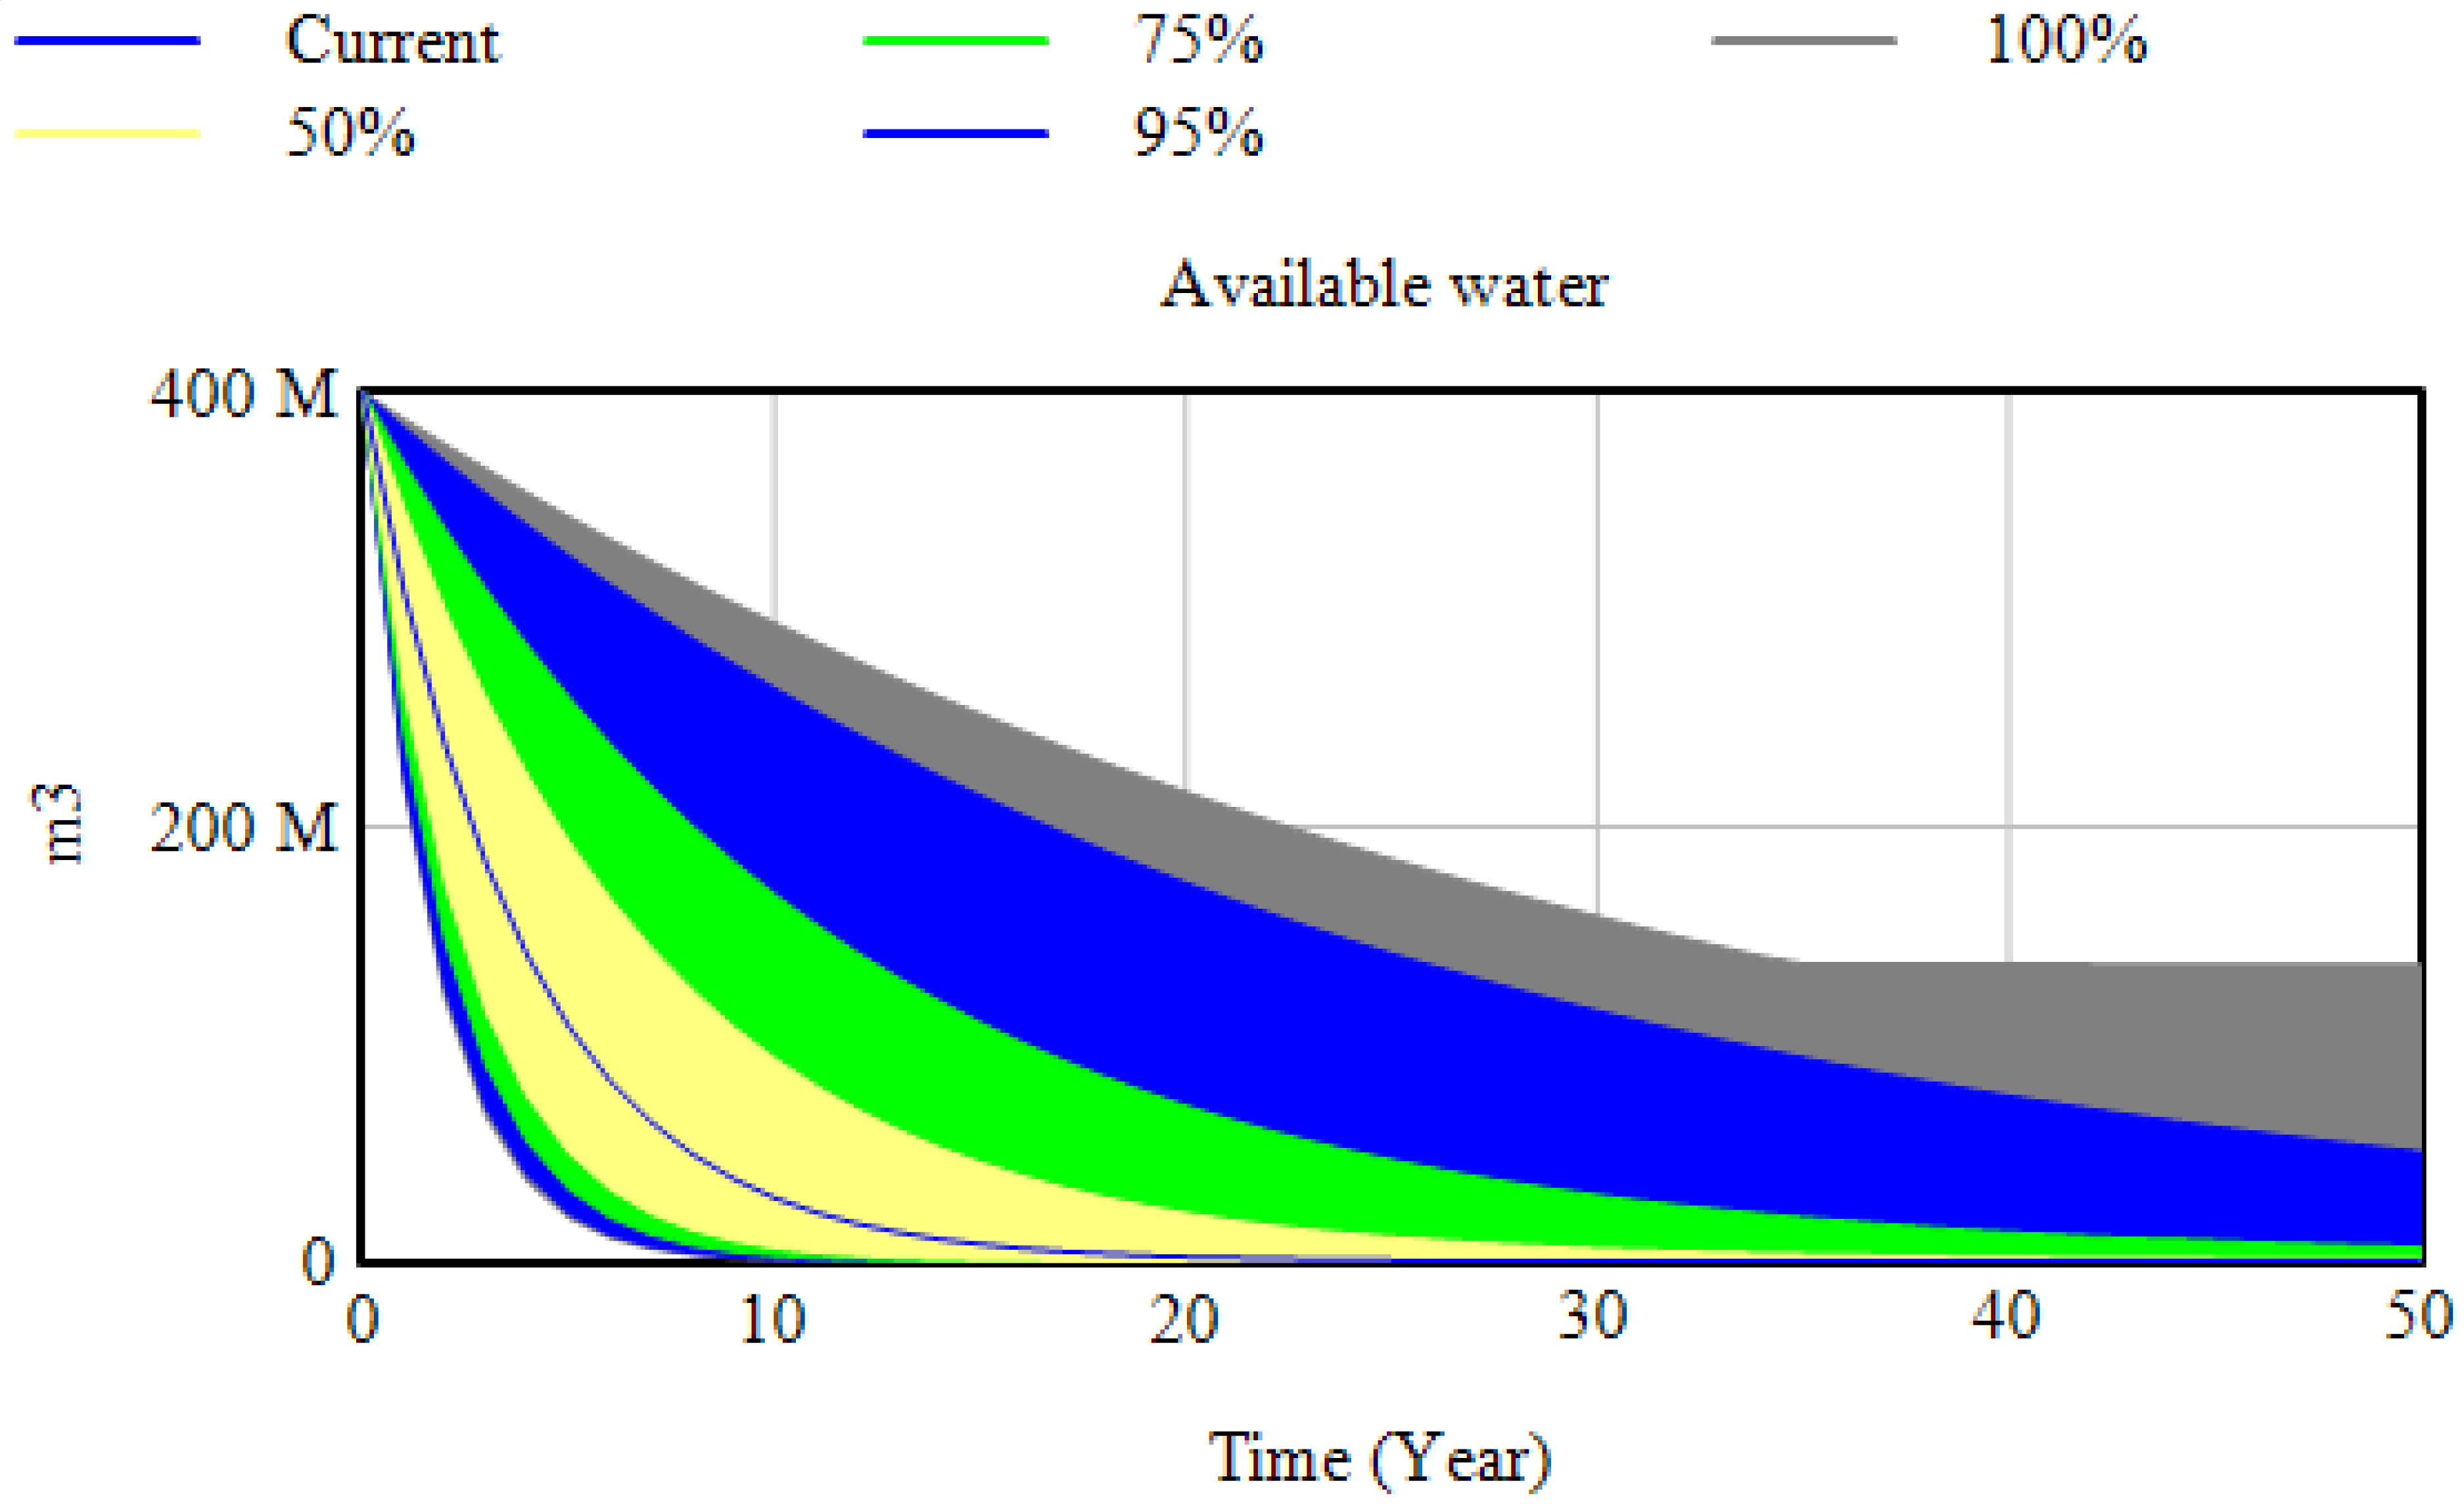
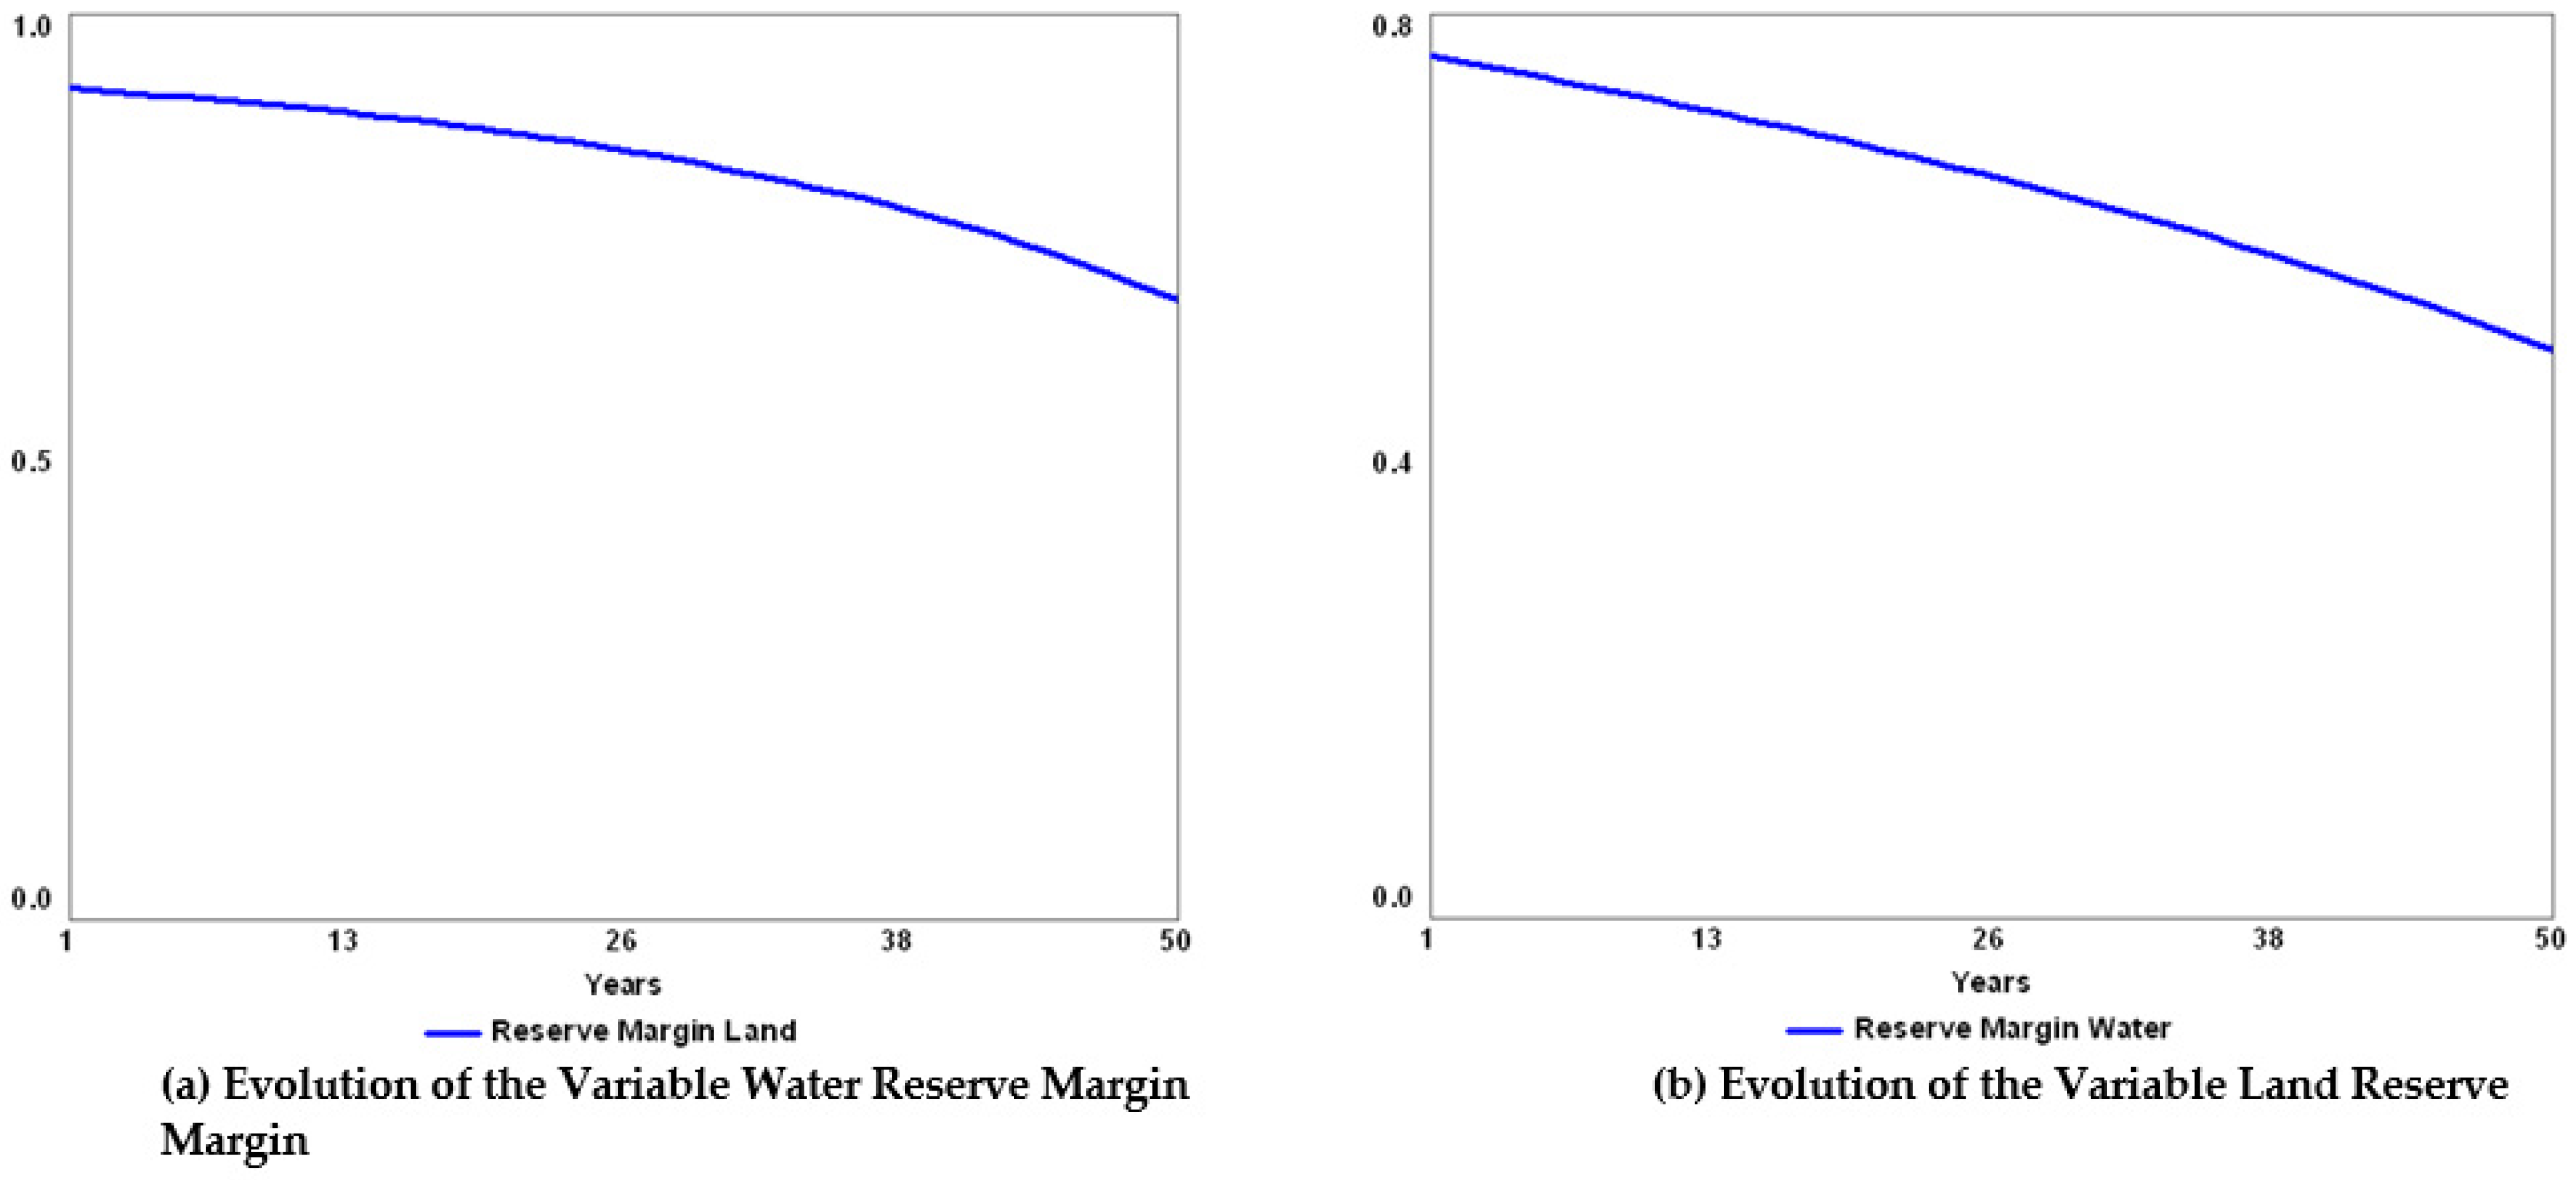
5.2. Model Calibration in System Dynamics

The calibration of the proposed model was made based on two main sources, the first corresponding to the participatory workshop developed with the inhabitants of the county California and the second corresponding to secondary sources such as the web pages of the mayor’s office of the county and from foundations and private corporations that work in the region supporting the community through rural development projects, among others. As a result, Table 2 is presented below in which the parameters, their value, and the source from which it was taken are described. Likewise, the table shows the value assigned to each citizen factor and other assumptions that are considered within the system.

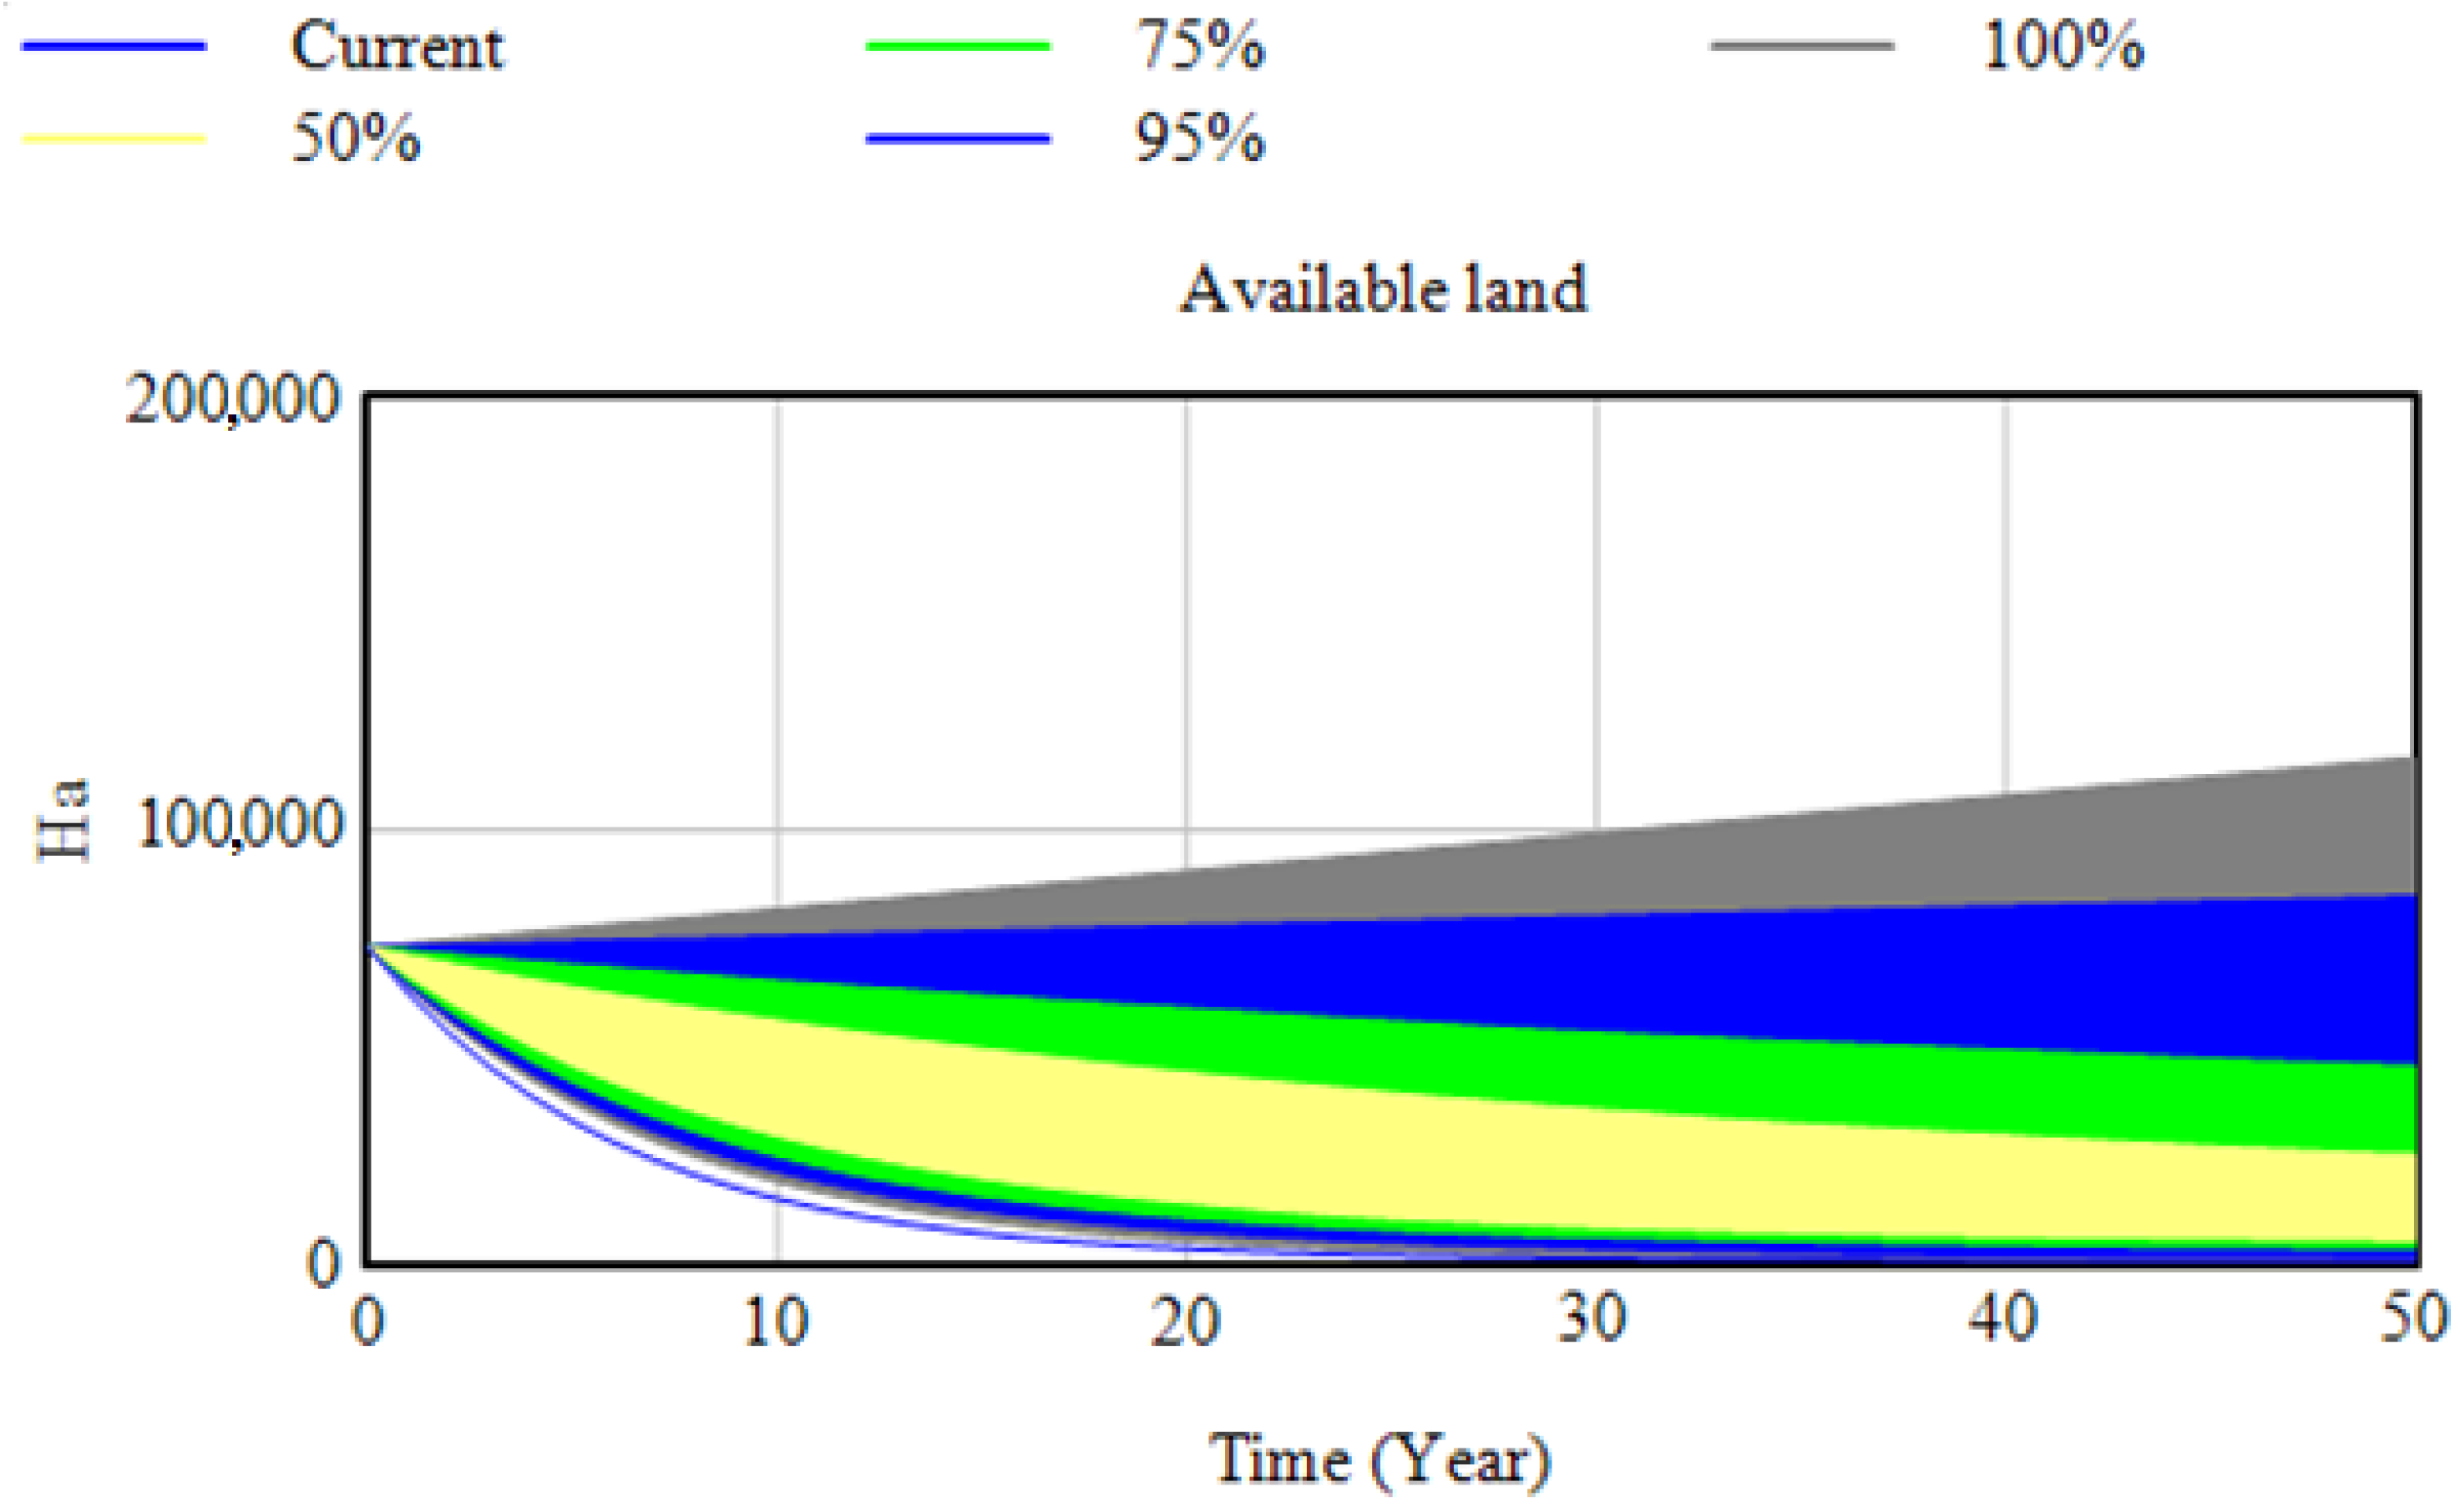
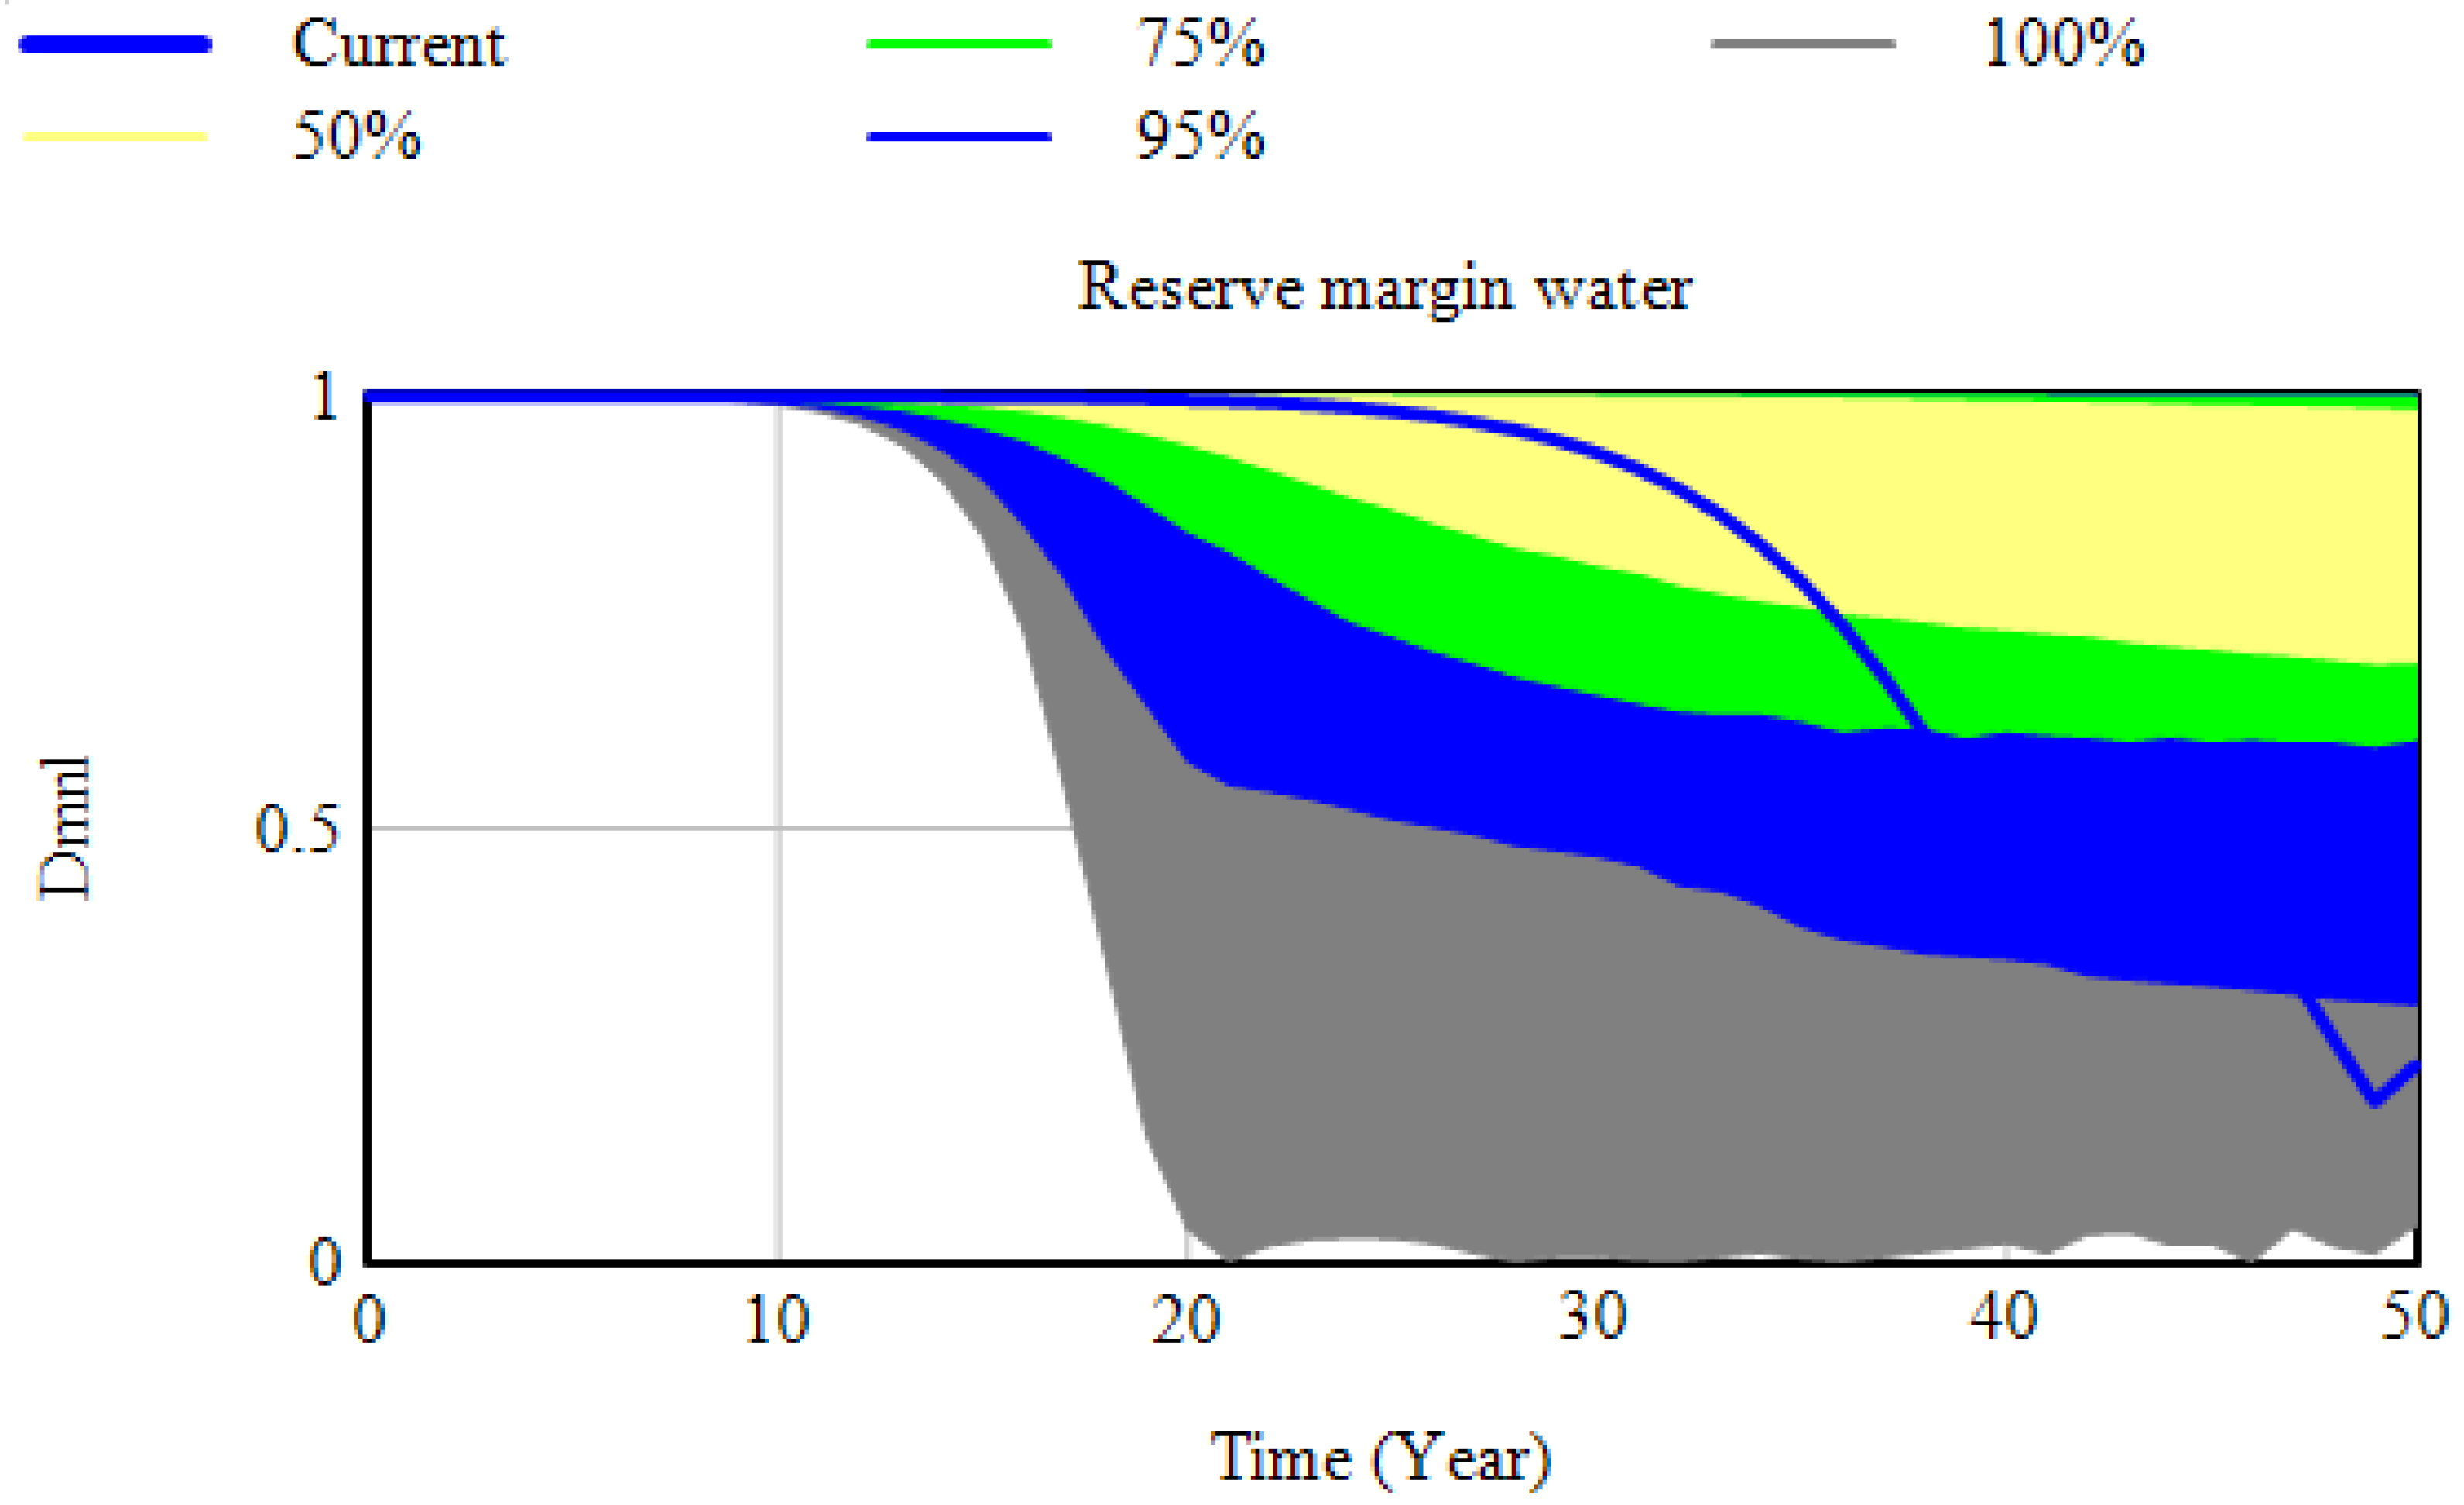
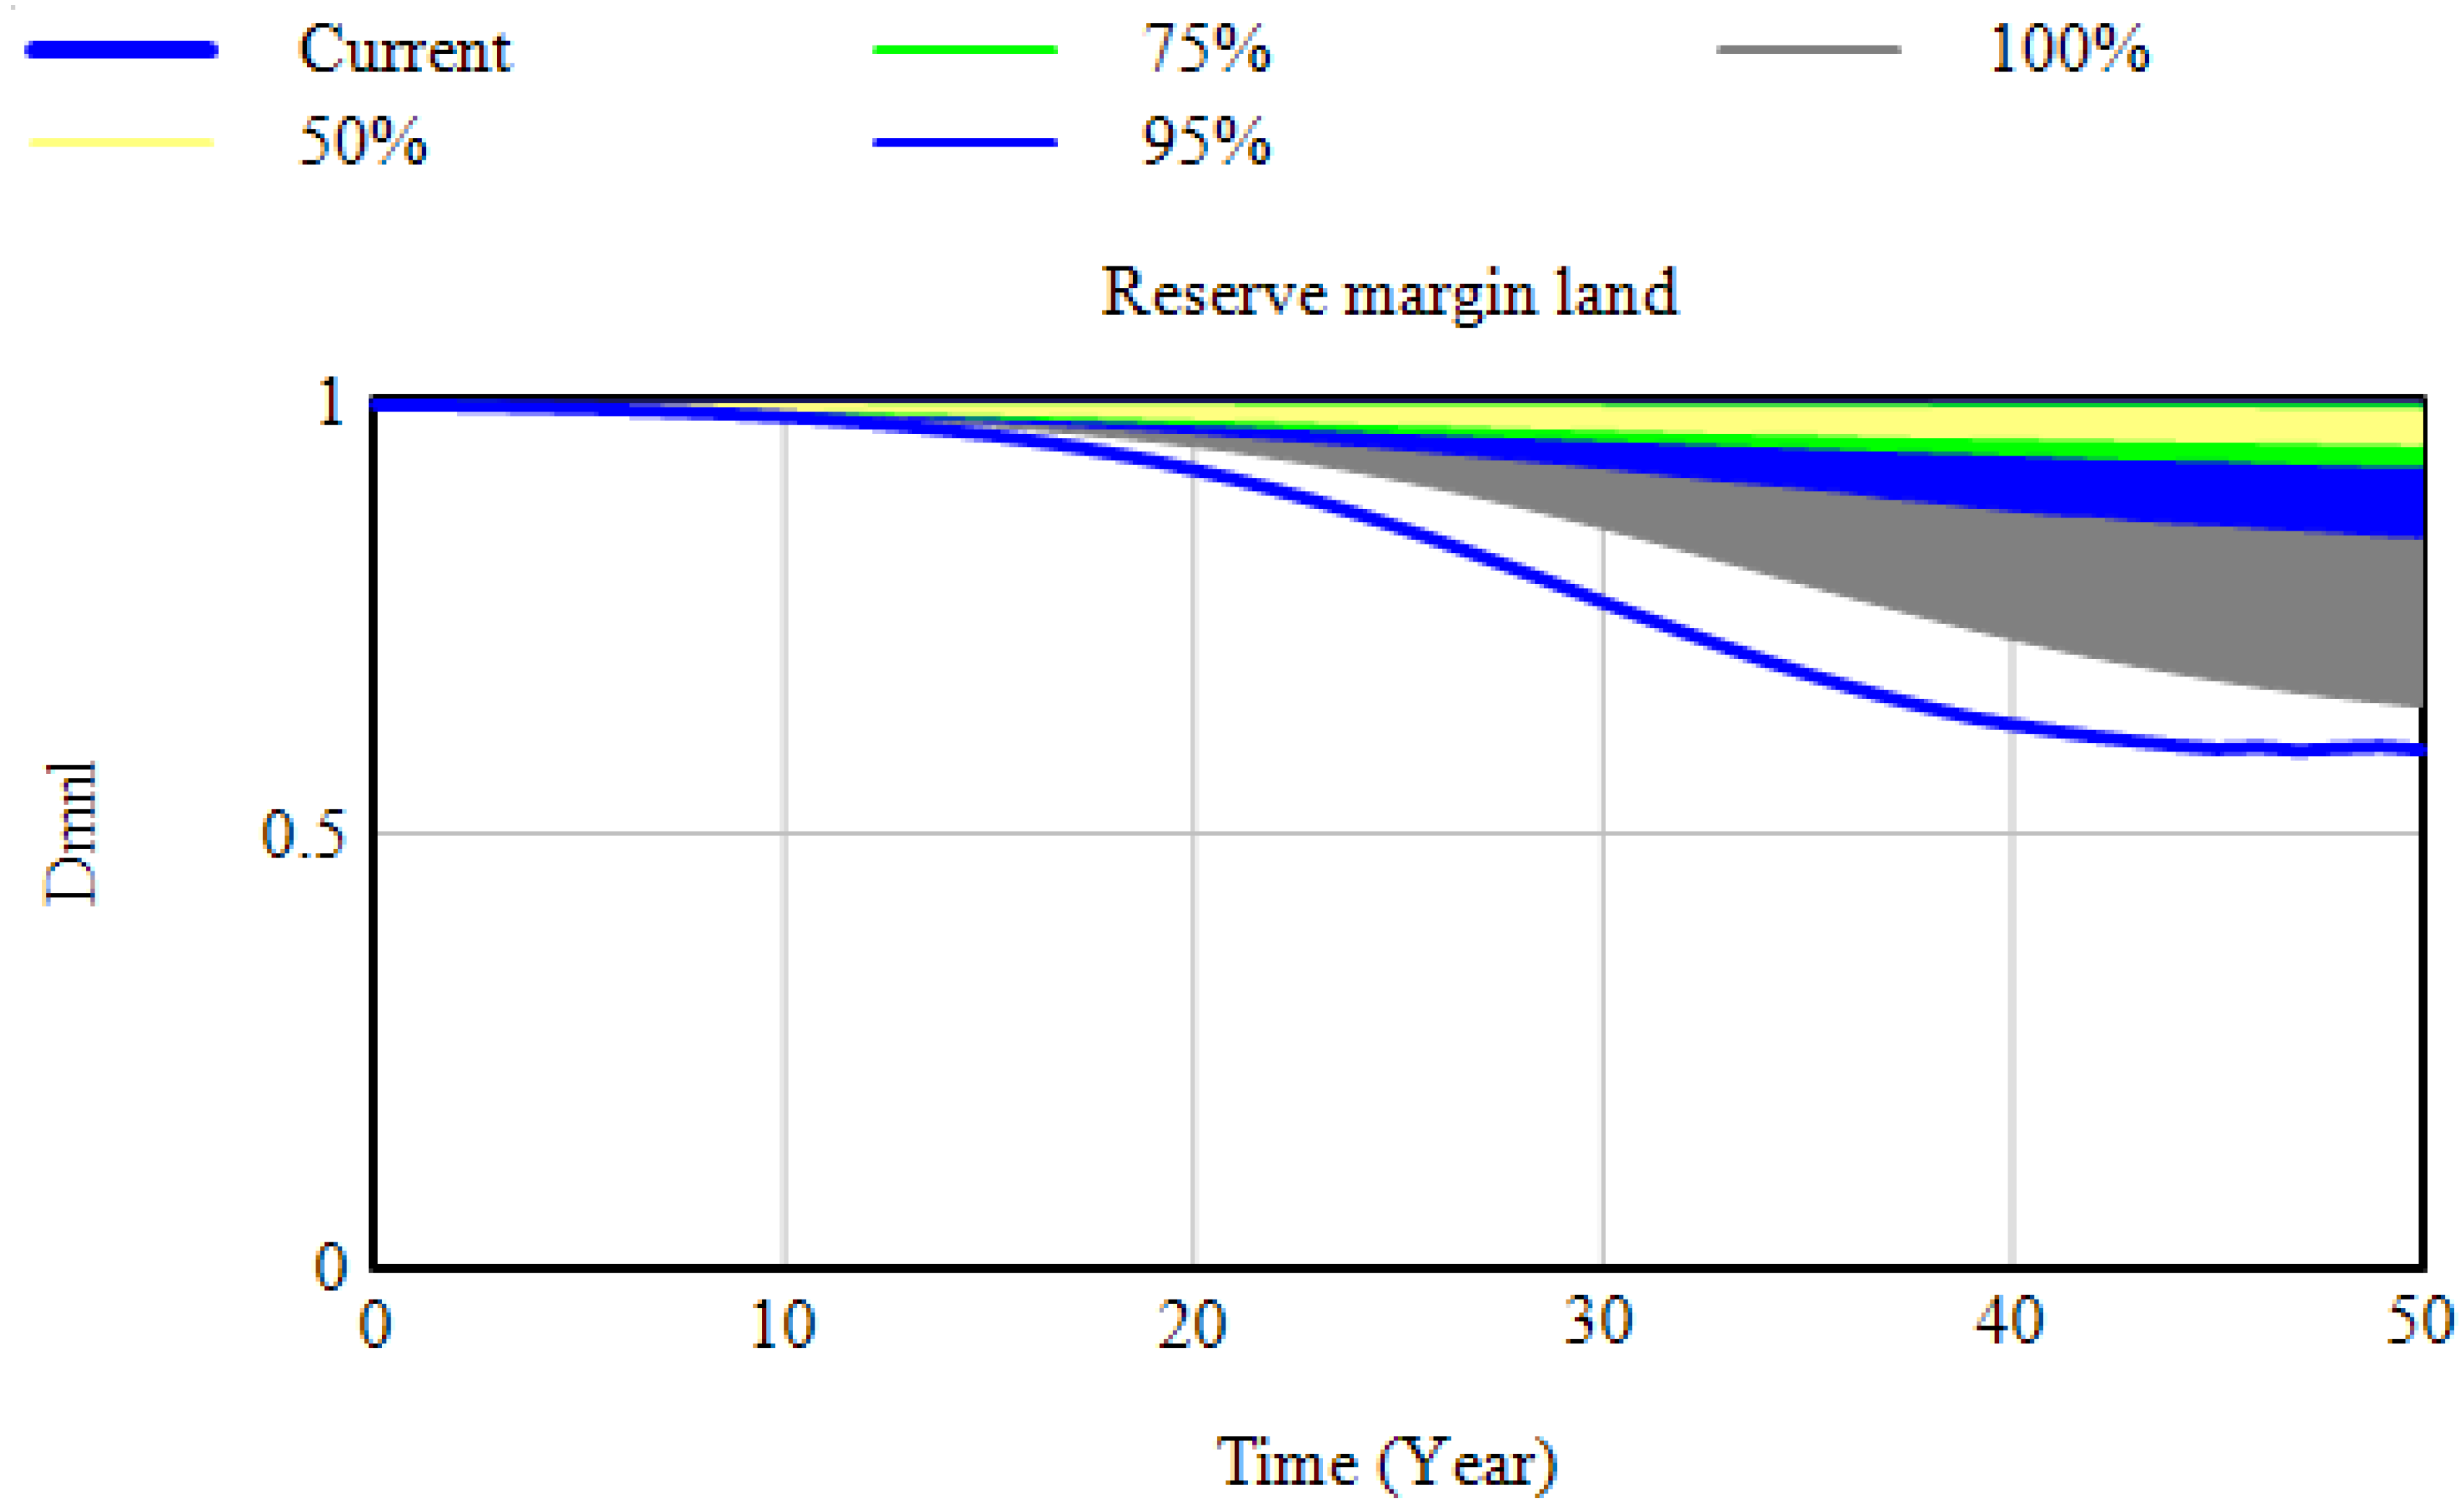
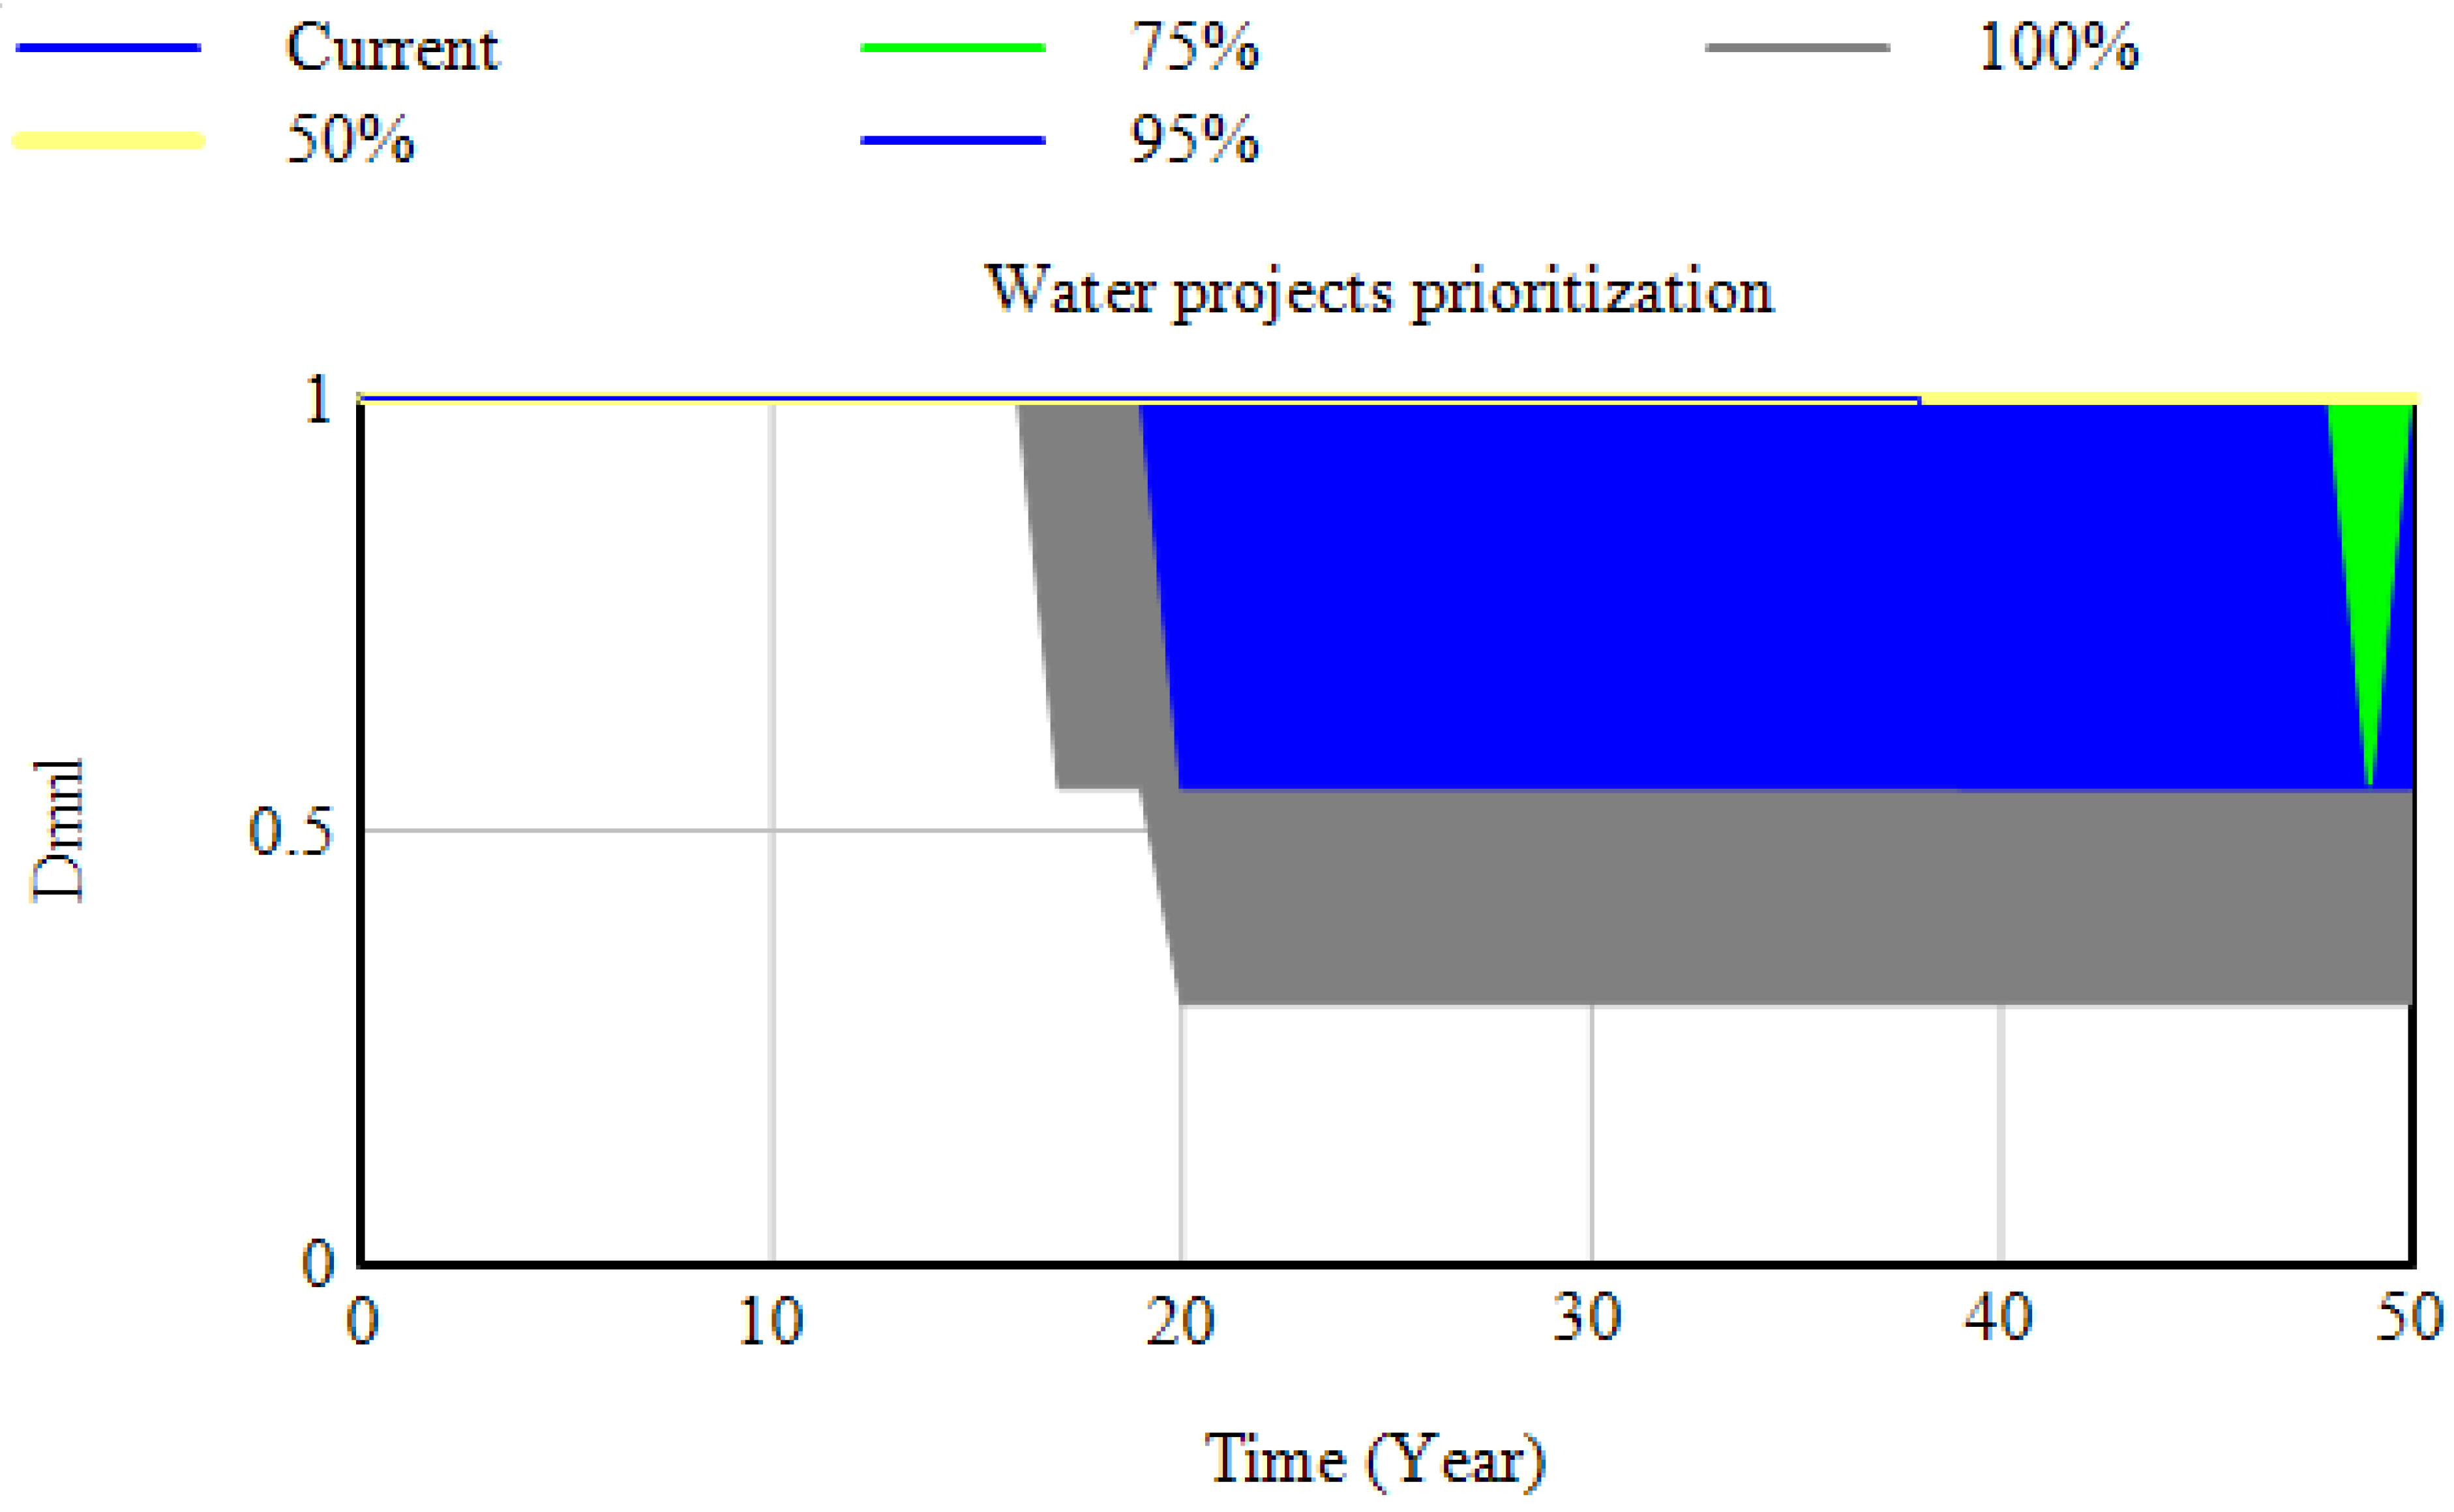
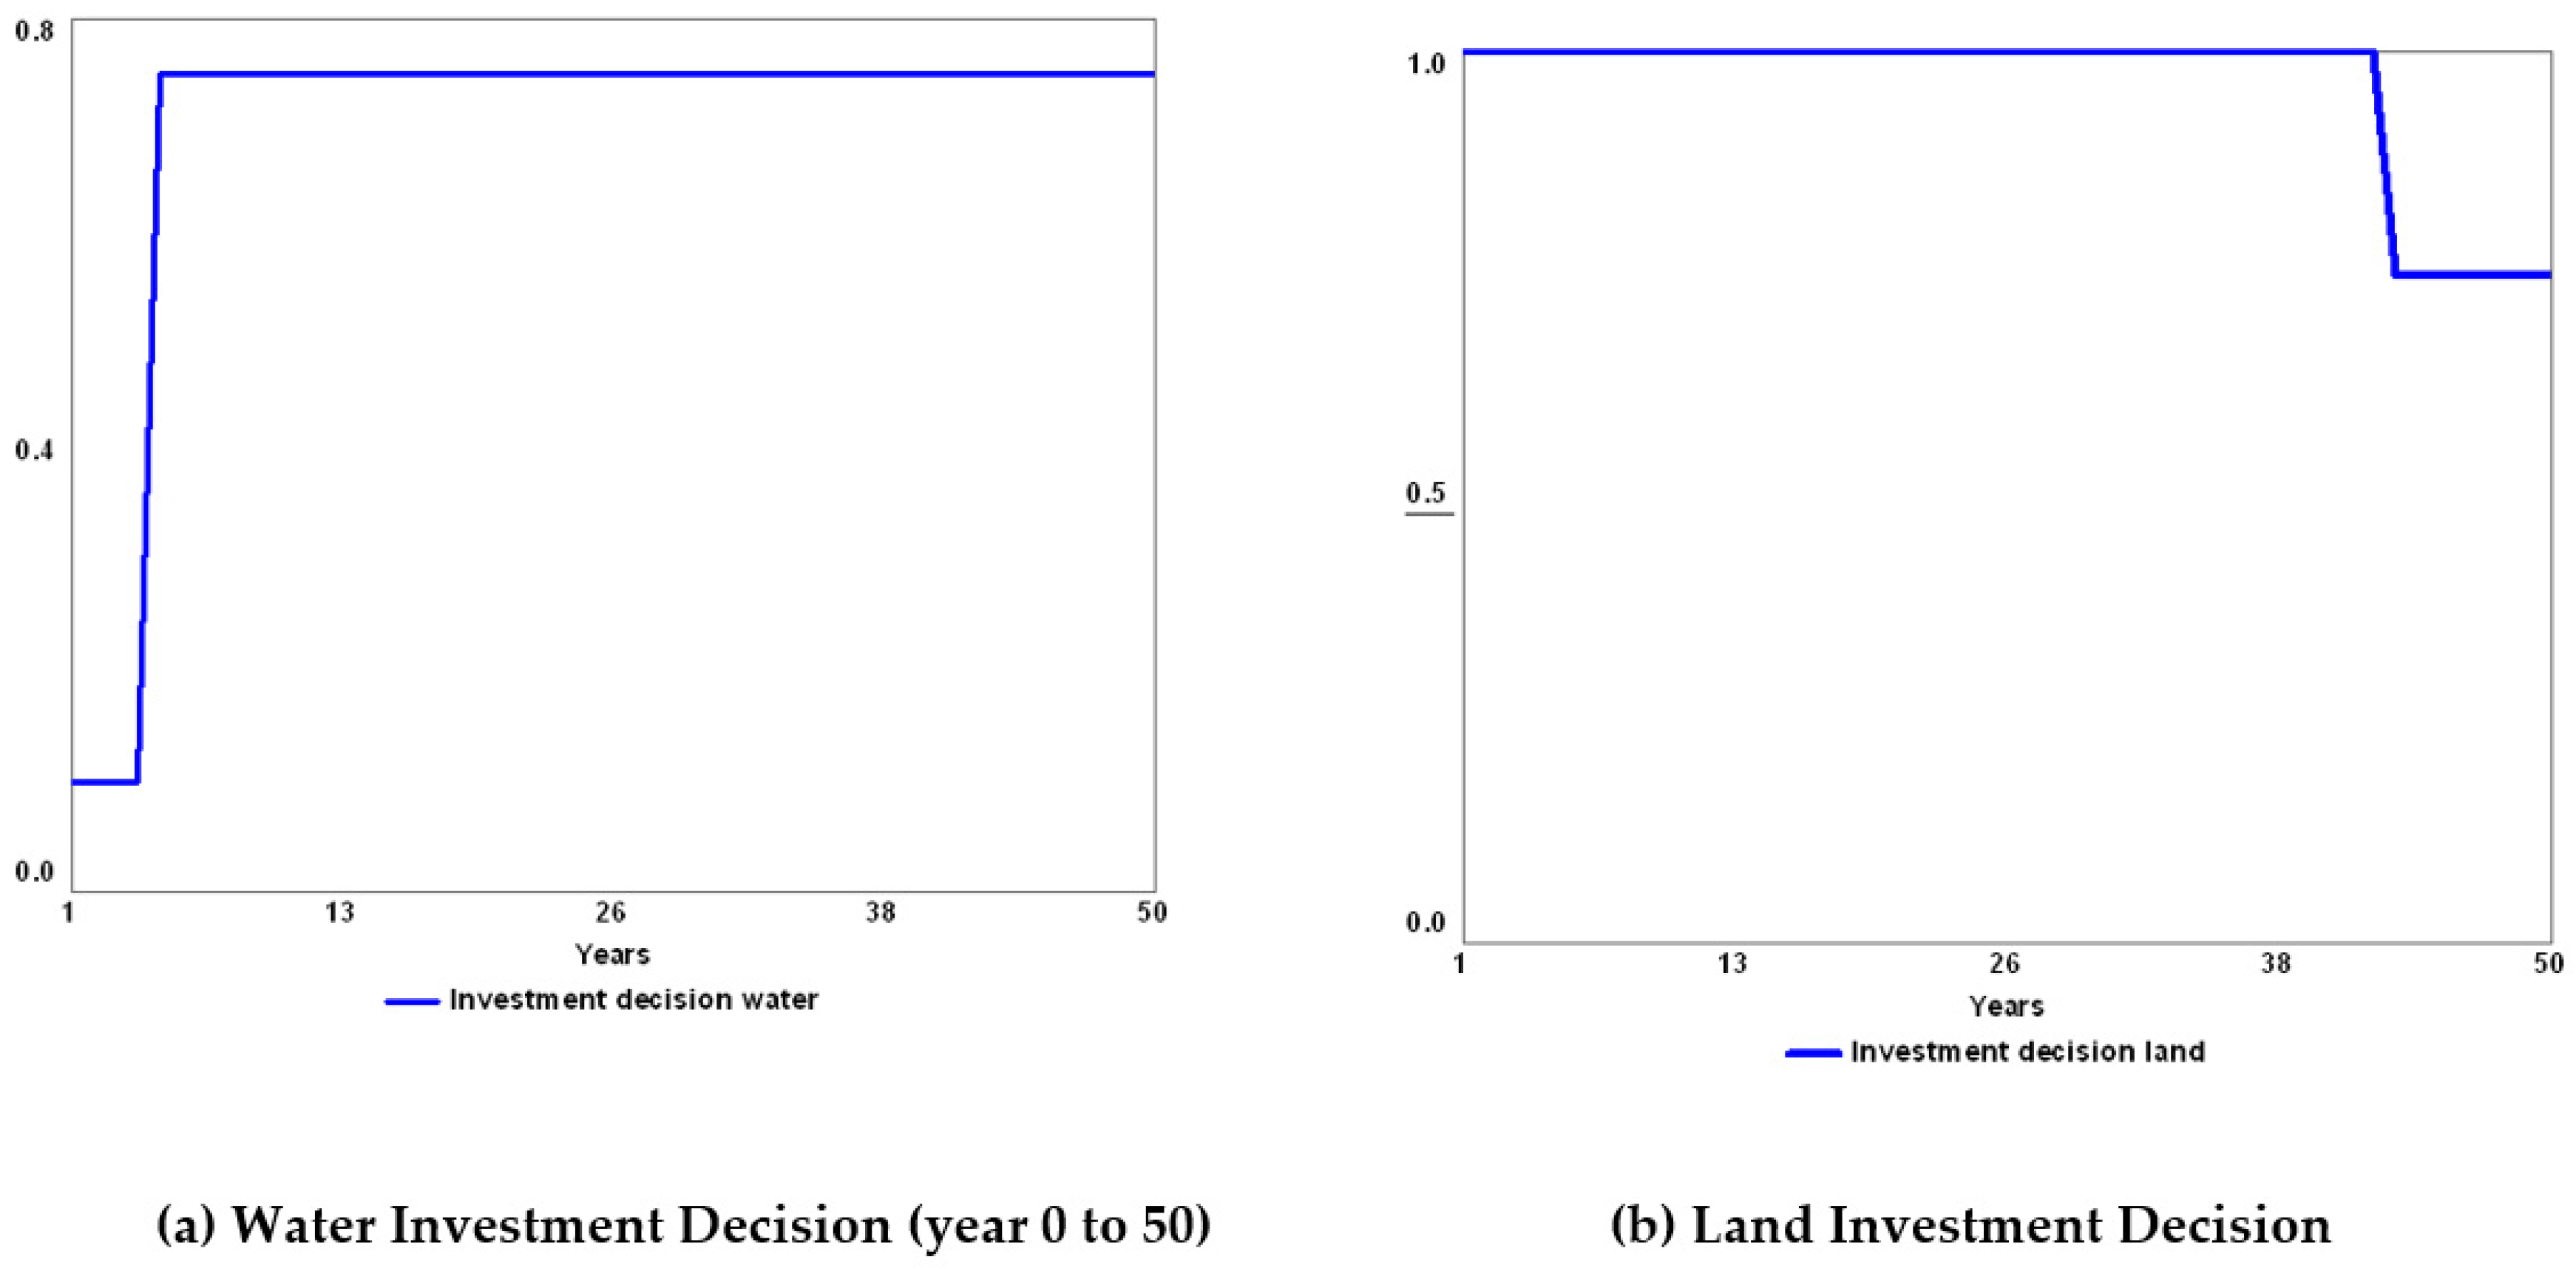
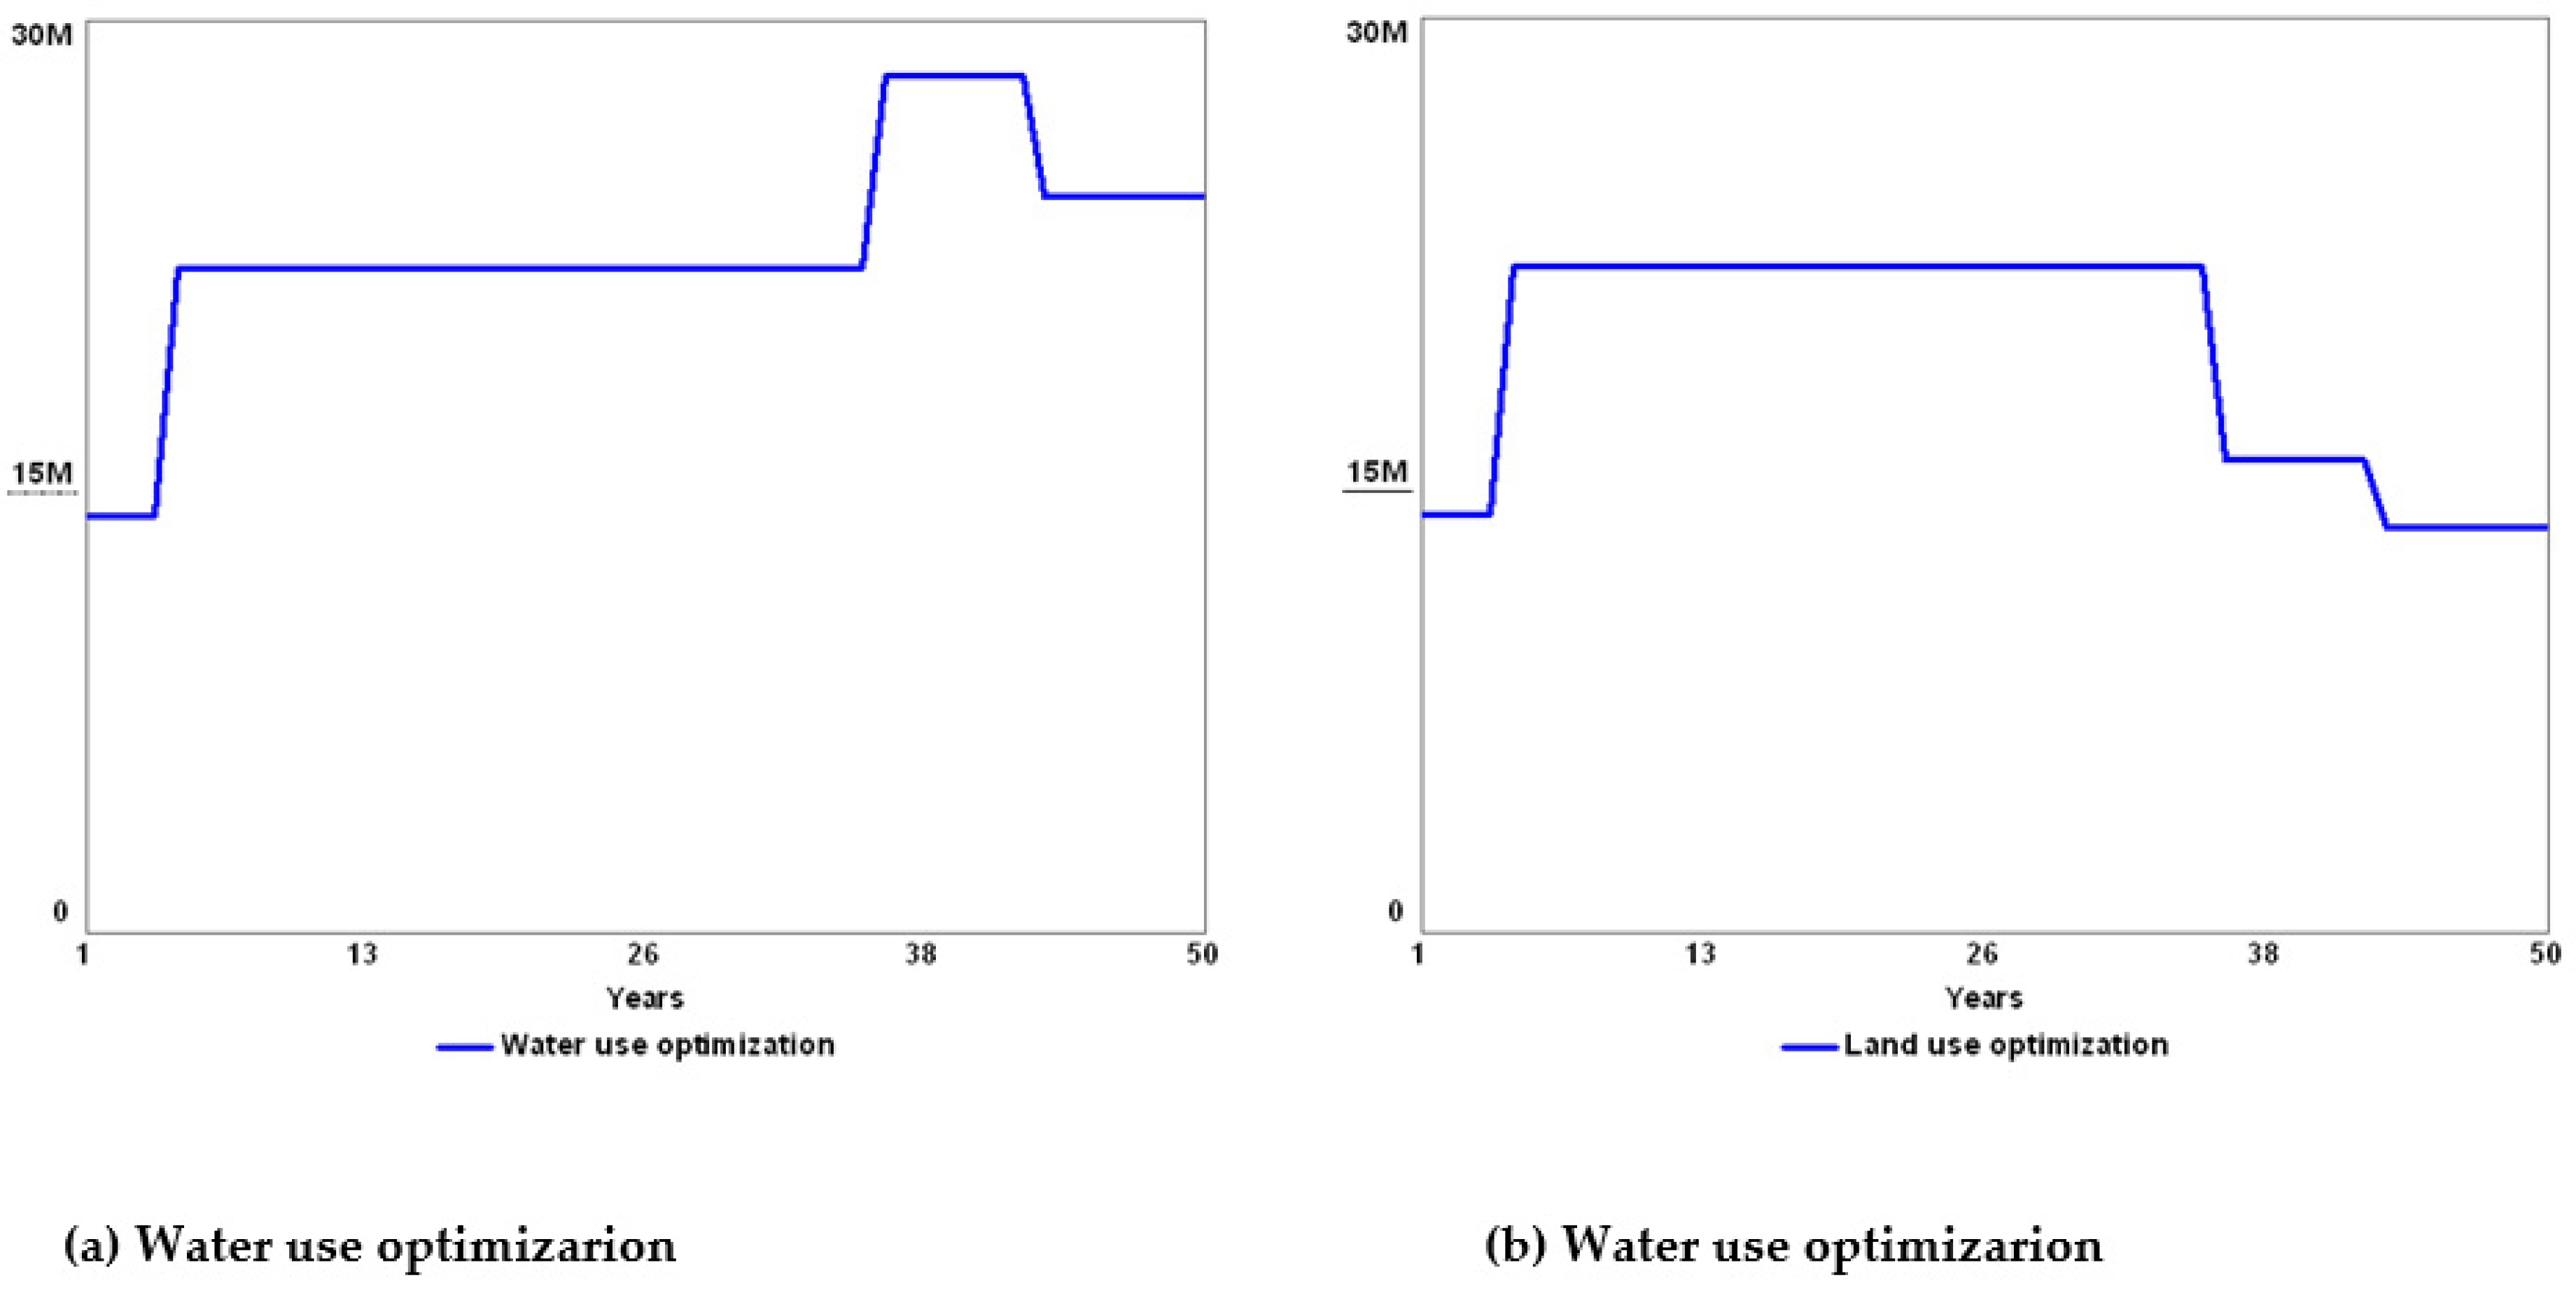
5.3. Model Simulation for Evaluation and Prioritization

Next, a series of simulations of the proposed model are presented that were carried out using the Stella Architect software. In these, the variation in the different variables of interest in the model can be observed which were presented to the experts to be considered in the evaluation and prioritization of green projects. Once again, as was the case in the study carried out with this same methodology in Pesebre county (Tame, Arauca) [6], the hypothesis that was raised from the beginning is confirmed. First of all, the reserve margins (water and land) of Figure 21 and Figure 22 show how the change in the levels of supply and demand for water or land, represented in the defined margins, generate early alerts which allow adequate control of investments.
Secondly, we can see how the variables related to the prioritization and optimization of water and land resources are also influenced by citizen factors, established through community participation. In accordance with Figure 23, for the case of California county, it is evident how the community gives preference to water projects, that is, those in which their water sources can be used for a social purpose for their inhabitants.

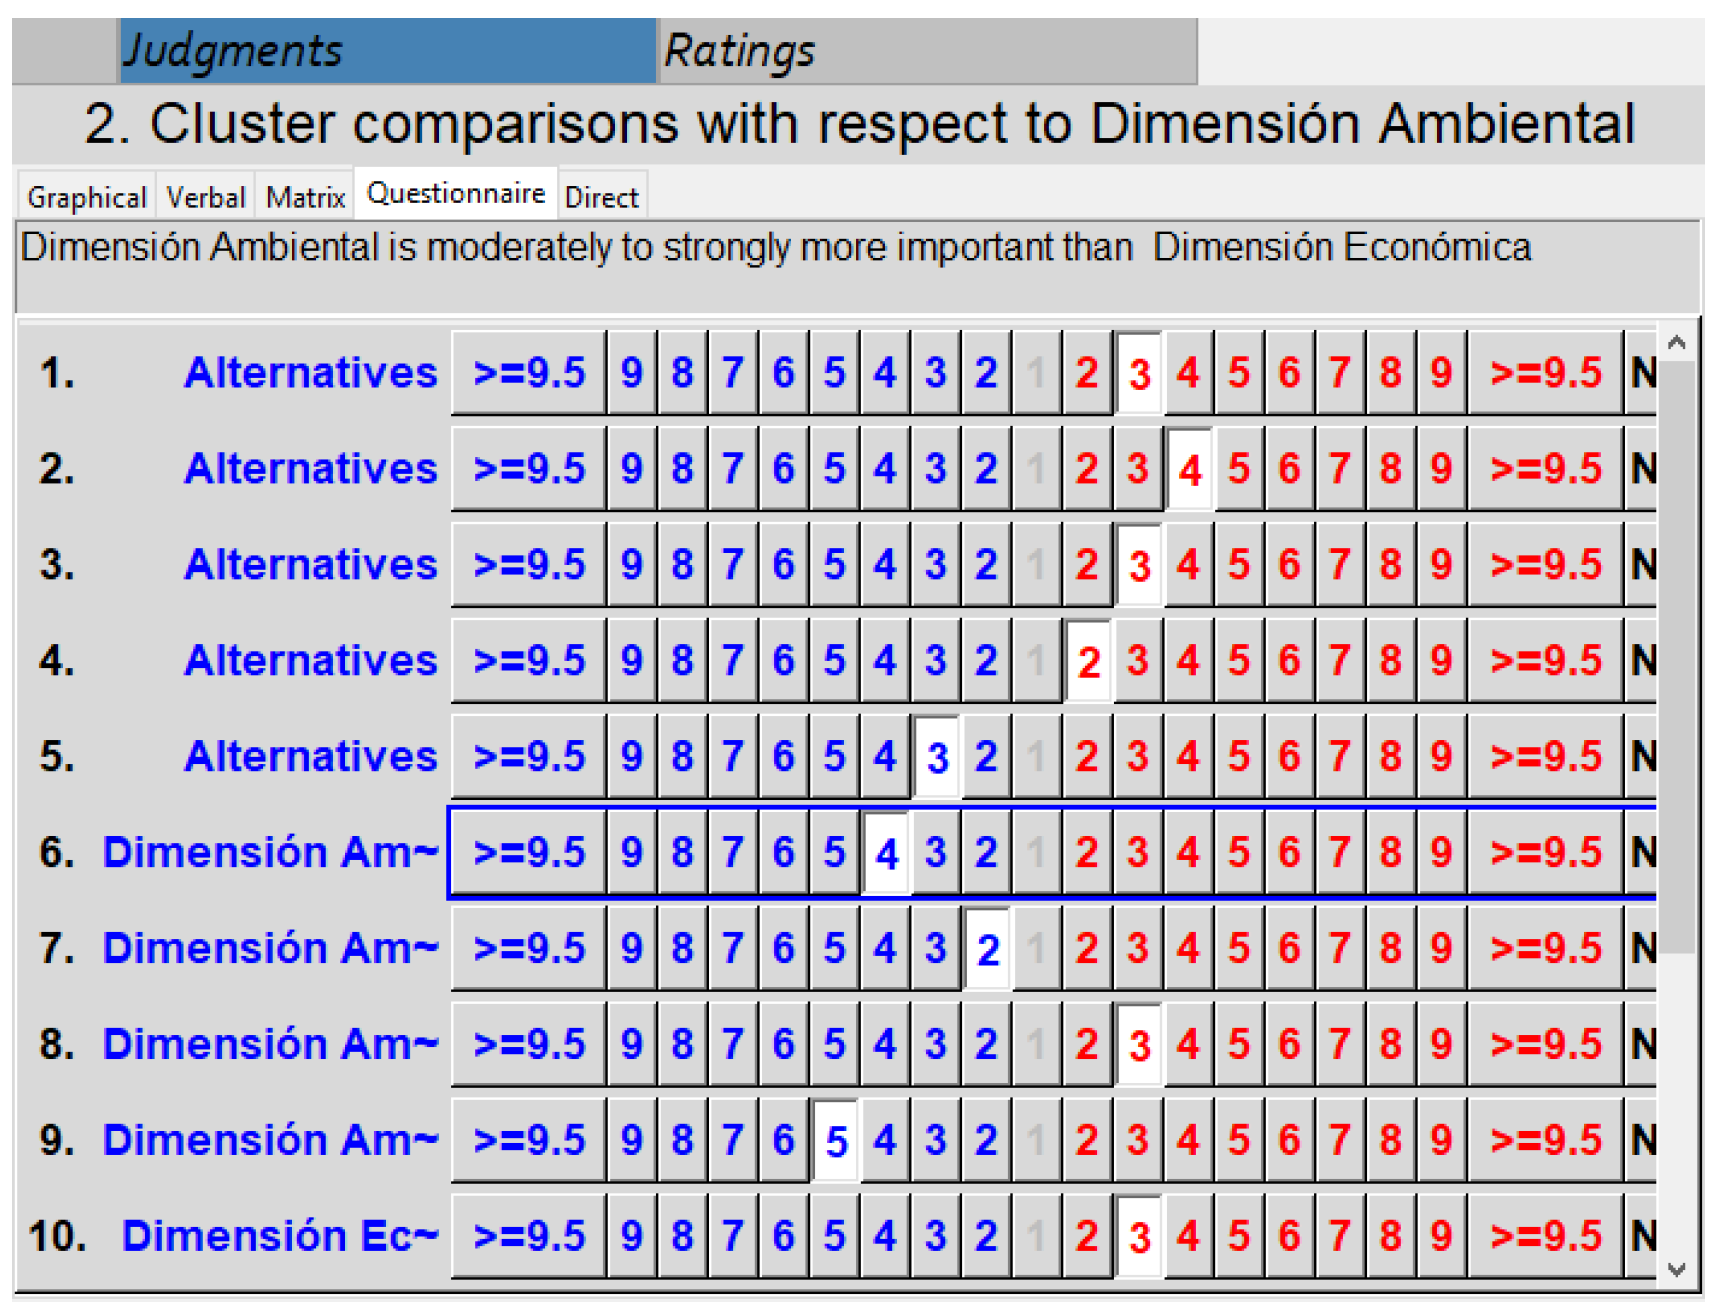
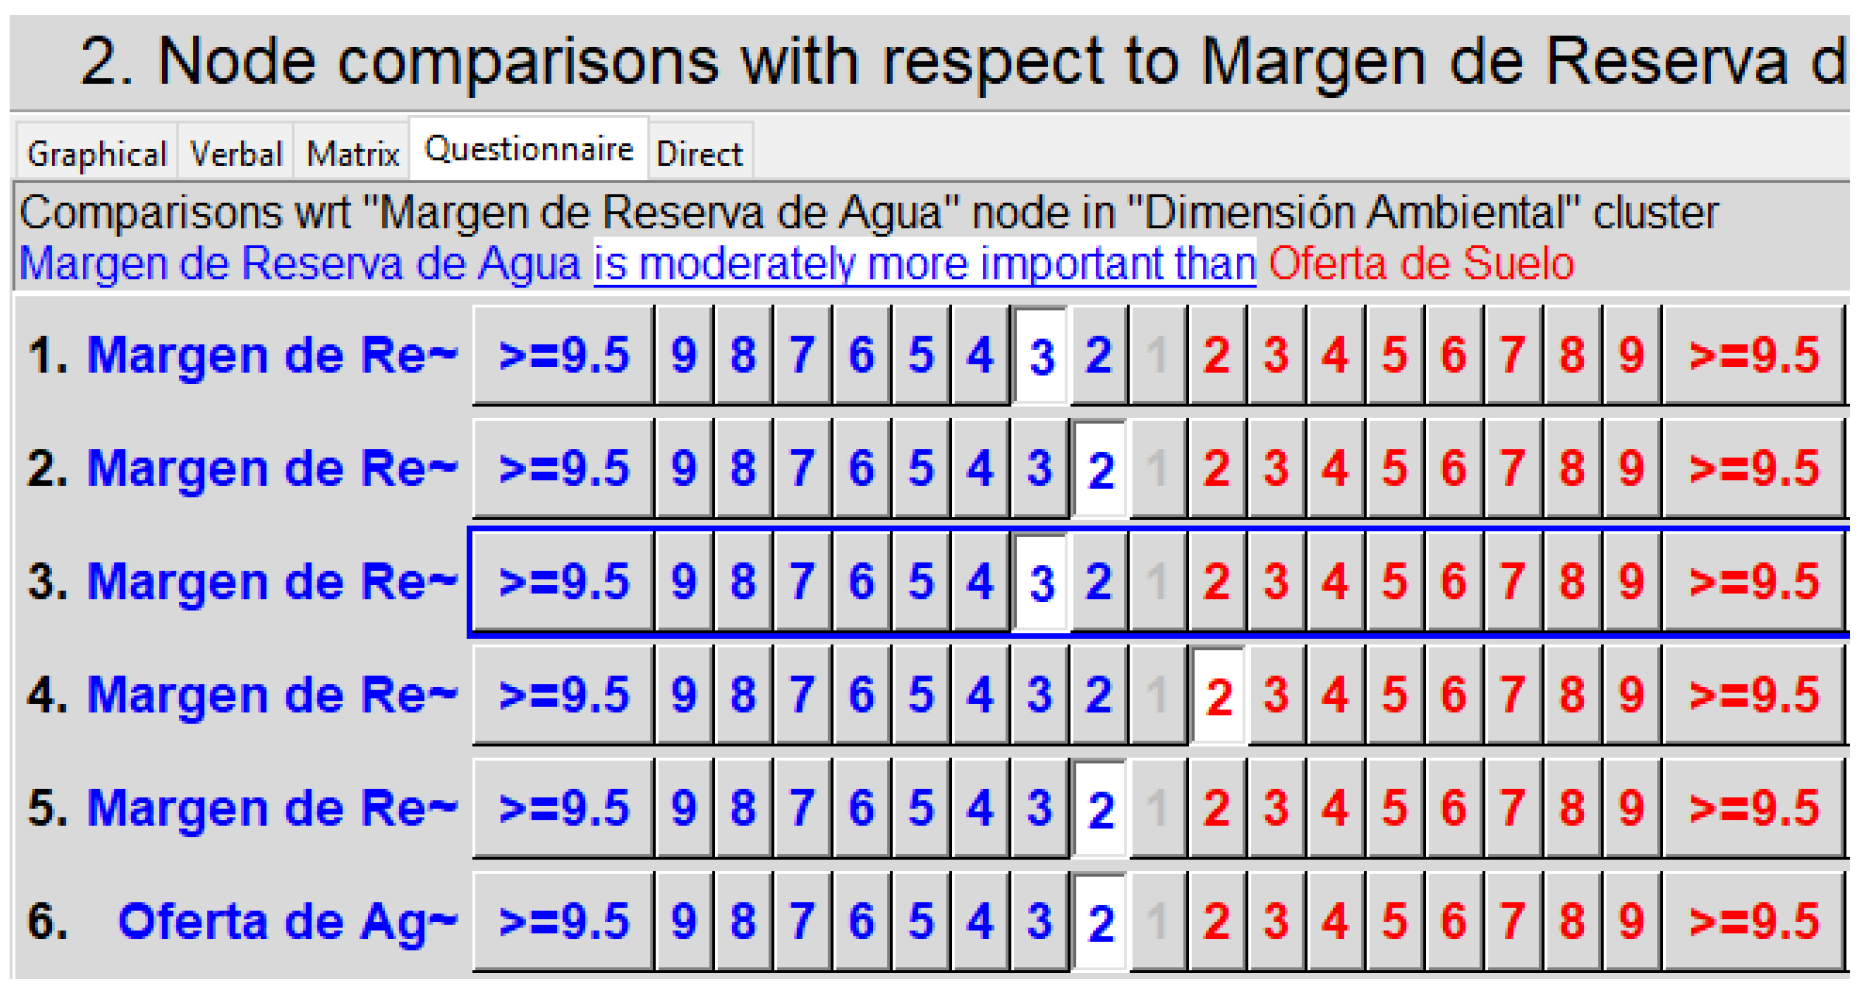
5.4. Project Evaluation and Prioritization with ANP

Once the simulations were carried out with the model in system dynamics (DS), the second phase of the proposed methodology began that consisted of the application of the analytical network process (analytic network process—ANP). Having structured the ANP network, which was described in Section 3, the six dimensions proposed (social, environmental, economic, government, citizen factors, and projects), the elements (variables), and their corresponding elements (variables) were evaluated according to dependency relationships and defined feedback.
As mentioned in Section 3, the ANP method is based on pairwise comparisons [32,33] to determine the priorities among the indicators or variables involved in the evaluation. The experts were asked to, according to the information presented from the model in system dynamics, evaluate the relevance of the indicators considered according to the fundamental scale of Saaty [34] (Table 3).
The first step of the evaluation refers to the pairwise comparisons between the clusters [27,35], that is, among the six dimensions defined. Once the evaluations were compiled it was possible to develop the evaluation matrix [36,37], in which the numerical values represent the influence identified for the elements of the network. The second step after having established the priorities of the clusters was to perform pairwise comparison for the nodes or elements or each cluster [38,39]. Regarding the evaluation of each cluster, the judgments were made considering the influences and interdependencies [12,40] recognized in the network. For example, Figure 24 shows the pairwise comparison between “social dimension” and “economical dimension”. In detail, the assigned value “4” refers to the fundamental scale of Saaty (Table 3). This means that the experts considered the “Social Dimension” more important than the “Economic Dimension”.
Figure 25 shows the pairwise comparison between the nodes (elements) that belong to environmental dimension (cluster). Undertaken in the same way as the pairwise comparison by the clusters for the assignment of values, the fundamental scale of Saaty was used in order to determine the importance of the different variables. In detail, the assigned values mean that, first, the “water reserve margin” is more important than “the land reserve margin” (value 3); second, the “water offer” is equally or moderately more important than “land offer” (value 2); and third, that the “water reserve margin” is moderately more important than the “land supply” (value 3). Great importance was given to the “water reserve margin” in the county California. This is due in part to the fact that water is of vital importance for crops and thanks to the local aqueducts all the inhabitants can benefit from it. On the contrary, regarding water or land, which is the private property of the inhabitants of the community or of companies that established their crops in the area, since the benefit is individual it is taken advantage of. In this context, it is possible to underline that the comparison by pairs was carried out considering the characteristics of the area, and likewise the problems and needs of the California community.
Once all the pairwise comparison matrices were obtained for all the dimensions and the nodes, we developed the unweighted supermatrix [41,42], in which all the priorities obtained through pairwise comparisons are detailed. Likewise, the supermatrix represents the relations between the nodes that compose the network. Now, to obtain the weighted supermatrix, it was necessary to multiply the unweighted matrix by the final vector of priorities [43,44]. It is important to highlight that both for the construction of the ANP network and for the peer evaluations and the development and operation of the matrices we used the super decisions software that was created by the foundation creative decisions [45].

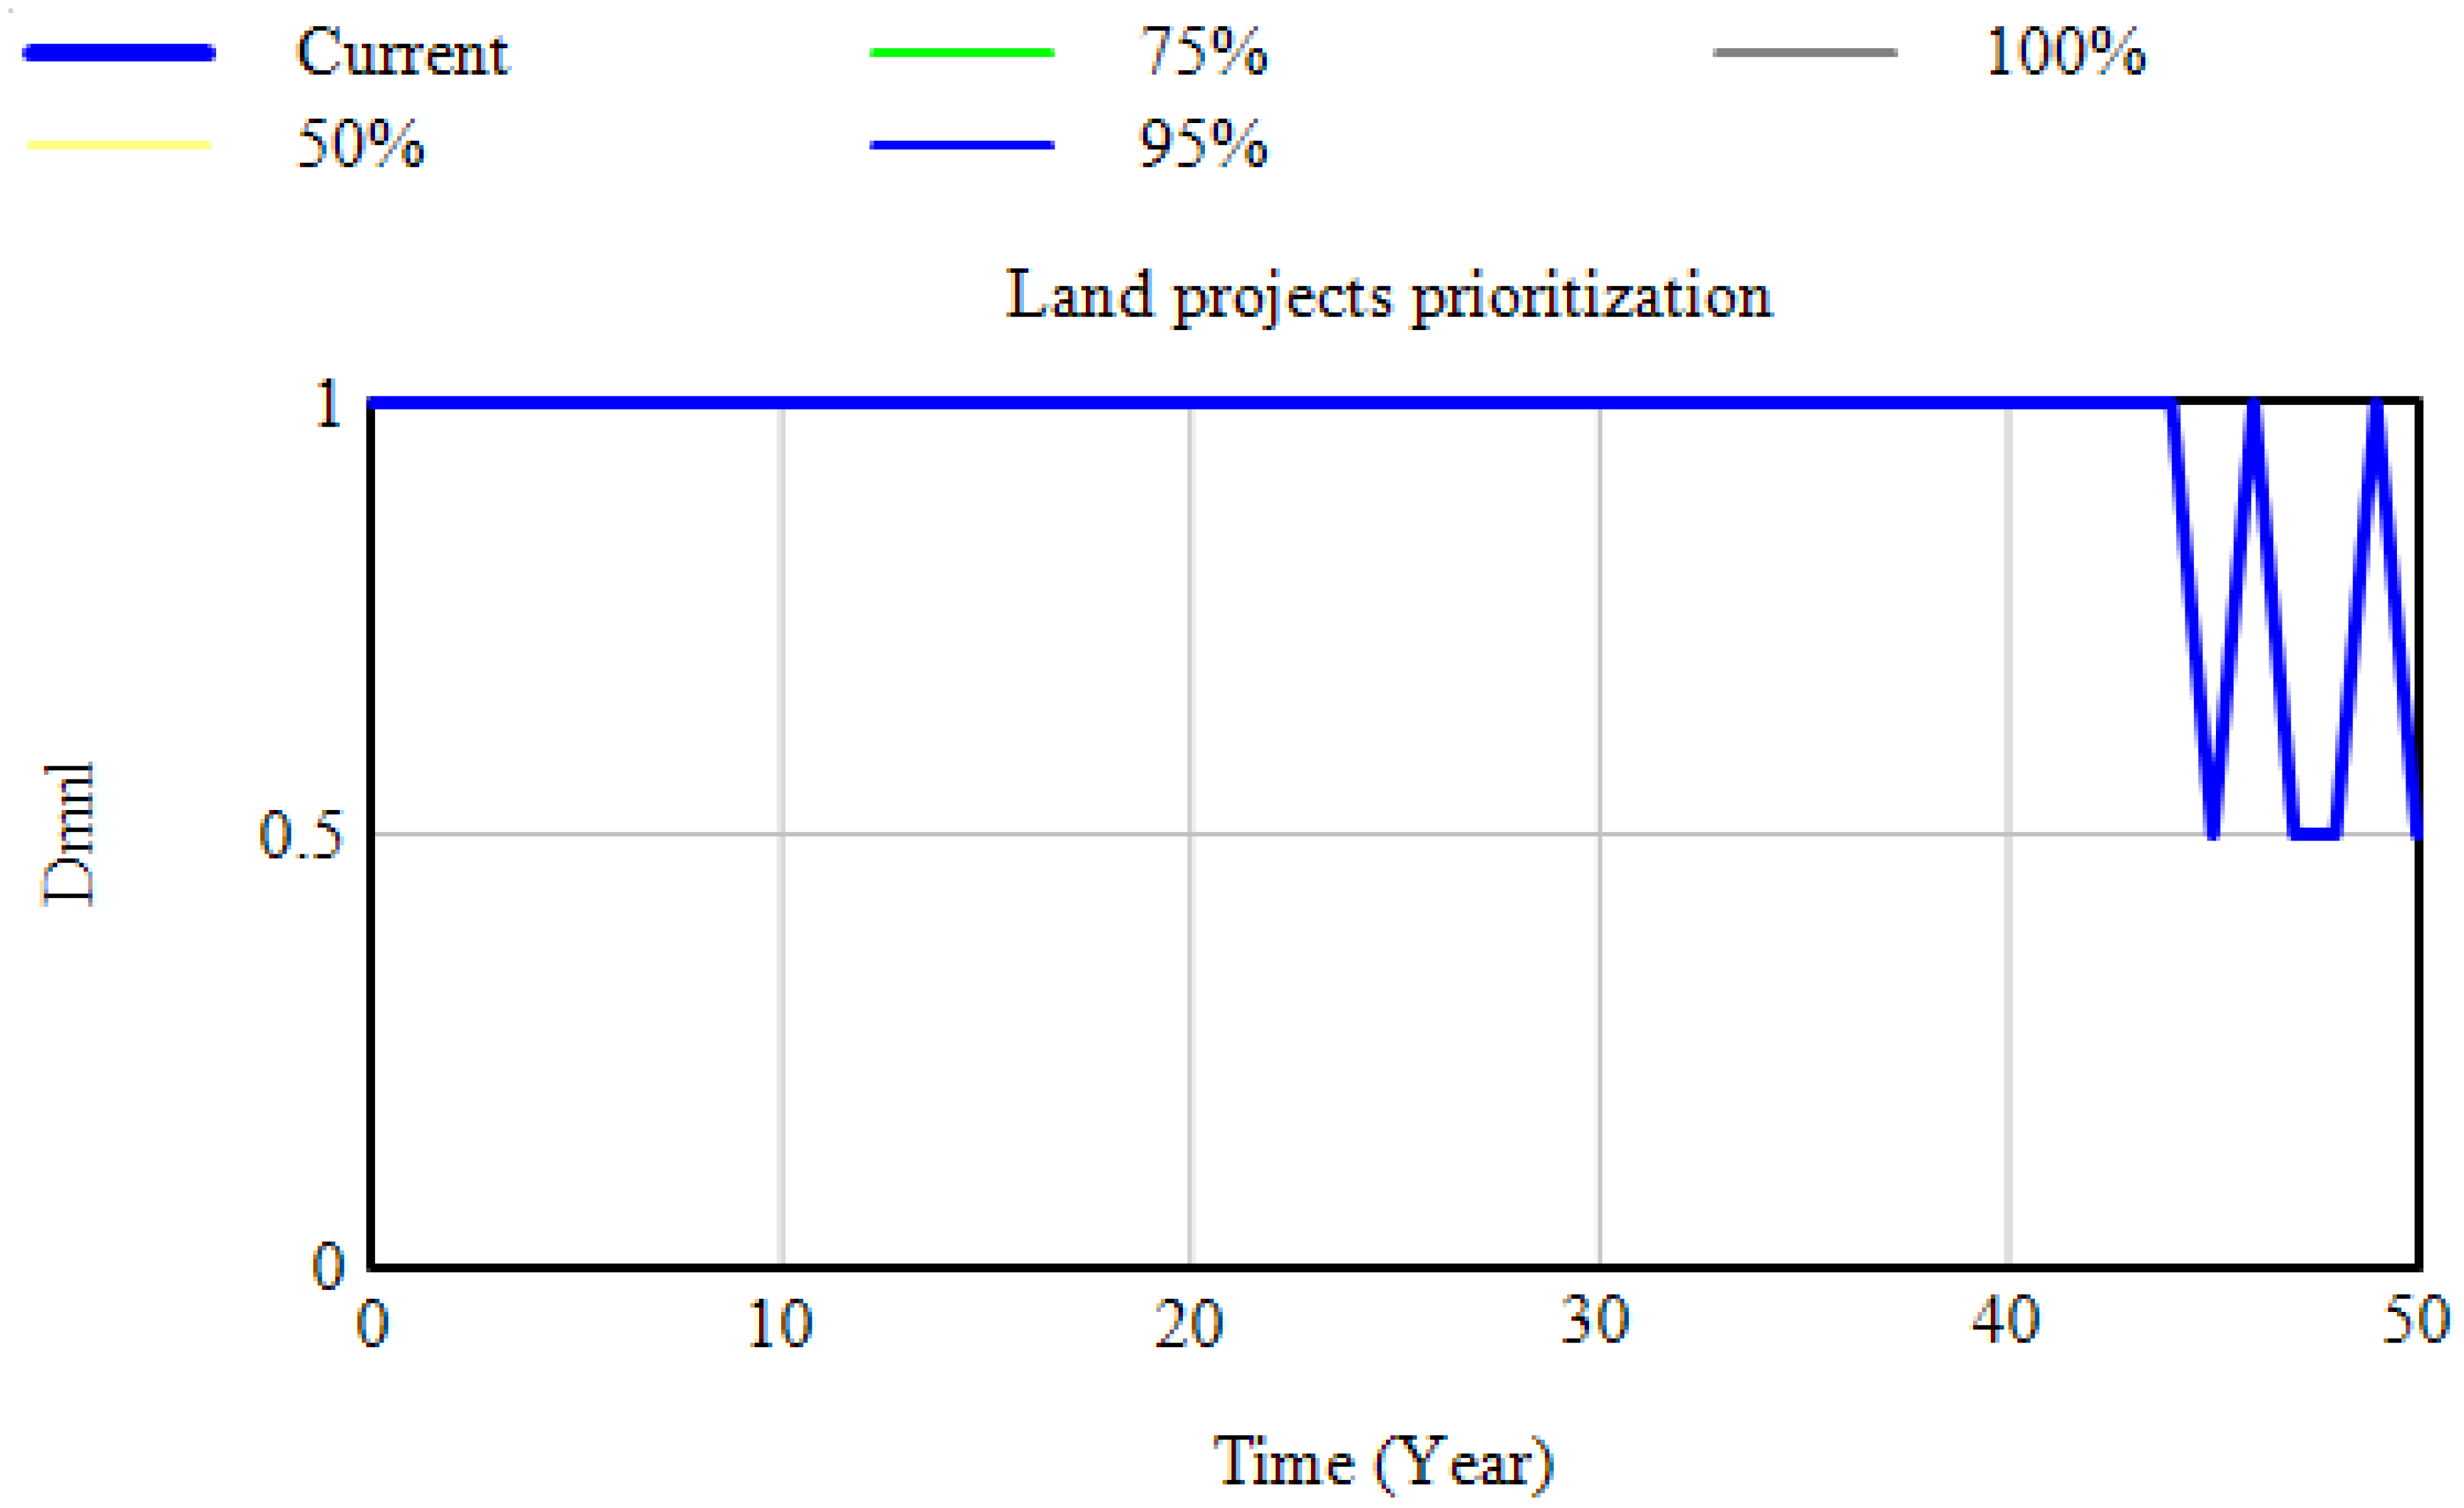
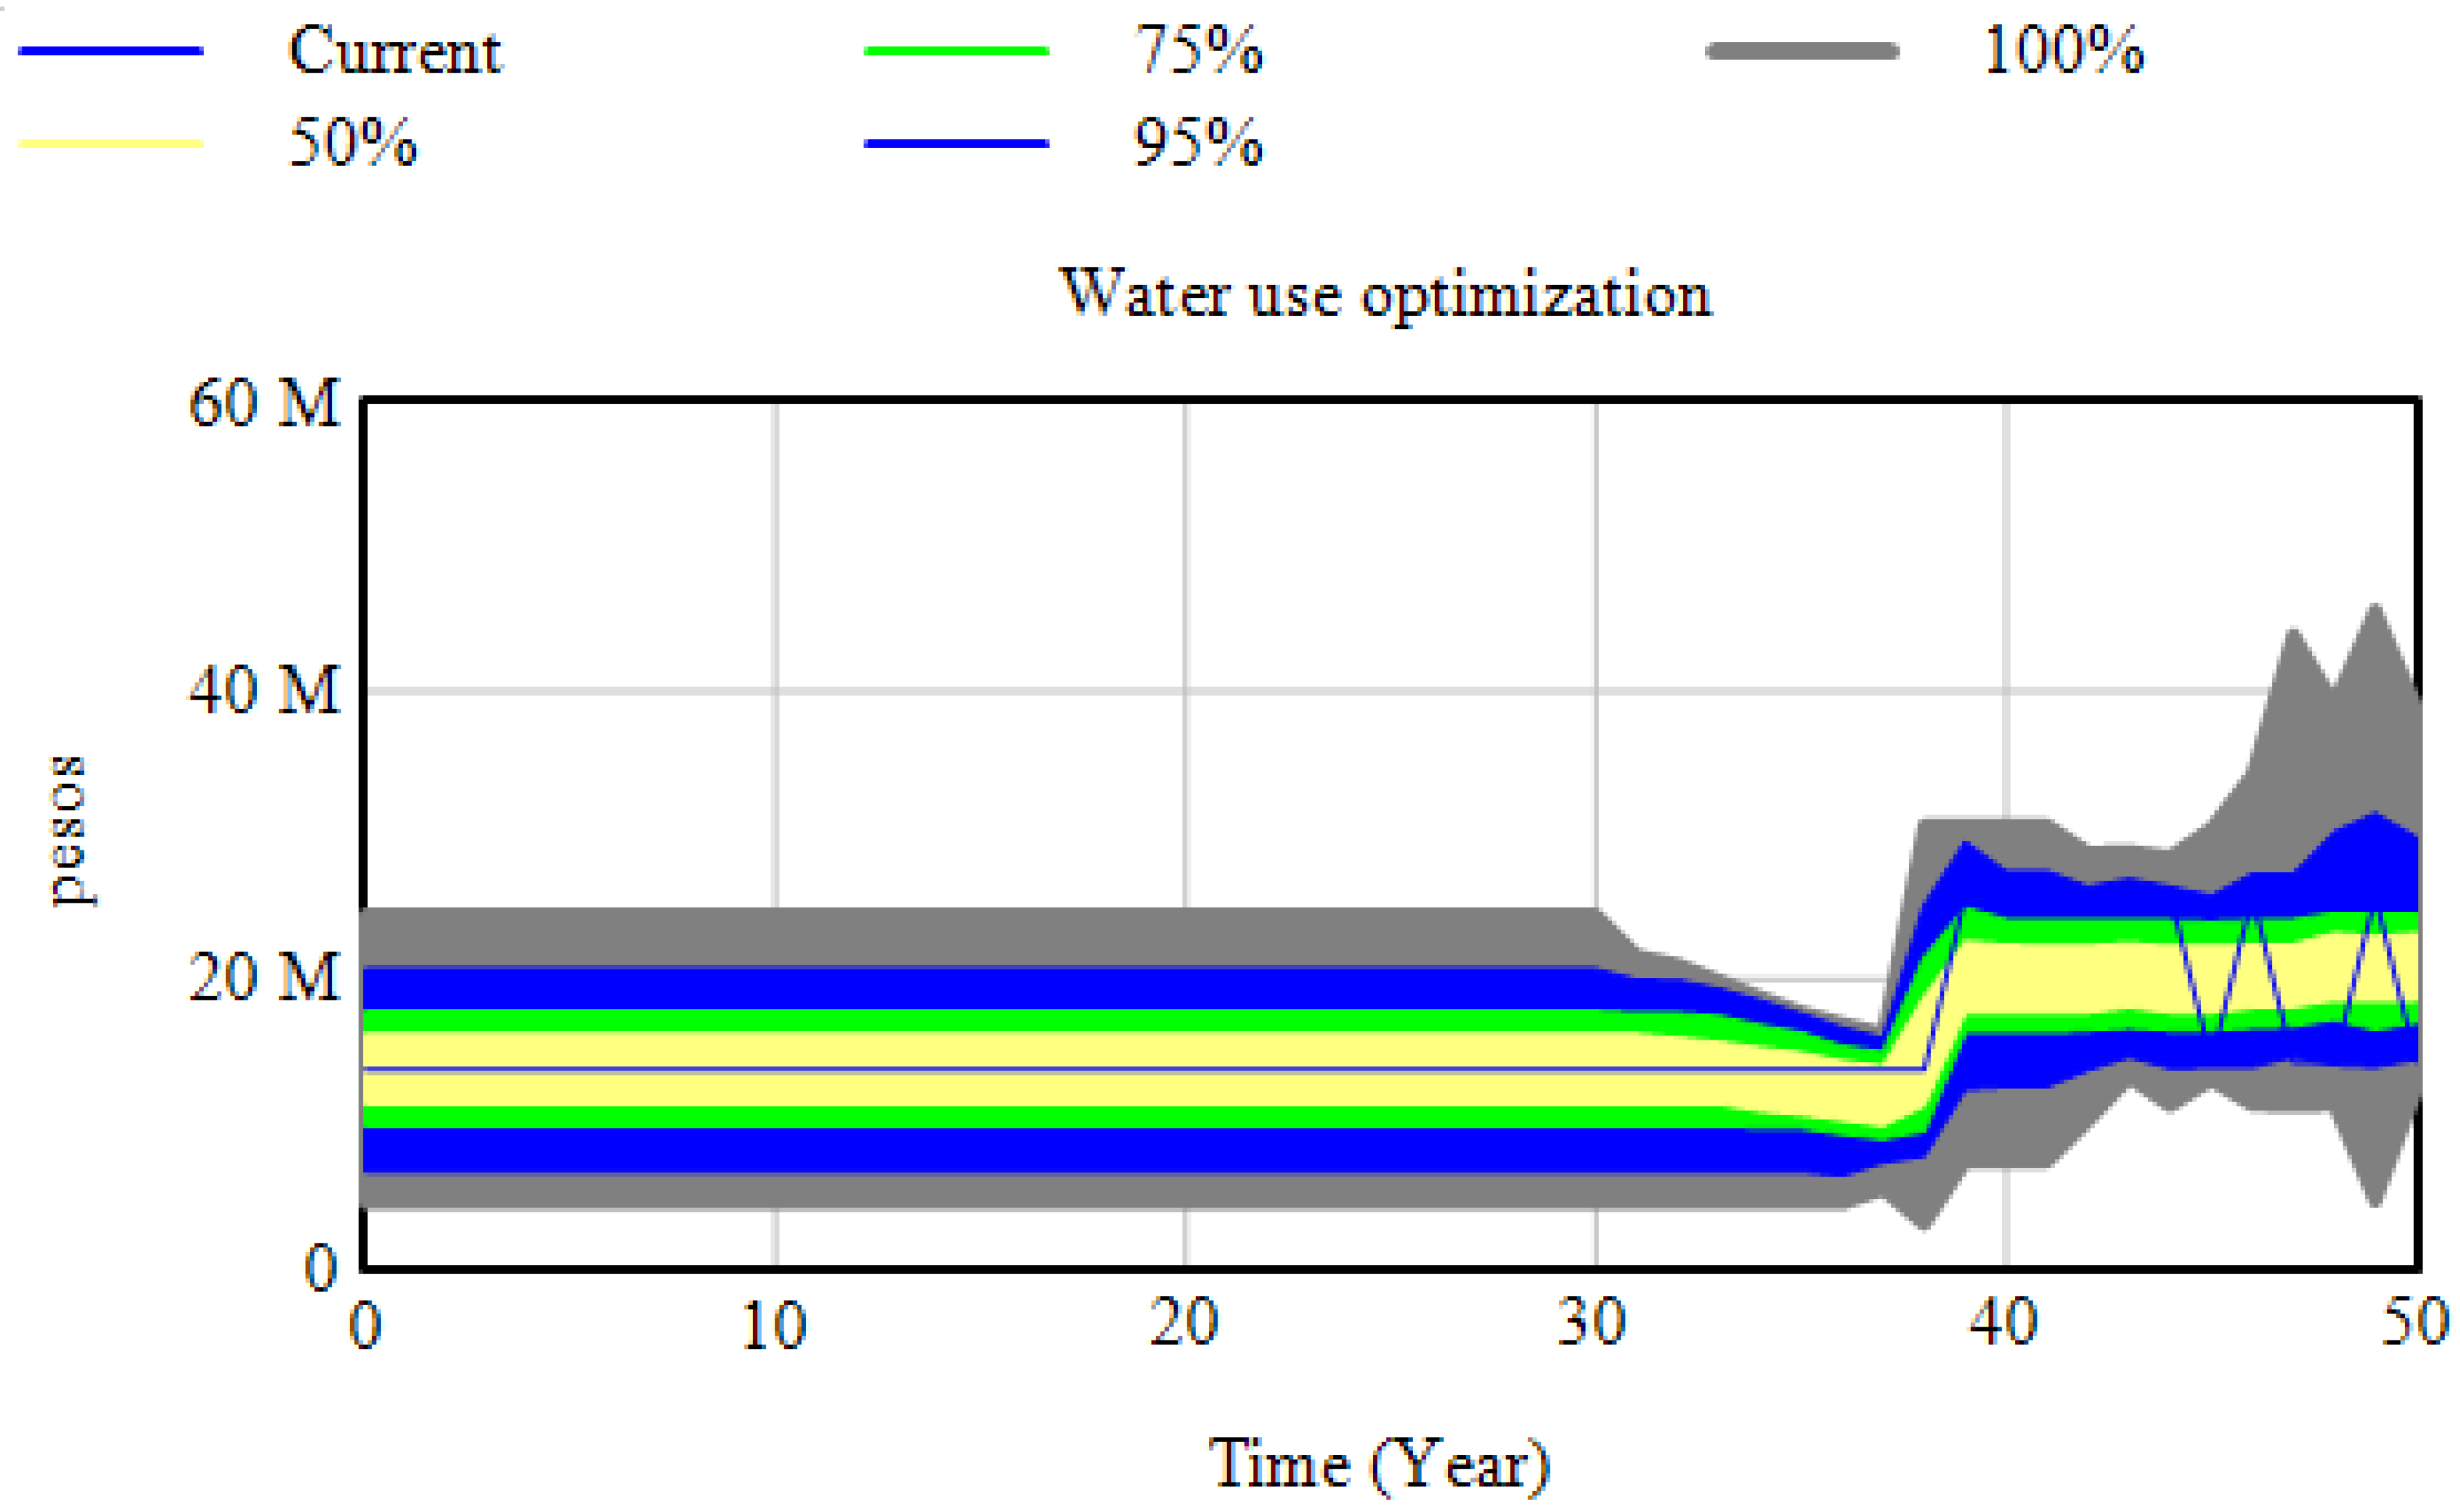
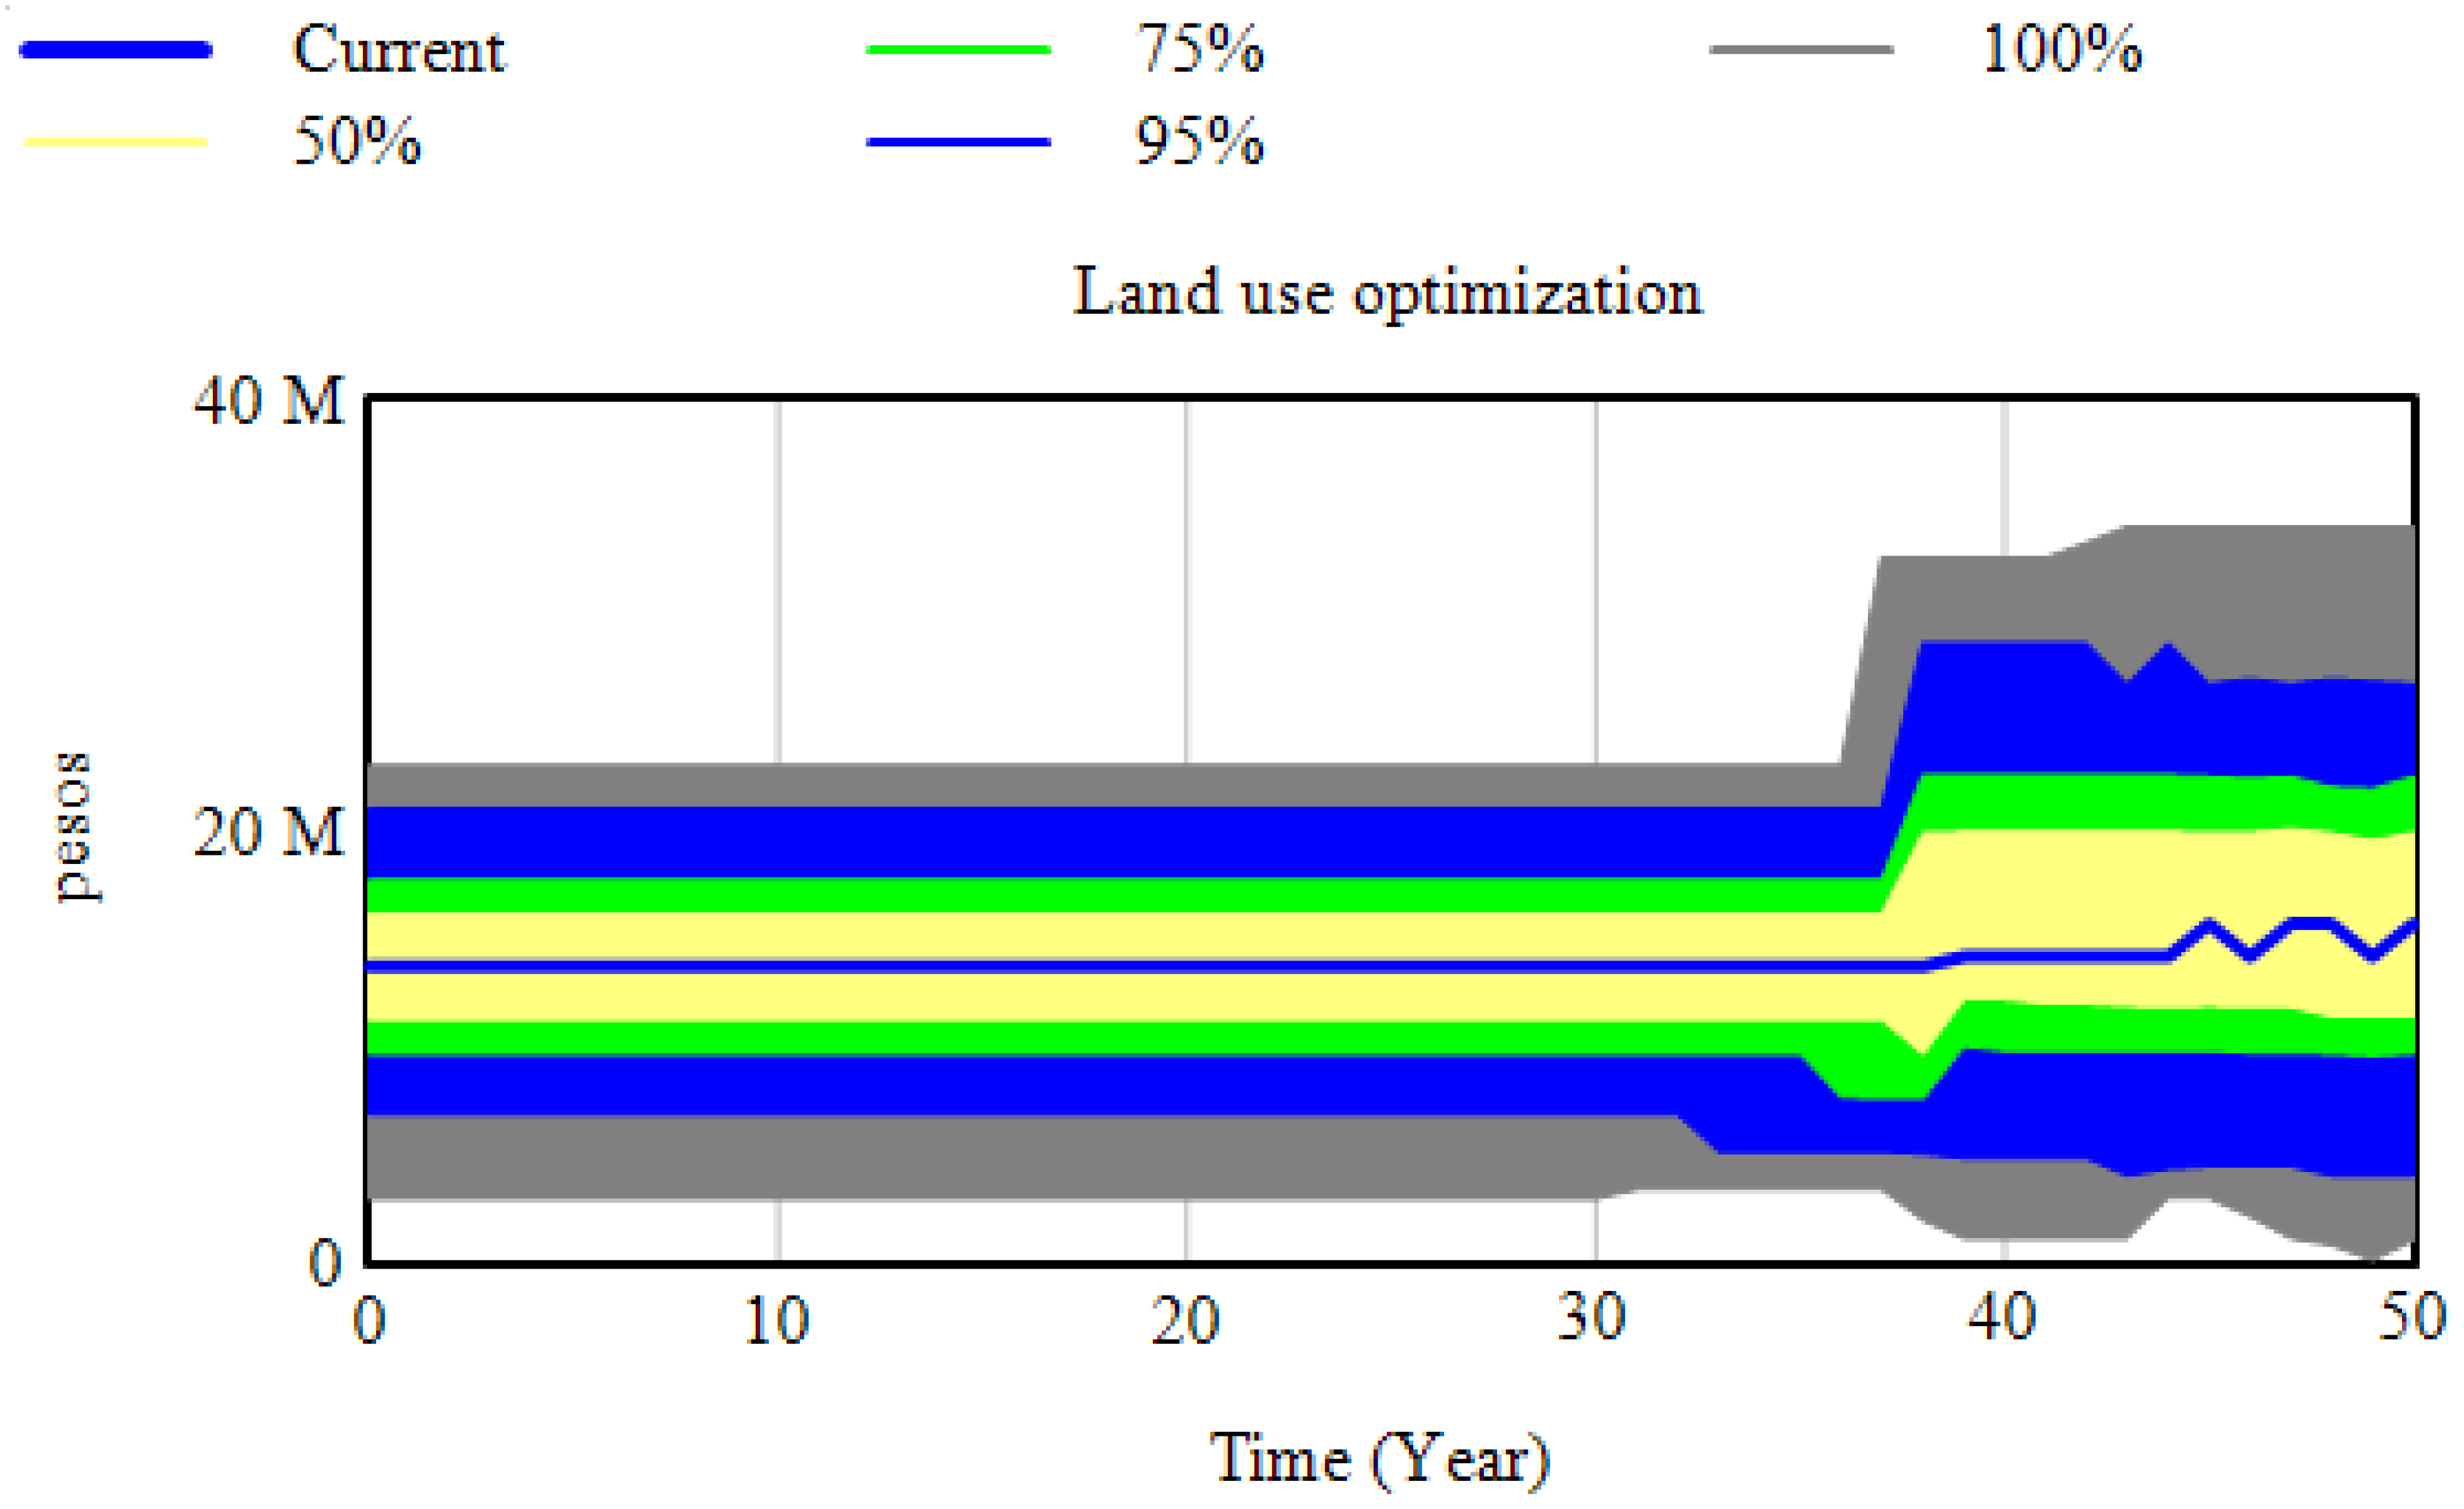
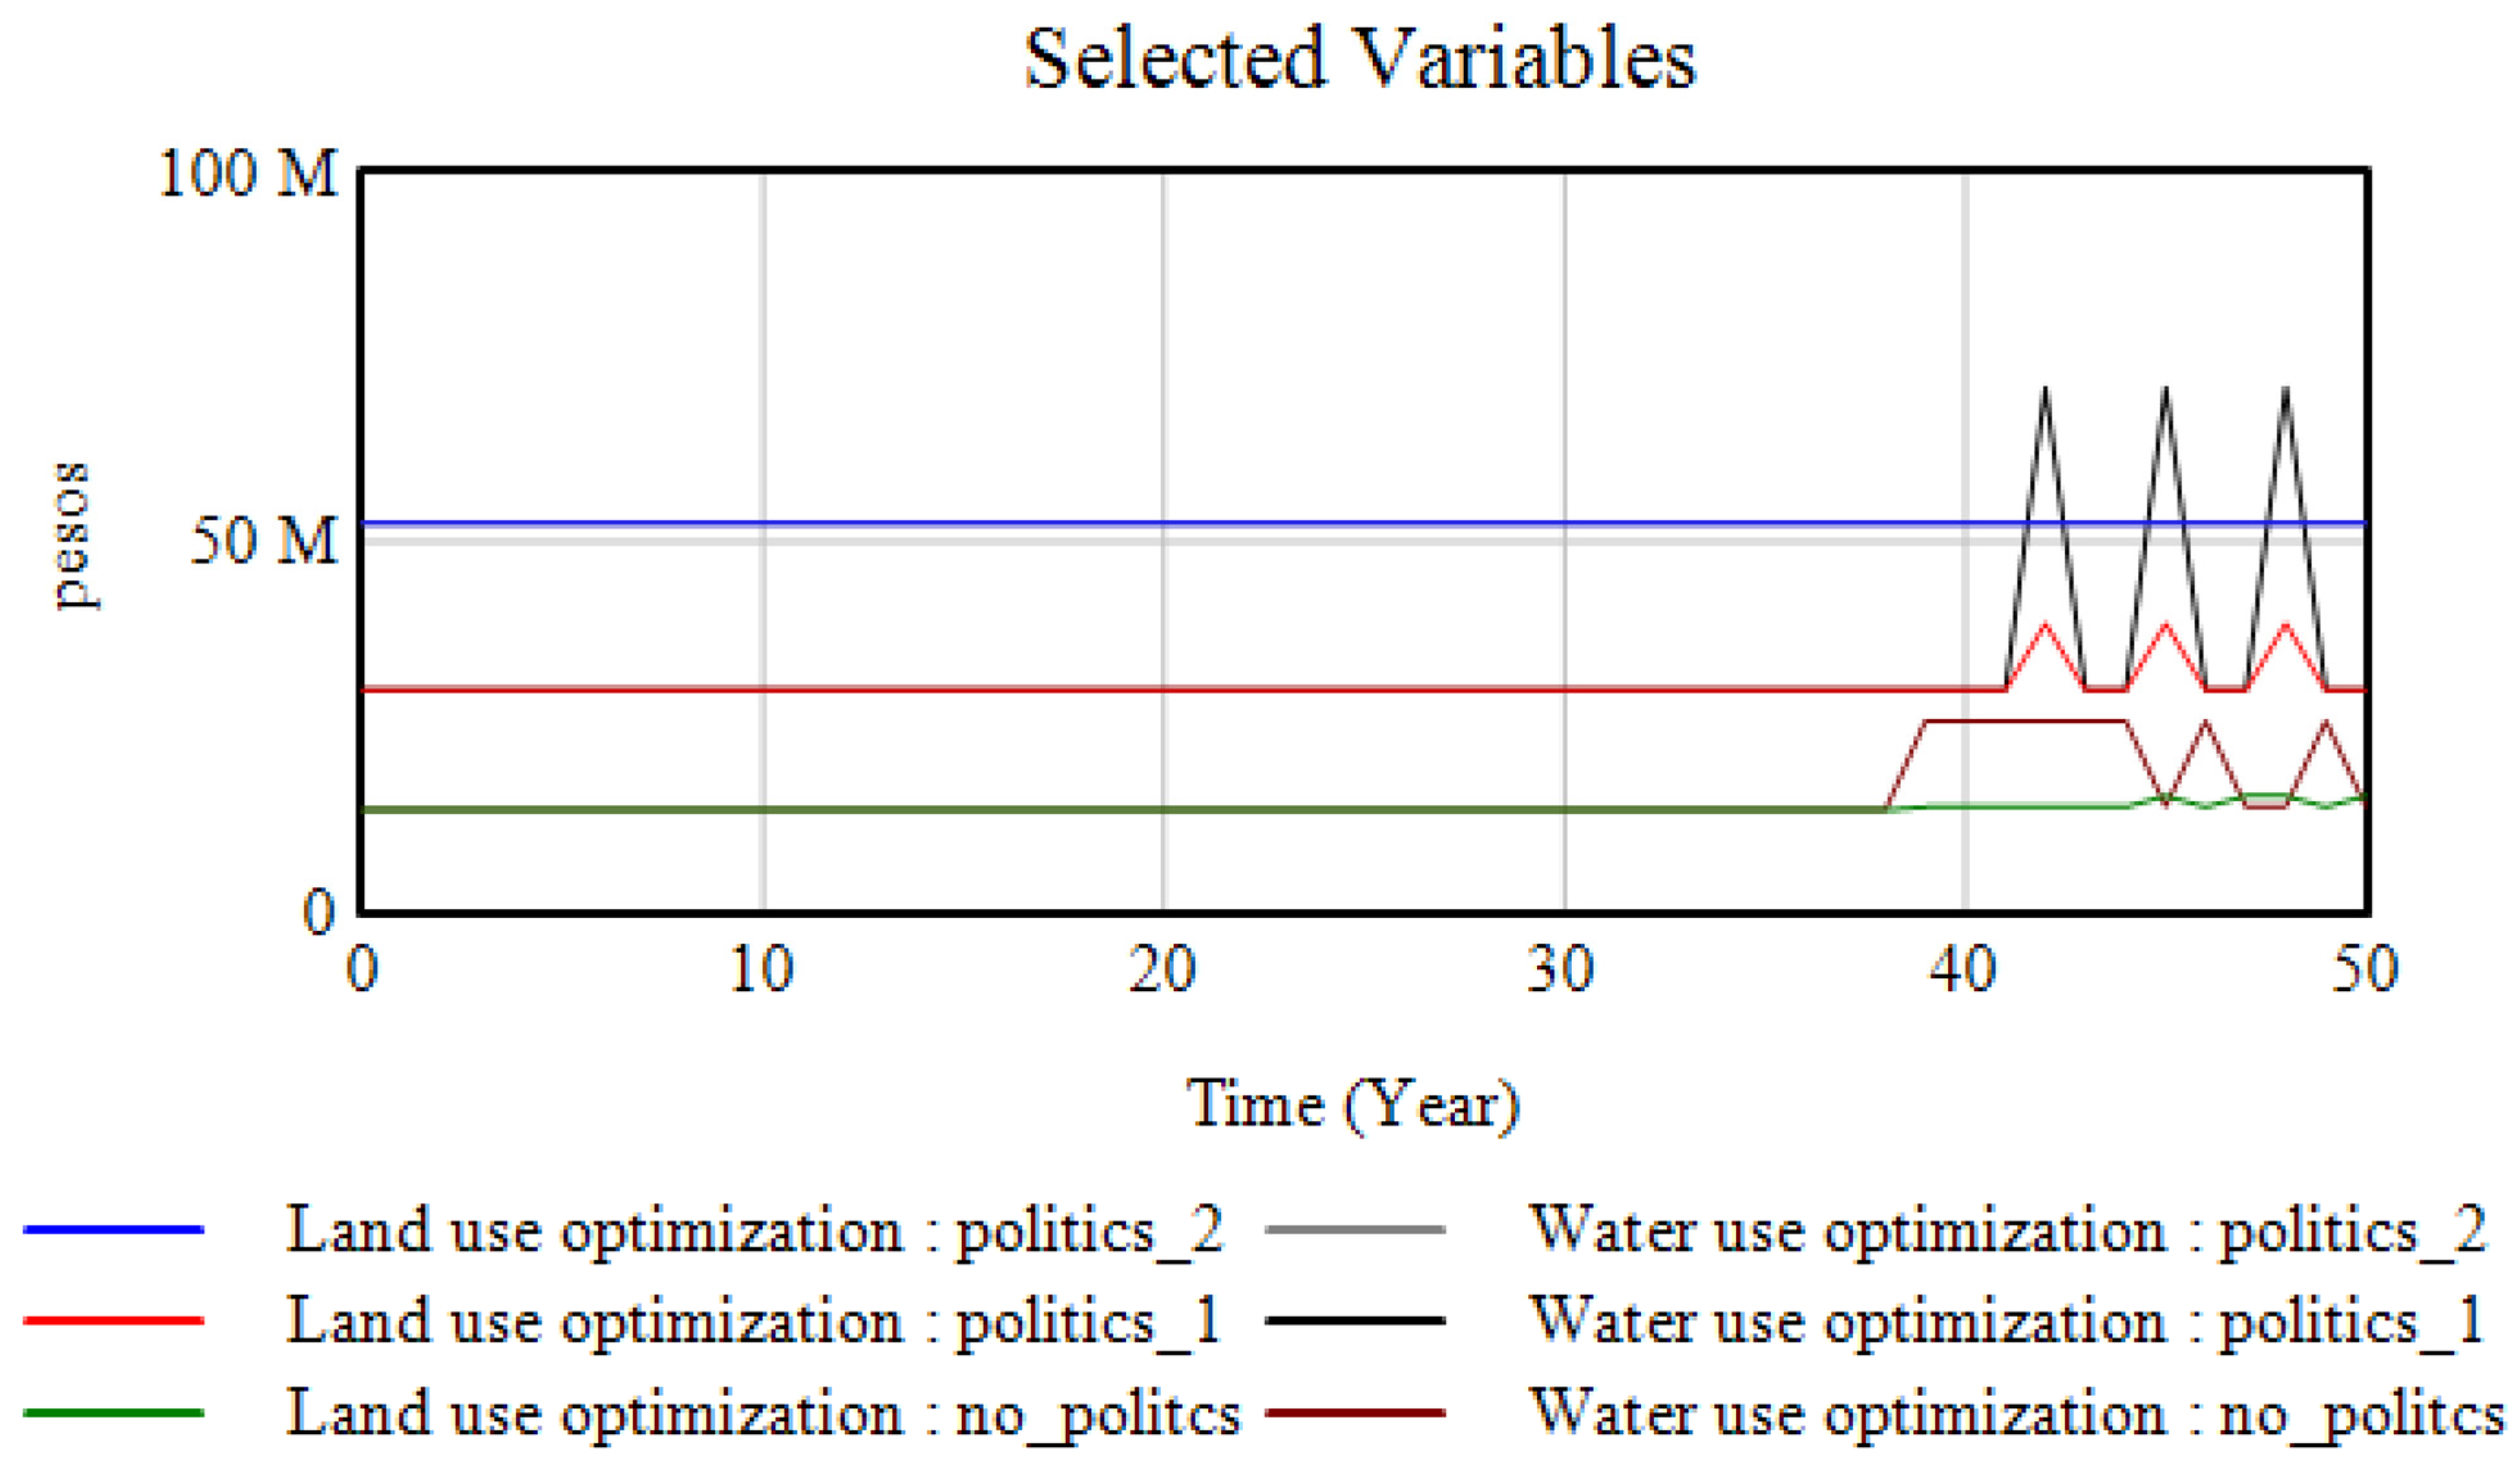
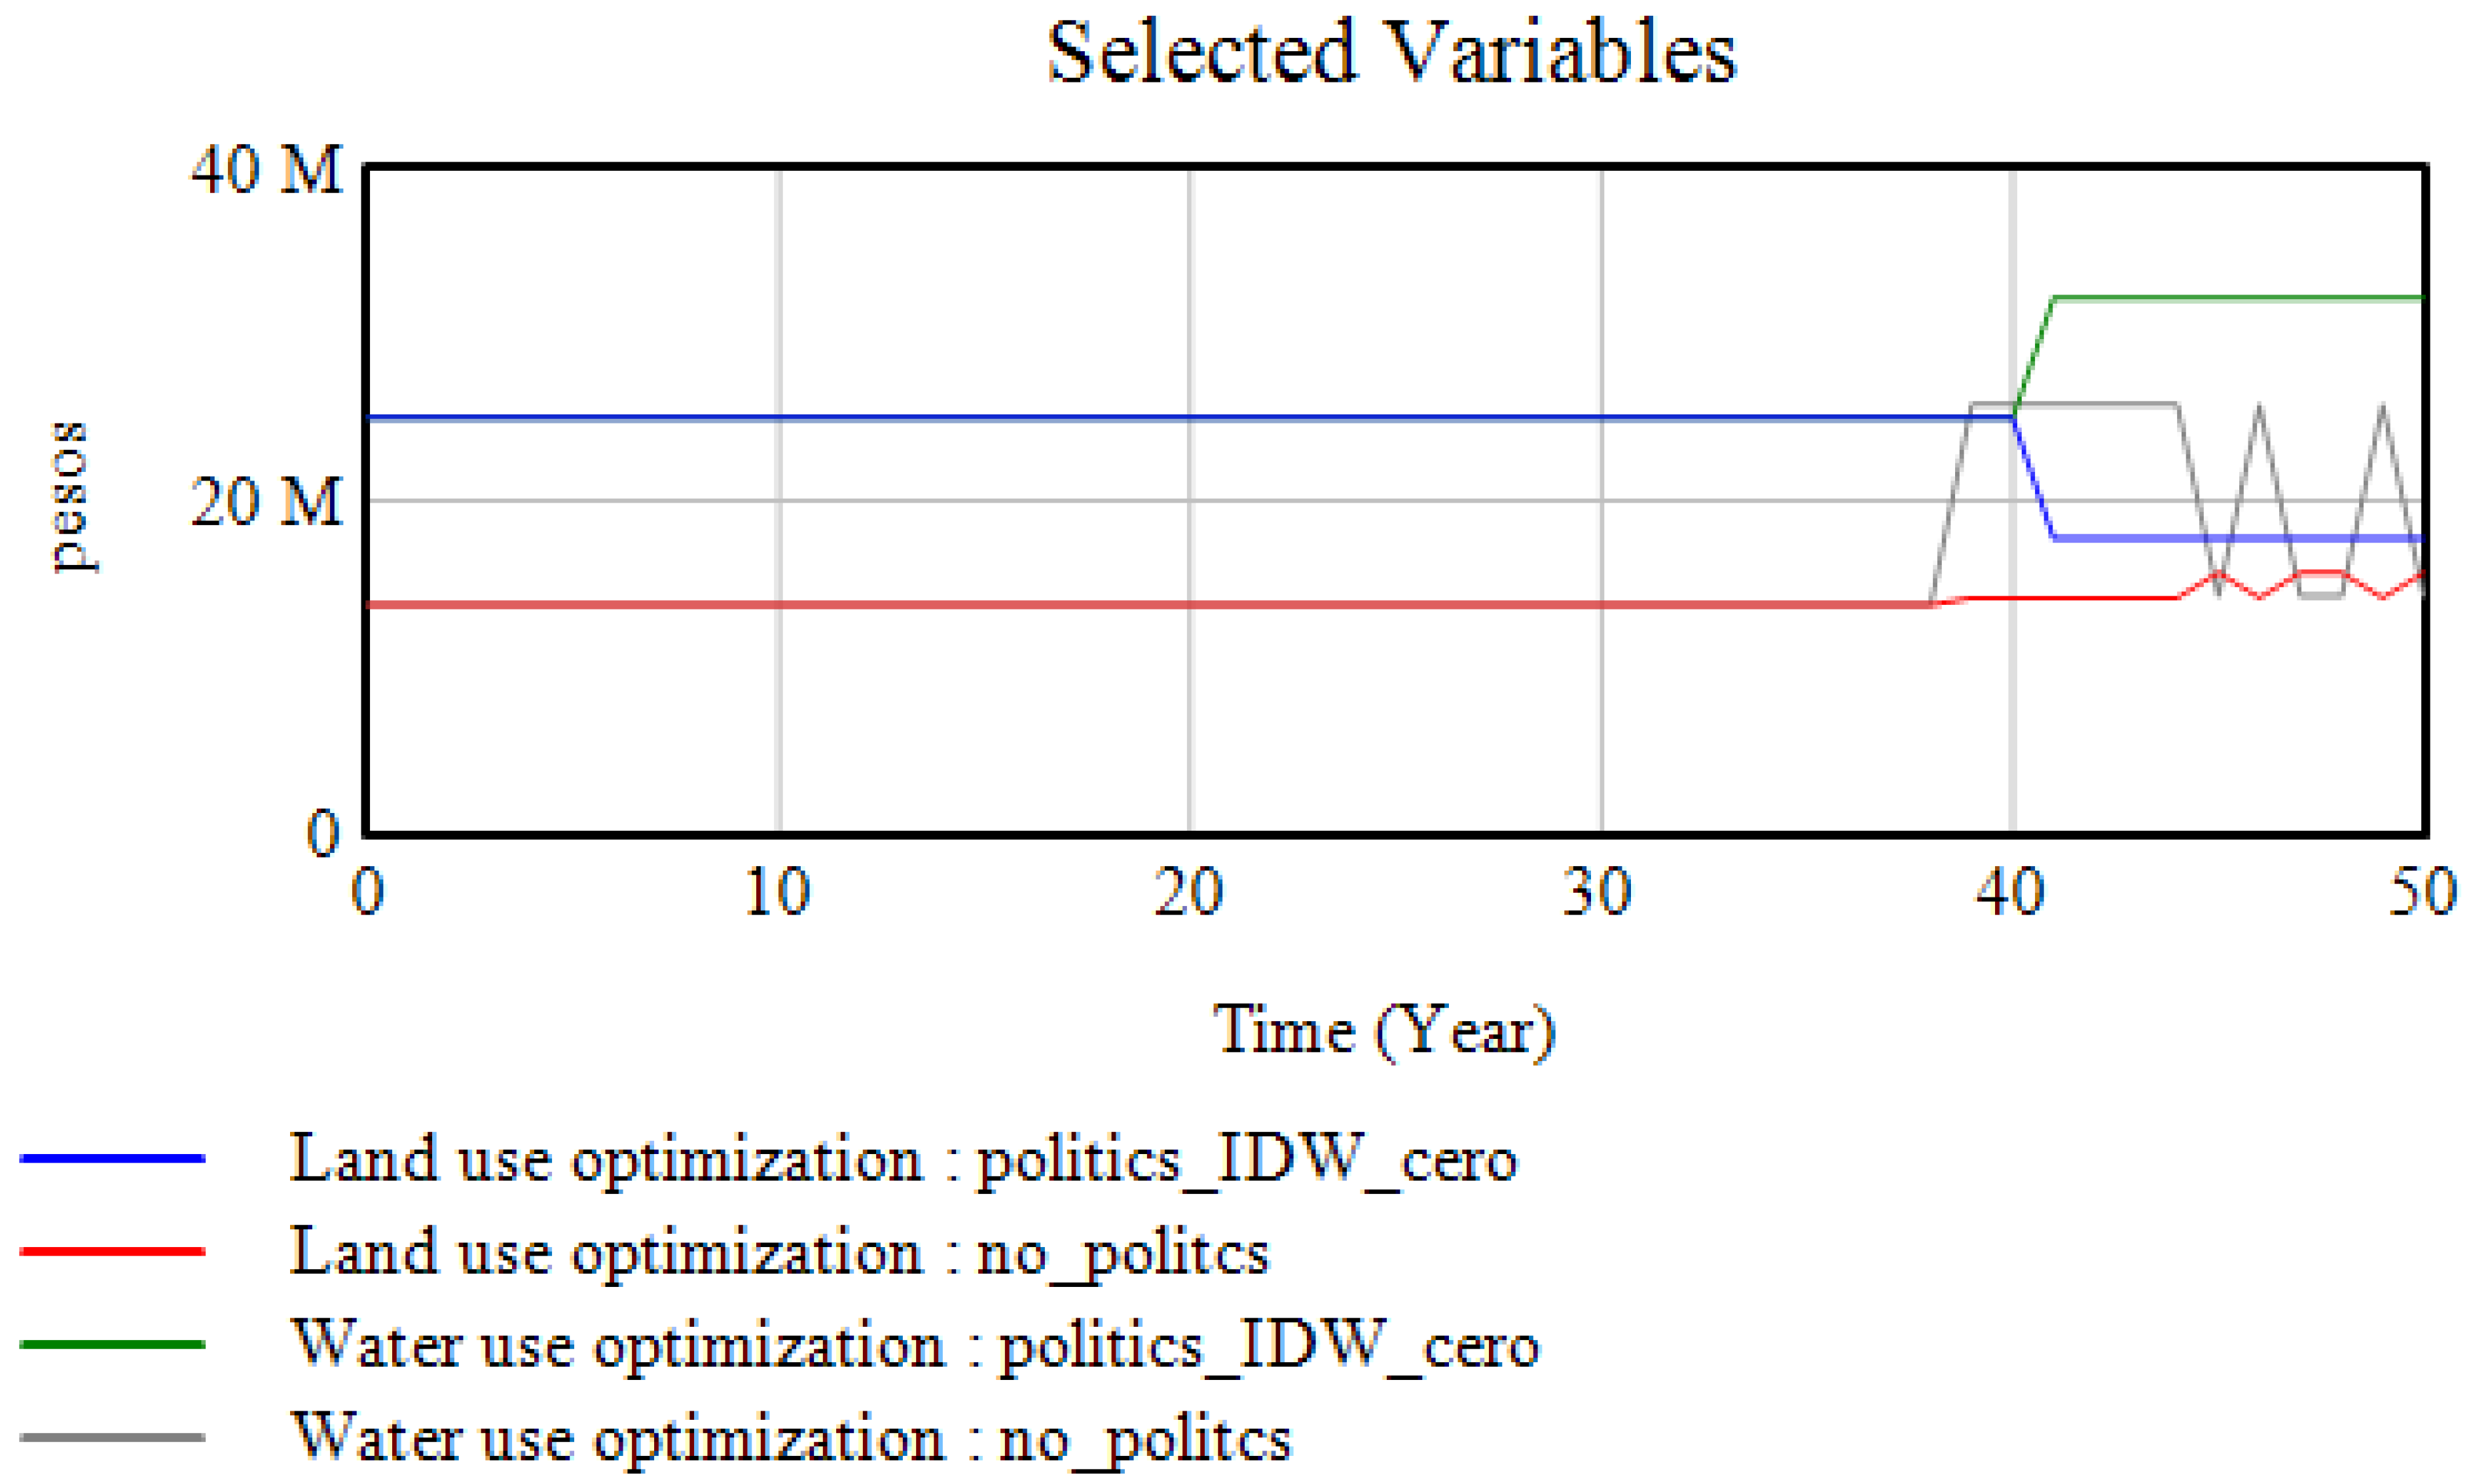
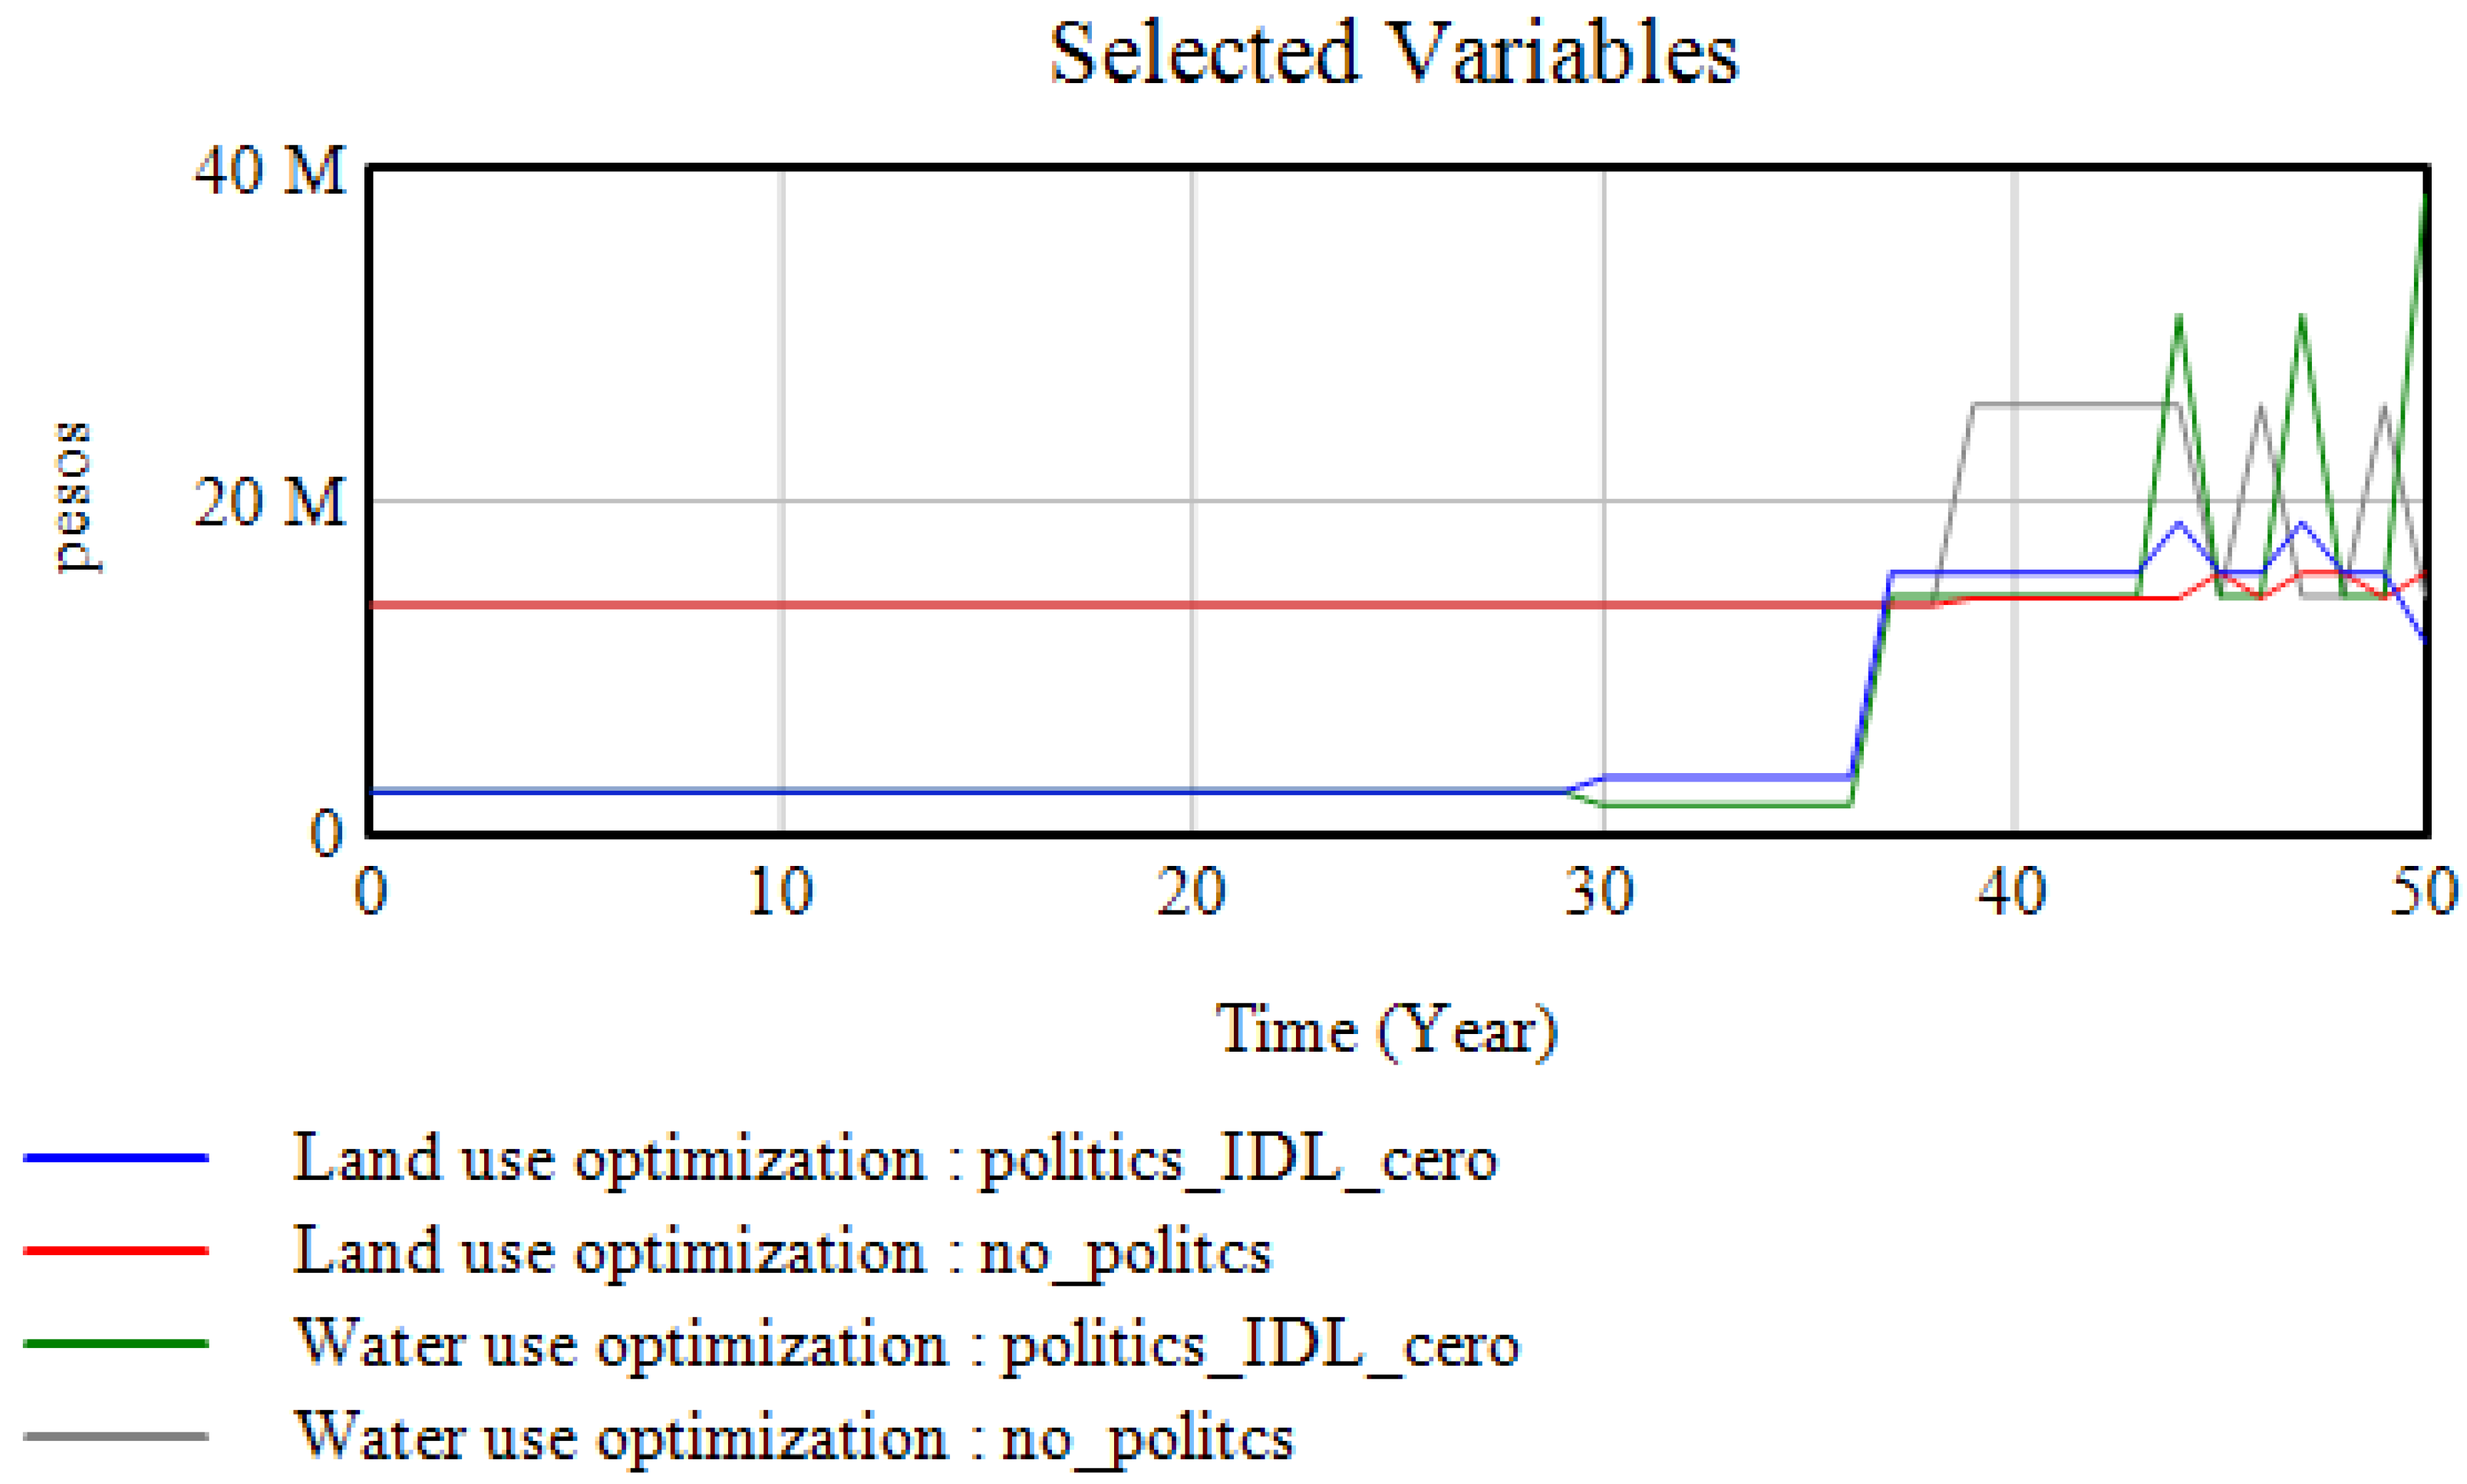
6. Results and Optimization

As was expressed in the previous sections, the ANP method was carried out at five different instants of time and considered the information obtained by means of the system dynamics model for each moment of time. In this way, it was possible to observe the various interpretations that the panel of experts can make when there are many data. At this point, the usefulness of a multicriteria process is highlighted like the ANP, through which it is possible to group different decisions about the same issue and establish a valid solution [46].
Figure 26 shows the individual results of the network analytical process in each of the five moments that the evaluation and prioritization were carried out. For this research, a 20-year time horizon was used, the year 0 (without intervention) being the first year to be evaluated, followed by the years 5, 10, 15, and 20 as the last year to be considered. This case corresponds to the California county in the Magdalena downtown region, a Colombian post-conflict period community.
However, the optimization process is based on the proposal described by Chichilinsky [47], to achieve sustainability. The basic idea is to exhibit a trade-off between preferences for the future and underlying natural resources (future supply and demand) and present preferences and consumption generated by utility criteria (current supply and demand). For this research, it was decided to give greater weight to the first ANP evaluations, 40% to the first one (year 0), 30% to the second (year 5), 15% to the third (year 10), 10% to the fourth (year 15), and 5% to the last evaluation (year 20). Considering that citizen factors express the most pressing needs and they are a Colombian post-conflict period community, its inhabitants expect a response in the short- and medium-term that improves their quality of life. Table 4 shows the results of each ANP evaluation realized and its corresponding weight.

7. Discussion

The proposed methodology for the evaluation and prioritization of green projects presents the use of applied mathematics [25,37,48], in a field in which it has rarely been used, such as sustainable social development [49,50]. Although the authors of [14] or [51] present an integrated approach to system dynamics and the ANP, this research could be more important considering the needs of the community with the goal of finding a balance between social, environmental, and economic development as set out in [52,53]. Although it is true that contributions such as those found in [25] in the field of sustainability are novel, they refer to other topics such as resource conservation, risk analysis [54], intervention strategies [55], among others, so the proposed methodology constitutes a contribution to the science of decision making and the integration of mathematics with the social and environmental aspects of the world so that, regardless of any bias or influence of sectors or people, the benefits to the community are maintained as we can see in [56,57].
Furthermore, in places where environmental conditions are often very favorable in relation to the supply of natural resources such as water and ground, but social and economic conditions require a more detailed review, the proposed methodology distances itself from research such as that presented in [58,59], by integrating different methods and having a model that is calibrated according to participatory factors (citizen factors), ensuring that the system includes not only the problems and needs but also the community expectations. Therefore, it gives rise to social learning processes through which it is possible to characterize the community as exposed in [9,56]. Moreover, just like the investigations presented in [60,61], the proposed methodology also achieves the characterization of the environment, information that is used when evaluating and prioritizing, since when applying a multicriteria method all the variables involved are considered, thus, determining their true influence on the process.
Although the processes of development and social learning are not usually linked to the application of mathematics, this research shows how this science, applied through mathematical modeling [62], can also contribute in this regard by indicating or highlighting aspects that must be taken into account when evaluating and prioritizing projects, which were added or inserted in a multi-criteria decision-making process like the proposed ANP method. It can be of great help for decision makers and results in better benefits and a better quality of life for the population [25].
The above reasons mean that the integration achieved in the proposed methodology results in an innovative alternative that adapts to scenarios where the problems are usually complex as they involve society. Even more, considering that these communities are in transition from the conflict to the post-conflict period, the problems continue to exist and continue to require the attention of local and national governments and other institutions that work in the region. It is then observed how mathematics adapt to problems of a complex and real nature that not only allow to produce theory, also it is possible to put them into practice for the solution or the contribution to social development, especially in the communities within a post-conflict period.

8. Conclusions

According to the main goal raised from the beginning, this research allowed us to demonstrate that the use of participatory, numerical, and analytical tools integrated into a methodology for evaluating and prioritizing green projects facilitates decision-making regarding warning of the degree of affectation that investment decisions have on the natural resources of water and ground in addition to the acceptance or rejection that these projects will have thanks to citizen factors.
However, we can see that two different methods such as system dynamics and the analytical network process can be conveniently integrated and complemented with the purpose of making more appropriate decision-making regarding the selection of green projects for a community. In this case, modeling and simulation tools that DS offers are used like data provided to experts who were able to make informed decisions according to the peer review required within the ANP method. In this way, they are linked in the proposed methodology, citizen participation (participatory workshops and citizen factors), mathematical methods, and models for the representation of a part of the real world (system dynamics) and the multicriteria method for decision making.
Moreover, the early warnings generated by the model demonstrate the remarkable relationship between social development and the scarcity of natural resources. In this sense, we can see how the inappropriate use of resources also has adverse effects on the community, slows down growth processes, and deteriorates the quality of life of its inhabitants.
Furthermore, the results show the usefulness of applied mathematics in decision-making processes and in matters of social development where, therefore, environmental problems related to the appropriate use of natural resources are involved. In this case in particular, the applied methodology activated the processes of the social learning of the community of the California county and allowed the best choice to be made for the community between four different projects.
We also concluded that the component called “Citizen Factor” makes the problems and needs of the population visible and, at the same time, improves decision making since this factor establishes direct relationships between local knowledge (social, environmental, and economic) and the potential benefits of the projects that undergo the evaluation and prioritization process.
In the same way, it is evidenced in variables such as the reserve margins (of water and soil), available budget, and the incentives for green projects, the direct relationship between the social development of the community, as confirmed in the different ANP evaluations made by the experts where they are indicated as those with the most weight when prioritizing the projects.
On the other hand, it is demonstrated how the proposed methodology contributed to the reduction in biases in decision making in two moments, the first during participatory modeling involving different social actors and the second in the evaluation by pairs of the experts carried out in the ANP method.
In the same way, the weighting of the ANP method results allows to conclude that the citizen participation in the prioritization and evaluation processes goes beyond the needs of the moment and shows not only what is urgent and requires immediate action but also what is important and what is expected to provide a solution in the future. The differentiation of the urgent and the important allowed the weighting of the ANP results in the final evaluation.
Nevertheless, some limiting factors can affect the execution of the methodology, among them obtaining the active participation and trust of the community so the information obtained could be trustable and true. Likewise, the understanding of the scenarios presented to the experts and their relationship with the projects to be evaluated and prioritized constitutes an aspect to be treated with care, so that information is not lost or misinterpreted which could alter decision-making.
Likewise, the inequality that is currently perceived in the countryside prevents development processes from taking place properly. In the same way, the lack of support and continuity of the projects by the governmental institutions, just as corruption causes the gap between the rural and the urban to be larger every day and that opportunities to improve the quality of life of the inhabitants, jobs, health, and education are lost, the foregoing given, among other things, by the stigma that has been woven with respect to the rural field and the individuals experiencing the conflict.
Contrary to that, in the California county such circumstances have been an engine that drives daily the search for change and improvement. The community is aware of its role in the territory and should not be alone in the search for well-being, especially if one takes into account that state support would consolidate the processes that are carried out.
Finally, this type of process, like the one followed in this research, generates discussions about the concept of development and the need to understand that development is not linear, nor can it be generalized. On the contrary, it is a process that is built with the transfer of the communities, their interests, conceptions, needs, views of the world, and the natural, economic, and cultural context. Therefore, it is necessary to stop seeing communities as homogeneous societies and to support them so that from their own knowledge they build their own forms of development that allow the achievement of the integral well-being of their inhabitants and of the territory.

Author Contributions

Conceptualization, J.A.C.-G. and G.O.-T.; data curation, G.O.-T. and J.V.-C.; formal analysis, J.A.C.-G. and J.V.-C.; funding acquisition, J.V.-C.; investigation, J.A.C.-G.; methodology, J.A.C.-G.; resources, G.O.-T.; validation, J.V.-C.; visualization, G.O.-T. and J.V.-C.; writing—original draft, J.A.C.-G.; writing—review and editing, J.A.C.-G. All authors have read and agreed to the published version of the manuscript.

Funding

This research was funded by Ministerio de Ciencia Tecnología e Innovacion de Colombia through National Doctorates program (announcement n°727 of 2015).

Institutional Review Board Statement

Not applicable.

Informed Consent Statement

Not applicable.

Data Availability Statement

Not applicable.

Acknowledgments

The authors are especially grateful to the National Doctorates program (announcement n°727 of 2015) of COLCIENCIAS, now the Ministry of Science, Technology and Innovation of Colombia. On the other hand, the authors express thanks to the National University of Colombia, likewise the Aysén University of Chile for their support for this type of research. Julián Castrillón Gómez expresses thanks to the California county for their determined collaboration and participation during the development of the workshops.

Conflicts of Interest

The authors declare no conflict of interest.

References

  1. Paz, A.C. Acuerdo Final Para La Terminación Del Conflicto Y La Construcción De Una Paz Estable Y Duradera. Gob. Nac. De Colombia Farc Ep. 2016, 1–294. [Google Scholar]
  2. Dávila, J.G.; Azcárate, J.; Kørnøv, L. Strategic Environmental Assessment for development programs and sustainability transition in the Colombian post-conflict context. Environ. Impact Assess. Rev. 2019, 74, 35–42. [Google Scholar] [CrossRef]
  3. Morales, L. LA PAZ Y LA PROTECCIÓN AMBIENTAL EN COLOMBIA: Propuestas para un desarrollo rural sostenible. El Diálogo Liderazgo para las Américas 2017, 36. [Google Scholar]
  4. Vanegas, E.Á.; Calderón, D.P. Entornos y riesgos de las Zonas Veredales y los Puntos Transitorios de Normalización. Fundación ideas para la paz. Bogotá 2017. [Google Scholar]
  5. Plan Marco De Implementación Del Acuerdo Final Para La Terminación Del Conflicto Y La Construcción De Una Paz Estable Y Duradera. Gob. Nac. De Colomb. 2017, 301.
  6. Olivar-Tost, G.; Valencia-Calvo, J.; Castrillón-Gómez, J.A. Towards decision-making for the assessment and prioritization of green projects: An integration between system dynamics and participatory modeling. Sustainability 2020, 12, 10689. [Google Scholar] [CrossRef]
  7. Gómez, J.A.C.; Calvo, J.V. Propuesta de modelo en dinámica de sistemas para toma de decisiones en selección de proyectos verdes. Rev. Mutis 2018, 8, 84–94. [Google Scholar] [CrossRef]
  8. Voinov, A.; Bousquet, F. Modelling with stakeholders. Environ. Model. Softw. 2010, 25, 1268–1281. [Google Scholar] [CrossRef]
  9. Henly-Shepard, S.; Gray, S.A.; Cox, L.J. The use of participatory modeling to promote social learning and facilitate community disaster planning. Environ. Sci. Policy 2015, 45, 109–122. [Google Scholar] [CrossRef]
  10. Chambers, R. Participatory rural appraisal (PRA): Analysis of experience. World Dev. 1994, 22, 1253–1268. [Google Scholar] [CrossRef]
  11. Chambers, R. Participatory rural appraisal (PRA): Challenges, potentials and paradigm. World Dev. 1994, 22, 1437–1454. [Google Scholar] [CrossRef]
  12. Saaty, T.L. Dependence and Feedback in Decision-Making with a Single Network. J. Syst. Sci. Syst. Eng. 2004, 13, 129–157. [Google Scholar] [CrossRef]
  13. Saaty, T.L.; Vargas, L.G. The Analytic Network Process. In Decis. Mak. Anal. Netw. Process. International Series in Operations Research & Management Science; Springer: Boston, MA, USA, 2006; Volume 95, pp. 1–27. [Google Scholar]
  14. Bottero, M.; Datola, G.; de Angelis, E. A System Dynamics Model and Analytic Network Process: An Integrated Approach to Investigate Urban Resilience. Land 2020, 9, 242. [Google Scholar] [CrossRef]
  15. Corrales, L.M.G.; Rangel, H.A.; Llantoy, R.G. Land-use and socioeconomic changes related to armed conflicts: A Colombian regional case study. Environ. Sci. Policy 2019, 97, 116–124. [Google Scholar] [CrossRef]
  16. Boateng, P.; Chen, Z.; Ogunlana, S.O. ScienceDirect an Analytical Network Process model for risks prioritisation in megaprojects. JPMA 2015, 33, 1795–1811. [Google Scholar]
  17. Lara, C.S.; Crispín, A.F.; Téllez, M.C.L. Participatory rural appraisal as an educational tool to empower sustainable community processes. J. Clean. Prod. 2018, 172, 4254–4262. [Google Scholar] [CrossRef]
  18. Sterman, J. Business Dynamics: Systems Thinking and Modeling for a Complex World; Irwin/McGraw-Hill: Boston, MA, USA, 2000. [Google Scholar]
  19. Aracil, J.; Gordillo, F. Dinámica de Sistemas; Alianza Editorial: Madrid, Spain, 1997. [Google Scholar]
  20. Sahin, O.; Stewart, R.A.; Helfer, F. Bridging the Water Supply–demand Gap in Australia: Coupling Water Demand Efficiency with Rain-independent Desalination Supply. Water Resour. Manag. 2015, 29, 253–272. [Google Scholar] [CrossRef]
  21. Aracil, J. Introducción a la Dinámica de Sistemas; Alianza Editorial: Madrid, Spain, 1983. [Google Scholar]
  22. Saltelli, A.; Ratto, M.; Andres, T.; Campolongo, F.; Cariboni, J.; Gatelli, D.; Saisana, M.; Tarantola, S. Global Sensitivity Analysis the Primer; John Wiley & Sons, Ltd: London, UK, 2008. [Google Scholar]
  23. Saltelli, A.; Tarantola, S.; Campolongo, F.; Ratto, M. Sensitivity Analysis in Diagnostic Modelling: Monte Carlo Filtering and Regionalised Sensitivity Analysis, Bayesian Uncertainty Estimation and Global Sensitivity Analysis; John Wiley & Sons, Ltd: London, UK, 2004. [Google Scholar]
  24. Valencia-Calvo, J.; Franco-Cardona, C.J.; Olivar-Tost, G.; Dyner-Rezonzew, I. Enfoque metodológico para el estudio y representación de comportamientos complejos en mercados de electricidad. Ing. y Cienc. 2016, 12, 195–220. [Google Scholar] [CrossRef]
  25. Siwailam, M.; Abdelsalam, H.; Saleh, M. Integrated DPSIR-ANP-SD framework for Sustainability Assessment of Water Resources System in Egypt. Ijamsr 2019, 3, 1–12. [Google Scholar]
  26. Sayyadi, R.; Awasthi, A. An integrated approach based on system dynamics and ANP for evaluating sustainable transportation policies. Int. J. Syst. Sci. Oper. Logist. 2018, 7, 1–10. [Google Scholar] [CrossRef]
  27. Liang, J.; Tzeng, G. Expert Systems with Applications An integrated MCDM technique combined with DEMATEL for a novel cluster-weighted with ANP method. Expert Syst. Appl. 2011, 38, 1417–1424. [Google Scholar]
  28. Bottero, M.; Comino, E.; Riggio, V. Environmental Modelling & Software Application of the Analytic Hierarchy Process and the Analytic Network Process for the assessment of different wastewater treatment systems. Environ. Model. Softw. 2011, 26, 1211–1224. [Google Scholar]
  29. Garuti, C.; Spencer, I. Parallels between the analytic hierarchy and network processes (AHP/ANP) and fractal geometry. Math. Comput. Model. 2007, 46, 926–934. [Google Scholar] [CrossRef]
  30. Del Tolima, G. Tolima en Cifras-Vigencia 2020. Available online: https://www.tolima.gov.co/tolima/cifras-y-estadisticas/tolima-en-cifras#1958-vigencia-2020 (accessed on 10 June 2021).
  31. Martínez, A.F.H. Aproximación a la configuración regional de la provincia norte del departamento del Tolima; Universidad del Tolima: Ibagué, Colombia, 2010. [Google Scholar]
  32. Nieto-Morote, A.; Ruz-Vila, F. A fuzzy approach to construction project risk assessment. Int. J. Proj. Manag. 2011, 29, 220–231. [Google Scholar] [CrossRef]
  33. Shelton, J.; Medina, M. Integrated Multiple-Criteria Decision-Making Method to Prioritize Transportation Projects. Transp. Res. Rec. J. Transp. Res. Board 2010, 2174, 51–57. [Google Scholar] [CrossRef]
  34. Saaty, T.; Vargas, L. Models, Methods, Concepts & Applications of the Analytic Hierarchy Process; Springer: New York, NY, USA, 2012. [Google Scholar]
  35. Saaty, T.L. Fundamentals of the analytic network process. Proc. ISAHP 1999, 1–14. [Google Scholar] [CrossRef]
  36. Ashofteh, P.-S.; Bozorg-Haddad, O.; Loáiciga, H.A. Multi-Criteria Environmental Impact Assessment of Alternative Irrigation Networks with an Adopted Matrix-Based Method. Water Resour. Manag. 2016, 31, 903–928. [Google Scholar] [CrossRef]
  37. Hewett, C.J.M.; Quinn, P.F.; Wilkinson, M.E. The decision support matrix (DSM) approach to reducing environmental risk in farmed landscapes. Agric. Water Manag. 2016, 172, 74–82. [Google Scholar] [CrossRef] [Green Version]
  38. Wijnmalen, D.J.D. Analysis of benefits, opportunities, costs, and risks (BOCR) with the AHP-ANP: A critical validation. Math. Comput. Model. 2007, 46, 892–905. [Google Scholar] [CrossRef]
  39. Yin, S.; Wang, C.; Teng, L.; Hsing, Y.M. Application of DEMATEL, ISM, and ANP for key success factor (KSF) complexity analysis in R & D alliance. Sci. Res. Essays 2012, 7, 1872–1890. [Google Scholar]
  40. Santos, S.P.; Belton, V.; Howick, S. Adding value to performance measurement by using system dynamics and multicriteria analysis. Int. J. Oper. Prod. Manag. 2002, 22, 1246–1272. [Google Scholar] [CrossRef]
  41. Ozdemir, M.S.; Saaty, T.L. The unknown in decision making. What to do about it. Eur. J. Oper. Res. 2006, 174, 349–359. [Google Scholar] [CrossRef]
  42. Whitaker, R. Validation examples of the Analytic Hierarchy Process and Analytic Network Process. Math. Comput. Model. 2007, 46, 840–859. [Google Scholar] [CrossRef]
  43. Sullivan, A.; York, A.M.; An, L.; Yabiku, S.T.; Hall, S.J. How does perception at multiple levels influence collective action in the commons? The case of Mikania micrantha in Chitwan, Nepal. For. Policy Econ. 2017, 80, 1–10. [Google Scholar] [CrossRef]
  44. Saaty, T.L. Rank from comparisons and for ratings in the analytic hierarchy/network processes. Eur. J. Oper. Res. 2006, 168, 557–570. [Google Scholar] [CrossRef]
  45. Adams, W. Super Decisions; Creative Decisions Foundation: Pittsburgh, PA, USA, 2003. [Google Scholar]
  46. Saaty, T.L. Time dependent decision-making; dynamic priorities in the AHP/ANP: Generalizing from points to functions and from real to complex variables. Math. Comput. Model. 2007, 46, 860–891. [Google Scholar] [CrossRef]
  47. De Lara, M.; Doyen, L. Sustainable Management of Natural Resources: Mathematical Models and Methods; Springer: Berlin/Heidelberg, Germany, 2008. [Google Scholar]
  48. Grabowski, A.M.; Gurnell, R.C. Hydrogeomorphology- Ecology Interactions in River Systems. River Res. Appl. 2016, 22, 1085–1095. [Google Scholar] [CrossRef]
  49. Xi, X.; Poh, K.L. A Novel Integrated Decision Support Tool for Sustainable Water Resources Management in Singapore: Synergies Between System Dynamics and Analytic Hierarchy Process. Water Resour. Manag. 2014, 29, 1329–1350. [Google Scholar] [CrossRef]
  50. Mazzega, P.; Therond, O.; Debril, T.; March, H.; Sibertin-Blanc, C.; Lardy, R.; Sant’Ana, D. Critical multi-level governance issues of integrated modelling: An example of low-water management in the adour-garonne basin (France). J. Hydrol. 2014, 519, 2515–2526. [Google Scholar] [CrossRef] [Green Version]
  51. Elsawah, S.; Danesh, D.; Ryan, M. A strategic asset planning decision analysis: An integrated System Dynamics and multi-criteria decision-making method. INCOSE Int. Symp. 2019, 29, 788–802. [Google Scholar] [CrossRef]
  52. Yang, W.; Bryan, B.A.; MacDonald, D.H.; Ward, J.R.; Wells, G.; Crossman, N.D.; Connor, J.D. A conservation industry for sustaining natural capital and ecosystem services in agricultural landscapes. Ecol. Econ. 2010, 69, 680–689. [Google Scholar] [CrossRef]
  53. Rahman, M.R.; Shi, Z.H.; Chongfa, C. Assessing regional environmental quality by integrated use of remote sensing, GIS, and spatial multi-criteria evaluation for prioritization of environmental restoration. Environ. Monit. Assess. 2014, 186, 6993–7009. [Google Scholar] [CrossRef] [PubMed]
  54. Prince, B.; Zhen, C.; Stephen, O.O. A Dynamic Framework for Managing the Complexities of Risks in Megaprojects Scott Sutherland School of Architecture and Built Environment; Robert Gordon University: Aberdeen, Scotland, 2016; Volume 5, pp. 1–13. [Google Scholar]
  55. Yu, K.; Cao, Q.; Xie, C.; Qu, N.; Zhou, L. Analysis of intervention strategies for coal miners’ unsafe behaviors based on analytic network process and system dynamics. Saf. Sci. 2019, 118, 145–157. [Google Scholar] [CrossRef]
  56. Suarez, A.; Arias-Arévalo, P.; Martinez-Mera, E.; Granobles-Torres, J.C.; Enríquez-Acevedo, T. Involving victim population in environmentally sustainable strategies: An analysis for post-conflict Colombia. Sci. Total Environ. 2018, 643, 1223–1231. [Google Scholar] [CrossRef]
  57. Castelli, G.; Bresci, E.; Castelli, F.; Hagos, E.Y.; Mehari, A. A participatory design approach for modernization of spate irrigation systems. Agric. Water Manag. 2018, 210, 286–295. [Google Scholar] [CrossRef]
  58. Ducrot, R.; van Paassen, A.; Barban, V.; Daré, W.; Gramaglia, C. Learning integrative negotiation to manage complex environmental issues: Example of a gaming approach in the peri-urban catchment of São Paulo, Brazil. Reg. Environ. Chang. 2014, 15, 67–78. [Google Scholar] [CrossRef]
  59. Dionnet, M.; Daniell, K.A.; Imache, A.; Von Korff, Y.; Bouarfa, S.; Garin, P.; Jamin, J.-Y.; Rollin, D.; Rougier, J.-E. Improving participatory processes through collective simulation: Use of a community of practice. Ecol. Soc. 2013, 18, 36. [Google Scholar] [CrossRef]
  60. Grajales-quintero, A.; Serrano-, E.D.; Von-H, C.M.H. Los métodos y los procesos multicriterio para la evaluación. Luna Azul No. 36, enero-junio 2013. 2013, 36, 285–306. [Google Scholar]
  61. Kittur, J. Optimal Generation Evaluation using SAW, WP, AHP and PROMETHEE Multi-Criteria Decision Making Techniques (mij) K (mij) L. In Proceedings of the 2015 International Conference on Technological Advancements in Power and Energy (TAP Energy), Kollam, India, 24–26 June 2015; pp. 304–309. [Google Scholar]
  62. Forrester, J.W. Lessons from system dynamics modeling. Syst. Dyn. Rev. 1987, 3, 136–149. [Google Scholar] [CrossRef]
Figure 1. Methodological development for the evaluation and prioritization of projects.
Sustainability 14 11519 g001
Figure 2. System dynamic model—casual loop diagram.
Sustainability 14 11519 g002
Figure 3. System dynamic model—stock and flow diagram (SFD).
Sustainability 14 11519 g003
Figure 4. Evolution of the dynamic system according to sensitivity analysis of the Available Water level variable.
Sustainability 14 11519 g004
Figure 5. Evolution of the dynamic system according to the sensitivity analysis of the Land Available level variable.
Sustainability 14 11519 g005
Figure 6. Behavior in the water reserve margin that indicates the availability over time of the natural resource for the projects.
Sustainability 14 11519 g006
Figure 7. Behavior in the land reserve margin that indicates the availability over time of the natural resource for the projects.
Sustainability 14 11519 g007
Figure 8. Monotonous behaviors in the water prioritization variable due to the influence of the citizen factors.
Sustainability 14 11519 g008
Figure 9. Non-scarcity scenario according to the land prioritization variable.
Sustainability 14 11519 g009
Figure 10. Variation over the time for the variable Water Use Optimization.
Sustainability 14 11519 g010
Figure 11. Variation over the time for the variable Land Use Optimization.
Sustainability 14 11519 g011
Figure 12. Scenario without investment policies versus a scenario with investment decisions.
Sustainability 14 11519 g012
Figure 13. Second test model—variables Land Use Optimization and Water Use Optimization.
Sustainability 14 11519 g013
Figure 14. Third test model—Investment Decision Water (Zero), reduction in the variability of decisions thanks to citizen factors.
Sustainability 14 11519 g014
Figure 15. Third test model—Investment Decision Land (Zero), unfavorable conditions for resource optimization.
Sustainability 14 11519 g015
Figure 16. Identification of the clusters of the ANP network, in the system dynamics model.
Sustainability 14 11519 g016
Figure 17. ANP network from the system dynamics model.
Sustainability 14 11519 g017
Figure 18. Geographic location of the California county, Fresno (Tolima); source: Tolima Governing [30].
Sustainability 14 11519 g018
Figure 19. Development of the SWOT matrix during the participatory workshop with the California community.
Sustainability 14 11519 g019
Figure 20. Semi-structured dialogue activity developed with workshop participants in California county.
Sustainability 14 11519 g020
Figure 21. Simulation reserve margins environmental dimension.
Sustainability 14 11519 g021
Figure 22. Feasibility of the projects according to the reserve margins and the citizen factors (government dimension).
Sustainability 14 11519 g022
Figure 23. Optimization of the resource economic dimension.
Sustainability 14 11519 g023
Figure 24. Pairwise comparison. Environmental dimension vs. economic dimension.
Sustainability 14 11519 g024
Figure 25. Comparison between nodes with the Saaty scale.
Sustainability 14 11519 g025
Figure 26. Results of the ANP evaluations (years 0 to 20).
Sustainability 14 11519 g026
Table 1. PRA findings classified by dimension (ANP network cluster).
Identified FindingDimension (ANP Network Cluster)Used Tool
Difficulties in arriving to the countySocioeconomicVenn diagram
Small-scale agriculture (self-supply and external sale)SocioeconomicVenn diagram
Main products: cocoa, banana, avocado, and coffeeSocioeconomicVenn diagram
Climate variety, many farming and fertile landsEconomicSWOT
No agro-tourism-type projects are identified in the regionEconomic and from the governmentSWOT
Social connectionSocialSWOT
Abandonment by the state and local governmentSocial and from the governmentVenn diagram
The population of the county, most of them left the county due to the violence in the nearby regionsSocialSemi-structured dialogue
Diversity of thought and approach to the problems and needs of the communitySocialSemi-structured dialogue
Impossibility of taking adequate advantage of natural resources and the existing share capital due to the lack of institutional support in the development of high-impact projects and lack of training for its inhabitantsSocioeconomic and from the governmentSemi-structured dialogue
Soil affectation (in exchange for better productivity) using pesticides and agrochemicals in cropsSocioeconomicSemi-structured dialogue
The community of California recognizes that technification in their crops can mean greater competitive capacity in the market, and a better position of their products with more profitable prizesSocioeconomicSemi-structured dialogue
The natural resource of water is widely accessible to the inhabitants, so it can be consumed directly from the springs and gorges of the zoneEnvironmentalSemi-structured dialogue
The community recognizes the problems that underlie the consumption of non-potable water in relation to the generation of diseases.Social environmentalVenn diagram
Industrialization processes or widespread growth of the main crops are not identified in the county, small-scale agricultural production being the main economic source, likewise the underemployment in the nearby countiesEconomicVenn diagram
Project management or resources for productive projects in the county are not identified, which makes the improvement in the physical, economic, natural, and cultural conditions of the community difficultGovernmentSemi-structured dialogue
Table 2. Calibration of the model in system dynamics.
ParameterDescriptionValueUnitsSource
Water Input RateAmount of water provided by the different tributaries in the area per year22%[30,31]
Unused Water RateAmount of water not consumed or used per year45%[30,31]
Variable Consumption of WaterAmount of water consumed above the annual average60Cubic meters[30,31]
Fixed Consumption of WaterAmount of water consumed per year130Cubic meters[30,31]
Population Number of inhabitants200People[30,31]
Price of WaterValue paid per m3 of water6000Pesos[30,31]
Available BudgetAmount of money available for investment50Millions of pesosModel assumption
Price of LandAverage value paid per hectare of land150Thousands of pesos[30,31]
Land UseAmount of land consumed per year9000Hectares[30,31]
Intended Use of LandProportion of land (of the total) planned to be used for the following years30%[30,31]
Land Use RateProportion of land (of the total) used each year15%[30,31]
Total LandTotal hectares of land (used and unused)515Thousands of hectares[30,31]
FCSwaterSocial citizen factor (water)20%DimensionlessParticipatory workshop
FCAwaterEnvironmental citizen factor (Water)25%DimensionlessParticipatory workshop
FCEwaterEconomic citizen factor (water)55%DimensionlessParticipatory workshop
FCSlandSocial citizen factor (land) 10%DimensionlessParticipatory workshop
FCAlandEnvironmental citizen factor (land)30%DimensionlessParticipatory workshop
FCElandEconomic citizen factor (land)60%DimensionlessParticipatory workshop
Table 3. Saaty fundamental scale.
ValueDefinitionComment
1Equal importanceCriterion A is just as important as criterion B
3Moderate importanceExperience and judgment slightly favor criterion A over criterion B.
5Big importance Experience and judgment strongly favor criterion A over criterion B
7Very big importanceCriterion A is much more important than criterion B.
9Extreme importanceThe greater importance of criterion A over B is beyond doubt
2, 4, 6, 8Intermediate values between the previous ones, when it is necessary to qualify
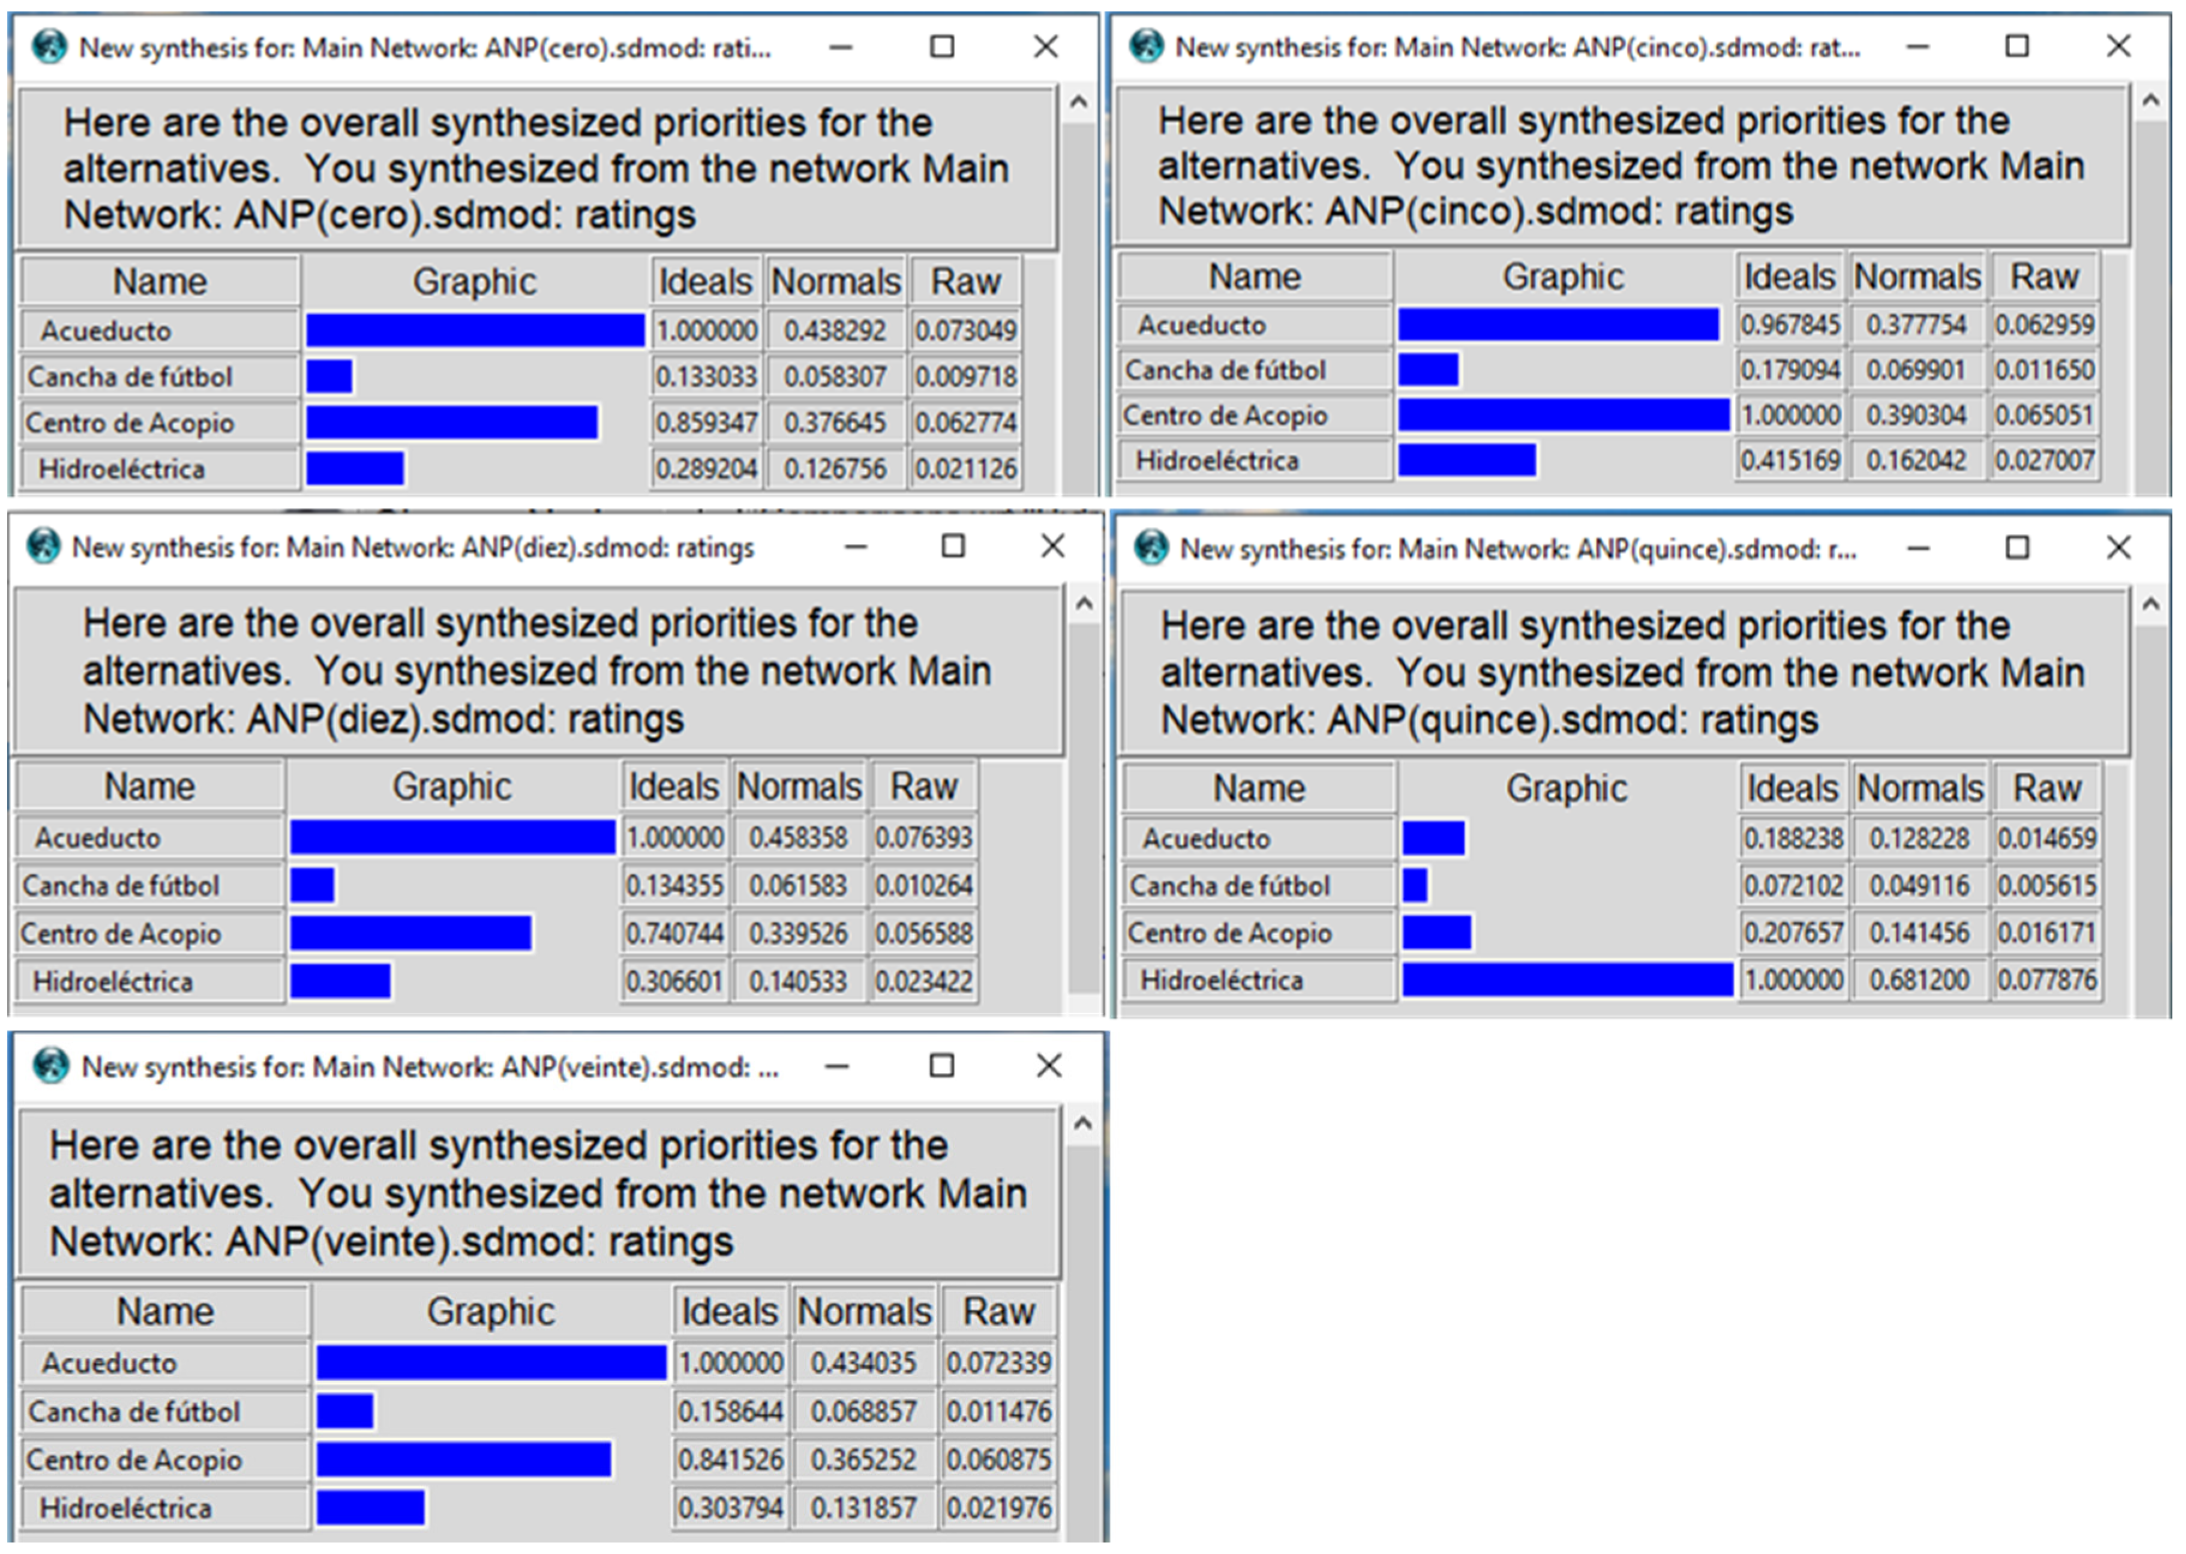
Table 4. ANP evaluations and weights (years 0 to 20).
ProjectYear 0Weight 40%Year FiveWeight 30%Year TenWeight 15%Year FifteenWeight 10%Year TwentyWeight 5%Final Result
Aqueduct0.4380.1750.3770.1130.4580.0680.1280.0120.4340.0210.391
Soccer Field0.0580.0230.0690.0200.0610.0090.0490.0040.06880.0030.061
Collection Center0.3760.1500.3900.1170.3390.0500.1410.0140.36520.0180.351
Hydroelectric0.1260.0500.1620.0480.1400.0210.6810.0680.13180.0060.195
Publisher’s Note: MDPI stays neutral with regard to jurisdictional claims in published maps and institutional affiliations.

