Abstract
In the context of urbanization, desakota villages and towns, which feature mixed land utilization, a diversified industrial structure, and “half-city and half-town”, have gradually come into being and play a big part in impacting the development of towns and villages. As the top-down policy guidance and control play a minor role, and the bottom-up construction runs out of control, various human settlement problems, such as the waste of land resources, low energy efficiency, high carbonization, and disappearing ecological livability, stand out. The core problems confronting China in the next phase concern the rational utilization of village resources and the guidance for and control over the low-carbon development of villages and towns in the future. Based on the demand for the low-carbon development of the human settlements in desakota villages and towns, the analyzed points in this article include the correlation between the carbon emission intensity and the spatial form characteristics and other related elements in Zhejiang Province. The low-carbon construction of the desakota village-and-town communities is transformed into the spatial form structure in order to gain a better understanding of the low-carbon control elements. A correlation evaluation model is established to provide the basis for the optimization and improvement of a low-carbon construction system from multiple dimensions and perspectives, thus providing a theoretical basis and practical guidance for the future low-carbon construction of desakota villages and towns.
1. Introduction
As the urbanization in China slows down, and carbon emissions begin to reach their peak, the traditional construction mode [1] of scale expansion and “vigorous demolition and construction” has halted. The transformation and upgrading of urban and rural construction and the renewal of community construction have evolved into the current construction priorities. Driven by urbanization externally, desakota village-and-town communities have evolved into areas of intensive human mobility, frequent material exchange, industrial renewal iterations, and diverse construction activities. Meanwhile, as the top-down policy guidance and control play a minor role, and the bottom-up construction runs out of control, desakota village-and-town communities gradually become prominent habitats of high carbon. Therefore, the key to the sustainable development of desakota village-and-town communities is to accurately identify the influencing elements of carbon emissions and to build a construction system based on regional realities.
Under the context of urbanization development, desakota villages and towns, as areas where the most dramatic interaction occurs between urban and rural areas, gradually confront problems such as high-carbonization development and extensive construction. On this basis, this study was conducted to explore the spatial influencing elements related to the carbon emission intensity of desakota villages and towns, and to provide a holistic theory for the low-carbon construction system of desakota villages and towns. Desakota village-and-town communities feature multiple types, complex functions, diverse spatial forms, complex construction elements, etc. There are numerous and trivial influencing elements of the carbon emission intensity. Without the overall understanding and systematic sorting out of the relevant influencing elements of the carbon emissions in village-and-town communities, it is very hard to identify them. Based on the desakota village-and-town communities of Zhejiang Province, their spatial form features and carbon emission characteristics were explored, and the low-carbon elements were identified through the gray correlation model, with sustainable development as the basic concept. This provides a theoretical basis for the construction of a low-carbon construction system.
2. Literature Review
- (1)
- Research on desakota villages and towns
Desakota villages and towns, due to their complex system structure and extensive content coverage, have been replaced by various nouns, such as “semi-urbanization”, “peri-urbanization”, “regional unity”, and “transitional communities”, in the literature.
In the 1960s, Gottman depicted the phenomenon of the mixtures of urban and rural areas with compound land use on the east coast of the United States and believed that it would appear in other countries and regions [2]. Engels put forward [3] the concept of “urban-rural integration” for the first time in 1974, with the purpose of alleviating the contradictions between urban and rural areas that were getting worse at that time and eliminating the problems of imbalanced labor division and the uneven distribution of urban and rural populations. Friedmann [4], by studying the regional development elements and the relationship between cities and regions in the United States, concluded that the regional center would continue to be expanded under [5] the action of external power, and the desakota phenomenon might appear. In 1987, McGee, after studying urbanization-based problems in Asian developing countries, defined “desakota” as the spatial form featuring blurred boundaries between urban and rural areas, diversified industrial activities, and mixed land use. Daniel Goodkind [6] studied the population structure of China in 2002, with a focus on the migration of rural populations. Currently, urbanization and industrialization continue to see further development, and some developed countries are already in the “post-urbanization” stage. Foreign scholars pay more attention to various problems such as poor economic performance, environmental damage, poor employment, urban–rural integration, and others that occur after urbanization [7,8,9,10].
- (2)
- Research on low-carbon theory
In response to the increasingly serious environmental problems in desakota village-and-town communities, scholars and experts have discussed and researched the relevant theories and opinions and have thus provided a theoretical basis for the sustainable development and low-carbon construction of villages and towns. Metabolism and carbon cycle systems serve as important theories in the study of low carbon in villages and towns: according to the metabolism theory, a cycle system of material and energy exchange is established between the system inside villages and towns and the system outside them from the viewpoint of biological metabolism; the carbon cycle theory is formed based on the metabolism theory and the process in which carbon elements circulate between the whole village-and-town system and the outside world [11,12,13].
- (1)
- Metabolism theory: In 1965, Wolman [14] first proposed this theory, according to which the operation of cities refers to the process in which material and energy elements in the environment are transformed into products and fertilizers. This theory, rooted in the industrial era, and based on the law of the conservation of mass, mainly focuses on the material input, the internal flow, and the final discharge in the region. From the perspective of the metabolism theory, desakota village-and-town communities are a large, artificially created biological organism: as its internal materials and information and energy elements fail to develop in a coordinated manner, a series of environmental problems arise; when an organic coordination occurs in the main core systems of the village-and-town communities, the three subsystems of supply, demand, and waste see an overall balanced state of development. Thus, sustainable development within village-and-town communities is realized.
- (2)
- Carbon cycle theory: In 1997, Nakazawu [15] first proposed a global carbon cycle model, containing two main components: the atmosphere and the biosphere. Fang Jingyun et al. [16] later refined the components of the inland ecology of the biosphere in this model. The circulation of carbon elements in the ecosphere as a whole is considered in these studies, while there is a lack of description of human activities. Therefore, such a model can rarely be applied to urban or rural systems with intensive human activities. With regard to this problem, Qian Jie [17] constructed a carbon-source–sink model with Shanghai as an example, as well as conducting a quantitative measurement analysis; Zhang Wang et al. [18] proposed that urban components, such as population, industry, buildings, transportation, and green space, should be used as the carriers of the carbon cycle system. A qualitative description is established according to the changes in land patterns, so as to clarify the urban forms and low-carbon development types. The study on the carbon cycle system of a whole city facilitates an understanding of the carbon cycle process of the whole ecosystem and provides a relevant theoretical basis for the construction of the carbon cycle system of the desakota village-and-town communities.
- (3)
- Study on the correlation between spatial forms and carbon emission intensity.
The analysis of the correlation between spatial forms and carbon emissions matters to the quantitative research on the influencing elements of carbon emissions. Two main perspectives are involved here: one is to conduct a top-to-bottom study on the changes in demographic structure, income, industrial structure, architectural style, and other indicators amid urbanization under the support of geography, statistics, urban and rural planning, and regional economics; the other is to conduct a bottom-to-top study on the correlation between spatial morphology and energy consumption based on architecture, typology, and urban morphology.
In many studies, qualitative descriptions and quantitative analyses are used to basically prove that spatial forms significantly impact carbon emissions, but there are differences in the model and variable selection, as shown in Table 1.

Table 1.
Study on the correlation between spatial forms and carbon emissions.
It is found from the literature that there are many qualitative descriptions and quantitative analyses on how to control traffic carbon emissions. However, there is still a lack of empirical and theoretical research on the correlation between specific spatial form elements and carbon emissions. With regard to this problem, a correlation evaluation model of carbon emissions and spatial form was established with 12 desakota villages and towns in Zhejiang Province as examples. Concrete practical strategies are put forward for low-carbon construction. The methodological framework of our research is shown in Figure 1.
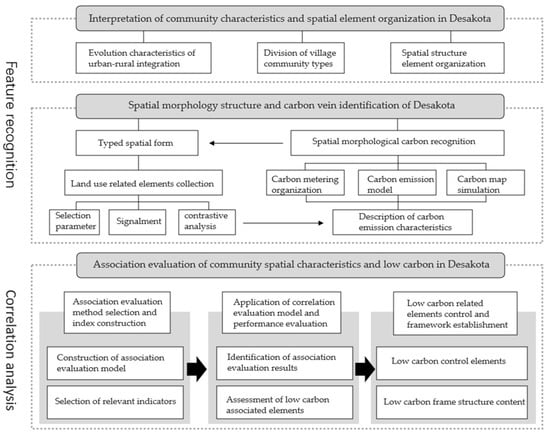
Figure 1.
The methodological framework.
3. Selection of Typical Samples
3.1. Sample Selection
In this article, 12 desakota villages and towns in Zhejiang Province were selected and investigated as the research samples. Their spatial form, carbon emissions, carbon sink, and other aspects are described and analyzed. Based on the conclusions, strategies and suggestions for the low-carbon construction and development of desakota villages and towns in the future are proposed.
Located on the southeast coast of China, Zhejiang Province is at the core of the Yangtze River Delta. There are 11 cities, including Hangzhou, Shaoxing, and Huzhou in Zhejiang. It is inclined from the southwest to the northeast in terms of the terrain. The complex terrain elements consist of plains, hills, basins, mountains, and islands. The climate here is a subtropical monsoon humid climate. In 2019, the GDP here reached CNY 6.2352 trillion, ranking fourth in the country. The GDP here from the secondary and tertiary industries accounts for 96.5% of the total. There are 58.5 million permanent residents, among which the urban population accounts for 70.0% of the total, an increase of 20.2% compared with that in 2000. In terms of the employment structure, those working in the secondary and tertiary industries account for 88.6% of the total. Remarkable characteristics are demonstrated in terms of the population, economic development, and industrial structure [27,28,29].
Rural areas with excellent conditions (coastal areas or surrounding areas of big cities) in Zhejiang Province have witnessed rapid economic development, fast expansion of non-agricultural industries, gradual transformation of land, a highly non-agricultural employment structure, and an industrial structure. The characteristics of urban areas are shown in these rural areas. While under the influence of the rural systems, land utilization, and administrative policies, the rural characteristics are still presented in terms of the spatial form here; that is, desakota villages and towns have come into being. The rapid economic development and the transformation of the industrial structure have led to the continuous transfer of high-carbon urban functions to desakota villages and towns, a gradual increase in carbon emissions and energy consumption, the occupation of farmland landscapes, and an unbalanced structure of human settlements.
As one of the keys to the development and construction of Zhejiang Province, desakota villages and towns have become the key to promoting the free flow and reorganization of urban and rural elements, as well as an experimental field for future desakota development. Desakota village-and-town communities at different development stages provide a certain range of samples for comparative study and analysis. Meanwhile, as the pioneer of various construction activities, desakota village-and-town communities have laid a good foundation for the application of low-carbon construction systems in these communities.
In this article, 12 research samples were selected (see Table 2), including desakota village-and-town communities (with administrative villages and organic towns as units) in Hangzhou, Jiaxing, Shaoxing, and other cities. Rural communities in urban areas, such as urban villages, were not taken into account due to their special geographical location and other elements. On the basis of the principles of demonstration, representativeness, and diversity, relatively independent rural communities in geographical space were selected as samples to present the differences in the spatial forms of the desakota village-and-town communities in different stages under the context of urbanization and to reflect the characteristics of life, production, and regional culture of the desakota village-and-town communities in Zhejiang Province. Due to the limited data and personal time, it is hoped that the general situations and characteristics of village-and-town communities at all stages of urbanization can be reflected as much as possible in this article. However, personal subjectivity cannot be avoided in the sample selection.
Table 2.
Basic information on the samples of village-and-town communities.
Based on the classification criteria of different types of desakota villages and towns, four desakota village-and-town communities of similar population size, economic status, and community scale were selected for research and analysis as samples from three types: the industry-led type, the trade-led type, and the tourism-led type.
3.2. Identification of Form Elements of Desakota Village-and-Town Communities
The spatial form of the village-and-town communities is presented as a material entity with the evolution of urban–rural integration. It has also been the basis of life and social interactions for a long time, and there are certain correlations between its internal elements. In the second chapter, the relationship between the elements is briefly explained via qualitative analysis, but the impact of the urban–rural integration characteristics and spatial form on carbon emissions is not described and interpreted through accurate quantitative analysis. Therefore, in this article, the characteristics of the external geometry and urban–rural integration status of the village-and-town communities are presented via quantitative analysis by screening the measure parameters of the spatial form and urban–rural integration degree for the 12 sample village-and-town communities. On this basis, it is hoped that the spatial distribution status of the relevant elements of the village-and-town communities, as well as the relevant form characteristics, can be obtained [30].
3.2.1. Parameter Selection
- (1)
- Measure parameters of spatial form
The main characteristics of the measure parameters of the spatial form constitute the use scale of various elements in village-and-town communities, the organizational structure, and the development intensity of land utilization and reflect the boundary characteristics and main control elements of village-and-town communities. A reasonable and efficient spatial form is conducive to the orderly operation of the village-and-town community itself, on the one hand, and serves as a requirement for low-carbon development, on the other hand. The main indicators involve the total area of construction land (), the average homestead coverage rate (), the homestead coverage rate (), the facility coverage (), and the population density ().
- (a)
- Total area of construction land ()
For the measurement of the total area of construction land, the boundary of the built environment of village-and-town communities needs to be clarified first; that is, it is connected by the boundaries of building units (entities), and it is formed by the boundaries of the transition area between the units. Among them, the boundaries of the transition area determine the size of the overall boundary [31].
In this study, the maximum spanning distance of 30 m was used as the transition area boundary distance to delimit the boundaries between village-and-town communities via Pu Xincheng’s method of plane quantification of rural settlements; thus, the total area of construction land was obtained. This measurement indicator is different from the total area land of the village-and-town communities, which includes non-construction land such as agricultural, forestry, and farming land, meaning that the actual value will be larger than the value of the total area of construction land (Figure 2).
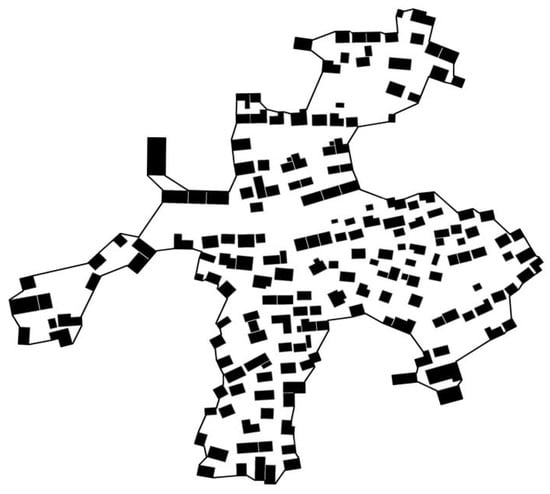
Figure 2.
Example of boundary area of construction land.
- (b)
- Average homestead area ()
The homestead area is composed of two parts: the area of the main house and that of the entrance. The area of the main house mainly refers to the building construction area of the main function; the entrance part involves the courtyard before the homestead and behind the house. The average homestead area represents the degree of land utilization by individual households. When the number of living households is n, the specific formula is as follows:
where represents the area of each homestead.
- (c)
- Homestead coverage rate (h_density)
The homestead coverage rate indicates the overall relationship between the residential buildings and the environmental space of village-and-town communities and reveals the land utilization of the households in the village-and-town communities. It is obtained from the ratio of the sum of each household’s area () to the total area of construction land (). The specific formula is as follows:
- (d)
- Facility coverage (p_density)
The facilities mainly include community buildings and industrial buildings. The community buildings are mainly the places where the residents in village-and-town communities live and enjoy entertainment, while the industrial buildings mainly serve as the places where the production activities of the households are carried out. Facility coverage symbolizes the overall relationship between the supporting facilities (buildings) and the environmental space of village-and-town communities. To a certain extent, it reveals the production and living situations of households in village-and-town communities. The specific formula is as follows:
where means the area of the building base of each facility.
- (e)
- Population density (pp_density)
Population density indicates the population concentration degree of the unit construction land area, which is one of the indicators used to judge and measure the spatial capacity of land in village-and-town communities. The formula is as follows:
- (2)
- Urban–rural integration measurement
The urban–rural integration measurement mainly shows the degree of urban–rural integration development and the development stage of village-and-town communities under the context of urbanization. Here, the main indicators are people integration, land integration, and capital integration. In this article, the form characteristics of desakota villages and towns are mainly studied; so, the main measure parameters include the land use blending degree (), the urban–rural landscape mixing degree (), and the non-agriculturalization rate (n_rate).
- (a)
- Land use blending degree ()
The land use blending degree illustrates the complexity of land use in village-and-town communities under the context of rural–urban integration. Lands in village-and-town communities refer to state-owned land and collective land. In this article, the floor area of the physical buildings is calculated, excluding external environmental spaces such as hilly land. The land use blending degree reflects the land use pattern characteristics and stages of village-and-town communities in the evolutionary process of urban–rural integration. The specific formula is as follows:
In the formula of , represents the land use blending degree; is defined by the ratio of the area of state-owned land to that of collective land in village-and-town communities (low value divided by high value); represents the area of state-owned land; and symbolizes the area of collective land. The larger the , the higher the land use blending degree of village-and-town communities. If the area of state-owned or collective land is 0, is 0.
- (b)
- Urban–rural landscape mixing degree ()
The urban–rural landscape mixing degree indicates the changes in architectural appearances in village-and-town communities under the context of urban–rural integration. Amid urban–rural integration, there are bound to be reconstructed or newly built architectural landscapes in villages and towns. The landscapes of village-and-town communities are classified based on field research and satellite remote sensing images. The urban–rural landscape mixing degree reflects the degree of changes and overall characteristics of village-and-town communities in the evolutionary process of urban–rural integration. The formula is as follows:
In the formula of , represents the urban–rural landscape mixing degree; refers to the ratio of the area of urban scenic buildings to that of rural scenic buildings in village-and-town communities (low value divided by high value); refers to the area of urban scenic buildings; and represents the area of rural scenic buildings. If the area of the urban scenic buildings or that of the rural scenic buildings is 0, is 0.
- (c)
- Non-agriculturalization rate (n_rate)
The non-agriculturalization rate means the proportion of the non-agriculturalized population to the total population. As desakota village-and-town communities are dominated by secondary and tertiary industries, the non-agriculturalization rate can reflect the characteristics of urban–rural integration to a certain extent. The specific formula is as follows:
3.2.2. Characteristic Description
According to the formulas of the above measure parameters, the relevant indicators of each sample village-and-town community were calculated statistically. The obtained results are shown in Table 3, Table 4 and Table 5.
Table 3.
Identification description of the measure parameters of the industry-led village-and-town communities.
Table 4.
Identification description of the measure parameters of the village-and-town communities of the trade-led type.
Table 5.
Identification description of the measure parameters of village-and-town communities of the tourism-led type.
3.2.3. Comparative Analysis
The values of the measure parameters of the 12 samples were transformed into dimensionless standard scores (Z-scores). Then, they were sequenced and graded according to the values. A higher grade means a higher original value. Similarly, a lower grade represents a lower original value. They are presented in the form of radar diagrams for the convenience of research analysis (Table 6). Therefore, the form structure and element organization were compared and analyzed to comment on, interpret, and explore the inner factors based on the measure parameters of the spatial form and urban–rural integration measurement of each indicator value.
Table 6.
Radar diagrams of characteristic parameters of village community samples.
It was found from the measure parameters of the spatial forms that distinct differences exist between the total land use and the total individual use for village-and-town communities of different types. The total area of construction land (Z1), symbolizing the total amount of land use, is impacted by the topography and terrain to a certain extent. For example, Jingwu Village in Anji County, Huzhou, which is impacted by the surrounding mountains, has a small total area of construction land available (Z1 = 129,133 m2). Meanwhile, Xiawan Village in Yiwu City, located in an open plain, has a larger total area of construction land available (Z1 = 129,133 m2) due to the expansion at the horizontal level. There are different needs and adjustments for the spatial form, industrial structure, functional arrangement, and other elements of the village-and-town communities in terms of the difference in the total land use scales. The needs can be analyzed and compared based on other measurement indicators. Additionally, it was found from the comparative analysis of the radar diagrams that the average homestead area (Z2) of the village-and-town communities of the tourism-led type is bigger than that of the village-and-town communities of the other two types. This is because there are external business activities in B&Bs or farmhouses in most villages and towns of the tourism-led type. A large number of tourists need to be accommodated; at the same time, a comfortable quality of life needs to be ensured. The indicator of average homestead area (Z2) is inversely related to population density (Z5). Generally speaking, a greater number of people accommodated within the village-and-town communities represents a smaller average homestead area.
The indicators of the measure parameters of the spatial form reflecting the homestead coverage rate (Z3) and facility coverage (Z4) are more related to the industry type of the village-and-town communities. It was found from the radar diagrams that the village-and-town communities of the industry-led type and those of the tourism-led type have distinctive features. The village-and-town communities of the industry-led type, under the influence of industrialization, accommodate individual enterprises of multiple types in the villages and towns. The scale of land utilization is large, and part of the collective construction land is transformed. Within the community, the production space therefore becomes larger, and the facility coverage becomes higher. For example, in Dushantou Village, Anji County, where the industrial economy started earlier, there have been 54 private enterprises. The facility coverage reaches a high percentage of 0.35. In the village-and-town communities of the tourism-led type that rely on the surrounding natural and humanistic landscape resources, the tourists tend to be provided with a comfortable living environment and good spatial quality. Therefore, the homestead coverage rate is high. For example, the homestead coverage rate of Tongwu Village in Hangzhou City is 0.46; as the village-and-town communities of the tourism-led type need to have a good natural and humanistic landscape as the basis of physical resources, they aspire to improve the living quality of the communities by establishing entertainment and leisure spaces such as reception centers, landscape squares, and resting places. The facility coverage also occupies a certain proportion. For example, the facility coverage of Jingwu Village, Anji County, is 0.16. The village-and-town communities of the trade-led type are less likely to be correlated with these two indicators. For example, e-business thrives in Bainiu Village in Lin’an District (Z4 = 0.12) and Xiawan Village in Yiwu City (Z4 = 0.06). Their main production sites are located between the residences; so, the facility coverage in these two villages is low; meanwhile, the real economy thrives in Yima Village, Tongxiang City (Z4 = 0.16), and Caijiafan Village, Zhuji City (Z4 = 0.23). There is a certain number of operated enterprises, and the facility coverage is high.
It should be noted that under the same homestead coverage rate (Z3), the spatial forms and the degrees of factor aggregation presented by the village-and-town communities are not the same (Figure 3). For example, the spatial texture of Xiawan Village, Yiwu City (Z3 = 0.41), is a mechanical barrack-style arrangement, a result of top-down planning and construction in the urbanization process. There is a lack of relationship elements connecting the links between the preceding and the following at the intermediate levels and the hierarchical order divisions at the same levels. In contrast, some village-and-town communities following the top-down development pattern, such as Jingwu Village, Anji County (Z3 = 0.40), have the scale of hierarchical levels of traditional villages. The spatial structure relationship between elements of each level presents a rich and complex spatial texture. Different spatial forms need to be guided by different low-carbon construction patterns so as to promote the orderly and efficient development of village-and-town communities.
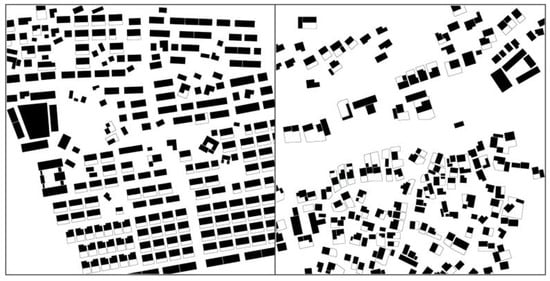
Figure 3.
Comparison between Xiawan Village (left) and Jingwu Village (right) (same ratio scale).
The homestead coverage rate (Z3), facility coverage (Z4), and population density (Z5) can be used as the characterization elements of spatial form, but they cannot fully reflect the relationship between the spatial form structure and the texture of the desakota village-and-town communities under the process of urbanization. The urban–rural integration measurement should be considered here for further observation and analysis.
The non-agriculturalization rate (Z8) can directly reflect the number of those engaged in non-agricultural activities. It was found from the radar diagrams that the non-agriculturalization rate of the village-and-town communities of the tourism-led type is low because of (to a certain degree) the cyclical nature of the tourism industry: during the tourist off-season, the residents of village-and-town communities engage in some agricultural activities to earn income. It can be observed from the values of the characteristic parameters that although the non-agriculturalization rate is higher in the village-and-town communities of the industry-led and trade-led types, there are still people engaged in agricultural activities. This is one of the characteristics of the desakota village-and-town communities.
In terms of the measure parameter values of the land use blending degree (Z6) and the urban–rural landscape mixing degree (Z7), there is a certain amount of land use blending and urban–rural landscape mixing in the desakota village-and-town communities of each type. It was generally found from the homestead coverage rate (Z3) and facility coverage (Z4) that the land use blending degree and the urban–rural landscape mixing degree impact facility coverage to some extent. This is essentially because a higher degree of land use blending indicates a more complex type and structure of land within the village-and-town communities. Generally speaking, in village-and-town communities, state-owned land is more likely to boost industrial development and cultural prosperity and have functions of production and recreation, i.e., the facility coverage is higher; meanwhile, the urban–rural landscape mixing degree indicates the mixing degree of the landscape within the village-and-town communities. A higher mixing degree represents a more mixed form of urban–rural scenic buildings. The urban landscape area is also dominated by industrial buildings, cultural buildings, entertainment buildings, and other functional buildings. Possibly, the guidance of top-down planning and construction brings the renewal and upgrading of landscapes with a residential function. Xiawan Village in Yiwu City can be taken as an example.
The mixture of land use and urban–rural landscapes occurs fundamentally because desakota village-and-town communities are still in the transitional stage of urbanization, and the residents’ deagriculturalization has not yet been completed. Here, deagriculturalization relates not only to industry, but also to the economy, identity, culture, etc. The magnitude of the two values indicates, to a certain extent, the stage and characteristics of the village-and-town communities amid urbanization.
4. Model Set-Up
4.1. Construction of Carbon Measurement Model for Desakota Village-and-Town Communities
4.1.1. Organizational Structure of Carbon Measurement
Previous carbon measurement was mainly based on the data of the energy sectors. According to the study results, the adjustment of industrial strategies, the application of low-carbon technologies, and the development of energy types are mainly emphasized. Land utilization elements and spatial form elements are not included in this study; therefore, they cannot facilitate the development of village-and-town communities. Amid urbanization, the original single village-and-town community system has gradually changed. Social life, the economic industry, the spatial form, and the natural environment become the key elements impacting carbon emissions, and the related measurement needs to be carried out urgently.
Based on the element organization of spatial forms, the value of the carbon emissions is measured to reflect the level of energy activities in different spatial elements. Specifically, five parts are involved here: carbon basis (C1), carbon boundary (C2), carbon group (C3), carbon node (C4), and carbon corridor (C5) (Table 7). Carbon basis and carbon node mainly refer to the amount of carbon sequestration and storage by the natural environment and the artificial green land within the village-and-town communities; carbon boundary involves the amount of carbon elimination by green land and the emission value of the carbon sequestration of the construction land used for stores along the street; carbon group mainly covers the carbon accounting of the building functional units under the face area form of the village-and-town communities, including the accounting of carbon emissions generated by house groups, industrial buildings, public buildings, supporting buildings, and others amid the production activities and the residents’ daily life. Carbon emissions mainly involve the transportation land in village-and-town communities, specifically reflecting the value of the transportation level during the residents’ life and their daily activities.
Table 7.
Classification of carbon structure elements and energy composition.
The carbon emission values of the village-and-town communities are related to the values reflecting the level of energy consumption activities in the region. In terms of the carbon measurement, the accounting method based on the energy consumption amount is most suitable for village-and-town communities. It is easy to obtain the relevant basic data. In this study, the scope of measurement was defined mainly for carbon emissions from production activities, mobile carbon sources, and natural carbon in fixed carbon sources.
4.1.2. Establishment of Carbon Emission Model
- Carbon emission calculation model
Carbon emissions are composed of carbon emissions and carbon sinks; so, the emissions from carbon sources and carbon sinks in the desakota village-and-town communities should be calculated separately.
- (1)
- Calculation model of carbon source emissions
In May 2019, the “2006 IPCC Guidelines for National Greenhouse Gas Inventories 2019 Revision” were adopted by the IPCC (Intergovernmental Panel on Climate Change of the UN). Here, the concept of deducing greenhouse gas emissions based on atmospheric concentrations (remote sensing measurements and measurements of base stations on the ground) was proposed, thus validating the traditional bottom-up measurement through inventories. This method is accurate, but it has limitations: the large workload, the high cost of equipment, and the fact that base stations have not yet been established in villages and communities. In this article, the 2006 IPCC Guidelines for National Greenhouse Gas Inventories (2006 Guidelines for Inventories for short) [32] were used. The accounting method of traditional GHG emissions proposed in the 2006 Guidelines for Inventories is mainly obtained through the calculation of the activity data and the energy consumption emission coefficient (emission factors). It can be expressed as Equation (8):
where E represents greenhouse gas emissions; AD is the activity data; and EF is the energy consumption emission coefficient. Here, the greenhouse gas emissions generated by the activities in the village-and-town communities are quantified by the activity data, such as energy activities, industrial and agricultural production, and waste disposal. Considering the variability caused by subjective perceptions in the selection process of the activity data, the activity data in the actual calculation process are converted into a relatively unified “physical unit activity level quantity”, i.e., the standard coal data method. Then, the actual carbon emissions are calculated based on the carbon emission conversion factor of standard coal, as shown in Equation (9):
where represents the value of the total carbon dioxide emissions; i is the ith energy; is the energy use amount of standard coal; and is the ith emission factor coefficient of energy consumption. Here, energy mainly includes coal, coke, gasoline, diesel, gas, firewood, electricity, and gas.
The activity data (energy consumption values) of the energy of all types are mainly obtained from field sampling surveys, relevant energy statistics websites, and the Survey Yearbook for China’s Rural Households. In the field survey, the abstract energy consumption values are converted into visual parameters such as cost (e.g., annual gasoline cost) and weight (e.g., annual coal use amount) to facilitate the understanding of the residents in village-and-town communities. The formulas for converting these visual parameters into CO2 emissions are listed in Table 8. Due to the shortage of time and effort, the field survey was conducted mainly based on the standard range selected for each sample village and town. Its spatial boundary and scale issues are considered [33].
Table 8.
Formula for converting energy consumption values into CO2 emissions.
The emission factor coefficient of each type of energy varies in different countries and regions under different technological levels. The emission factor coefficient of each type of energy required in this study was obtained after the comparison with and reference to the 2006 Guidelines for Inventories, the People’s Republic of China National Greenhouse Gas Inventory (2007), the Guidelines for Provincial Greenhouse Gas Inventory Compilation (for Trial Implementation) (2011), China’s Low Carbon Development Report (2014), and related literature (Table 9). The emission factor coefficient of power-based carbon was determined with reference to the regional baseline emission factor of the power grid from the Department of Response to Climate Change, National Development and Reform Commission of China; Zhejiang belongs to the regional power grid of East China, and the power emission factor there is 0.81 tCO2/MWh, that is, 0.81 × 10⁻³ tCO2/KWh.
Table 9.
Values of energy emission factors (unit CO2/tce).
- (2)
- Calculation model of carbon sink absorption
The carbon sink absorption value is mainly calculated by the area of carbon sink land of various types and the carbon sink coefficient of the carbon sink land, as shown in Equation (10):
where represents the total absorption value of carbon dioxide; i is the carbon sink land of the ith type; is the area of the carbon sink site of the ith type; and refers to the carbon sink coefficient of the carbon sink land of the ith type. Here, the main types of carbon sink land include woodland, wetland, grassland, and cropland. The carbon sink coefficients vary under the influence of the topography, the species environmental conditions, etc. Therefore, via the summarization and screening of the existing carbon sink-related studies, the carbon sink coefficients of the carbon sink land of the various types required in this study were obtained (Table 10).
Table 10.
Carbon sink coefficient values of carbon sink land.
In summary, the total CO2 emissions of the village-and-town communities is calculated using Equation (11):
- 2.
- Accounting model of carbon emissions
The accounting model of carbon emissions refers to the conversion of energy consumption values into the accounting method, where the land utilization model plays a leading role based on spatial form elements, as shown in Formula (12).
Via the calculation of the values of energy consumption or absorption for land utilization of various types in village-and-town communities, the carbon emission values of each spatial form element can be obtained. This facilitates the generation of the simulation of the carbon map of the village-and-town communities (e.g., Figure 4). The research and analysis are intuitively conducted to provide certain guidance on the land utilization, spatial form, and behavioral activities in the village-and-town communities.
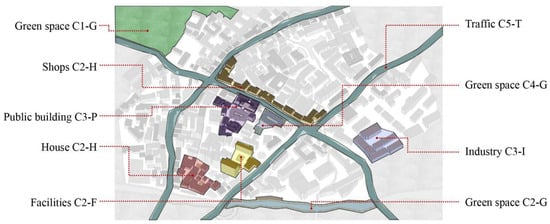
Figure 4.
Sample graph of spatial form elements of carbon emissions.
4.1.3. Schematic Simulation of Carbon Map
Mapping is a systematic methodology, according to which graphical thinking is used to summarize, abstract, and generalize complex phenomena or processes. On the basis of GIS technology, a carbon map is used to analyze the spatial form of carbon emissions and related issues within the village-and-town communities via quantitative spatial forms and information schemas. Through the simulation of carbon maps, the corresponding carbon emission information is integrated and presented, facilitating the optimization and adjustment of the elements related to carbon emissions in land utilization, spatial elements, and other elements in the village-and-town communities.
The process of carbon map generation in villages and towns is as follows: (1) the carbon emissions and carbon sink values of the various spatial elements in the sample villages and towns were calculated via the calculation formula in Section 4.1.2. in order to ensure that the corresponding database can be established. (2) The most appropriate classification of the calculated data was established so as to ensure that the maximum difference is presented in each category. In this study, the “Natural Breaks” method was adopted to classify the values of the carbon emissions and carbon sinks. The carbon emission data were divided into four sections: I, II, III, and IV. Here, “I” means the section of low carbon emissions, and “IV” represents the section of high carbon emissions. The carbon sink data were divided into two categories: high-carbon-sink area and low-carbon-sink area. In the GIS software, color blocks of different shades were used to mark the carbon values of the spatial elements in the village-and-town communities, thus producing the carbon map of the sample village-and-town communities. Finally, the carbon map simulation of all the samples was obtained (Table 11).
Table 11.
Carbon maps of the sample village-and-town communities.
4.2. Selection of Correlation Evaluation Method of Low-Carbon and Indicator Construction
The influencing factors of carbon emission intensity in the desakota village-and-town communities have their specific regional characteristics and are often impacted by many aspects, such as economic development, population density, and spatial form. However, the degree of influence of these relevant factors on carbon emission intensity cannot be quantitatively presented; therefore, it can be analyzed as a gray system [34]. Gray relational analysis, as a type of analysis method of gray system theory, depicts the correlation between factors by gray relevance ranking and emphasizes the relevance ranking among factors. Moreover, gray system theory has the characteristic of dealing with multi-factor and non-linear problems. It goes beyond the limitation of the sample size. Therefore, gray relational analysis was adopted in this article to analyze the factors influencing carbon emissions in the desakota village-and-town communities and to rank the influence degree of each factor.
4.2.1. Establishment of Gray Relational Model
The gray relational analysis method is mainly used for the quantitative analysis of correlations between multiple factors. The higher the value of the correlation, the higher the correlation between factors. First of all, the correlation characteristic sequence and correlation comparison sequence need to be classified. is set as the correlation characteristic sequence; is set as the correlation comparison sequence. Here, i = 1, 2, , m. On this basis, the incidence coefficient is calculated as
Here,
In the formula of , represents the incidence coefficient between the ith indicator of the kth item and . represents the original data of the ith indicator in the kth item. Considering the magnitude difference in the original data, it is necessary to standardize the indicator data. represents the standardized data. is the mean value of all the data of this indicator. is the identification coefficient, which is used to improve the significance of the difference between the incidence coefficients and weaken the influence of the extreme value on the calculated results. Generally, is equal to 0.5. The final correlation is obtained by finding the mean value of the incidence coefficients.
In
represents the correlation between and the ith indicator.
4.2.2. Selection of Relevant Indicator Elements
According to the preliminary analysis of the influence factors of the carbon emission intensity, the factors that have a certain influence on the carbon emissions of desakota village-and-town communities can be integrated into the correlation comparison sequence. The degree of correlation between desakota village-and-town communities and the relevant factors is measured by the gray correlation model; thus, the priorities of the desakota village-and-town communities in terms of the control over the carbon emission intensity are identified, and a basis is provided for the development of low-carbon construction in the village-and-town communities.
In this article, the relevant influence indicators of carbon emission intensity in the village-and-town communities were studied. These indicators specifically include three major categories: comprehensive information indicators, spatial morphology indicators, and urban–rural integration indicators (Table 12).
Table 12.
Indicators of correlation comparison sequence.
- (1)
- The comprehensive information indicators mainly reflect some of the basic information on the desakota village-and-town communities, including the GDP per capita, the population density, and the energy intensity. Based on the analysis of the correlation between the comprehensive information elements and the carbon emissions, the influence of the development level of the village-and-town communities and the energy efficiency can be judged; thus, the overall development direction of the village-and-town communities can be guided and optimized.
- (2)
- The spatial morphology indicators mainly reflect the spatial form characteristics of the desakota village-and-town communities, including the scale of relevant elements, the land use structure, and the development intensity of the land. The indicators include construction land area, average homestead area, homestead coverage rate, and facility coverage. Via the analysis of the correlation between the spatial form elements and the carbon emissions, the impact of the spatial form composition on the carbon emissions of the village-and-town communities is clarified and thus provides theoretical guidance in the process of the low-carbon construction and development of the desakota village-and-town communities.
- (3)
- The urban–rural integration indicators mainly reflect the degree and stage of urban–rural integration in the desakota village-and-town communities. The main indicators involved are the non-agriculturalization rate, the land use blending degree, the and urban–rural landscape mixing degree. The correlation between the urban–rural integration elements and the carbon emissions mainly indicates the influence of the urban–rural integration degree on carbon emissions amid urbanization. Such an analysis provides a theoretical basis for the future low-carbon development of the desakota village-and-town communities.
5. Results
5.1. Description of Carbon Emission Characteristics of Desakota Village-and-Town Communities
5.1.1. Spatial Typology
In the urbanization process, desakota village-and-town communities are influenced by both top-down construction guidance and bottom-up agglomeration development. Different spatial form characteristics are presented based on industries of different types in terms of the carbon emission intensity. It was found from the simulated carbon map of each sample village and town in Table 11 that three spatial forms are presented in the distribution of the high-carbon spots: cluster pattern, scattered pattern, and balanced pattern.
The high-carbon spots in the village-and-town communities of the industry-led type are distributed in a clumped style of spatial form. Based on the advantages of the industrial economy and geographic conditions, the manufacturing and processing industries, as well as other secondary industries, are vigorously developed with raw material production and processing as the core. The carbon emissions mainly originate from the energy consumption from enterprise production and individual living. The high-carbon points are mainly distributed in the industrial clusters. For example, in Gaoping Village in Yuecheng District, the carbon map shows that the high-carbon points are collectively distributed in the upper-right industrial group area, where the production and processing enterprises play a big part. The annual carbon emissions of the element unit of the local industrial group are even higher than 1213 tCO2. It was found from the analysis of the carbon maps that the high-carbon points in the village-and-town communities of the industry-led type are clustered in clumps and mainly located in the industry group area; although the carbon corridor elements are in the range of level II, relatively speaking, the carbon emissions here account for a certain proportion of the total carbon emissions due to the transportation activities of the enterprises in the village-and-town communities, to a large degree. Most village-and-town communities of the industry-led type are located in the open plain areas. The development and construction of secondary industries have encroached on the original landscape farmland areas of the villages and towns, resulting in a reduction in the area of carbon sink land in the villages and towns, and a decline in the overall environmental spatial quality in the communities.
The high-carbon points in the village-and-town communities of the trade-led type are distributed in a scattered spatial pattern. Based on the advantages of a good regional economic performance and great transportation conditions, physical trade and e-businesses, as well as other tertiary industries, are vigorously developed in such village-and-town communities. The carbon is mainly emitted through transportation energy consumption, industrial energy consumption, and individual energy consumption. For example, in two e-business villages, Bainiu Village in Lin’an District and Xiawan Village in Yiwu City, the carbon is mainly emitted from family business activities. The local high-carbon points are generated mainly because of the storage and logistics places within the village-and-town communities, as well as the individual enterprises for commodity processing. Meanwhile, in Yima Village in Tongxiang City and Caijiafan Village in Zhuji City, two villages where physical trade is at the core of the industry, the high-carbon points are presented in a typical scattered pattern. On the one hand, they are influenced by some individual enterprises within the village and town; on the other hand, there is a family workshop model for the community residents. For example, most families in Yima Village are equipped with home textile machines. Trade is carried out through the self-operation mode or the mode of centralized sales. Under the influence of transportation conditions and business interfaces, the high-carbon points in the village-and-town communities of the industry-led type are also distributed in the buildings along the street in the boundary elements. The element of the carbon corridors of village-and-town communities is one of the elements that contribute to high carbon emissions due to the frequent traffic behaviors such as trade and transportation. Additionally, the scale of the carbon sink land varies in the different topographies and terrains in which the village-and-town communities are located; thus, the absorption value of the carbon sinks is impacted. For example, the woodland around Bainiu Village and Caijiafan Village provides a large amount of carbon sink land for the village-and-town communities, therefore regulating the internal carbon cycle system to a certain extent.
The high-carbon points in the village-and-town communities are not obvious, and the overall carbon emissions are distributed in a balanced manner. Through the advantages of the humanistic characteristics and landscape resources, tertiary industries with service and tourism as the core, such as B&Bs and farmhouses, are vigorously developed in such village-and-town communities. Here, the carbon is mainly emitted from residential energy consumption and transportation energy consumption, among others. The carbon emissions of B&Bs or farmhouses that the farmers build and operate themselves are higher than those of the daily residential groups. However, there is no big difference between these two in general, and the overall carbon emissions are distributed in a balanced spatial pattern. However, under the influence of resource distribution and a landscape environment, these groups with higher carbon emissions are mostly clustered in the places where the transportation is convenient or the environment is superior. Their industrial characteristics lead to a higher carbon emission of the element of carbon corridors in village-and-town communities. This is one of the high-carbon elements in the village-and-town communities. Compared with the desakota village-and-town communities of the other two types, the village-and-town communities of the tourism-led type have a high carbon sink value. This is inextricably linked to the industry type they depend on.
5.1.2. Temporal Periodization
It was found from the statistics of the carbon emission data for each village community sample (Figure 5) that a cyclical variation occurs in terms of carbon emissions over time. It can be seen from the figure that the carbon emission changes in spring and autumn are stable, while such changes in summer and winter are volatile. The temporal periodization of carbon emissions occurs in village-and-town communities due to various factors. It occurs due to the hot summer and cold winter climate of Zhejiang Province, on the one hand, and the industrial activities in the village-and-town communities of each type, on the other hand.
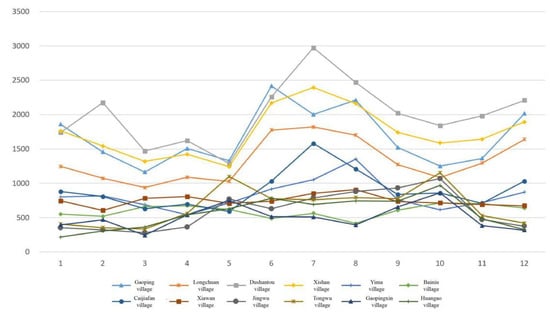
Figure 5.
Seasonal variation in carbon emissions (tCO2/month) in the monthly cycle of the samples.
The total carbon emission value of the village-and-town communities of the industry-led type is higher than that of the other two types. In addition, the overall carbon emissions fluctuate more sharply with seasonal changes. Carbon is emitted mainly from the industrial activities of the manufacturing industry and processing industry. There are some fluctuations because of the industrial characteristics of the carbon emissions. For example, in Dushantou Village in Anji County, the village-and-town communities mainly earn income through the bamboo product processing industry. Bamboo product processing activities thrive throughout the year. However, there are obvious fluctuations in carbon emissions due to the increase in the number of production orders in summer and winter. Moreover, the differences in the types of industries and the levels of production activities accommodated in the village-and-town communities also lead to a large difference in overall carbon emissions. For example, the number of enterprises in Longchuan Village is half of the number of village-and-town enterprises in Dushantou Village.
The carbon emissions of the village-and-town communities of the trade-led type are relatively stable. Carbon is emitted mainly from transportation energy consumption and production energy consumption brought by the industrial activities. In the village-and-town communities that depend on physical trade, carbon is obviously emitted in a regular manner. Carbon in these communities is mainly emitted in the market period or the period of trade demand growth. In addition, some residents of such village-and-town communities are engaged in manufacturing or processing production activities at home. For example, most residents of Yima Village in Tongxiang City have home textile machines, which are also one of the carbon emission sources in village-and-town communities. In the village-and-town communities relying on e-business, the carbon emissions are stable and less likely to be influenced by seasons. Carbon is emitted mainly from the energy used in household production and transportation energy. The total carbon emissions in such communities are lower than those in the village-and-town communities relying on physical trade.
In the village-and-town communities of the tourism-led type, the total carbon emissions are low but are more likely to be influenced by seasonal cycles. The main industries in the village-and-town communities of the tourism-led type are B&Bs, farmhouses, and other tertiary industries with service as the core. They mainly attract tourists outside these communities and are the main influencing factors of carbon emissions in village-and-town communities. The carbon emissions mainly fluctuate due to the off and high seasons of tourism. The carbon emissions in the off season are as low as less than half of those in the high season. The high season is mainly related to holidays—summer holidays and winter holidays. During the high season, there is an explosive influx of people. Air conditioners and other instruments are needed to cool or heat the area, resulting in an increase in total carbon emissions.
5.1.3. Averaging of Carbon Emissions
By averaging carbon emissions, we can indicate the carbon emissions per capita and the carbon emissions per unit of land that are characterized by sustainable and low-carbon development, as well as reflect the level of spatial form energy consumption and the level of the carbon cycle in the village-and-town communities. It was found from the statistical survey (Figure 6) that the per capita carbon emissions of the sample village-and-town communities fluctuated slightly based on a certain value. A drastic fluctuation occurs due to the population density of communities for individual samples. However, generally speaking, the per capita carbon emissions are homogeneous. The differences in the types of industries make the carbon emissions per unit of land in the sample villages and towns vary in type; the overall carbon emissions per unit of land in the same type do not vary significantly. However, due to the limitation of the sample size, more definite results cannot be obtained. If the carbon emissions per capita are compared with the carbon emissions per unit of land, it can be seen that there is a positive correlation between these two. Such a correlation is inextricably linked to the spatial activity level of the residents in village-and-town communities.
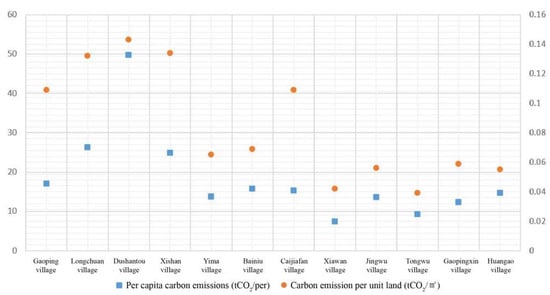
Figure 6.
Carbon emissions per capita and carbon emissions per unit of land in the samples.
5.1.4. Diversification of Elements
Via the study of the relationship between the spatial, temporal, and individual elements and carbon emissions, a simple conjecture and analysis can be established on the influencing elements related to carbon emissions in village-and-town communities.
- (1)
- The spatial form of village-and-town communities reflects the influence and association of the function and size of each group. For example, in the village-and-town communities of the industry-led type, more energy is consumed by the industrial groups. Meanwhile, the carbon emissions in the village-and-town communities of the tourism-led type are influenced, to some extent, by the area of the mansion group. However, there is not a completely positive correlation, i.e., a large area does not necessarily mean high carbon emissions.
- (2)
- The effects of temporal periodization changes reflect the differences in the industrial types and social attributes of the desakota village-and-town communities. The characteristics of the industry types, such as the B&B industry and the service industry, determine, to some extent, the values of the energy activity level, and the cyclical variation characteristics of carbon emissions in village-and-town communities.
- (3)
- The relationship between income and carbon emissions reflects the level of transformation between energy and the economy. As can be seen in Figure 7, there is a certain positive correlation between the level of per capita income and total carbon emissions, but the difference presented here is not significant. For example, in terms of the village-and-town communities of the industry-led type, the secondary industry is vigorously developed to boost the per capita income and improve residents’ living standards. Meanwhile, the huge energy consumption has also caused an increase in total carbon emissions.
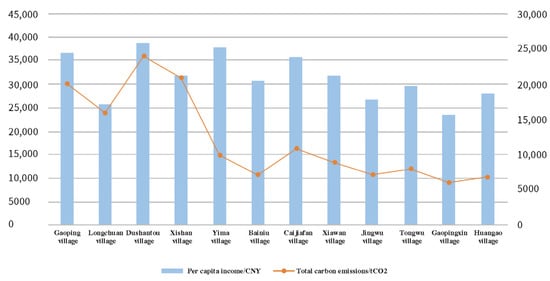 Figure 7. Annual per capita income and total carbon emissions of the sample.
 - (4)
- Within the village-and-town communities, there are imitative behaviors among residents under the influence of crowd mentality and social comparison. Some similarities are presented in the spatial forms for them. For instance, in the village-and-town communities of the tourism-led type, the areas with higher carbon emissions are often clustered in areas with convenient transportation or superior natural landscapes. This is determined by the industrial characteristics, on the one hand, and the imitation construction behavior of residents, on the other hand.
5.2. Model Application of Correlation Evaluation Performance Evaluation
5.2.1. Identification of Correlation Evaluation Results
- 1.
- Correlation evaluation process
- (1)
- The determination of the correlation characteristic sequence and the correlation comparison sequence was conducted. The carbon emissions of each sample village-and-town community were taken as the correlation characteristic sequence and recorded as ; the GDP per capita, population density, energy intensity, construction land area, and other related impact indicators were taken as the correlation comparison sequences and recorded as (). The carbon emissions and related indicators of each sample village-and-town community were calculated statistically. Then, the correlation characteristic sequence and correlation comparison sequence were processed via the dimensionless method according to Equation (14). The sequence obtained after the dimensionless treatment is shown in Table 13.
Table 13. Dimensionless sequence.
- (2)
- The incidence coefficient was calculated. The incidence coefficients of carbon emissions and 10 relevant impact indicators, such as GDP per capita, population density, energy intensity, and construction land area, were calculated based on Equation (13).
- (3)
- The correlation degree was calculated. Based on Equation (15), the correlation coefficients of the correlation characteristic sequence and the correlation comparison sequence were derived.
- 2
- Comprehensive correlation evaluation results considered as a whole
The correlation degrees of all the sample data were calculated, and Table 14 was obtained as follows. The carbon emissions in the village-and-town communities are correlated with the non-agriculturalization rate, GDP per capita, population density, construction land area per capita, homestead coverage rate, energy intensity, facility coverage, land use blending degree, average homestead coverage rate, and urban–rural landscape mixing degree (they are arranged from high to low in terms of the correlation degree).
Table 14.
Correlation between carbon emissions and each relevant influencing indicator.
- 3.
- Results of correlation evaluation of different industrial types
- (1)
- The correlation degree of the sample data in the village-and-town communities of the industry-led type was calculated, and Table 15 was obtained. Carbon emissions in such village-and-town communities are correlated with the non-agriculturalization rate, land use blending degree, facility coverage, GDP per capita, population density, construction land area per capita, homestead coverage rate, average homestead area, urban–rural landscape mixing degree, and energy intensity (they are arranged in descending order in terms of the correlation degree).
Table 15. Correlation between carbon emissions of village-and-town communities of the industry-led type and each relevant influencing indicator.
- (2)
- The correlation degrees of the sample data in the village-and-town communities of the trade-led type were calculated, and Table 16 was obtained. The carbon emissions in such village-and-town communities are correlated with the non-agriculturalization rate, GDP per capita, population density, construction land area per capita, homestead coverage rate, energy intensity, facility coverage, average homestead area, land use blending degree, and urban–rural landscape mixing degree (they are arranged in descending order in terms of the correlation degree).
Table 16. Correlations between carbon emissions and relevant influencing indicators in the village-and-town communities of the trade-led type.
- (3)
- The correlations of the sample data of the village-and-town communities of the tourism-led type were calculated, and Table 17 was obtained. The carbon emissions in such village-and-town communities are correlated with the non-agriculturalization rate, average homestead area, population density, GDP per capita, homestead coverage rate, per capita construction land area, urban–rural landscape mixing degree, energy intensity, facility coverage, and land use blending degree (they are arranged in descending order in terms of the correlation degree).
Table 17. Correlation between carbon emissions of village-and-town communities of the tourism-led type and each relevant influencing indicator.
5.2.2. Evaluation of Low Carbon Correlation Elements
The correlation between the non-agriculturalization rate and carbon emission intensity is the strongest in both the overall correlation evaluation analysis and the correlation evaluation of the different industry types. In addition to the non-agriculturalization rate, the correlation between GDP per capita and carbon emission intensity is the strongest in the overall correlation evaluation analysis and the correlation evaluation analysis of the village-and-town communities of the trade-led type. In the analysis of the correlation evaluation of the village-and-town communities of the industry-led type, the correlation between facility coverage and the land use blending degree and carbon emission intensity is the strongest. In the correlation evaluation analysis of the village-and-town communities of the tourism-led type, the correlation between the average homestead area and carbon emission intensity is the strongest.
- (1)
- Performance evaluation of the correlation between the overall information indicators and carbon emissions
It was found from the overall correlation evaluation analysis that, among the overall information indicators, GDP per capita and population density have a greater influence on carbon emissions, because both GDP per capita and population density directly impact the activity-level energy consumption of village-and-town communities. The GDP per capita represents the economic development of village communities to a certain extent. The economic development of village-and-town communities significantly impacts carbon emission intensity [35]; it was found from communities of the same industry type that the higher the GDP per capita, the higher the carbon emissions. For example, the carbon emissions amount in Dushantou Village (GDP per capita: CNY 38,721) are higher than those in Xishan Village (GDP per capita: CNY 31,798). Population density represents the spatial capacity of land in village-and-town communities. The higher the number of residents per unit area, the higher the level of behavioral activities. The activity level directly impacts carbon emissions. Energy intensity is an indicator reflecting the energy efficiency and referring to the amount of energy consumed per unit of economic output volume; the lower the intensity, the higher the energy efficiency, and the lower the carbon emission amount. In the low-carbon construction of village-and-town communities, the carbon emissions of village-and-town communities can be reduced by improving energy efficiency and introducing new technologies. From the correlation evaluation of different industry types, the results obtained are similar. Therefore, it can be seen that, whatever the industry type is, GDP per capita and population density impact carbon emission intensity to a certain degree.
- (2)
- Performance evaluation of correlation between spatial morphology indicators and carbon emissions
It was found from the overall correlation evaluation analysis that each spatial morphology indicator has a large influence on carbon emissions. The indicators directly impact the spatial structure, the area of built-up area, the building density, and the construction level of village-and-town communities. The higher the construction level of the village-and-town communities, the higher the carbon emissions. The area of built-up area symbolizes the land utilization scale of village-and-town communities. As the land utilization scale increases, more mansions and supporting facilities are built, and the level of activities becomes higher; thus, more carbon is emitted overall. However, in the process of carbon growth, if the carbon emissions in the construction process are controlled, new construction techniques, such as assembly techniques, are adopted, and the energy efficiency can be improved; thus, the overall carbon emissions of the village-and-town communities can be controlled. Two indicators—the homestead coverage rate and the facility coverage—reflect the building density in the village-and-town communities. They directly impact the carbon emissions of the fixed carbon source in the carbon cycle system of the village-and-town communities and play a key part there. The average homestead area and homestead coverage rate are mainly correlated with the industrial nature of the village-and-town communities. It was found from the correlation evaluation analysis in the village-and-town communities of the tourism-led type that the average homestead area and homestead coverage rate are strongly, and positively, correlated with carbon emission intensity. For example, the carbon emissions in Tongwu Village (average homestead area: 328 m2) are higher than those in Gaopingxin Village (average homestead area: 283 m2). It was found from the analysis that the overall scale of land use and the scale of individual use in the spatial form elements have an influence on the carbon emissions of the village-and-town communities to different extents rather than to a large extent.
- (3)
- Performance evaluation of the correlation between urban–rural integration indicators and carbon emissions
It was found from the overall correlation evaluation analysis that the non-agriculturalization rate of urban–rural integration indicators impacts carbon emissions to the largest degree. Meanwhile, the two indicators that represent the integration stage of “land” in the village-and-town communities have a relatively small influence on carbon emissions. The non-agriculturalization rate of the village-and-town communities reflects the number of people engaged in secondary and tertiary industries. The impacts of the industries of different types on carbon emissions are significantly different. It was found from the comparative analysis that carbon emissions in the village-and-town communities of secondary industries are much higher than those in the village-and-town communities of tertiary industries. The difference in carbon emissions between the village-and-town communities of the two types with tertiary industries as the core is insignificant. The land use blending degree and urban–rural landscape mixing degree represent the degree of “land” integration in the desakota village-and-town communities. They mainly impact the spatial form structure of the village-and-town communities, thus indirectly influencing the carbon emissions of the village-and-town communities.
In summary, the 10 correlation indicators are all influencing elements correlated with the carbon emission intensity of the village-and-town communities. The correlation analysis was conducted to illustrate the influencing factors of carbon emissions in the desakota village-and-town communities and to determine the strength of the correlation and thus provide a direction and theoretical basis for the low-carbon construction of future desakota village-and-town communities.
6. Discussions
As urbanization gradually slows down, the “tipping point” comes. The desakota village-and-town communities where there is a strong interaction between urban and rural areas are gradually evolving from extensive development to deep construction. Problems in the initial development period are exposed gradually: the symbiotic relationship is fuzzy; land resources are wasted in the community; the internal spatial form layout falls into chaos; extensive high-carbon construction frequently emerges. In this article, in order to cope with the ecological and environmental pressure caused by various high-carbon behaviors during the development of desakota village-and-town communities, a model reflecting the correlation between the carbon emissions and the spatial forms was established to provide a basis for the establishment of a low-carbon construction system and thus improve the human settlements in the village-and-town communities and drive the development of the village-and-town communities in the direction of low-carbon concretization and systematization.
Relevant discussions are drawn from the following three aspects in this study:
Theoretical principles: desakota villages and towns and their elements and compositions were described. To fully understand the desakota village-and-town communities and the causes of high carbon, their spatial and temporal evolutions were analyzed, and their basic characteristics were interpreted, including complex demographic structure, diversified industrial structure, frequent element flow, and dynamic spatial development. On this basis, the complex and diversified desakota village-and-town communities were classified into different types. In this article, the spatial form characteristics and carbon emission intensity of the desakota village-and-town communities of different industry types were analyzed based on sample desakota village-and-town communities from the perspective of industry types. Based on the relevant theoretical research, a basic analysis was conducted on the composition of the spatial form elements and that of the carbon cycle system. From the perspective of the composition of the spatial form elements, five major elements, basis, boundary, group, nodal point, and traverse, were included; from the perspective of the carbon cycle system, the fixed carbon source, the mobile carbon source, the process carbon source, and the natural carbon were included. The interaction of these two elements influenced and determined, to a certain extent, the basis for the construction of the low-carbon correlation model of the village-and-town communities.
Quantitative analysis: analysis of the spatial form characteristics and carbon emission intensity was performed. Based on the empirical research, the spatial form structure, the urban–rural integration characteristics of the desakota village-and-town communities and the measure parameter indicators, which symbolize the size of the spatial elements and the land utilization in the village-and-town communities, as well as reflect the development stage of urban–rural integration, were summarized. These indicators mainly included: total area of construction land, average homestead area, homestead coverage rate, facility coverage, population density, land use blending degree, urban–rural landscape mixing degree, and non-agriculturalization rate. Here, the urban–rural integration measurement (land use blending degree, urban–rural landscape mixing degree, and non-agriculturalization rate) verified that the desakota village-and-town communities are still in the transitional stage of urbanization.
Additionally, a carbon emission measurement model based on the organization elements of spatial form was proposed to describe the energy consumption of each spatial form element. Moreover, the carbon map simulation was used to show the high-carbon points under different industry types. On this basis, the carbon emission characteristics were described, including spatial typology, temporal periodization, carbon emission averaging, and element diversification. Meanwhile, the correlation between spatial form characteristics and carbon emissions was analyzed by qualitative description.
Correlation interpretation: the evaluation of the relevant influencing elements of carbon emission intensity was performed. Based on the gray correlation model, the comprehensive information contents of the 12 sample village-and-town communities and the spatial form and urban–rural integration measurements proposed in this article were summarized and organized. A quantitative analysis was conducted on carbon emission intensity and these elements in order to obtain the correlation between them. It was found from the comprehensive results that the element that has the strongest correlation with carbon emission intensity is the non-agriculturalization rate, which reflects the degree of urban–rural integration; in terms of the correlation, it is followed by GDP per capita, which reflects the level of economic activities of the village-and-town communities. Meanwhile, the land use blending degree and urban–rural landscape mixing degree are weakly correlated with carbon emission intensity. It was found from the analysis results of various types that the non-agriculturalization rate still has the strongest correlation with carbon emission intensity. In addition, facility coverage has the highest correlation with carbon emission intensity in the village-and-town communities of the industry-led type. The average homestead area has the highest correlation with carbon emission intensity in the village-and-town communities of the tourism-led type. Meanwhile, the correlation with carbon emissions in village-and-town communities is similar to the comprehensive result.
7. Conclusions
In this article, the spatial components and carbon cycle system of the desakota village-and-town communities are interpreted from a macroscopic qualitative concept description. Here, their meaning is extended, and the organizational structure of the village-and-town communities is sorted out and improved. A quantitative mathematical model is adopted to describe the spatial form characteristics and carbon emission characteristics of the desakota village-and-town communities. The elements impacting the carbon emissions of the village-and-town communities are interpreted based on qualitative description, quantitative comparison, and the gray correlation model. On this basis, the relationship between energy consumption and the characteristics of the village-and-town communities is clarified, and the traditional low carbonization concept is extended to lay a solid theoretical foundation for the construction and optimization of a low-carbon construction system. Relevant conclusions are drawn from the following three aspects in this study:
Firstly, according to the different types of industries in the desakota village-and-town communities, the village-and-town communities of the industry-led type, trade-led type, and tourism-led type that emerged out of urbanization and industrialization in recent years were selected for investigation and research. Secondly, the composition of the spatial form elements and the carbon cycle system of the desakota village-and-town communities was analyzed to clarify the entry points of the study.
Then, based on the composition of the relevant elements of the desakota village-and-town communities, a relevant calculation model was constructed to quantitatively analyze the spatial form characteristics and carbon emission characteristics of the village-and-town communities and to describe them quantitatively.
Finally, the gray correlation model was selected to evaluate and analyze the correlation between carbon emission intensity and the elements related to it in the desakota village-and-town communities. The qualitative description was extended to quantitative comparison analysis, and the specific elements impacting the carbon emissions of village-and-town communities were interpreted, thus laying the foundation for the establishment of a low-carbon construction system.
On the basis of the quantitative analysis of the correlation evaluation, the correlation between carbon emission intensity and spatial form elements was studied to identify the relevant influencing elements. This study was conducted on desakota village-and-town communities of different types with different economic situations in different regions to lay a foundation for the proposal of a regionalized, differentiated, and dynamic construction model, to avoid the appearance of “thousands of villages with the same features”, and to provide guidance for their future development and construction.
Author Contributions
In this paper, B.S. performed the experiment, conceptualization, calculation, and data visualization; X.Z. and Z.L. reviewed the paper; Y.Z. and H.S. refined the diagrams; B.S. wrote and edited the paper. All the authors (X.Z., B.S., Z.L., Y.Z. and H.S.) organized the paper’s structure. All authors have read and agreed to the published version of the manuscript.
Funding
This research was funded by the National Natural Science Fund of China (grant No. 51878613), the Humanities and Social Science Project of the Chinese Ministry of Education (grant No. 17YJAZH136), and the Fundamental Research Funds for the Provincial Universities of Zhejiang (grant No. GB201901003).
Institutional Review Board Statement
Not applicable.
Informed Consent Statement
Not applicable.
Acknowledgments
The authors gratefully acknowledge the editors and referees for their positive and constructive comments in the review process.
Conflicts of Interest
The authors declare no conflict of interest.
Nomenclature
| Symbol | Description |
| Total area of construction land | |
| Average homestead coverage rate | |
| Homestead coverage rate | |
| Facility coverage | |
| Population density | |
| Land use blending degree | |
| Urban–rural landscape mixing degree | |
| Ratio of the area of state-owned land to that of collective land in village-and-town communities | |
| The area of state-owned land | |
| The area of collective land | |
| Ratio of area of urban scenic buildings to that of rural scenic buildings in village-and-town communities | |
| Area of urban scenic buildings | |
| Area of rural scenic buildings |
References
- Baoxing, Q. Deep Urbanization—An Important Strategy to Enhance China’s Economic Vitality and Sustainable Development Ability in the Future. J. China Eng. Consult. 2018, 9, 26–30. [Google Scholar]
- Gottmann, J. Megalopolis the Urbanized Northeastern Seaboard of the United States; Twentieth Century Fund: New York, NY, USA, 1961; 810p. [Google Scholar]
- Marx, K. The Complete Works of Marx and Engels; Lawrence & Wishart Ltd.: London, UK, 1956; Volume 4. [Google Scholar]
- Friedmann, J.; Weaver, C. Territory and Function: The Evolution of Regional Planning; E. Arnold: London, UK, 1979; 234p. [Google Scholar]
- Ginsburg, N.S.; Koppel, B.; McGee, T.G. The Extended Metropolis: Settlement Transition Is Asia; University of Hawaii Press: Honolulu, HI, USA, 1991. [Google Scholar]
- Goodkind, D.; West, L.A. China’s floating population: Definitions, data and recent findings. Urban Transform. China 2002, 39, 2237–2250. [Google Scholar] [CrossRef]
- Wang, S.; Xie, Z.; Wu, R.; Feng, K. How does urbanization affect the carbon intensity of human well-being? A global assessment. Appl. Energy 2022, 312, 118798. [Google Scholar] [CrossRef]
- Tang, F.; Wang, L.; Guo, Y.; Fu, M.; Huang, N.; Duan, W.; Luo, M.; Zhang, J.; Li, W.; Song, W. Spatio-temporal variation and coupling coordination relationship between urbanisation and habitat quality in the Grand Canal, China. Land Use Policy 2022, 117, 106119. [Google Scholar] [CrossRef]
- Zhang, M.; Tan, S.; Zhang, Y.; He, J.; Ni, Q. Does land transfer promote the development of new-type urbanization? New evidence from urban agglomerations in the middle reaches of the Yangtze River. Ecol. Indic. 2022, 136, 108705. [Google Scholar] [CrossRef]
- Xiaomin, G.; Chuanglin, F.; Xufang, M.; Dan, C. Coupling and coordination analysis of urbanization and ecosystem service value in Beijing-Tianjin-Hebei urban agglomeration. Ecol. Indic. 2022, 137, 108782. [Google Scholar] [CrossRef]
- Liyang, F. Research on Low-Carbon Rural Space Design Strategies and Evaluation Methods Based on the Yangtze River Delta Region. Ph.D. Thesis, Zhejiang University, Hangzhou, China, 2017. [Google Scholar]
- Goodfield, D.; Anda, M.; Ho, G. Carbon neutral mine site villages: Myth or reality? Renew. Energy 2013, 66, 62–68. [Google Scholar] [CrossRef]
- Tomar, S.; Sharma, N. A systematic review of agricultural policies in terms of drivers, enablers, and bottlenecks: Comparison of three Indian states and a model bio-energy village located in different agro climatic regions. Groundw. Sustain. Dev. 2021, 15, 100683. [Google Scholar] [CrossRef]
- Michaelis, P.; Jackson, T. Material and energy flow through the UK iron and steel sector: Part 2: 1994–2019. Resour. Conserv. Recycl. 2000, 29, 209–230. [Google Scholar] [CrossRef]
- Nakazawa, T. Variation and cycles of carbon dioxide and methane. Glob. Environ. Res. 1997, 2, 5–14. [Google Scholar]
- Fang, J. Global Ecology: Climate Change and Ecological Response; Higher Education Press: Beijing, China, 2000. [Google Scholar]
- Jie, Q. Research on Metropolitan Carbon Sources and Sinks: With Shanghai as the Example. Ph.D. Thesis, East China Normal University, Shanghai, China, 2004. [Google Scholar]
- Wang, Z.; Xuehua, P. Research Framework and Theoretical System of Low-carbon Urban Development. J. Hunan Univ. Technol. 2012, 17, 8–14. [Google Scholar]
- Bagley, M.N.; Mokhtarian, P.L. The impact of residential neighborhood type on travel behavior: A structural equations modeling approach. Ann. Reg. Sci. 2002, 36, 279–297. [Google Scholar] [CrossRef]
- Wahlgren, I. Eco Efficiency of Urban Form and Transportation; VTT: Espoo, Finland, 2007. [Google Scholar]
- Gleaser, E.L.; Kahn, M.E. The Greenness of Cities: Carbon Dioxide Emissions and Urban Development. J. Urban Econ. 2008, 67, 404–418. [Google Scholar] [CrossRef] [Green Version]
- Kennedy, C.; Steinberger, J.; Gasson, B.; Hansen, Y.; Hillman, T.; Havránek, M.; Pataki, D.; Phdungsilp, A.; Ramaswami, A.; Mendez, G.V. Greenhouse Gas Emissions from Global Cities. Environ. Sci. Technol. 2009, 43, 7297–7302. [Google Scholar] [CrossRef]
- Fei, C.; Dajian, Z. Determination of Connotation, Model and Target Strategy in the Research on Low-carbon City. J. Urban Plan. 2009, 4, 7–13. [Google Scholar]
- Bin, L.; Ting, S. Research on Compactness of Urban Spatial Form from a Low Carbon Perspective. Geogr. Res. 2013, 32, 1057–1067. [Google Scholar]
- Sunsheng, H.; Bo, Q. Low Carbon Spatial Planning and Sustainable Development, 1st ed.; China Renmin University Press: Beijing, China, 2014; p. 236. [Google Scholar]
- Xin, H.; Wentao, Y. Analysis of Correlation between Planning Elements and Carbon Emissions in Mountainous Settlements: With Main Urban Area of Chongqing as the Example. J. Hum. Settl. West China 2015, 30, 100–105. [Google Scholar] [CrossRef]
- Zhu, C.; Lin, Y.; Zhang, J.; Gan, M.; Xu, H.; Li, Y.; Yuan, S.; Wang, K. Exploring the relationship between rural transition and agricultural eco-environment using a coupling analysis: A case study of Zhejiang Province, China. Ecol. Indic. 2021, 127, 107733. [Google Scholar] [CrossRef]
- Zhu, X.; Zhang, Z.; Chen, X.; Jia, F.; Chai, Y. Nexus of mixed-use vitality, carbon emissions and sustainability of mixed-use rural communities: The case of Zhejiang. J. Clean. Prod. 2021, 330, 129766. [Google Scholar] [CrossRef]
- Wang, Y.; Zhu, Y.; Yu, M. Evaluation and determinants of satisfaction with rural livability in China’s less-developed eastern areas: A case study of Xianju County in Zhejiang Province. Ecol. Indic. 2019, 104, 711–722. [Google Scholar] [CrossRef]
- Yingying, W. Research on Methods and Practices of Low-Carbon Adaptive Construction for Spatial Forms of Rural Community. Ph.D. Thesis, Zhejiang University, Hangzhou, China, 2016. [Google Scholar]
- Xincheng, P. Research on Quantification of Traditional Rural Settlements in Two-Dimensional Planes. Ph.D. Thesis, Zhejiang University, Hangzhou, China, 2012. [Google Scholar]
- 2006 IPCC Guidelines for National Greenhouse Gas Inventories: Volume II. Available online: https://www.ipcc-nggip.iges.or.jp/public/2006gl/index.html (accessed on 6 April 2021).
- Kennedy, C.; Steinberger, J.; Gasson, B.; Hansen, Y.; Hillman, T.; Havránek, M.; Pataki, D.; Phdungsilp, A.; Ramaswami, A.; Mendez, G.V. Methodology for inventorying greenhouse gas emissions from global cities. Energy Policy 2010, 38, 4828–4837. [Google Scholar] [CrossRef]
- Chang, C.; Chongjun, F. Grey Correlation Analysis and Prediction of Carbon Emission Factors in Shanghai. J. Univ. Shanghai Sci. Technol. 2013, 35, 484–488. [Google Scholar] [CrossRef]
- Liu, Y. Study on the Influencing Factors of the Development of Low-Carbon Economy in Jiangsu Province, and Corresponding Countermeasures. Master’s Thesis, Jiangsu University, Zhenjiang, China, 2011. [Google Scholar]
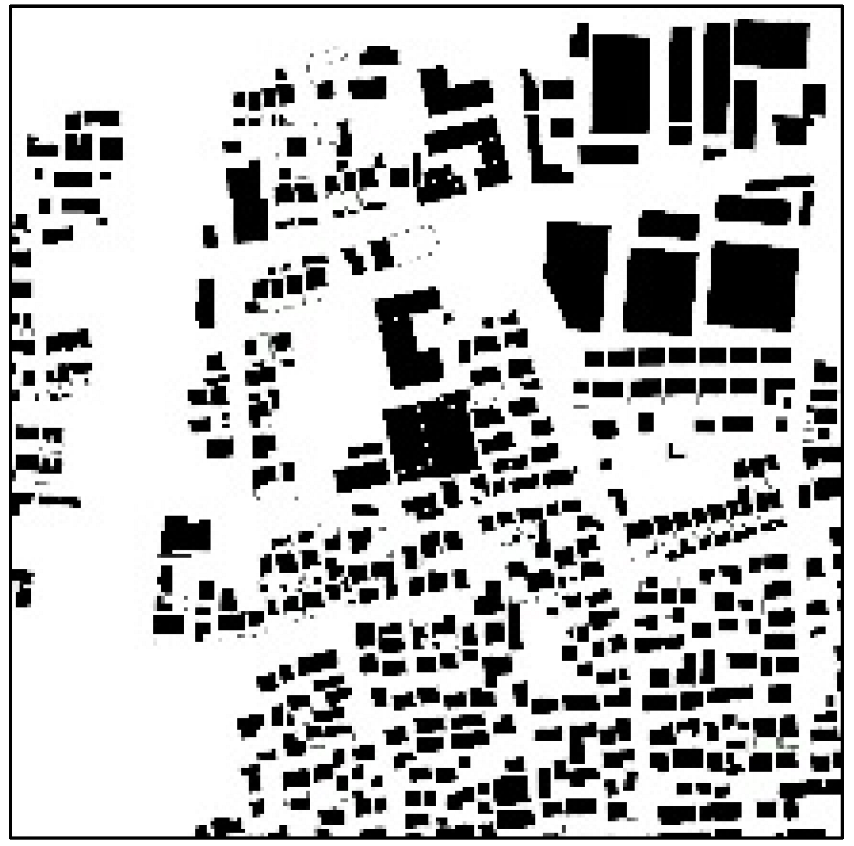
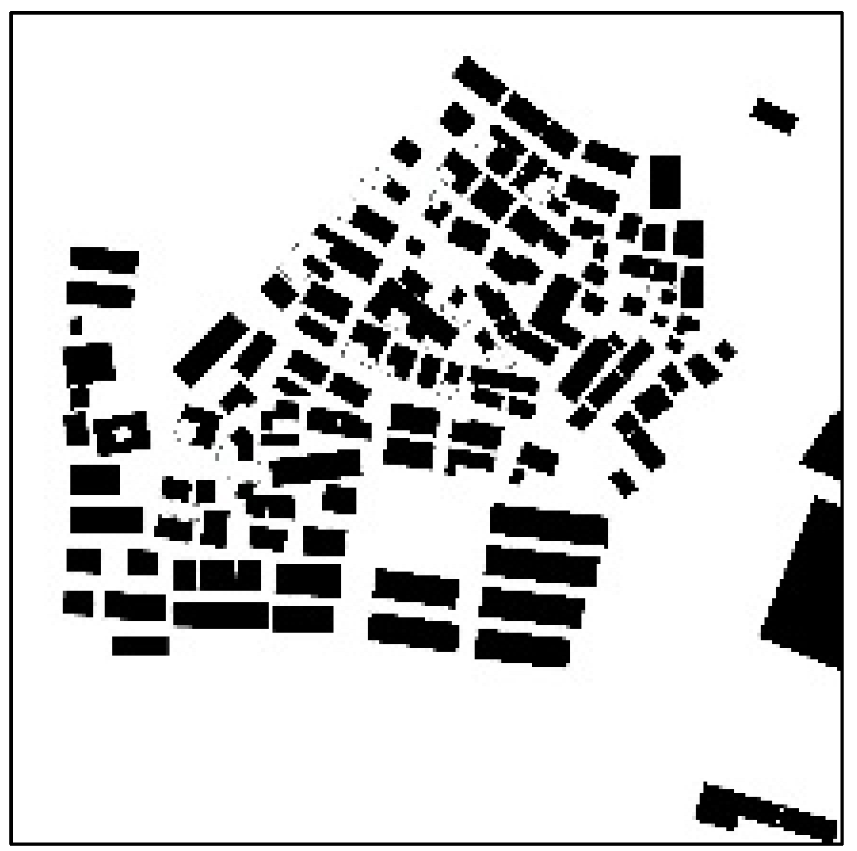
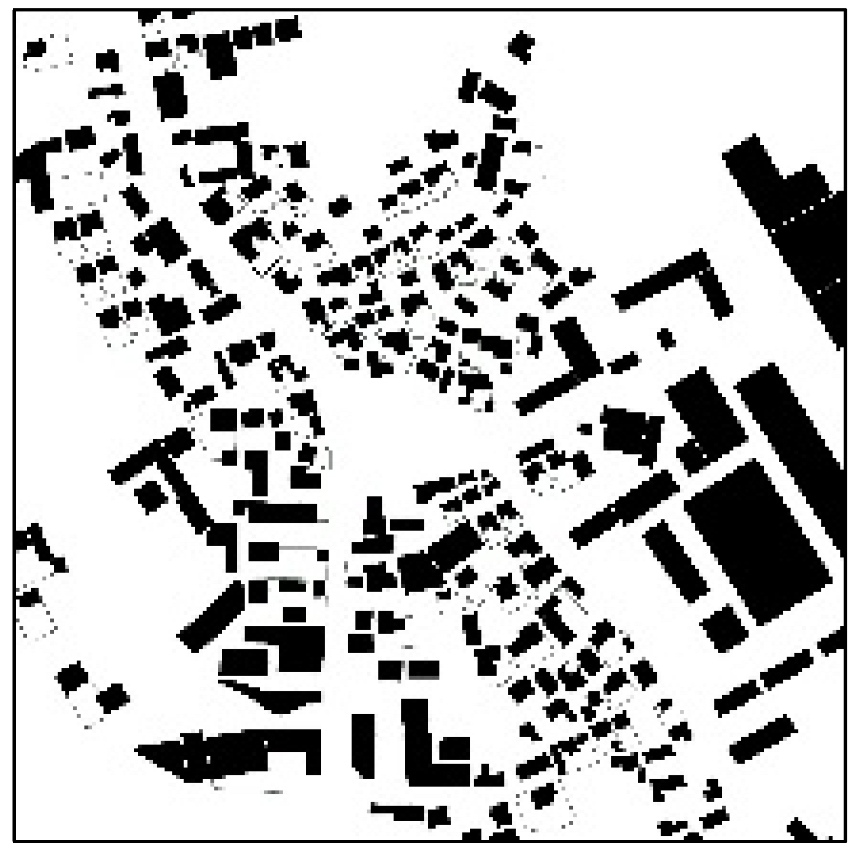
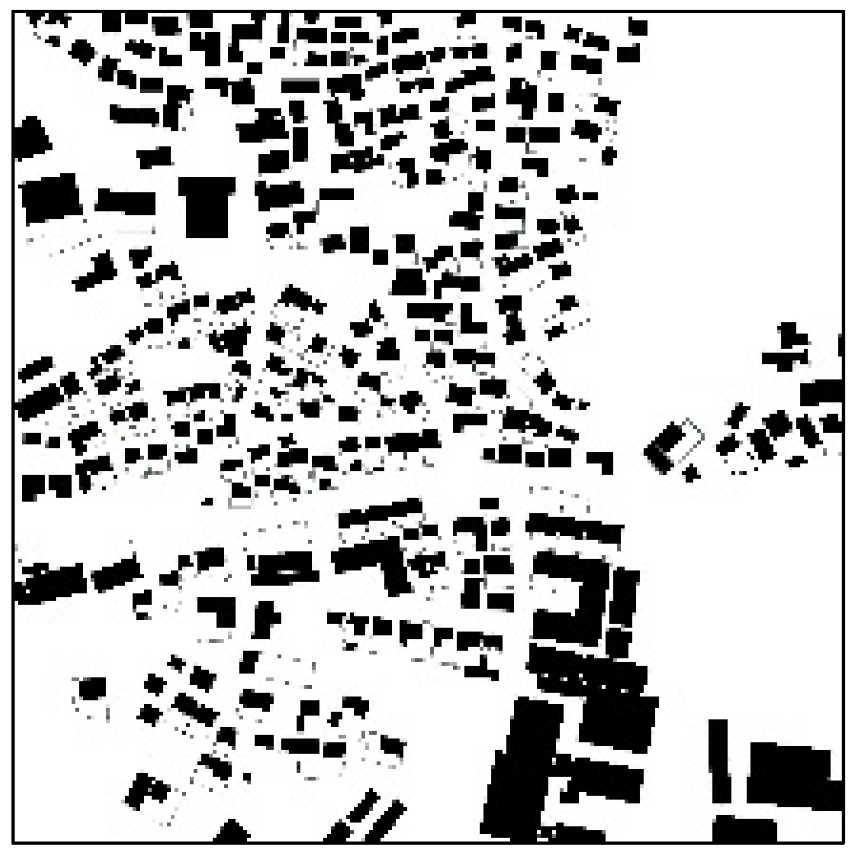
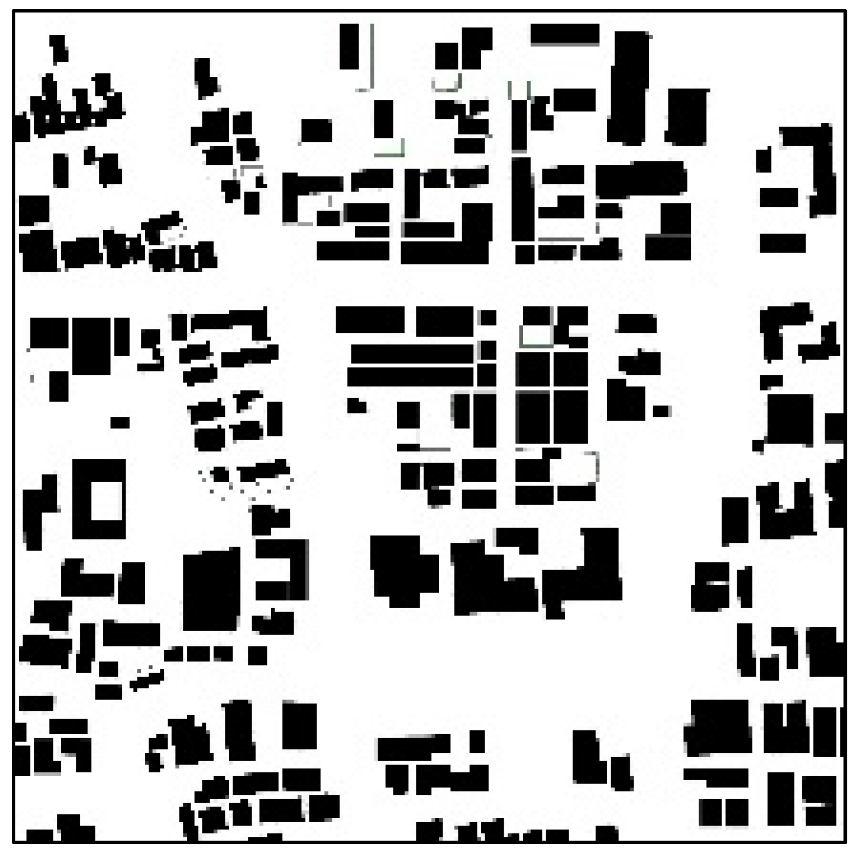
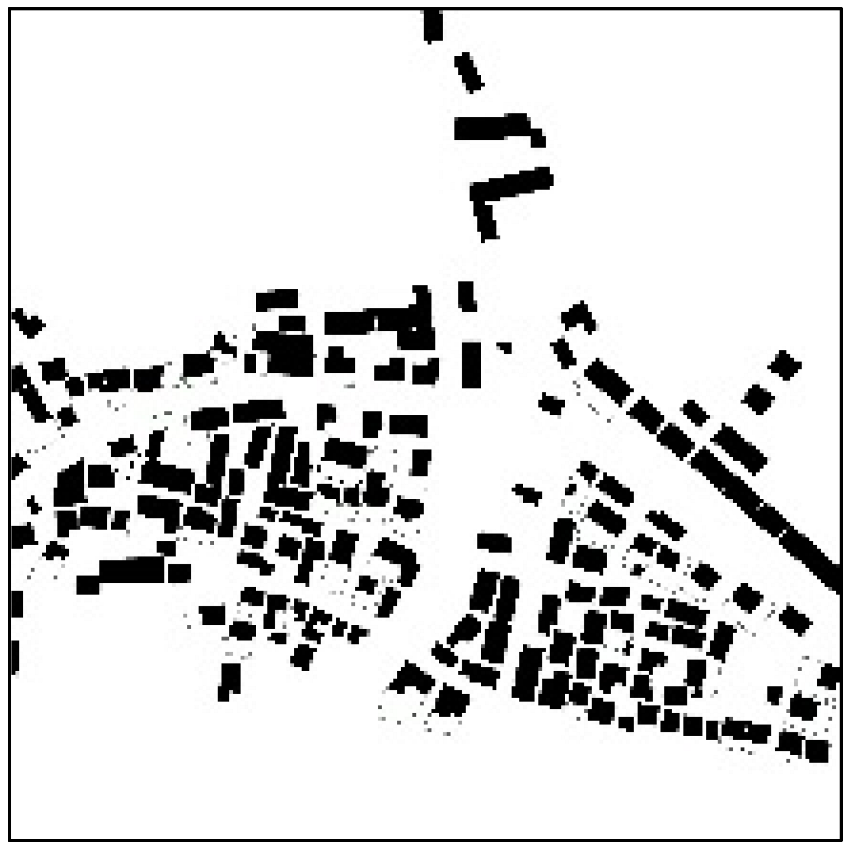
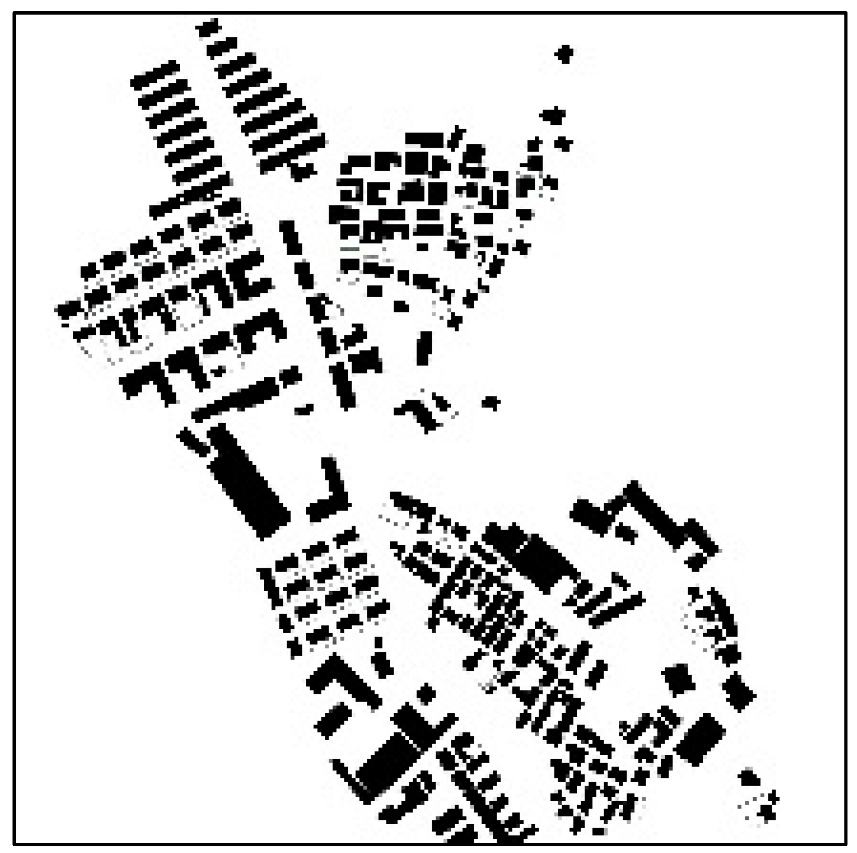
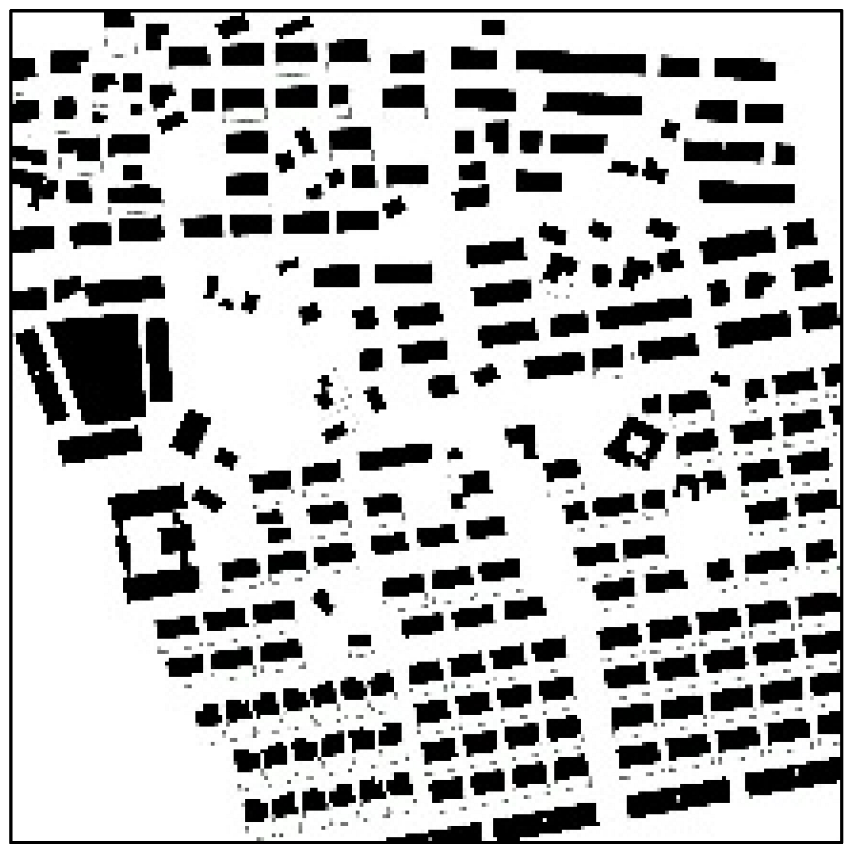
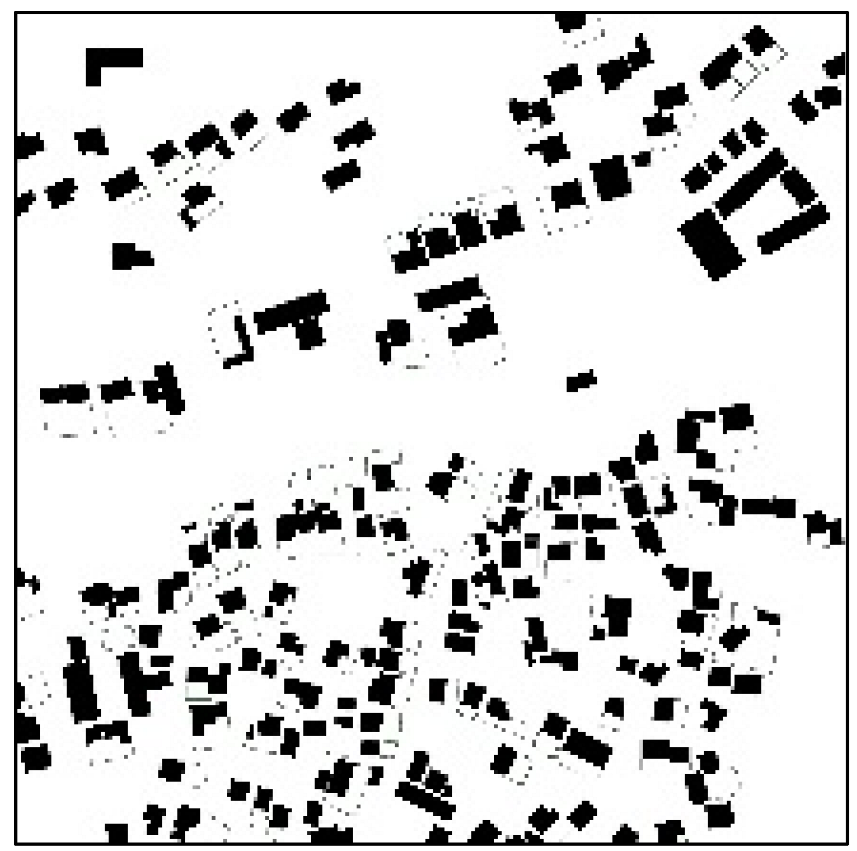
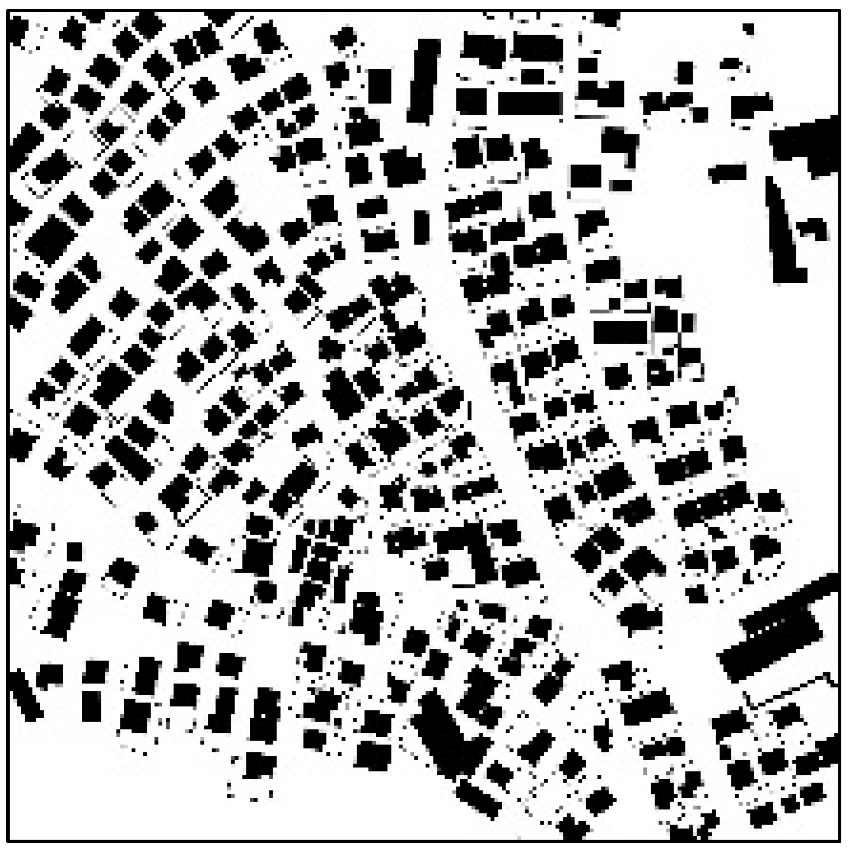
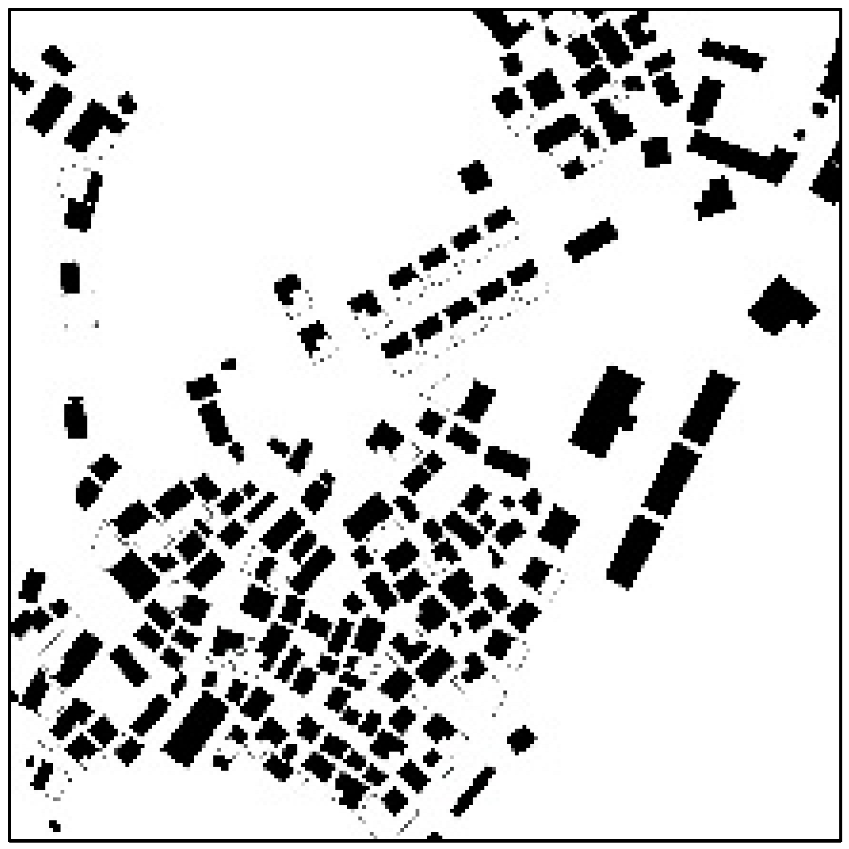
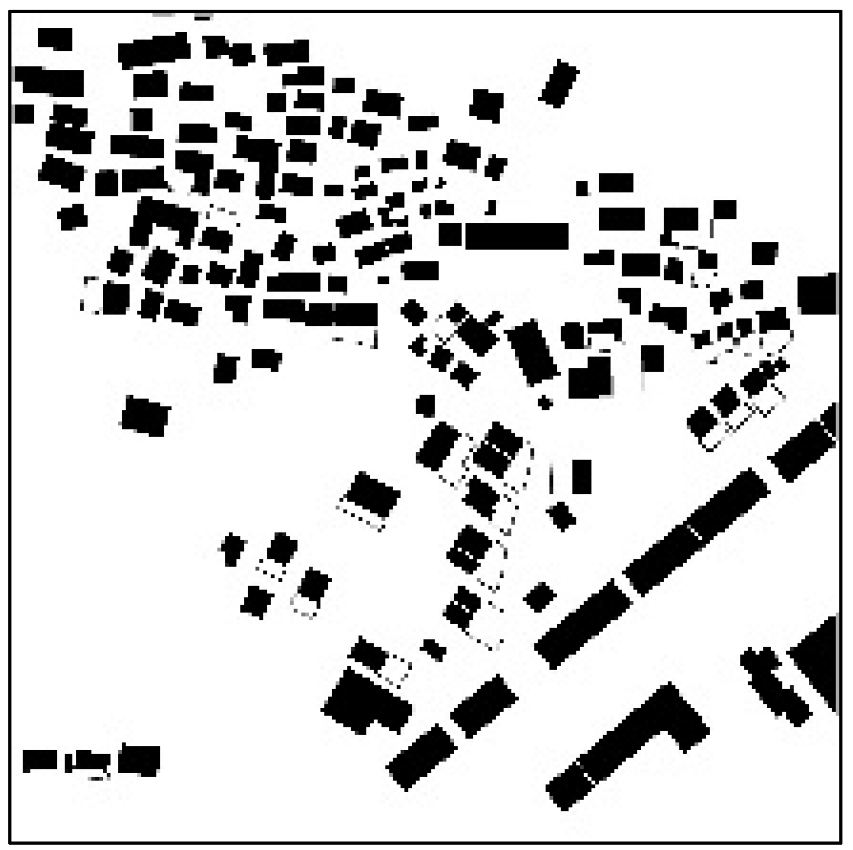
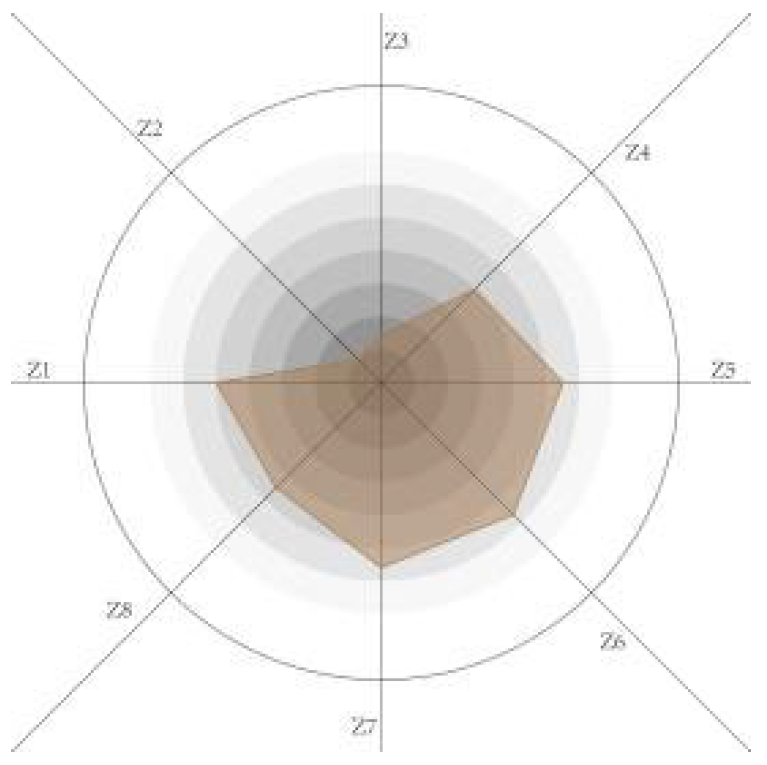
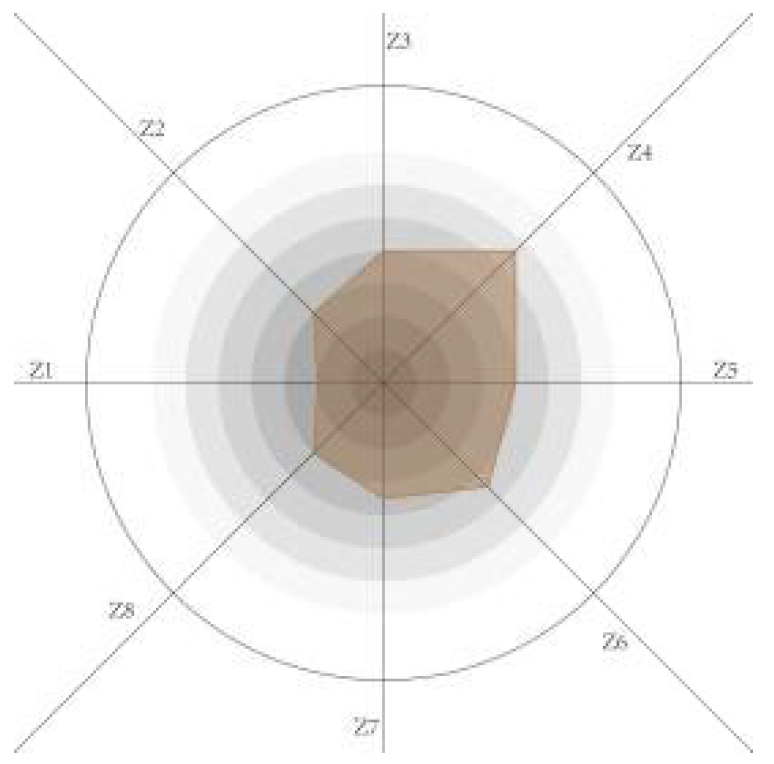
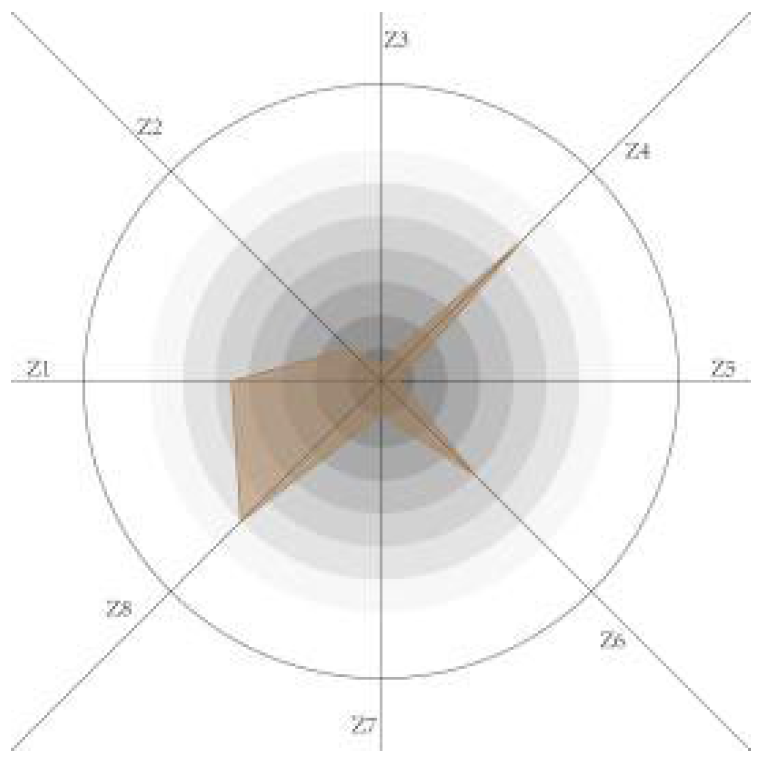
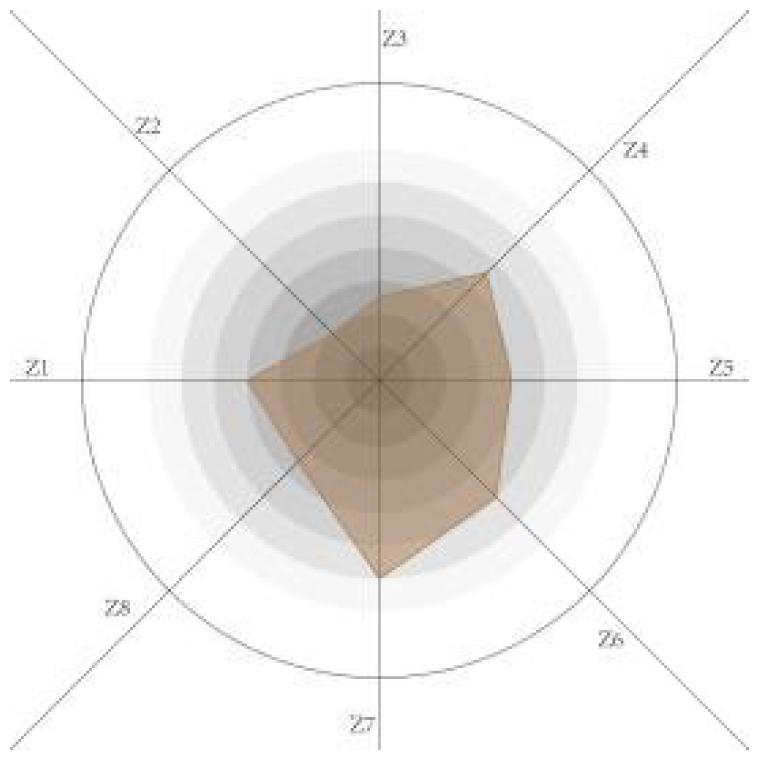
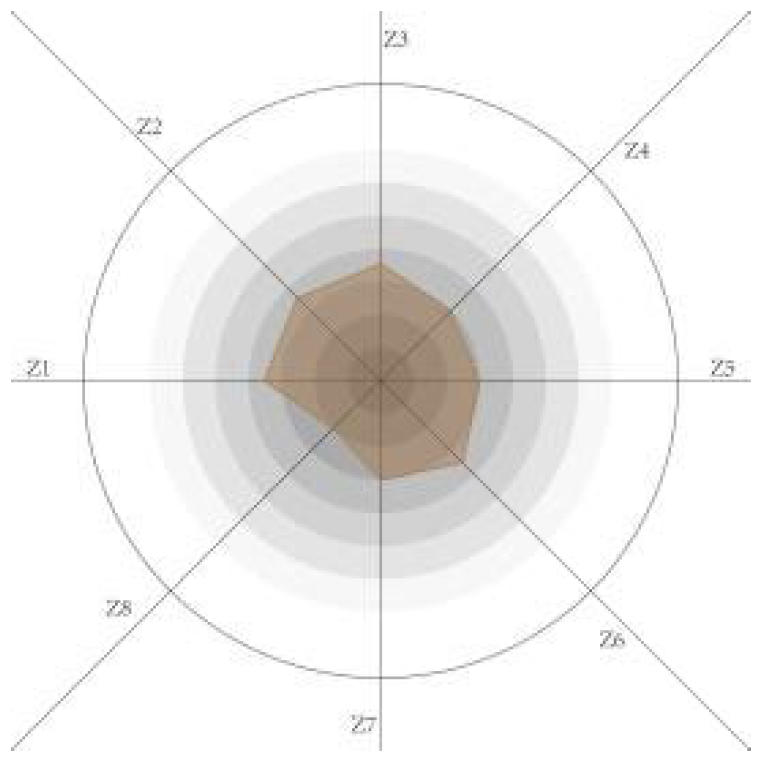
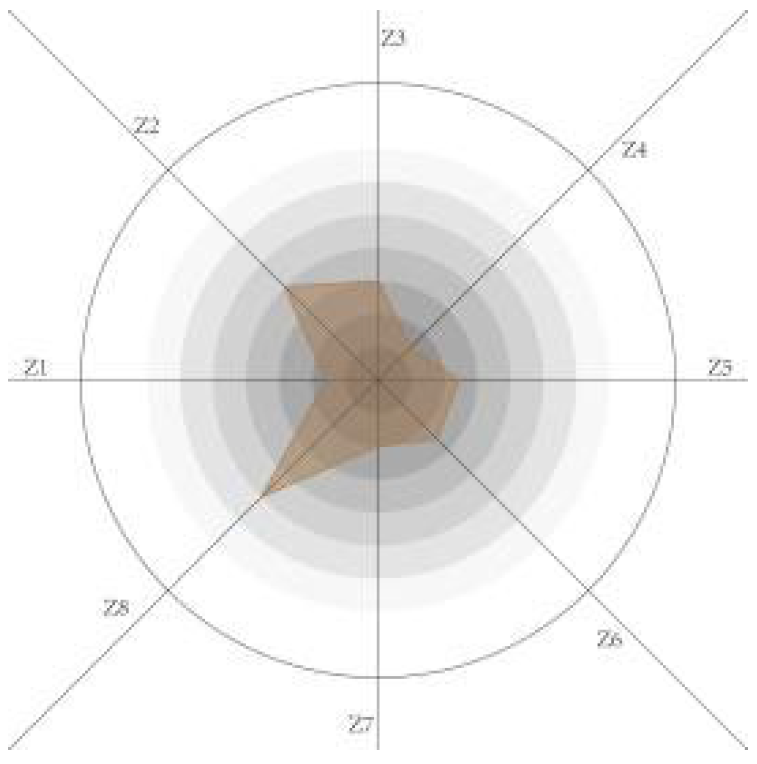
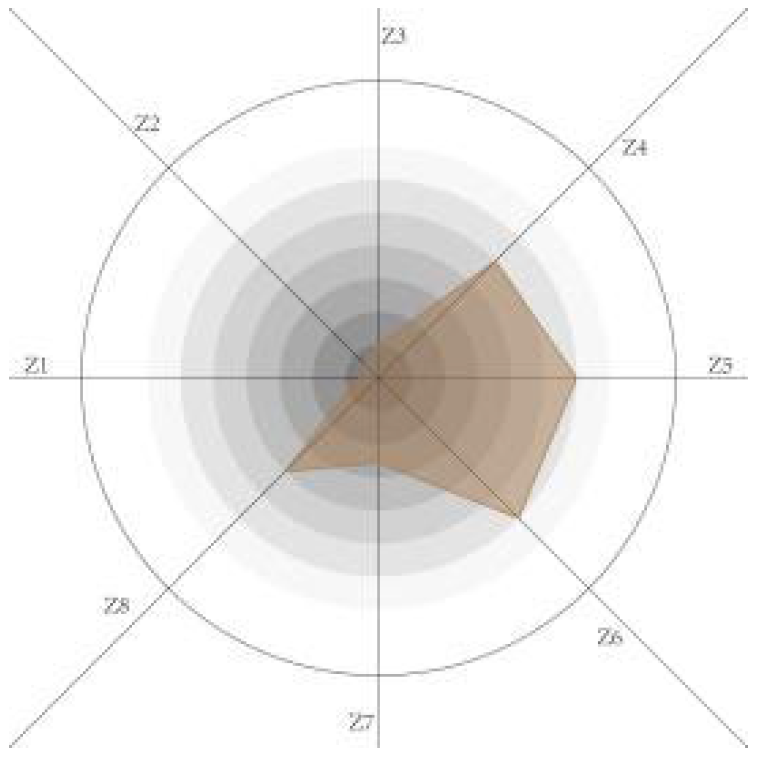
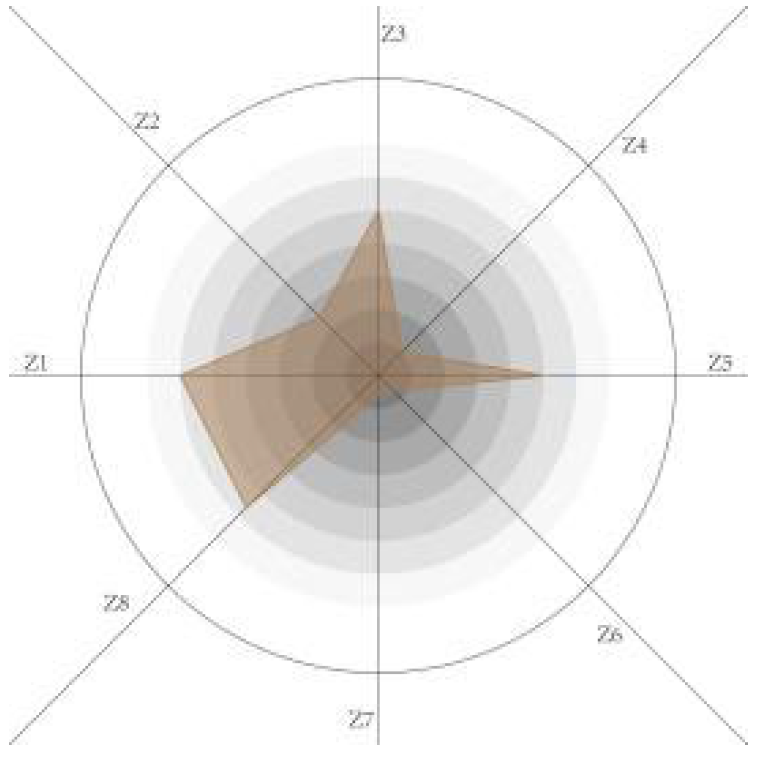
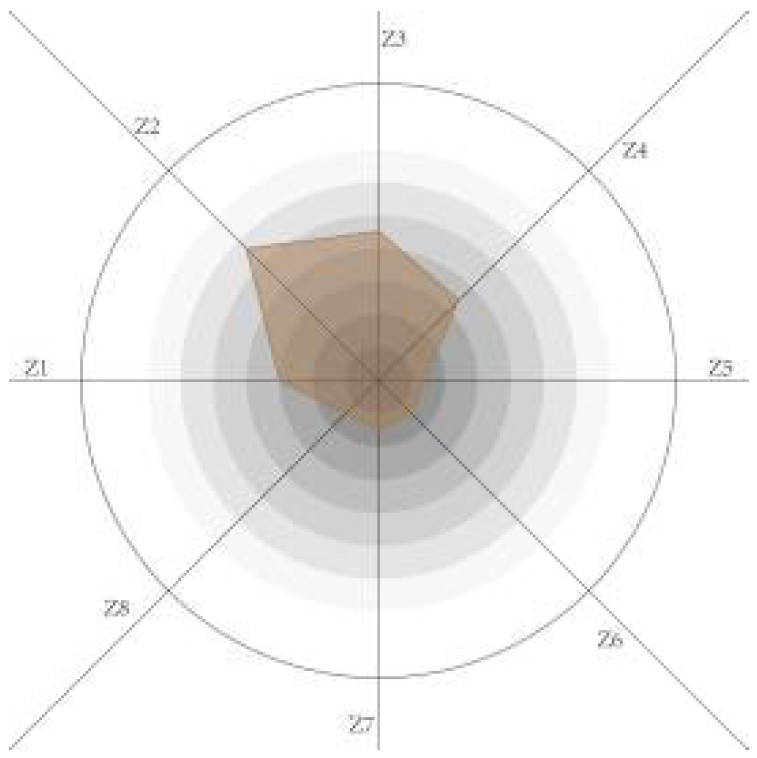
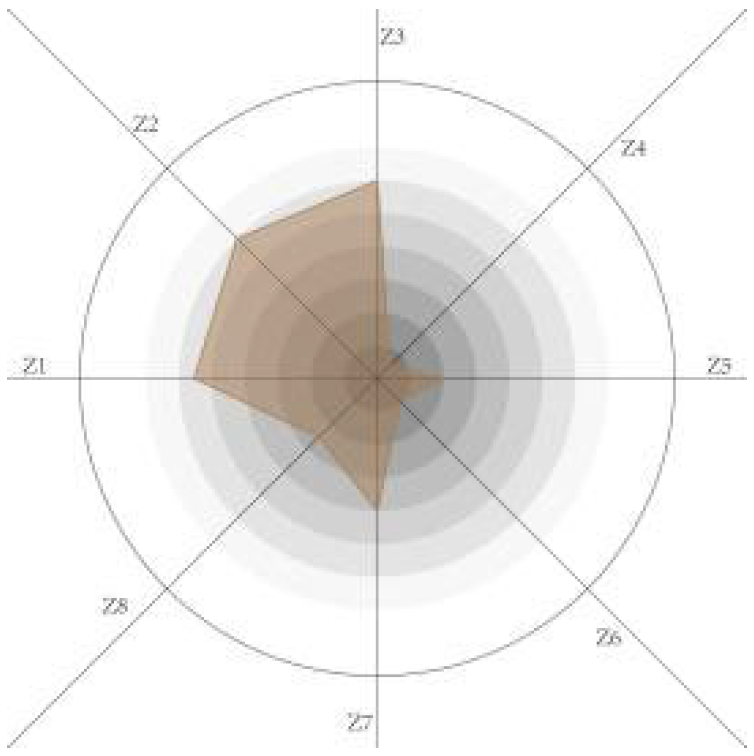
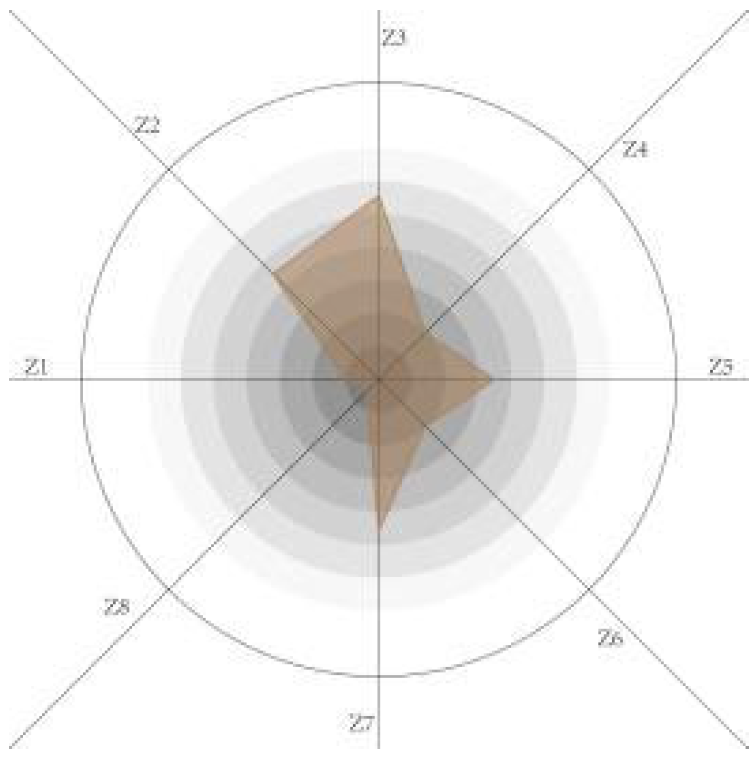
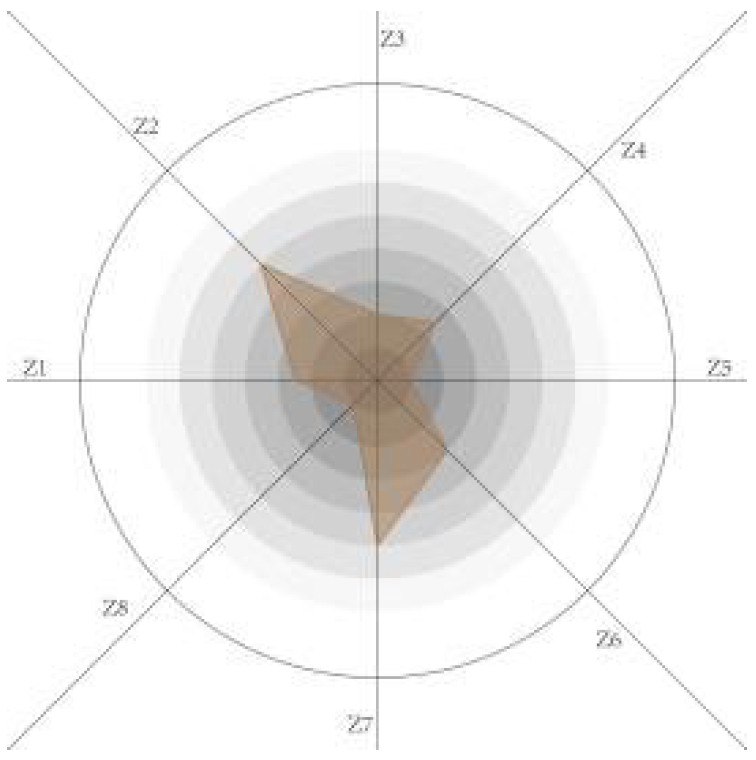
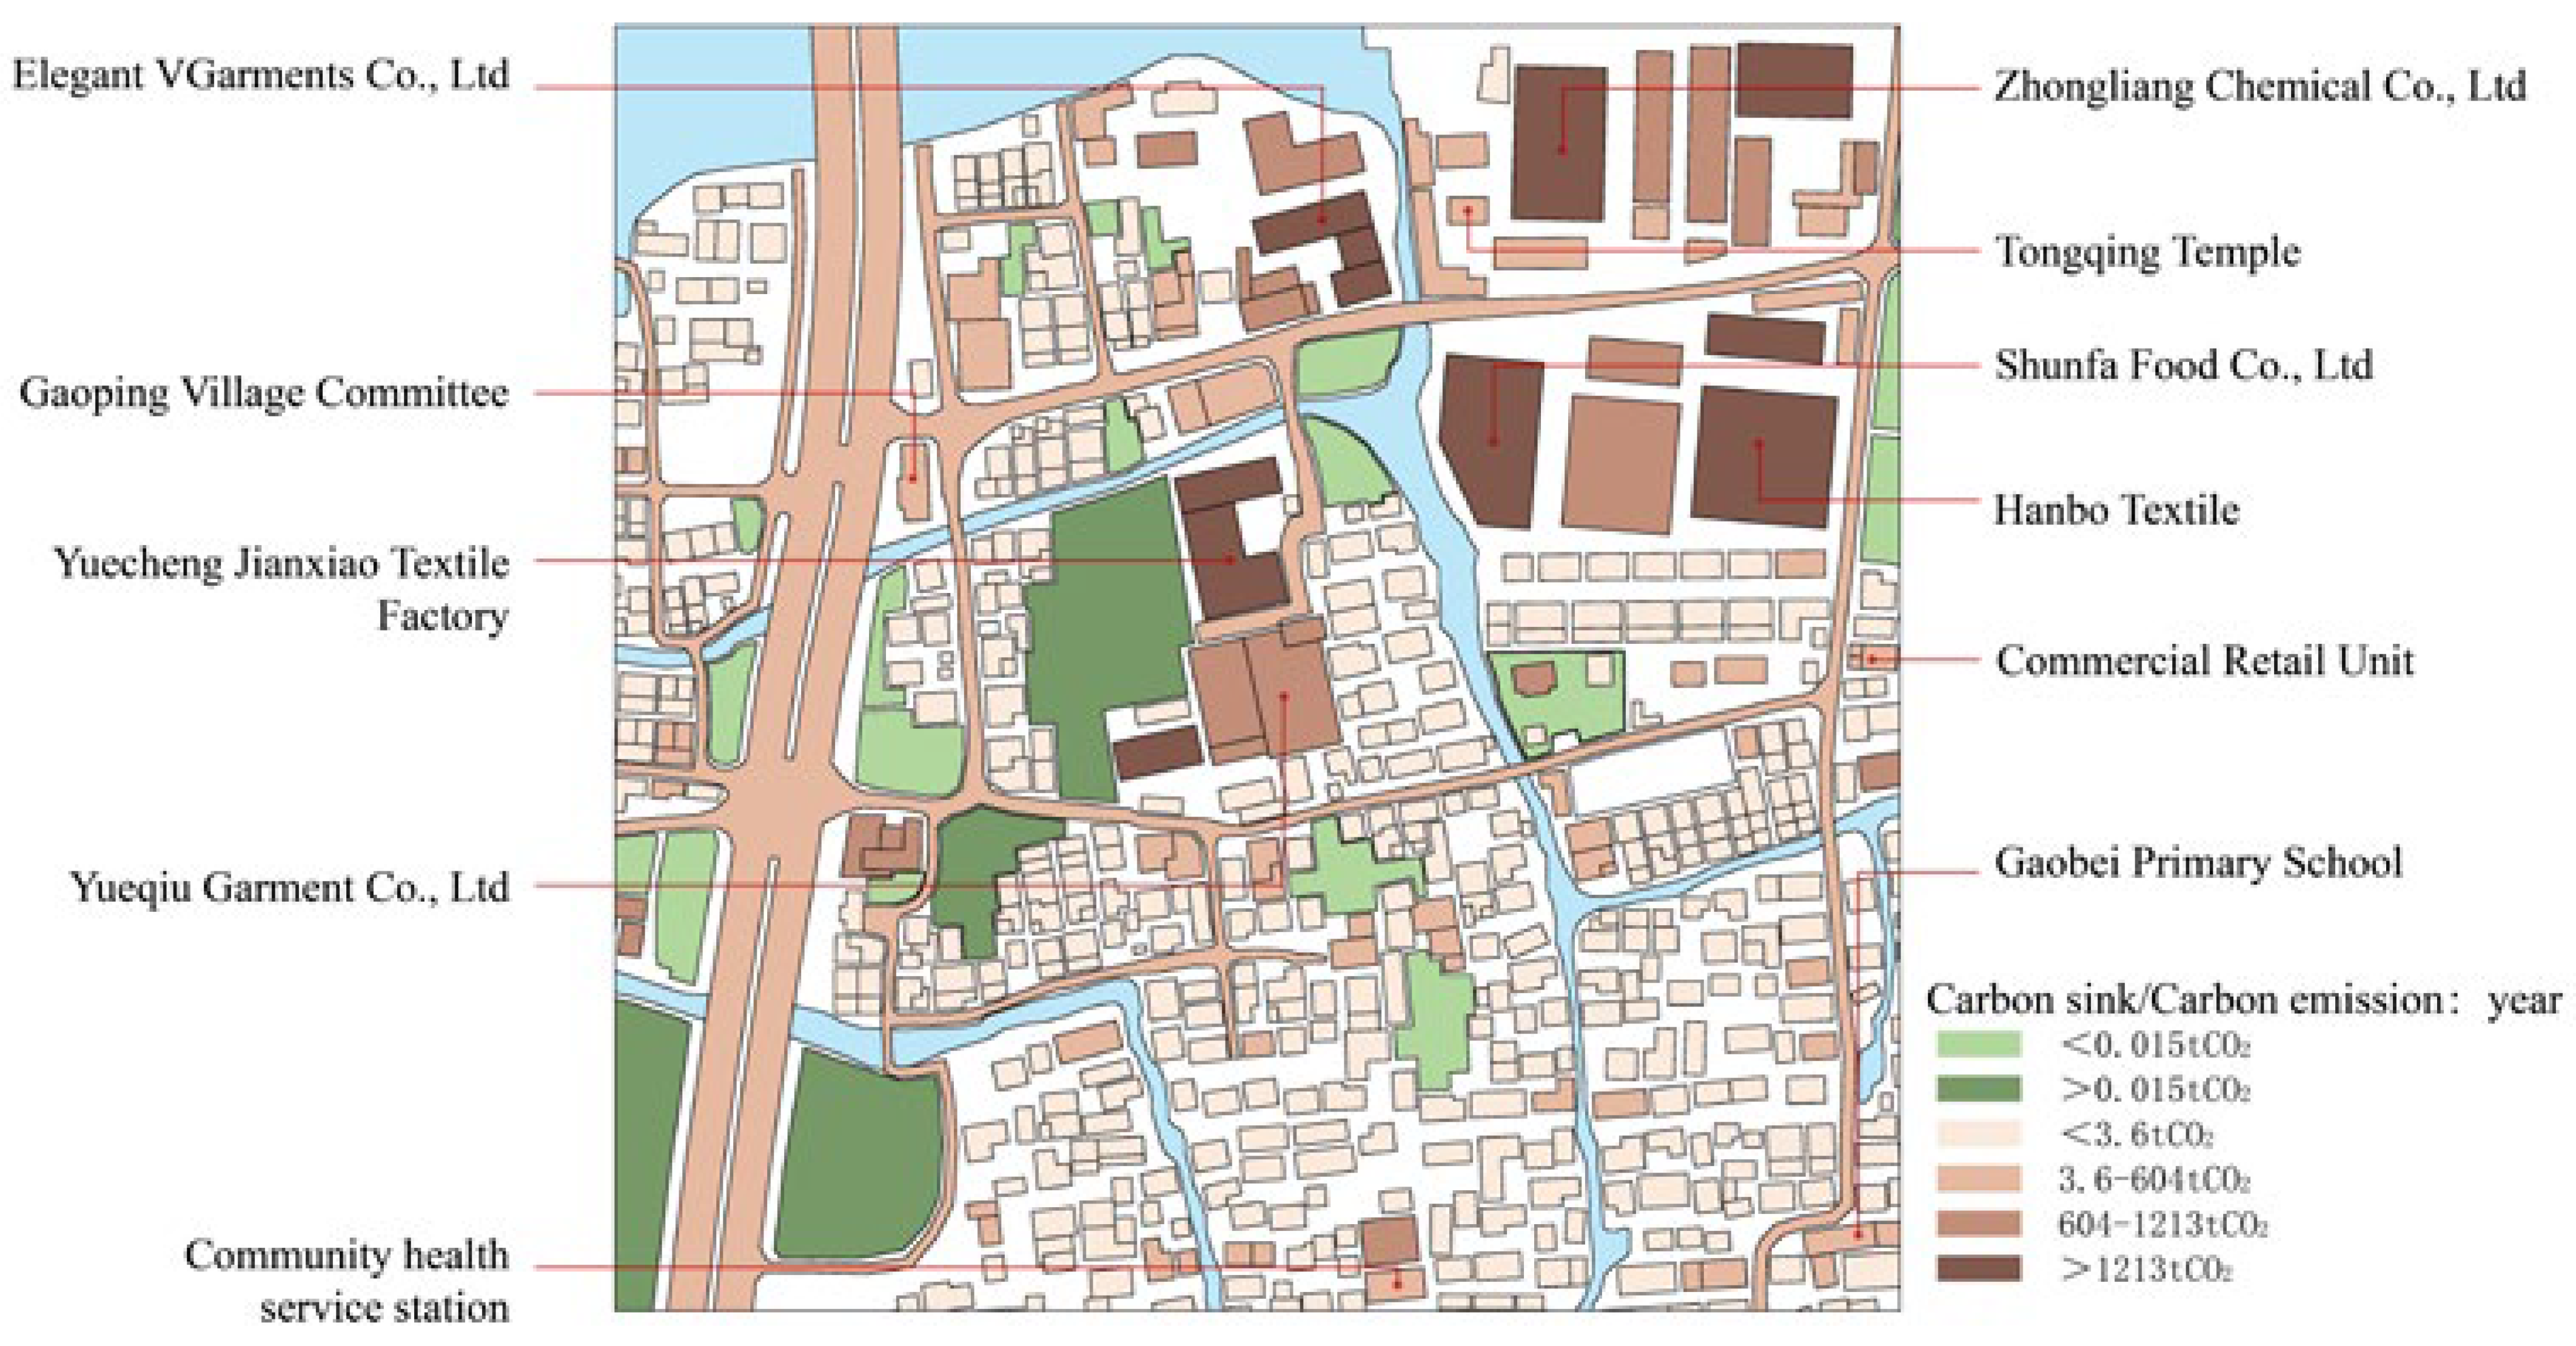
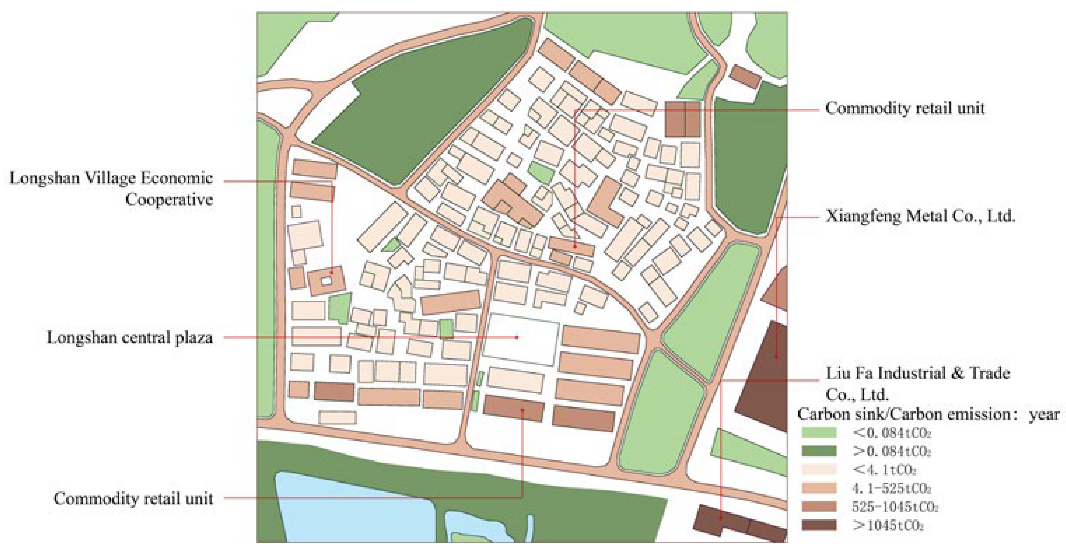
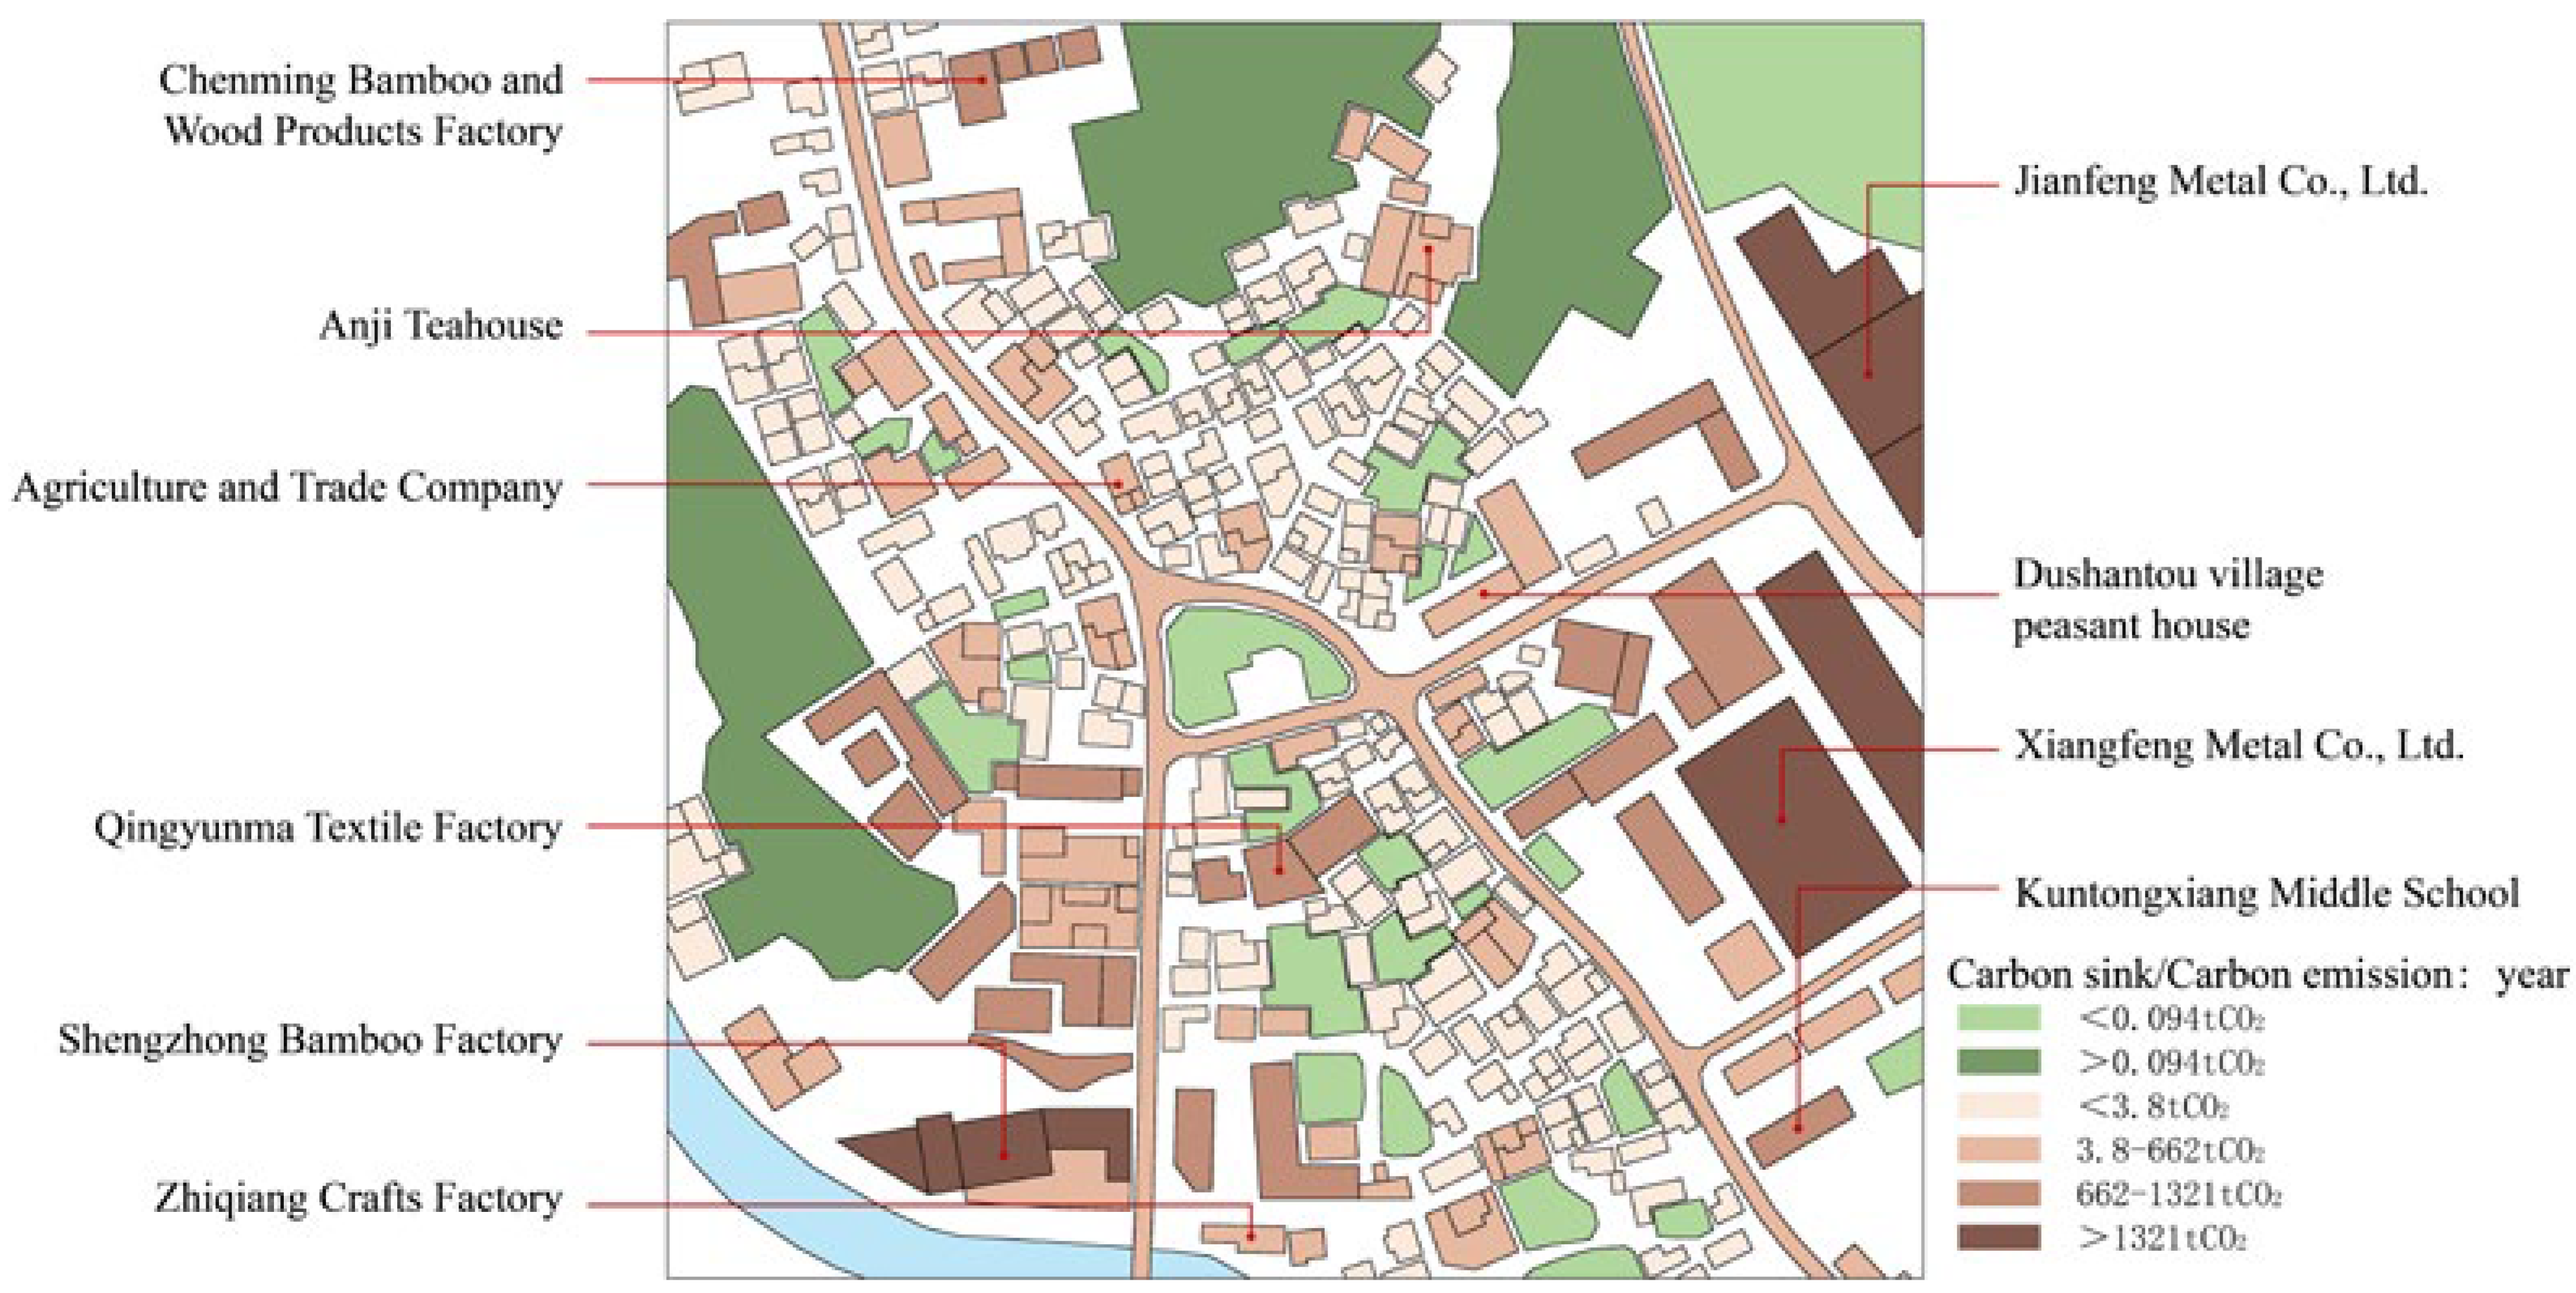
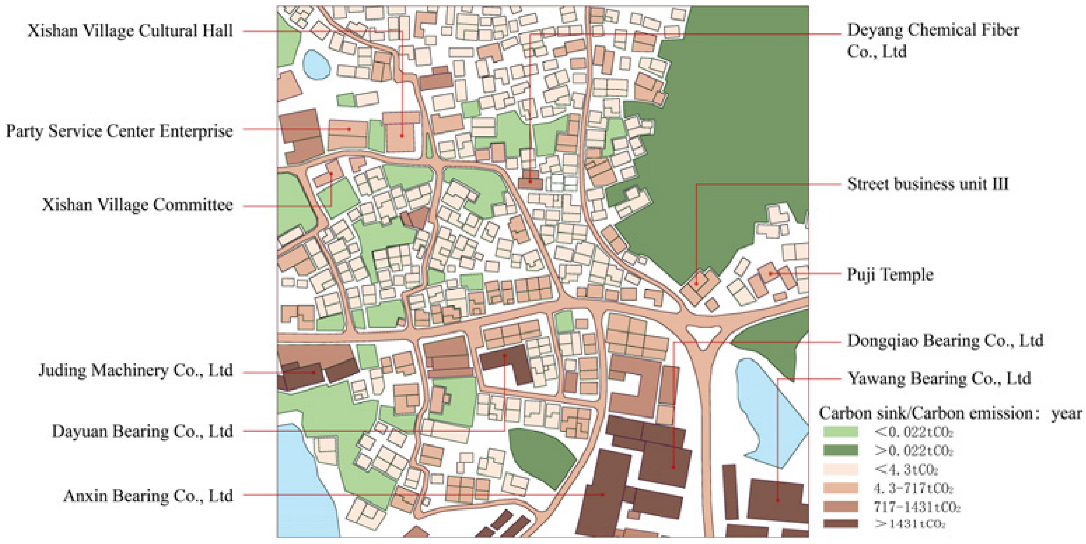
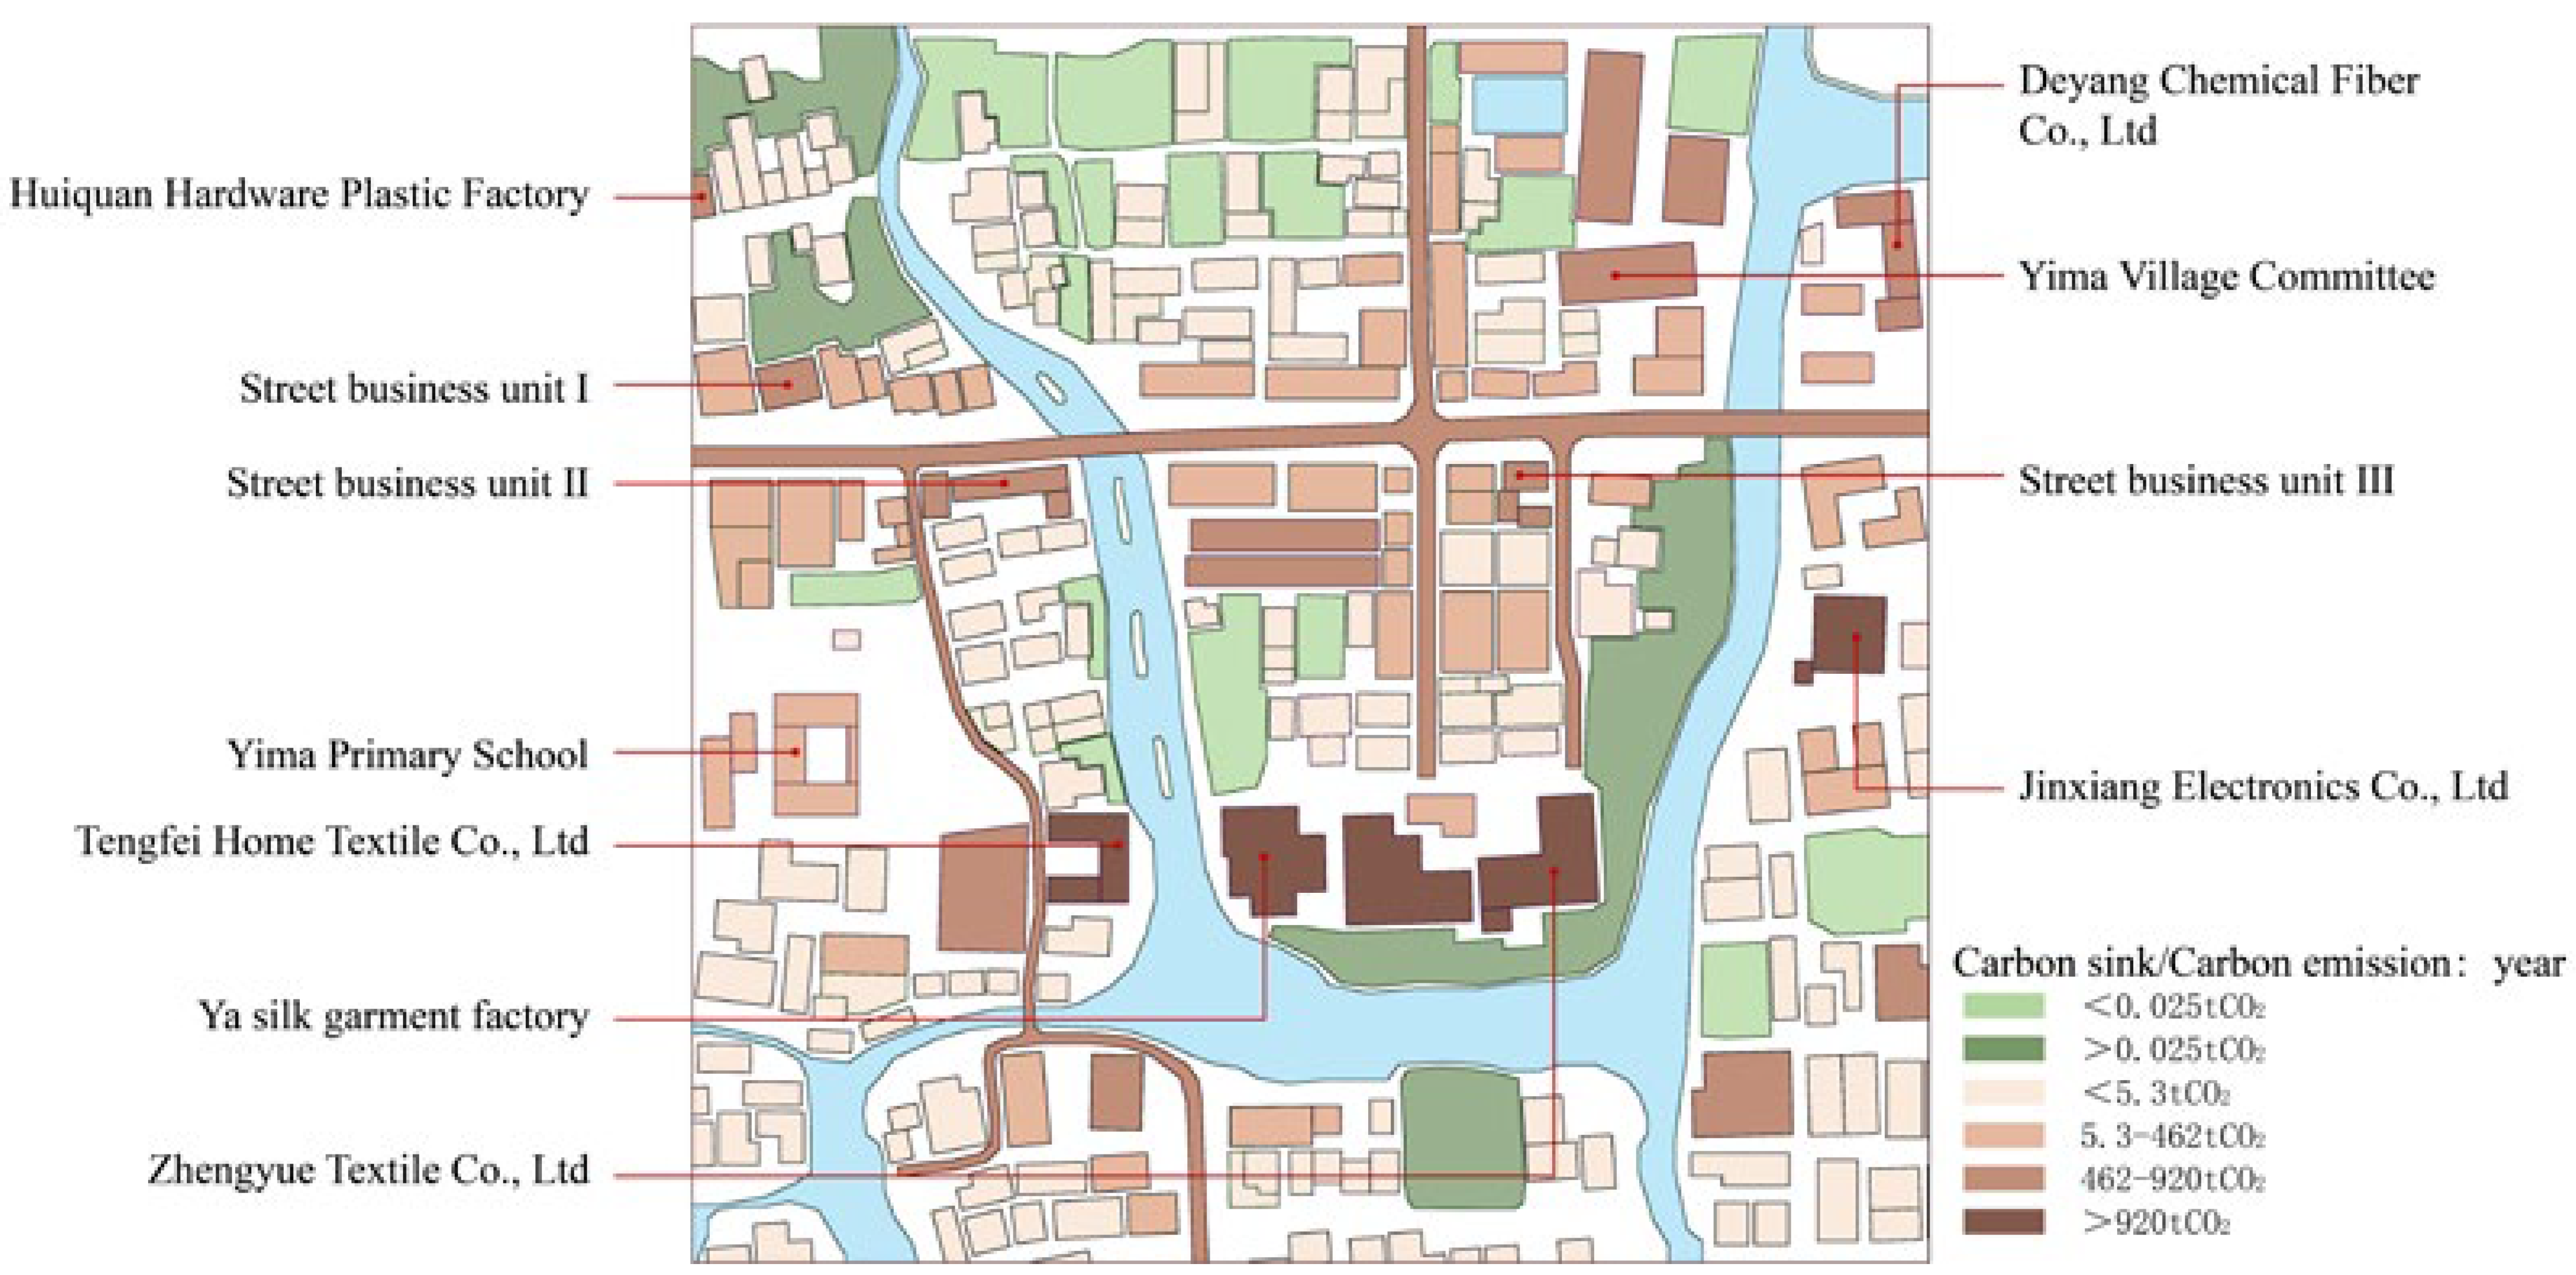
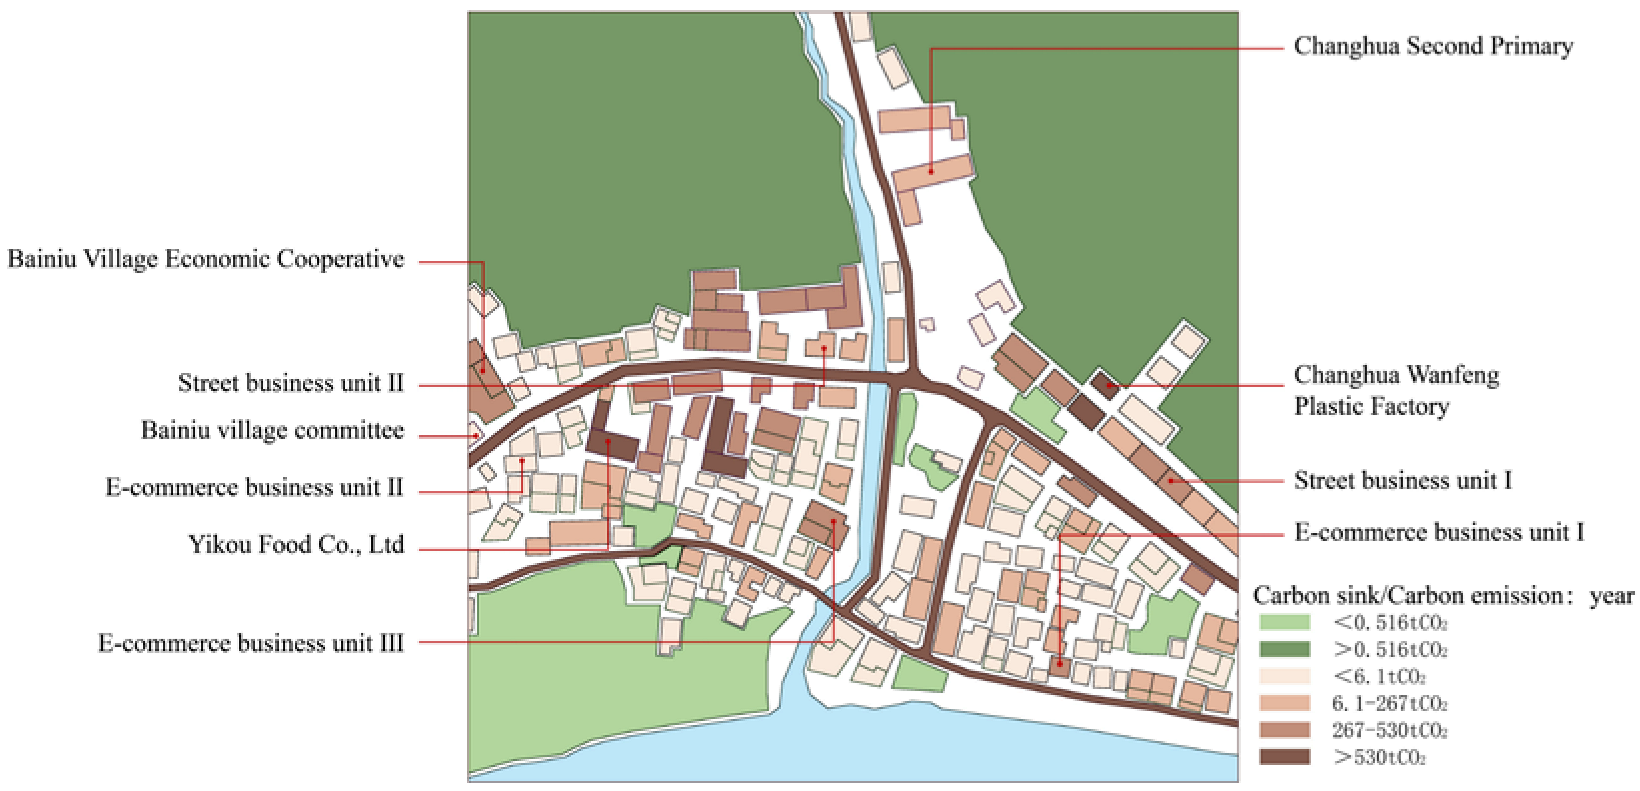
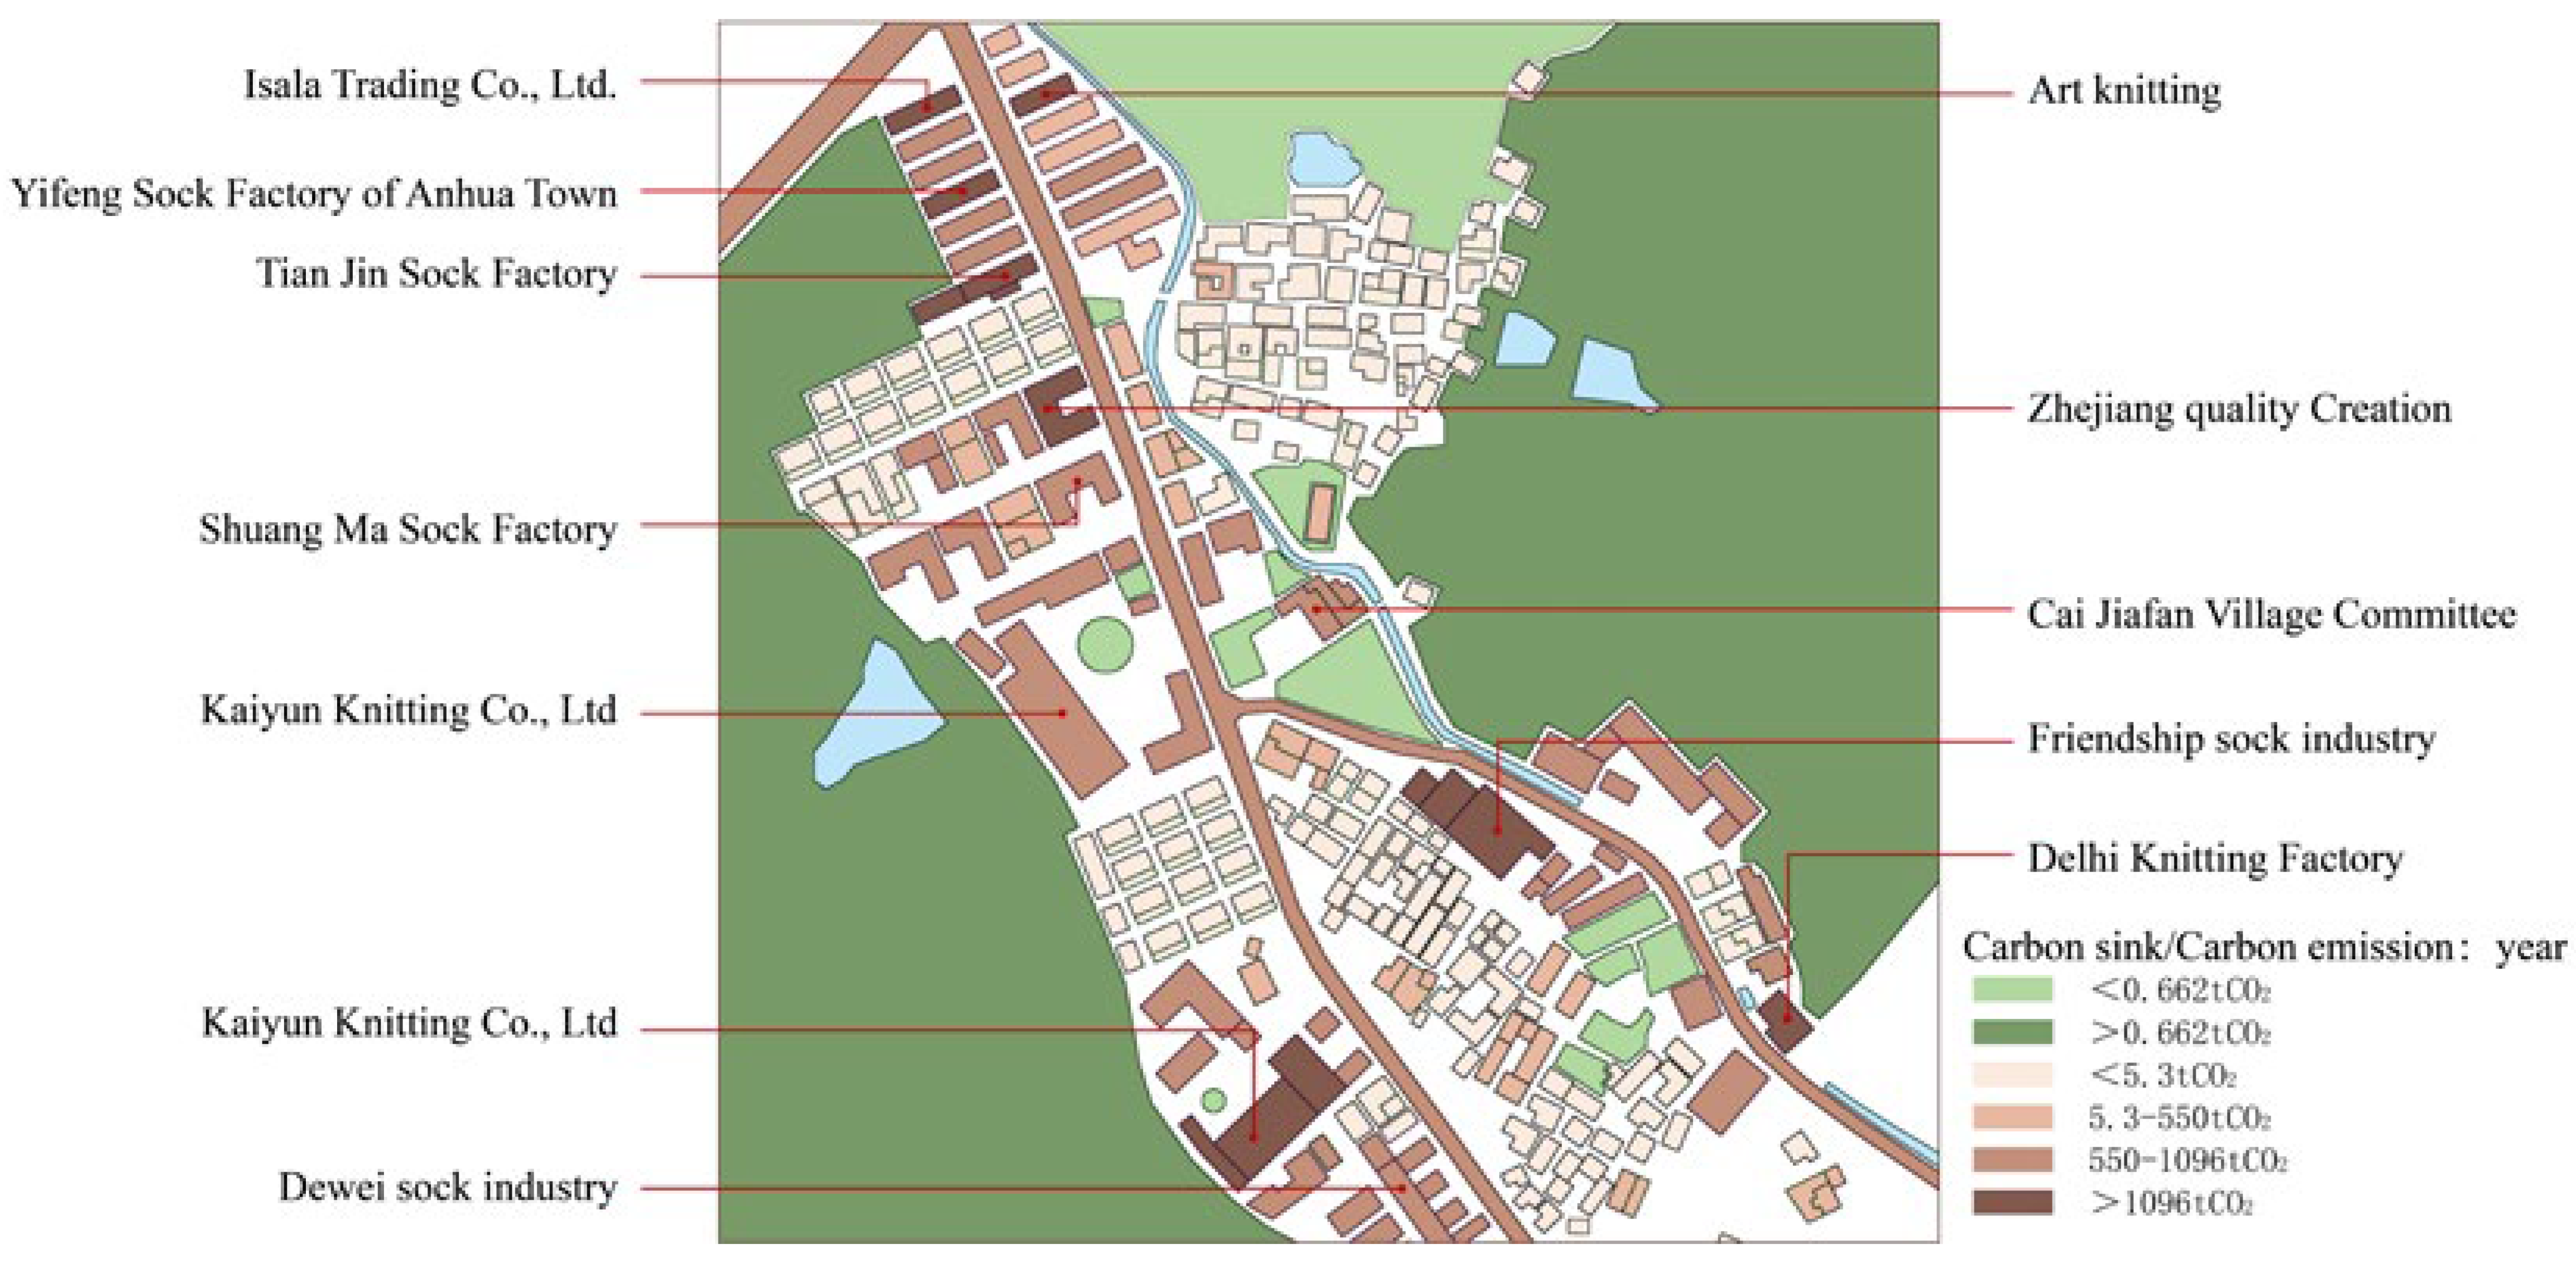
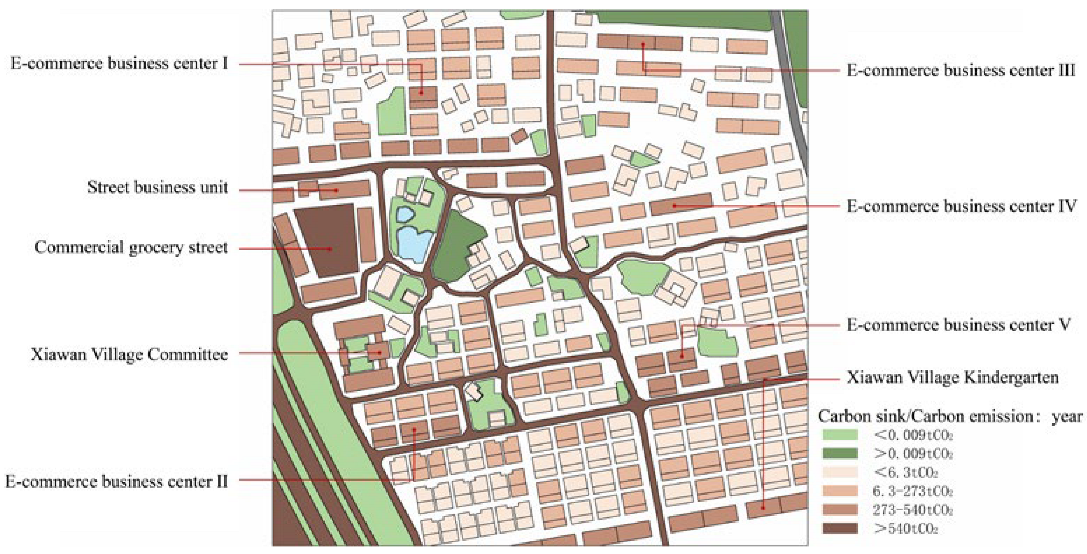
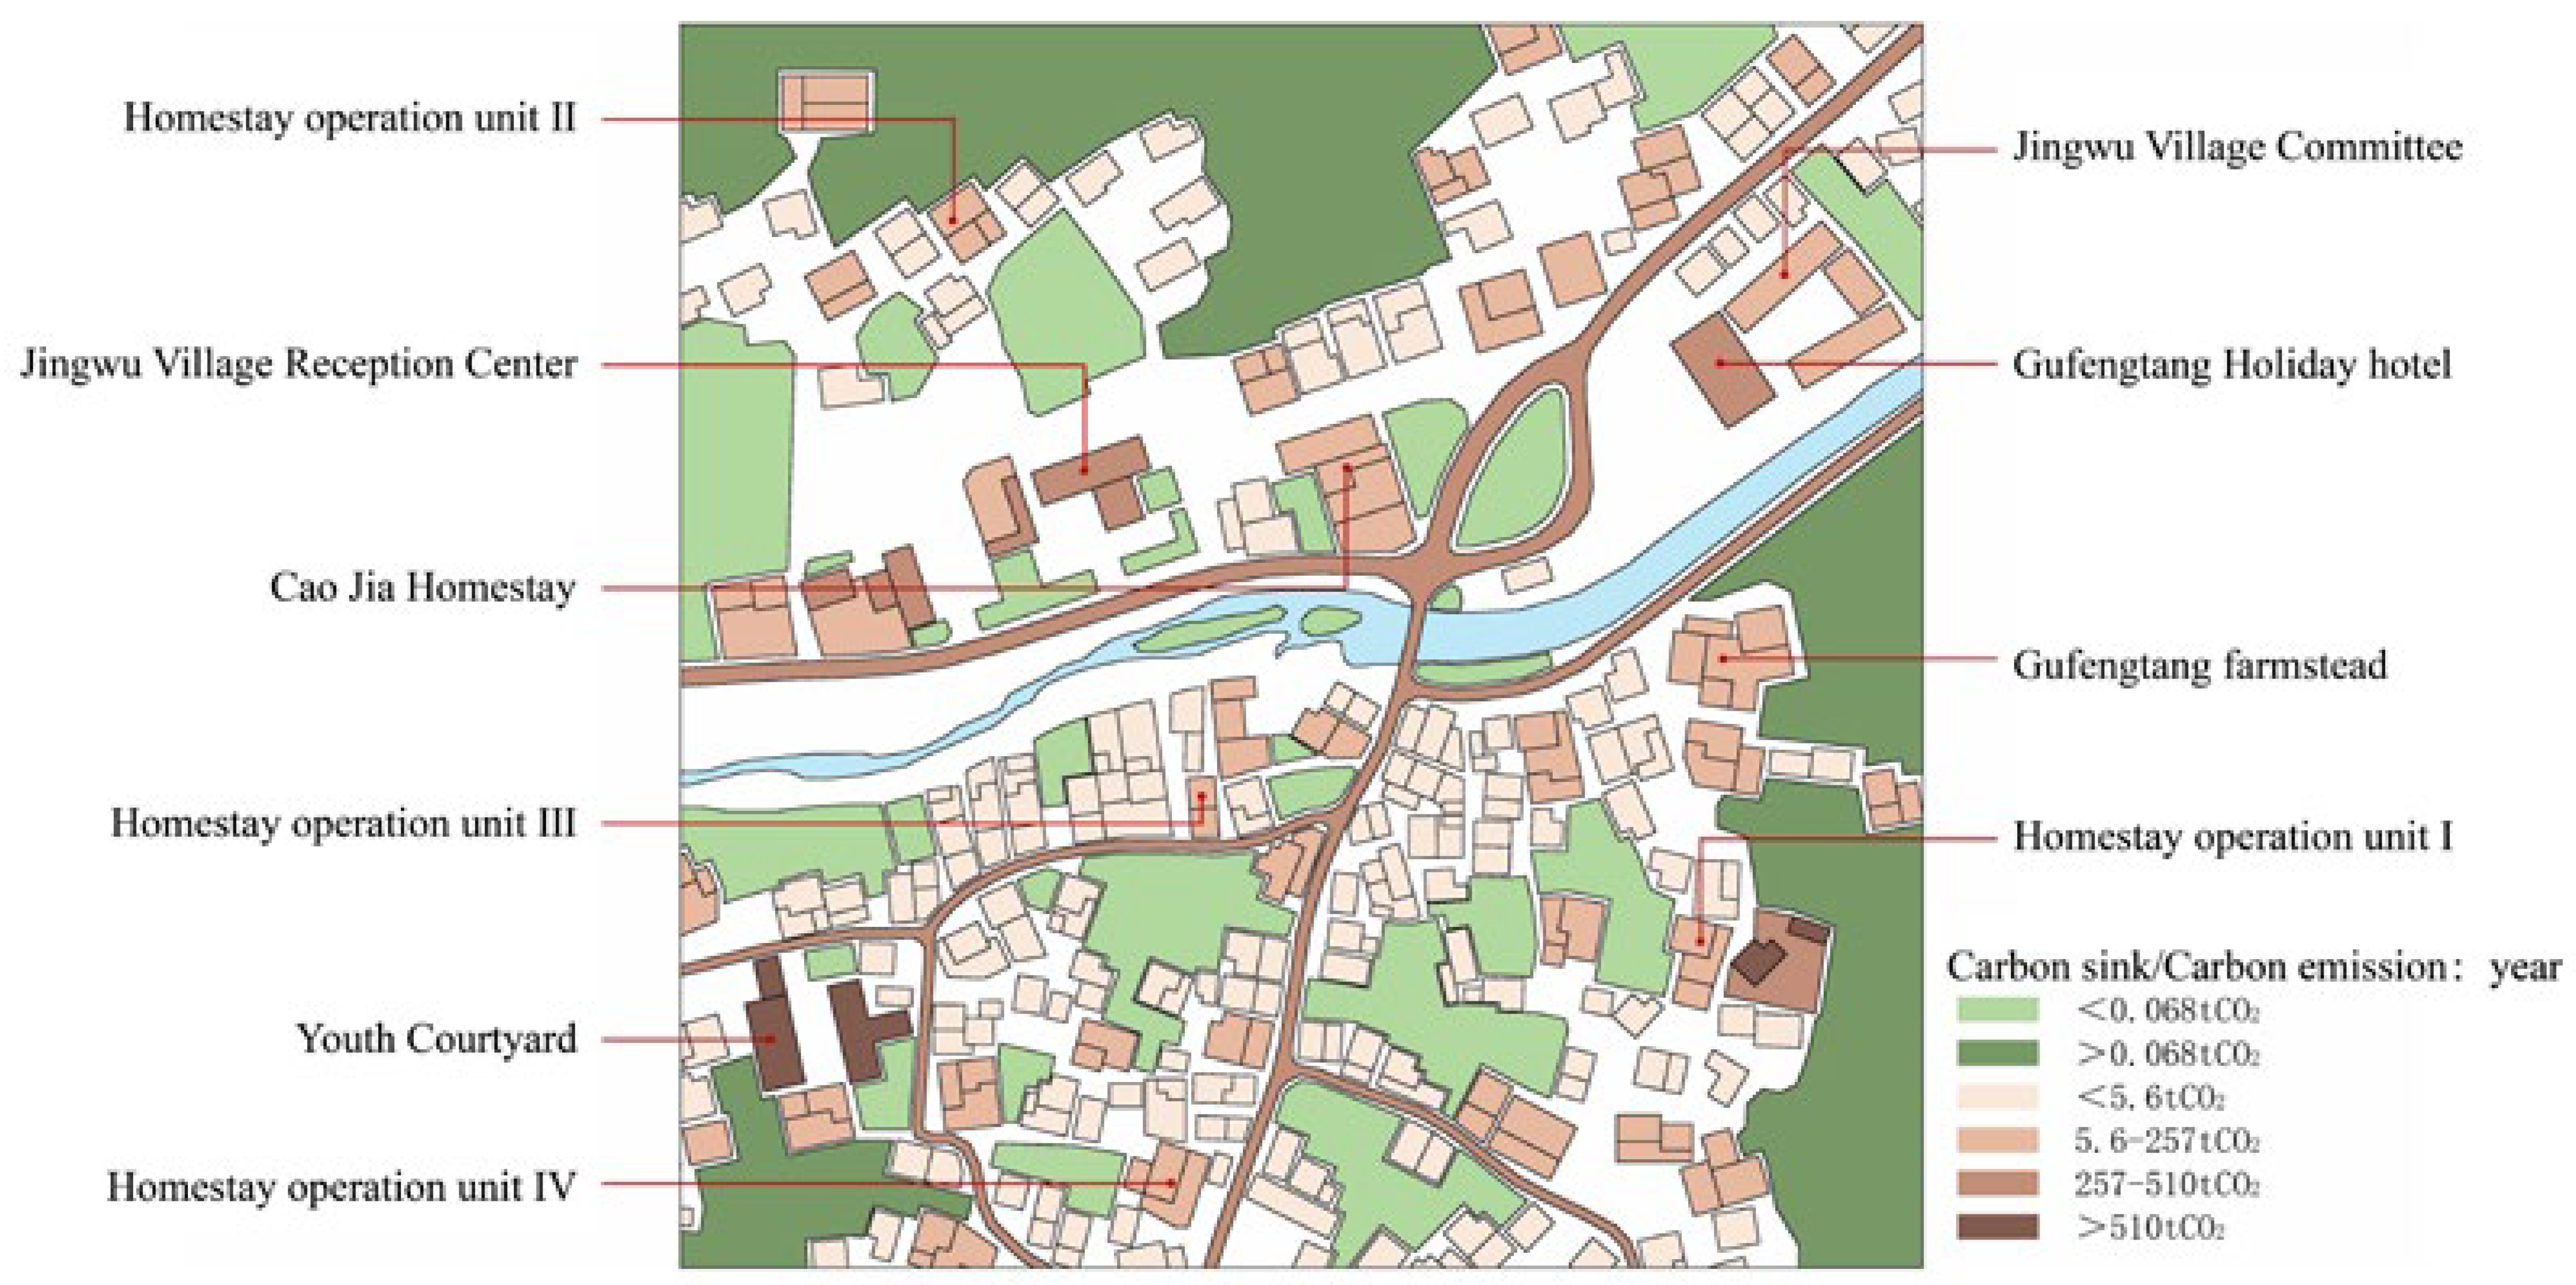
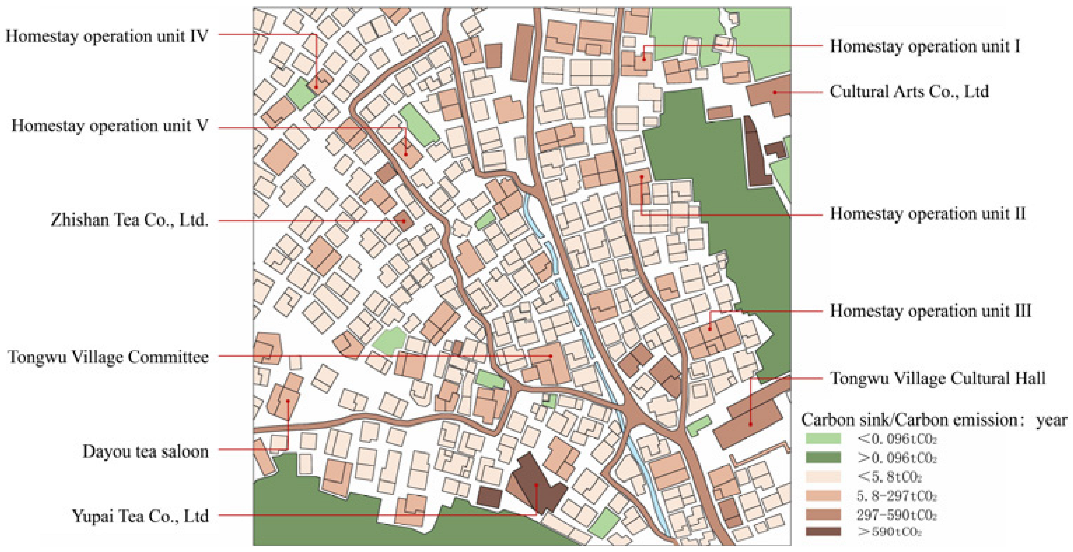
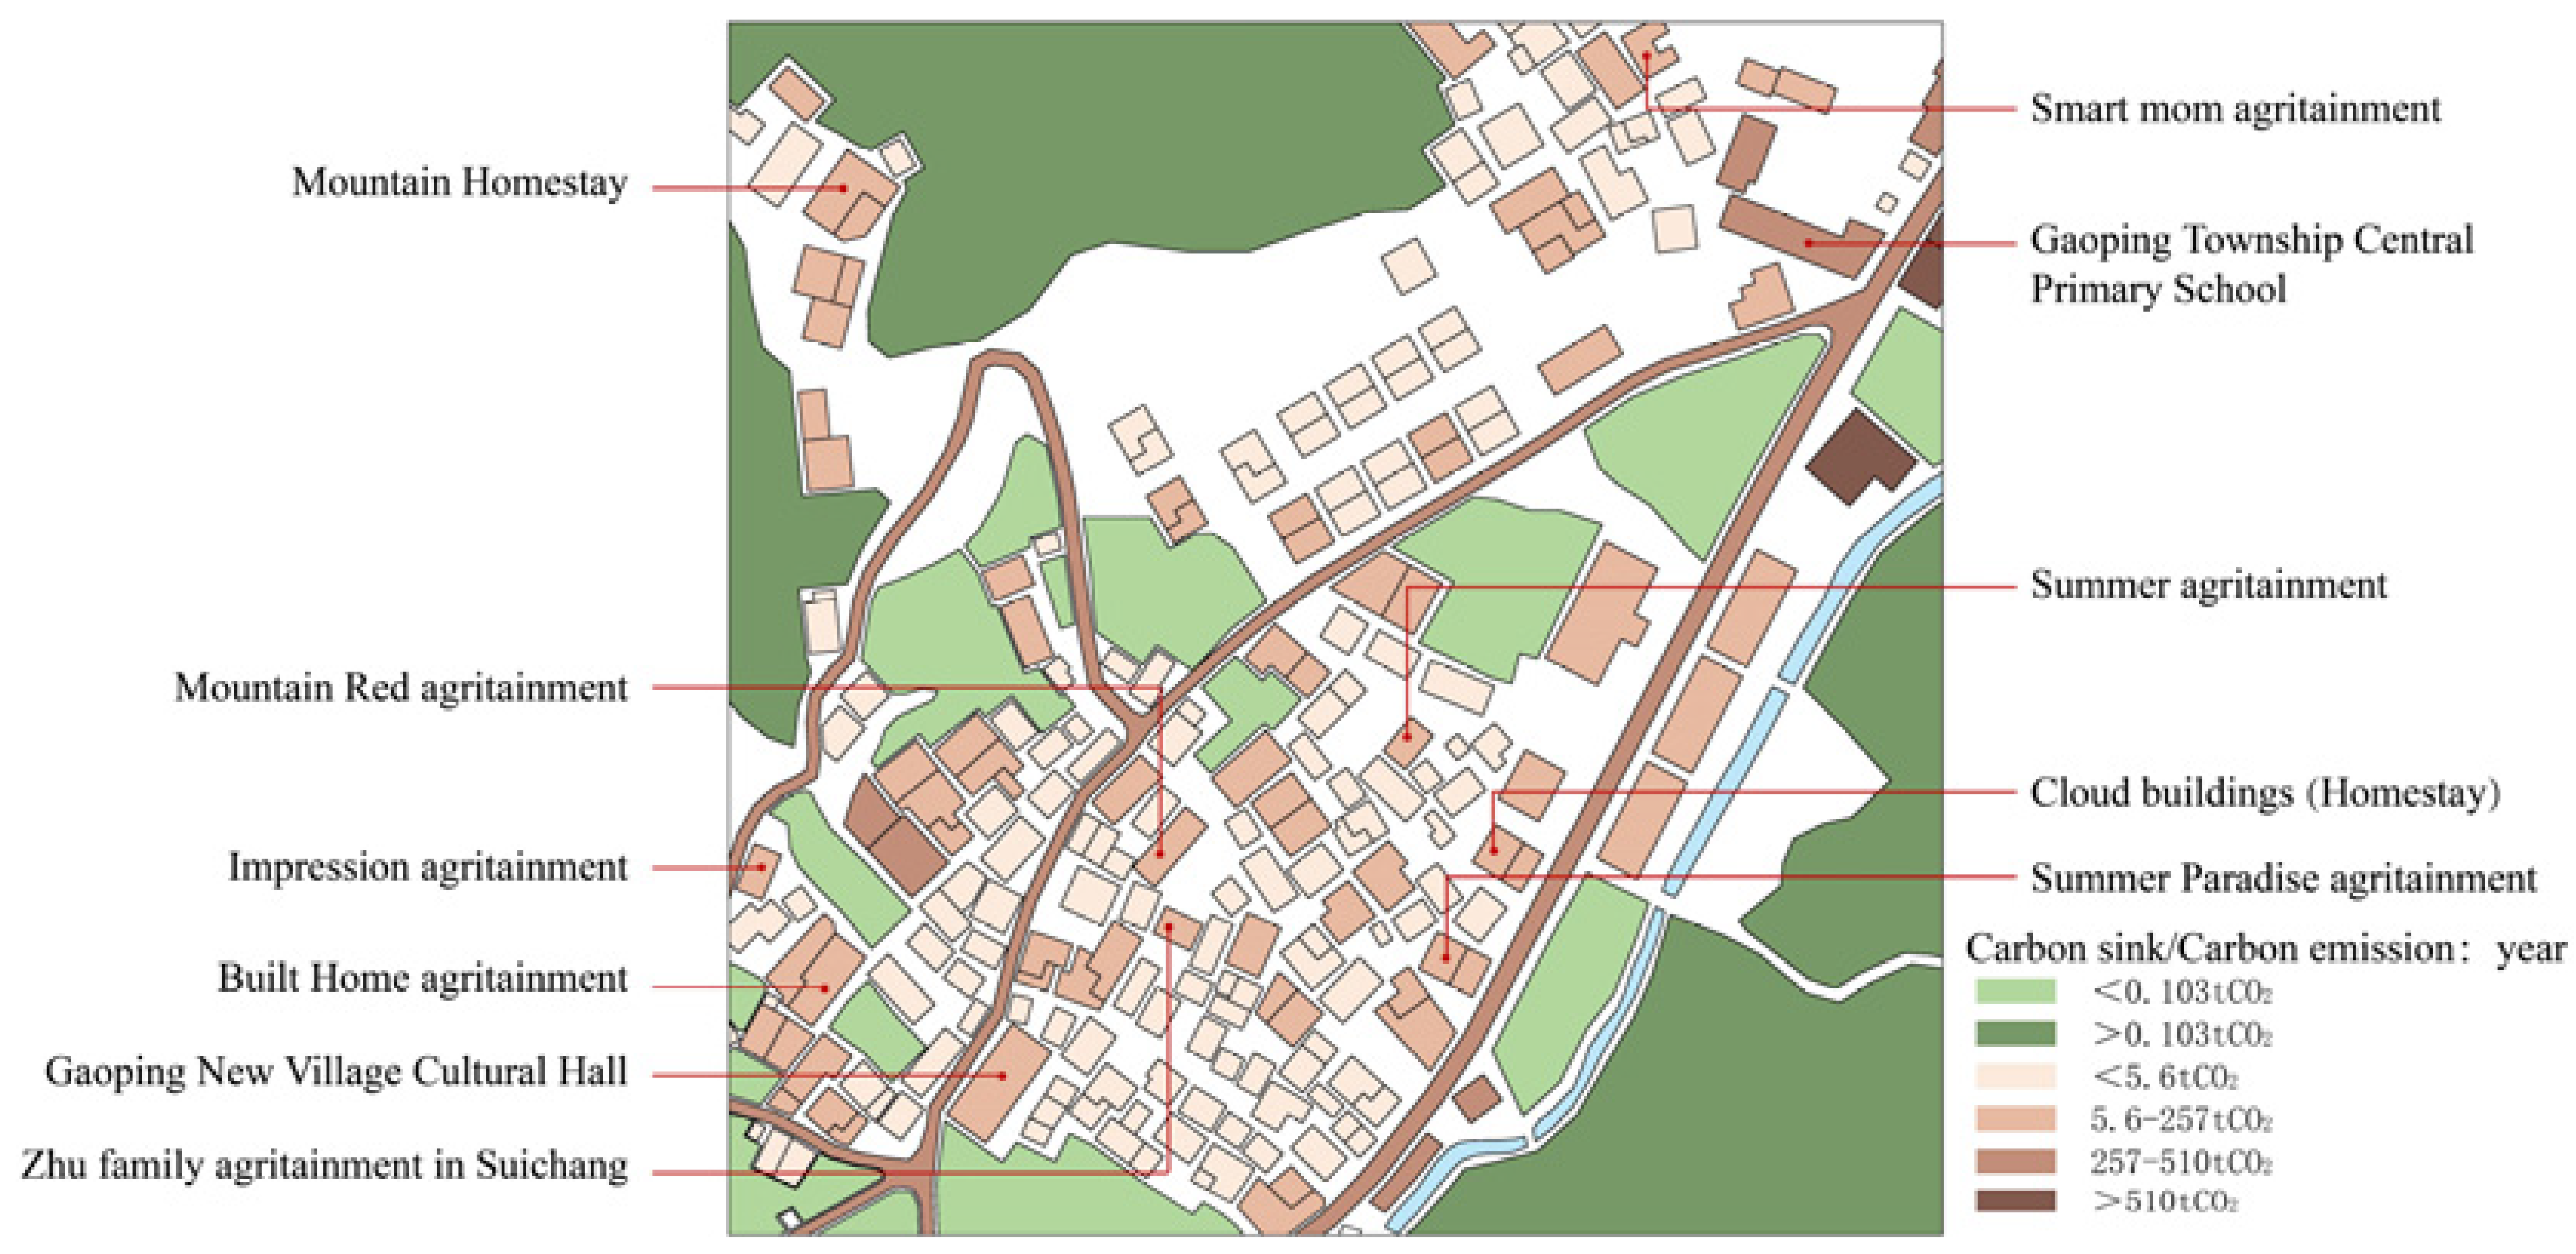
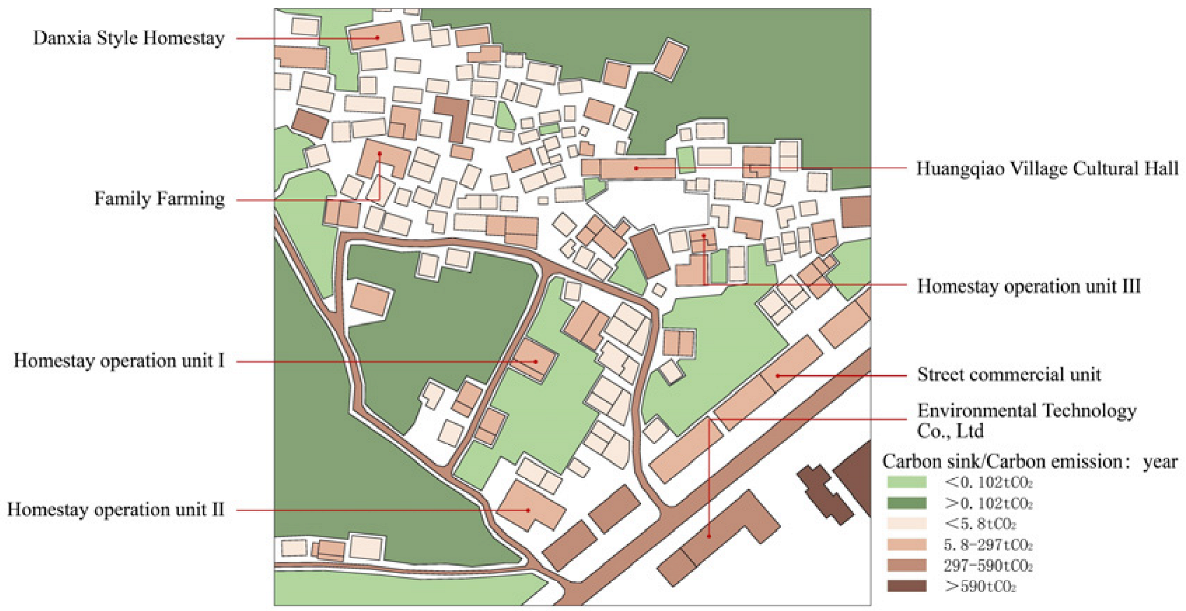
Publisher’s Note: MDPI stays neutral with regard to jurisdictional claims in published maps and institutional affiliations. |
© 2022 by the authors. Licensee MDPI, Basel, Switzerland. This article is an open access article distributed under the terms and conditions of the Creative Commons Attribution (CC BY) license (https://creativecommons.org/licenses/by/4.0/).