


Exploring the Technological Changes of Green Agriculture in China: Evidence from Patent Data (1998–2021)

Abstract
:1. Introduction
- RQ1
- : What is the temporal development of green patents in agriculture?
- RQ2
- Is the spatial distribution of green patents in agriculture balanced?
- RQ3
- What is the development of core technologies of green patents in agriculture?
2. Data and Methods
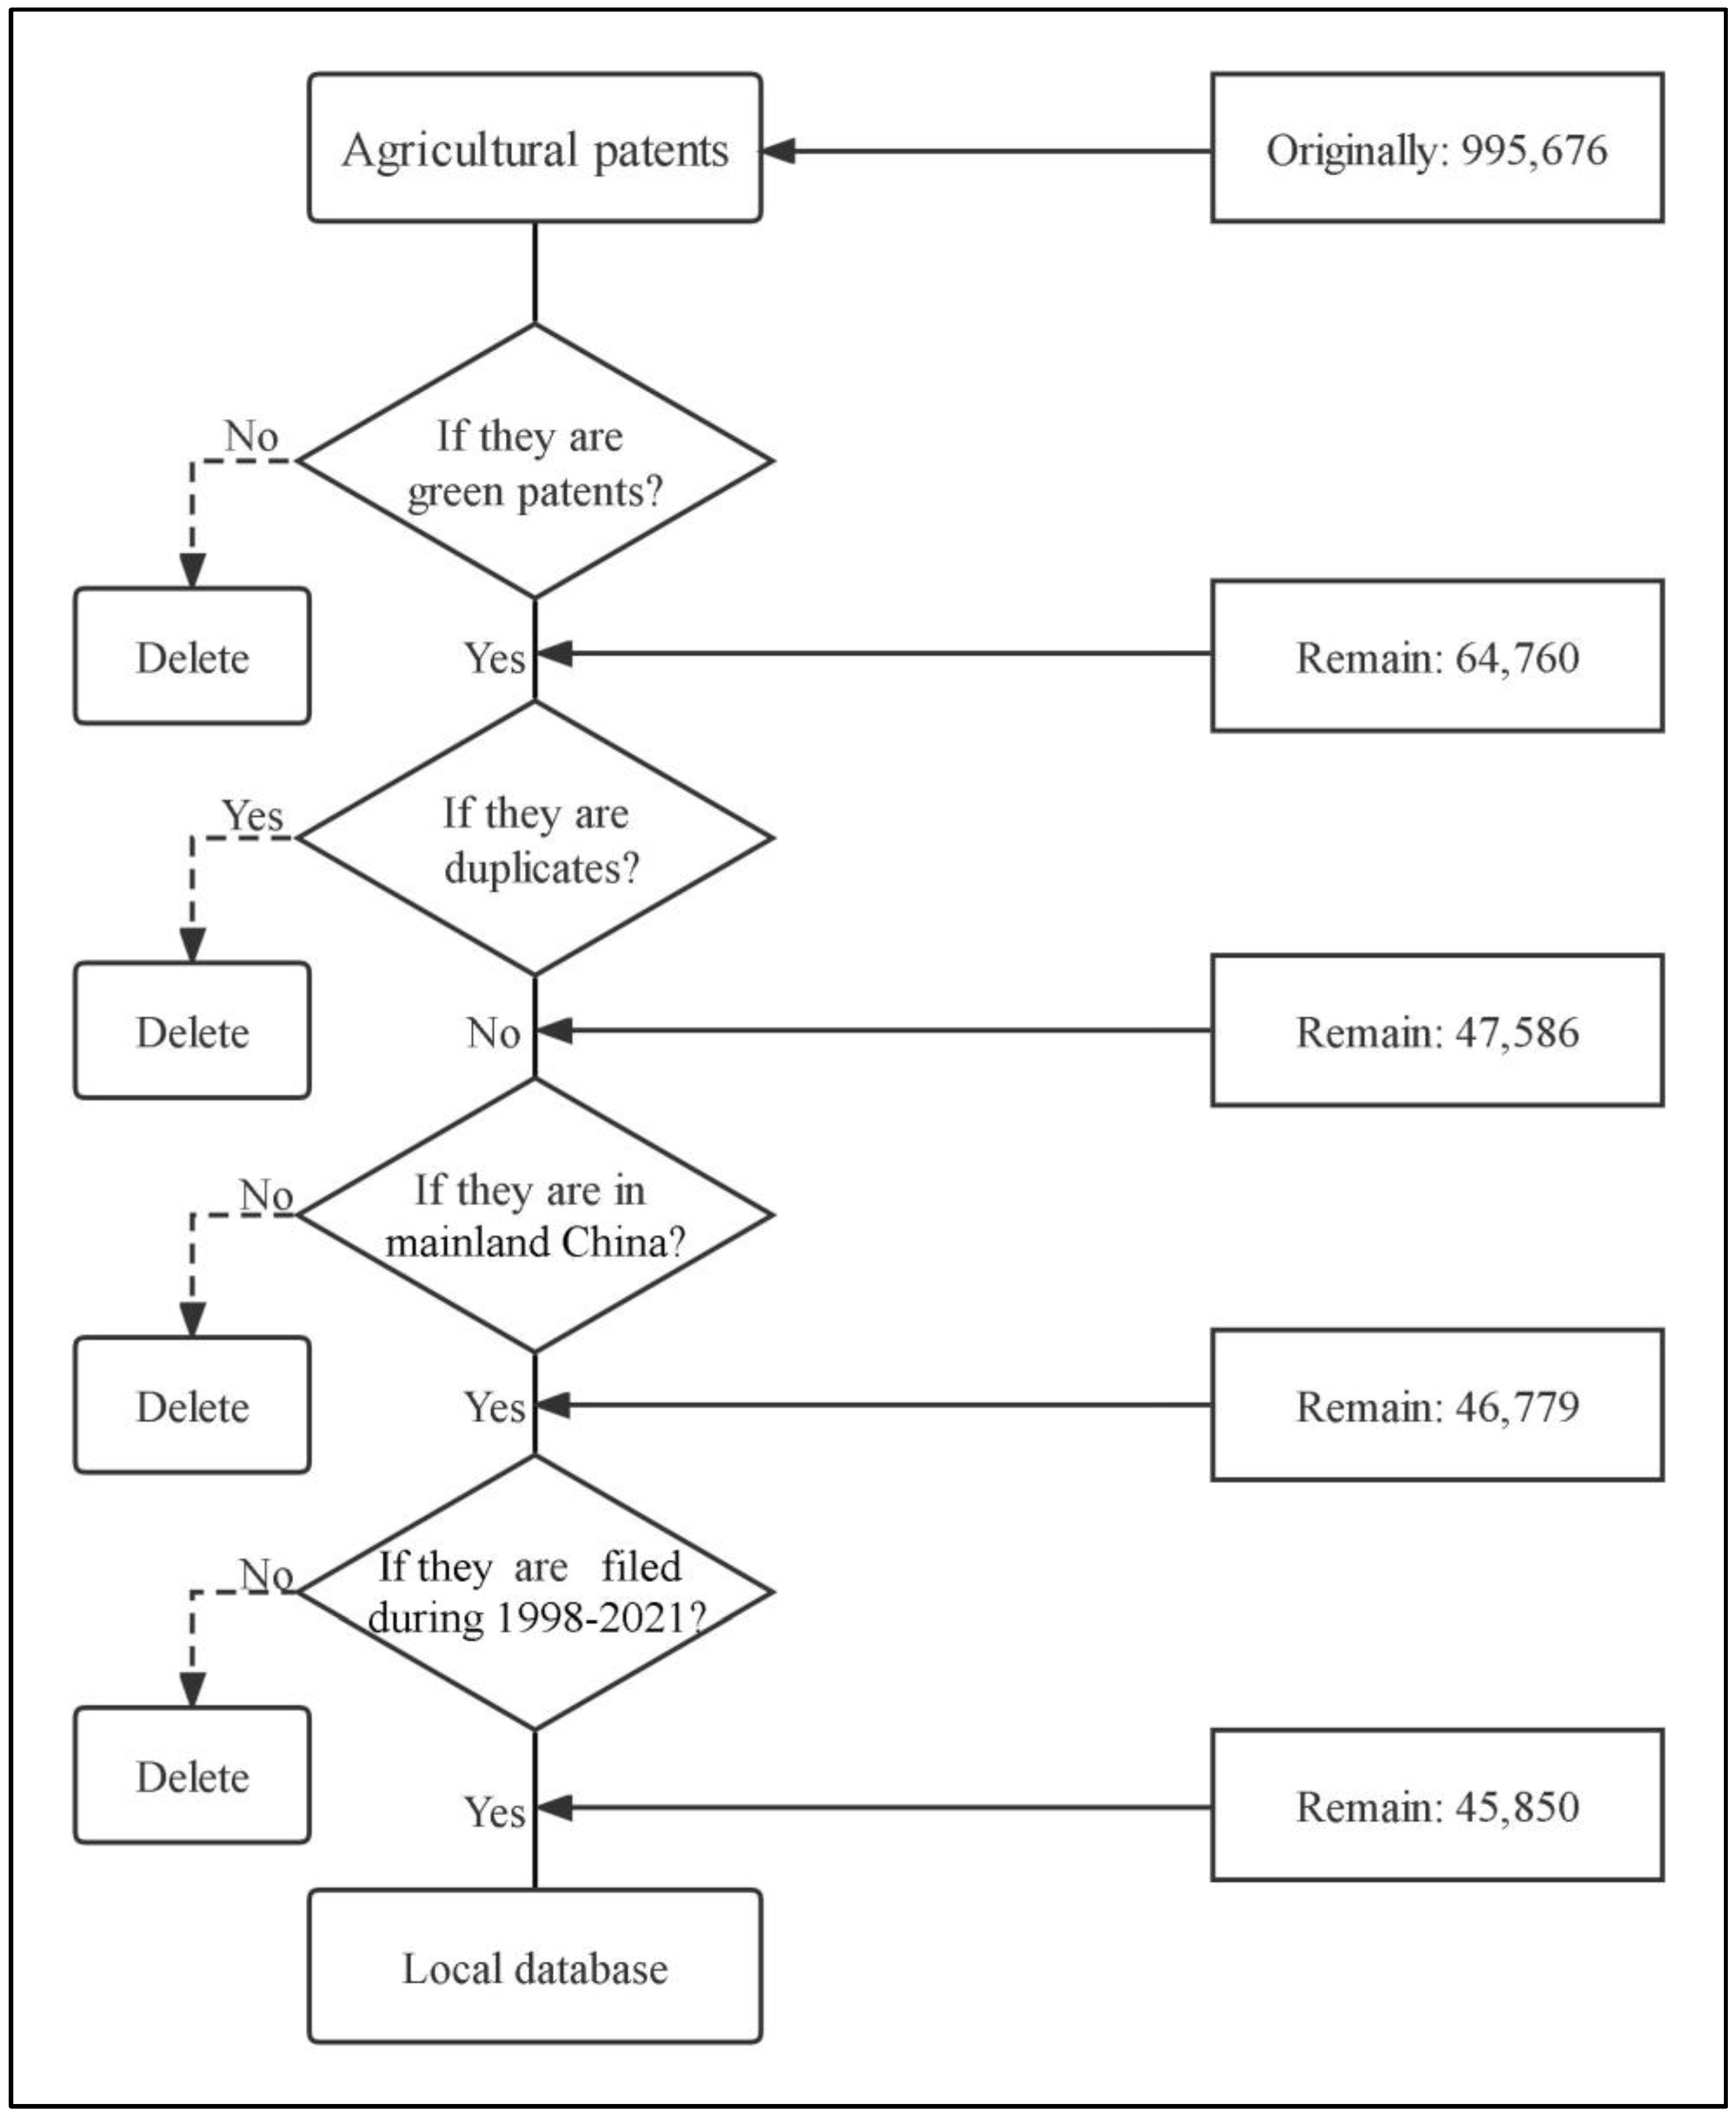
2.1. Data
2.2. Methods
3. Results
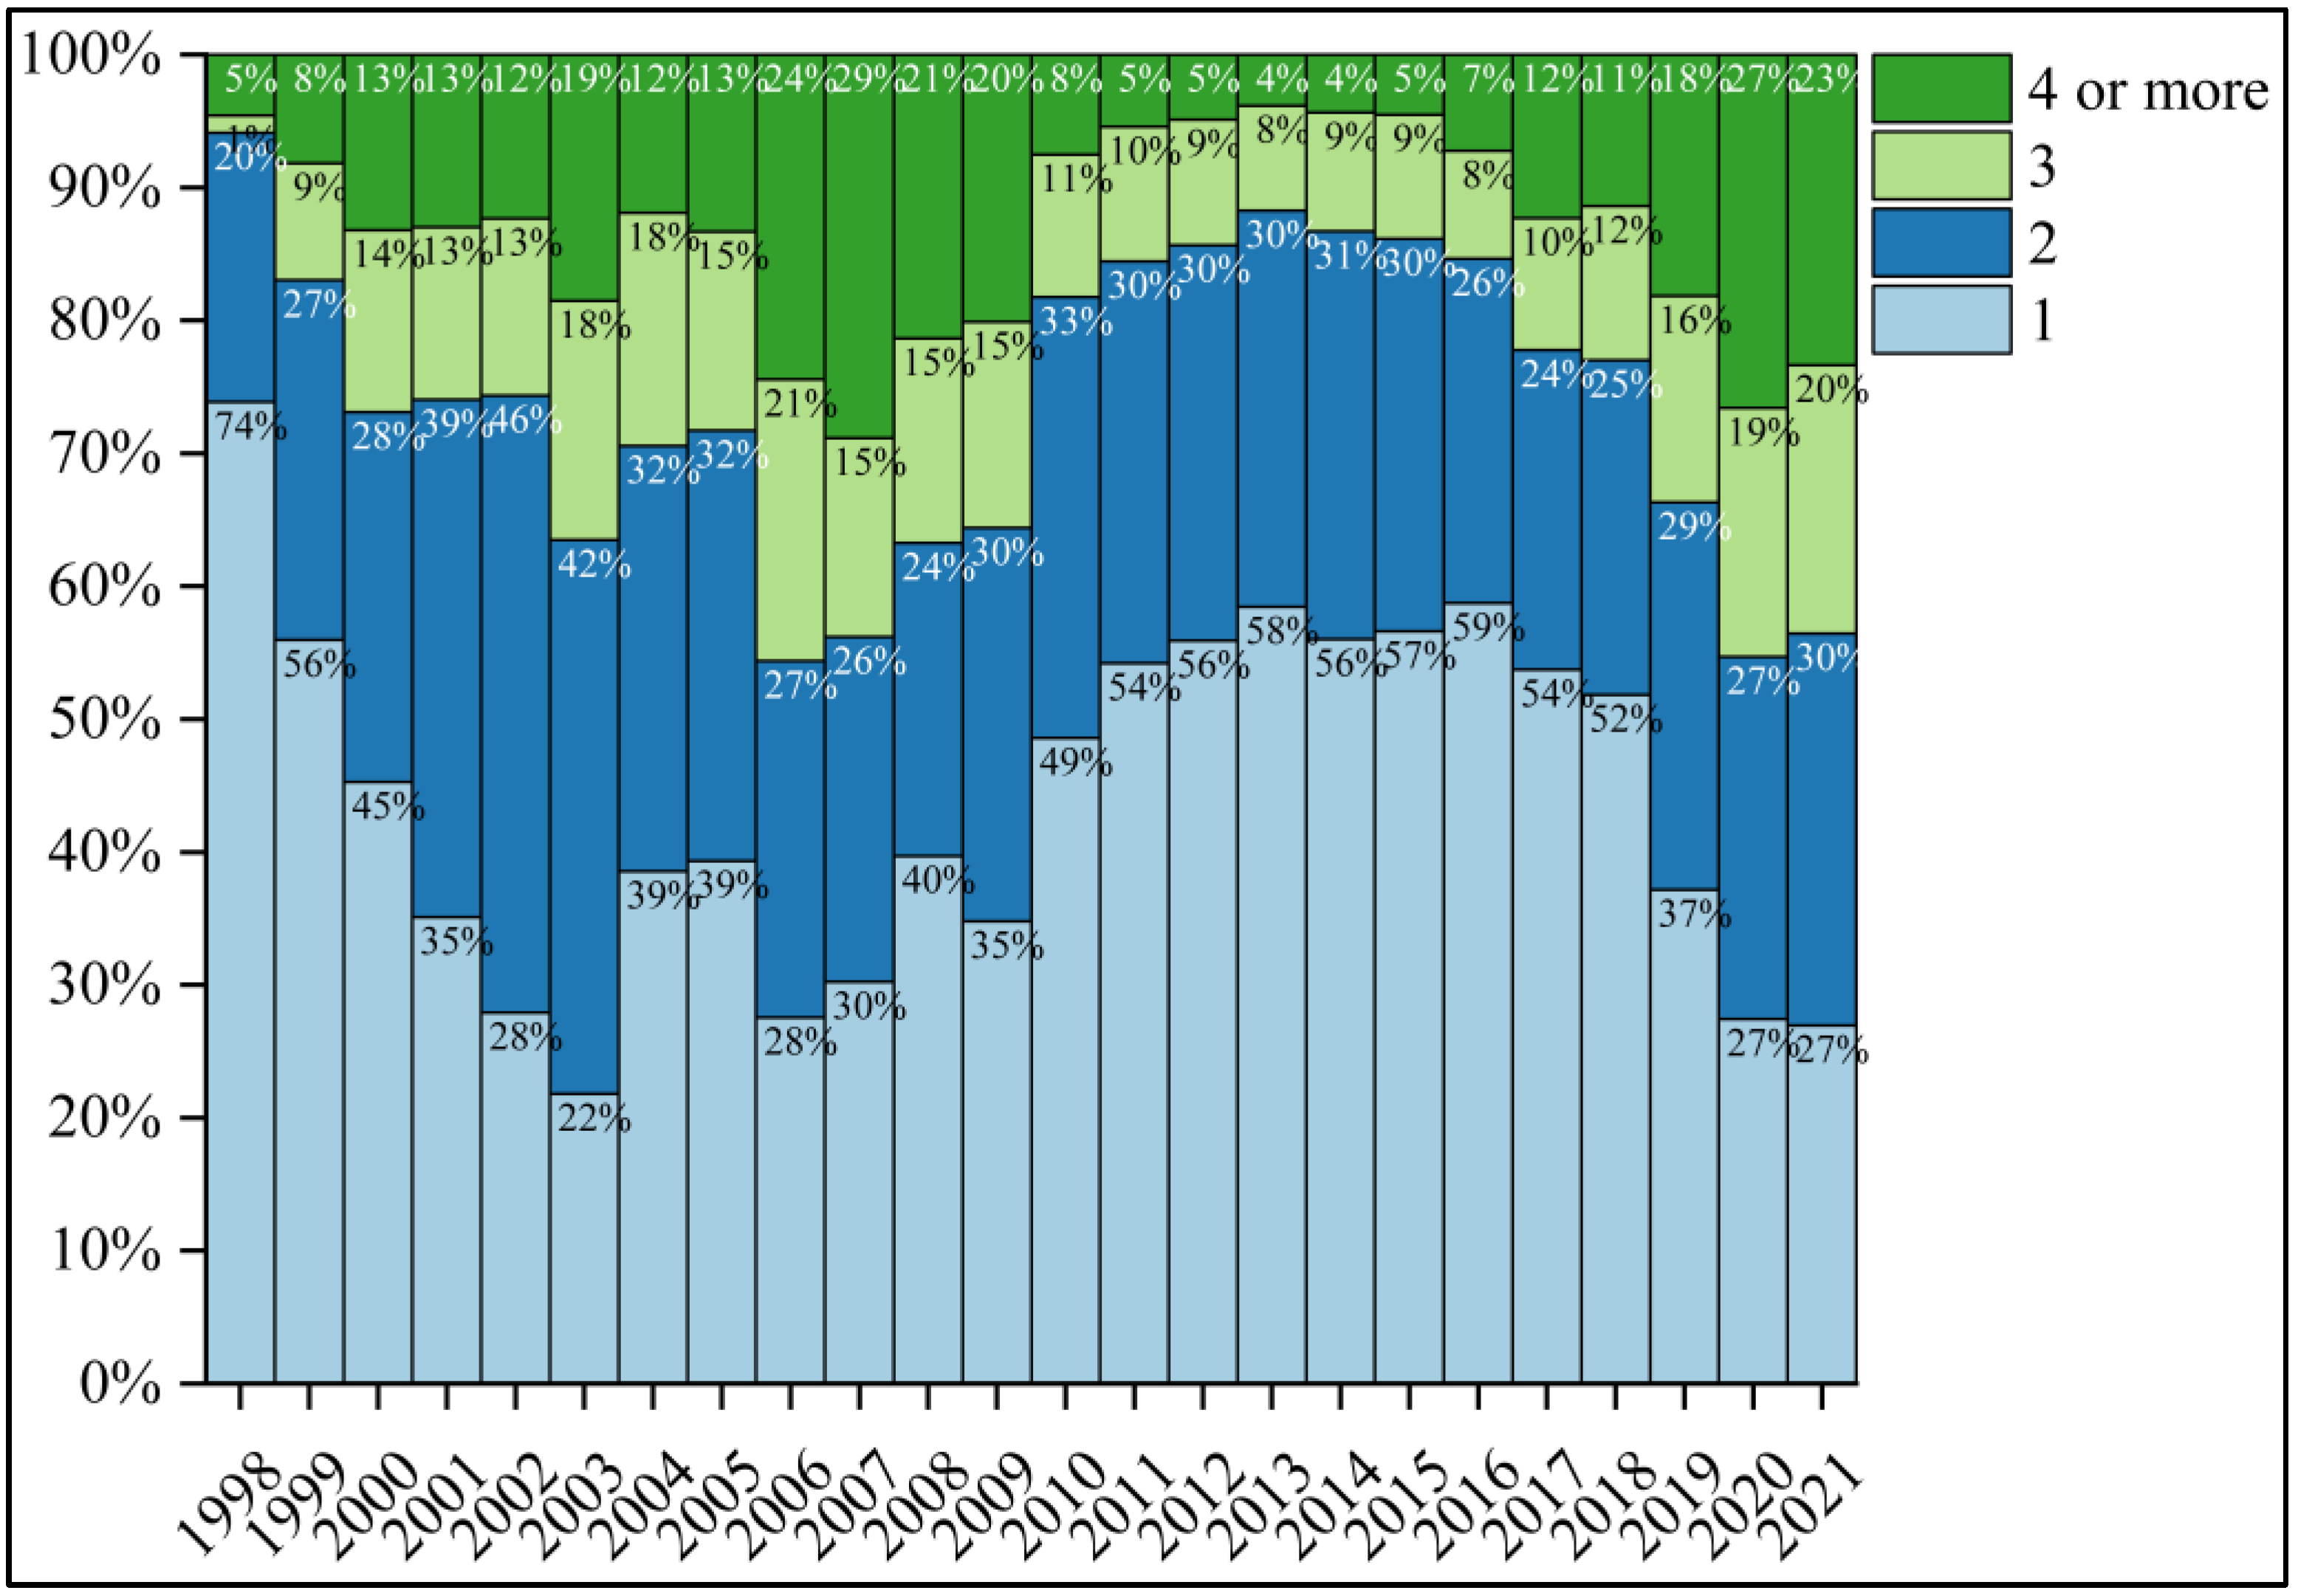
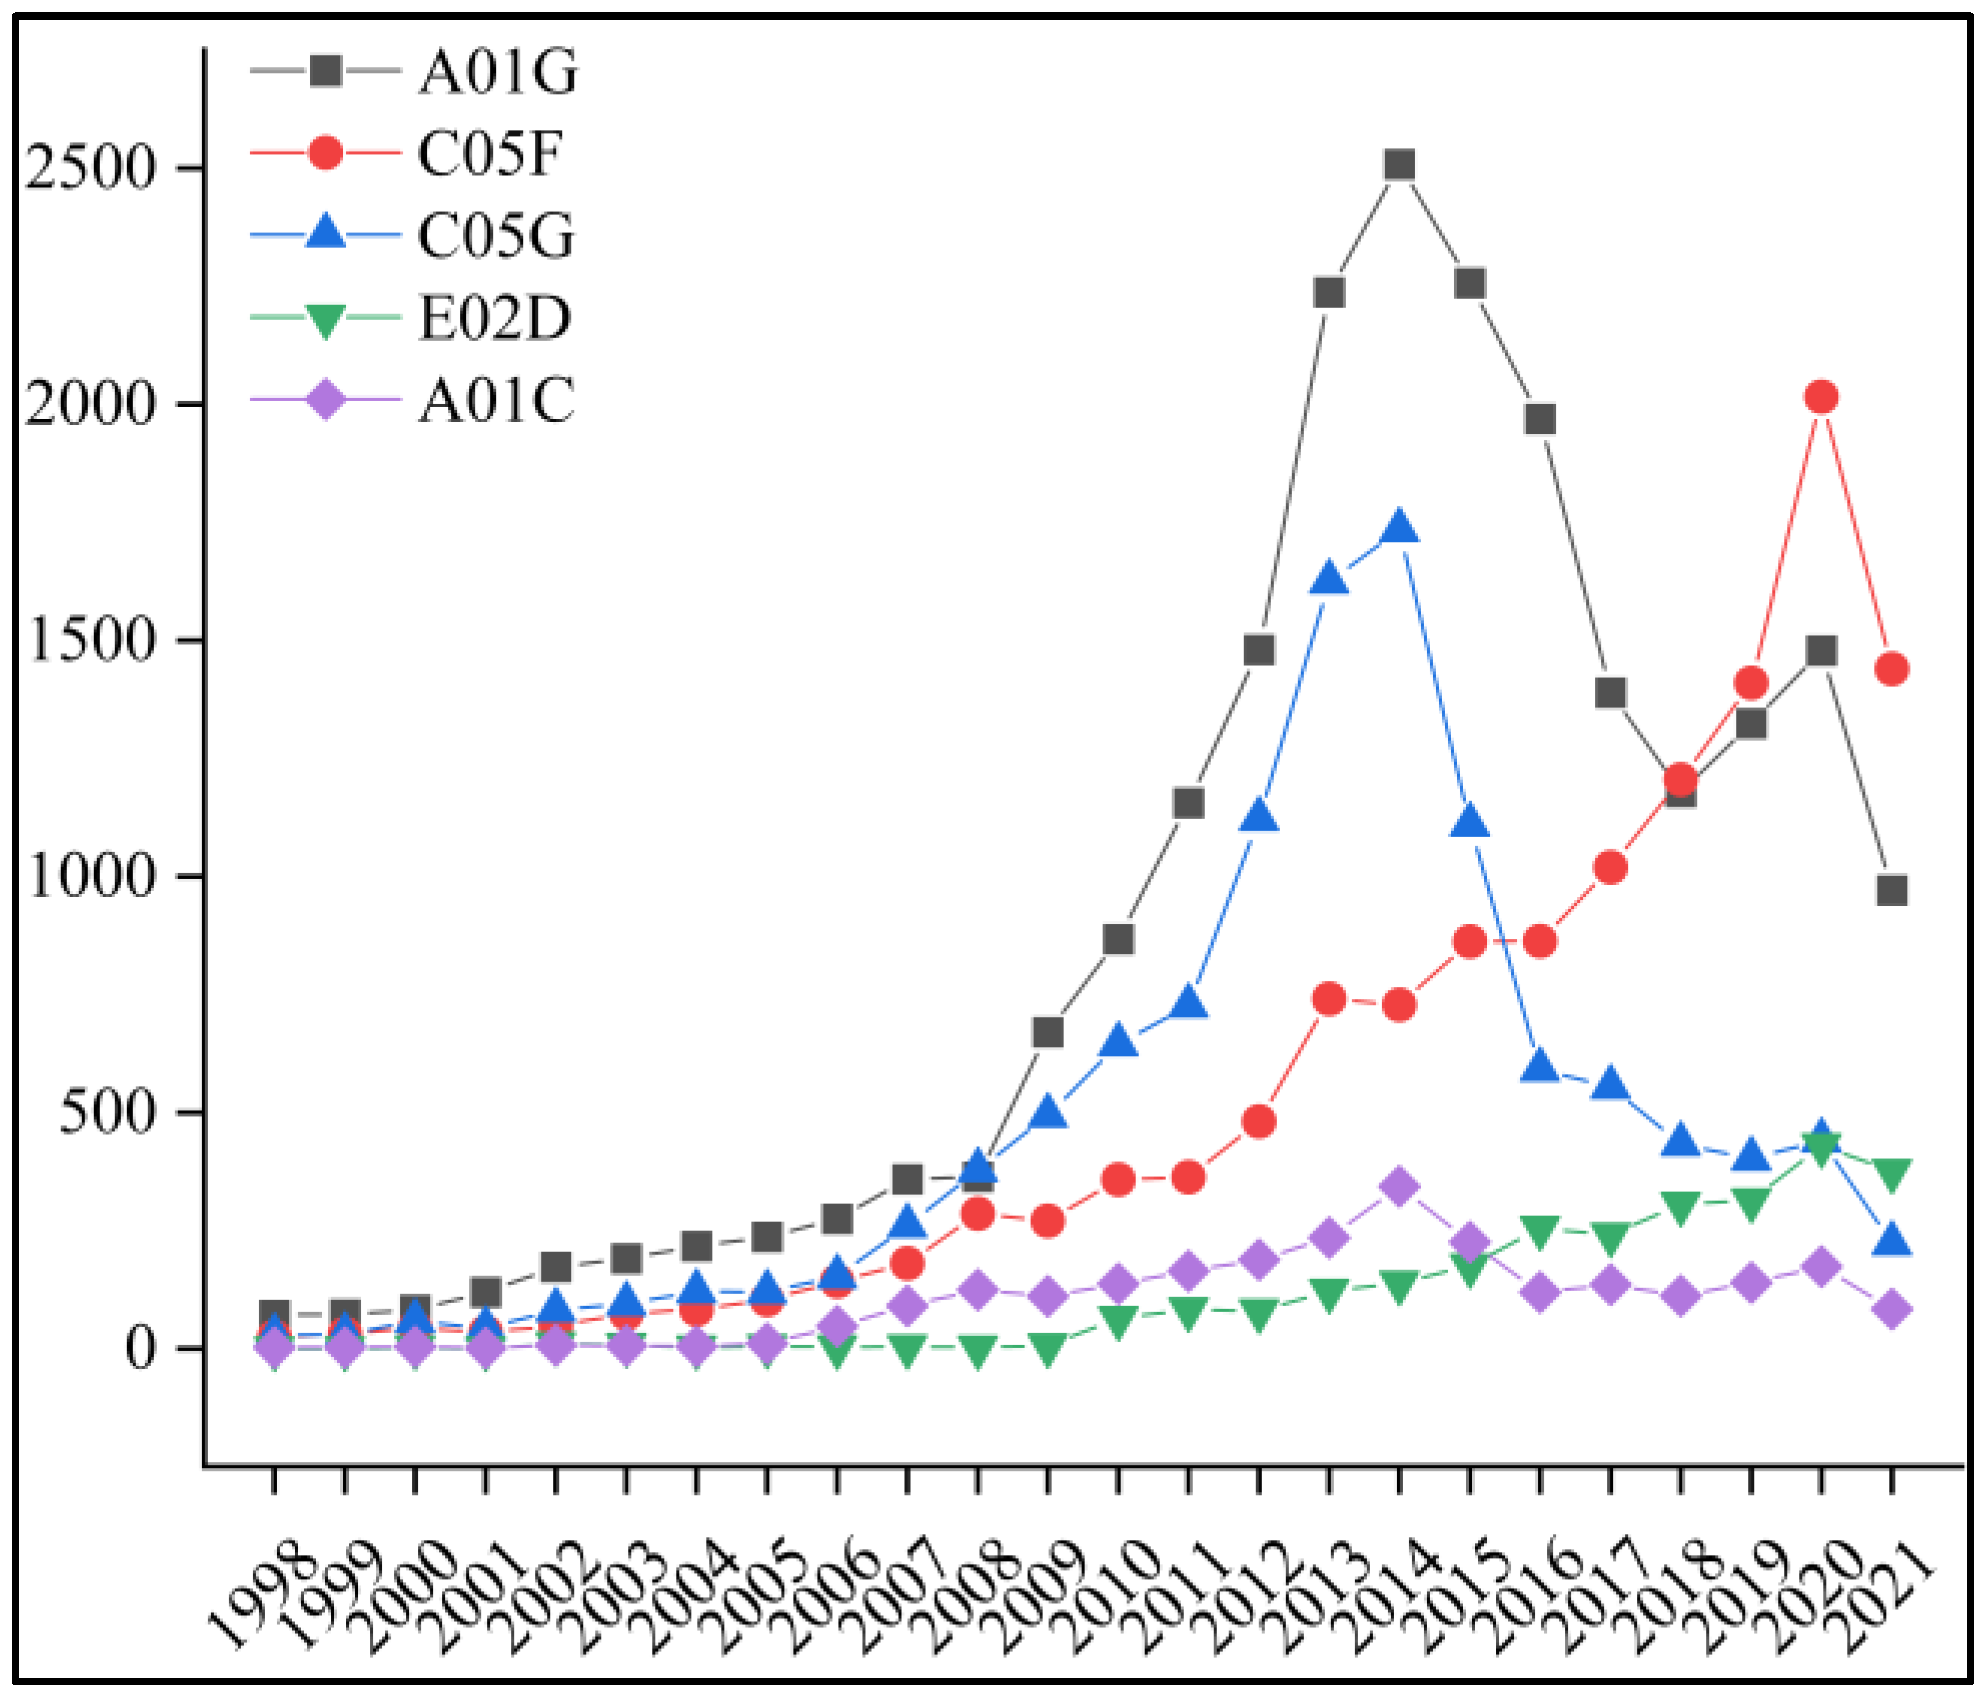
3.1. Temporal Distribution of Agricultural Green Patents
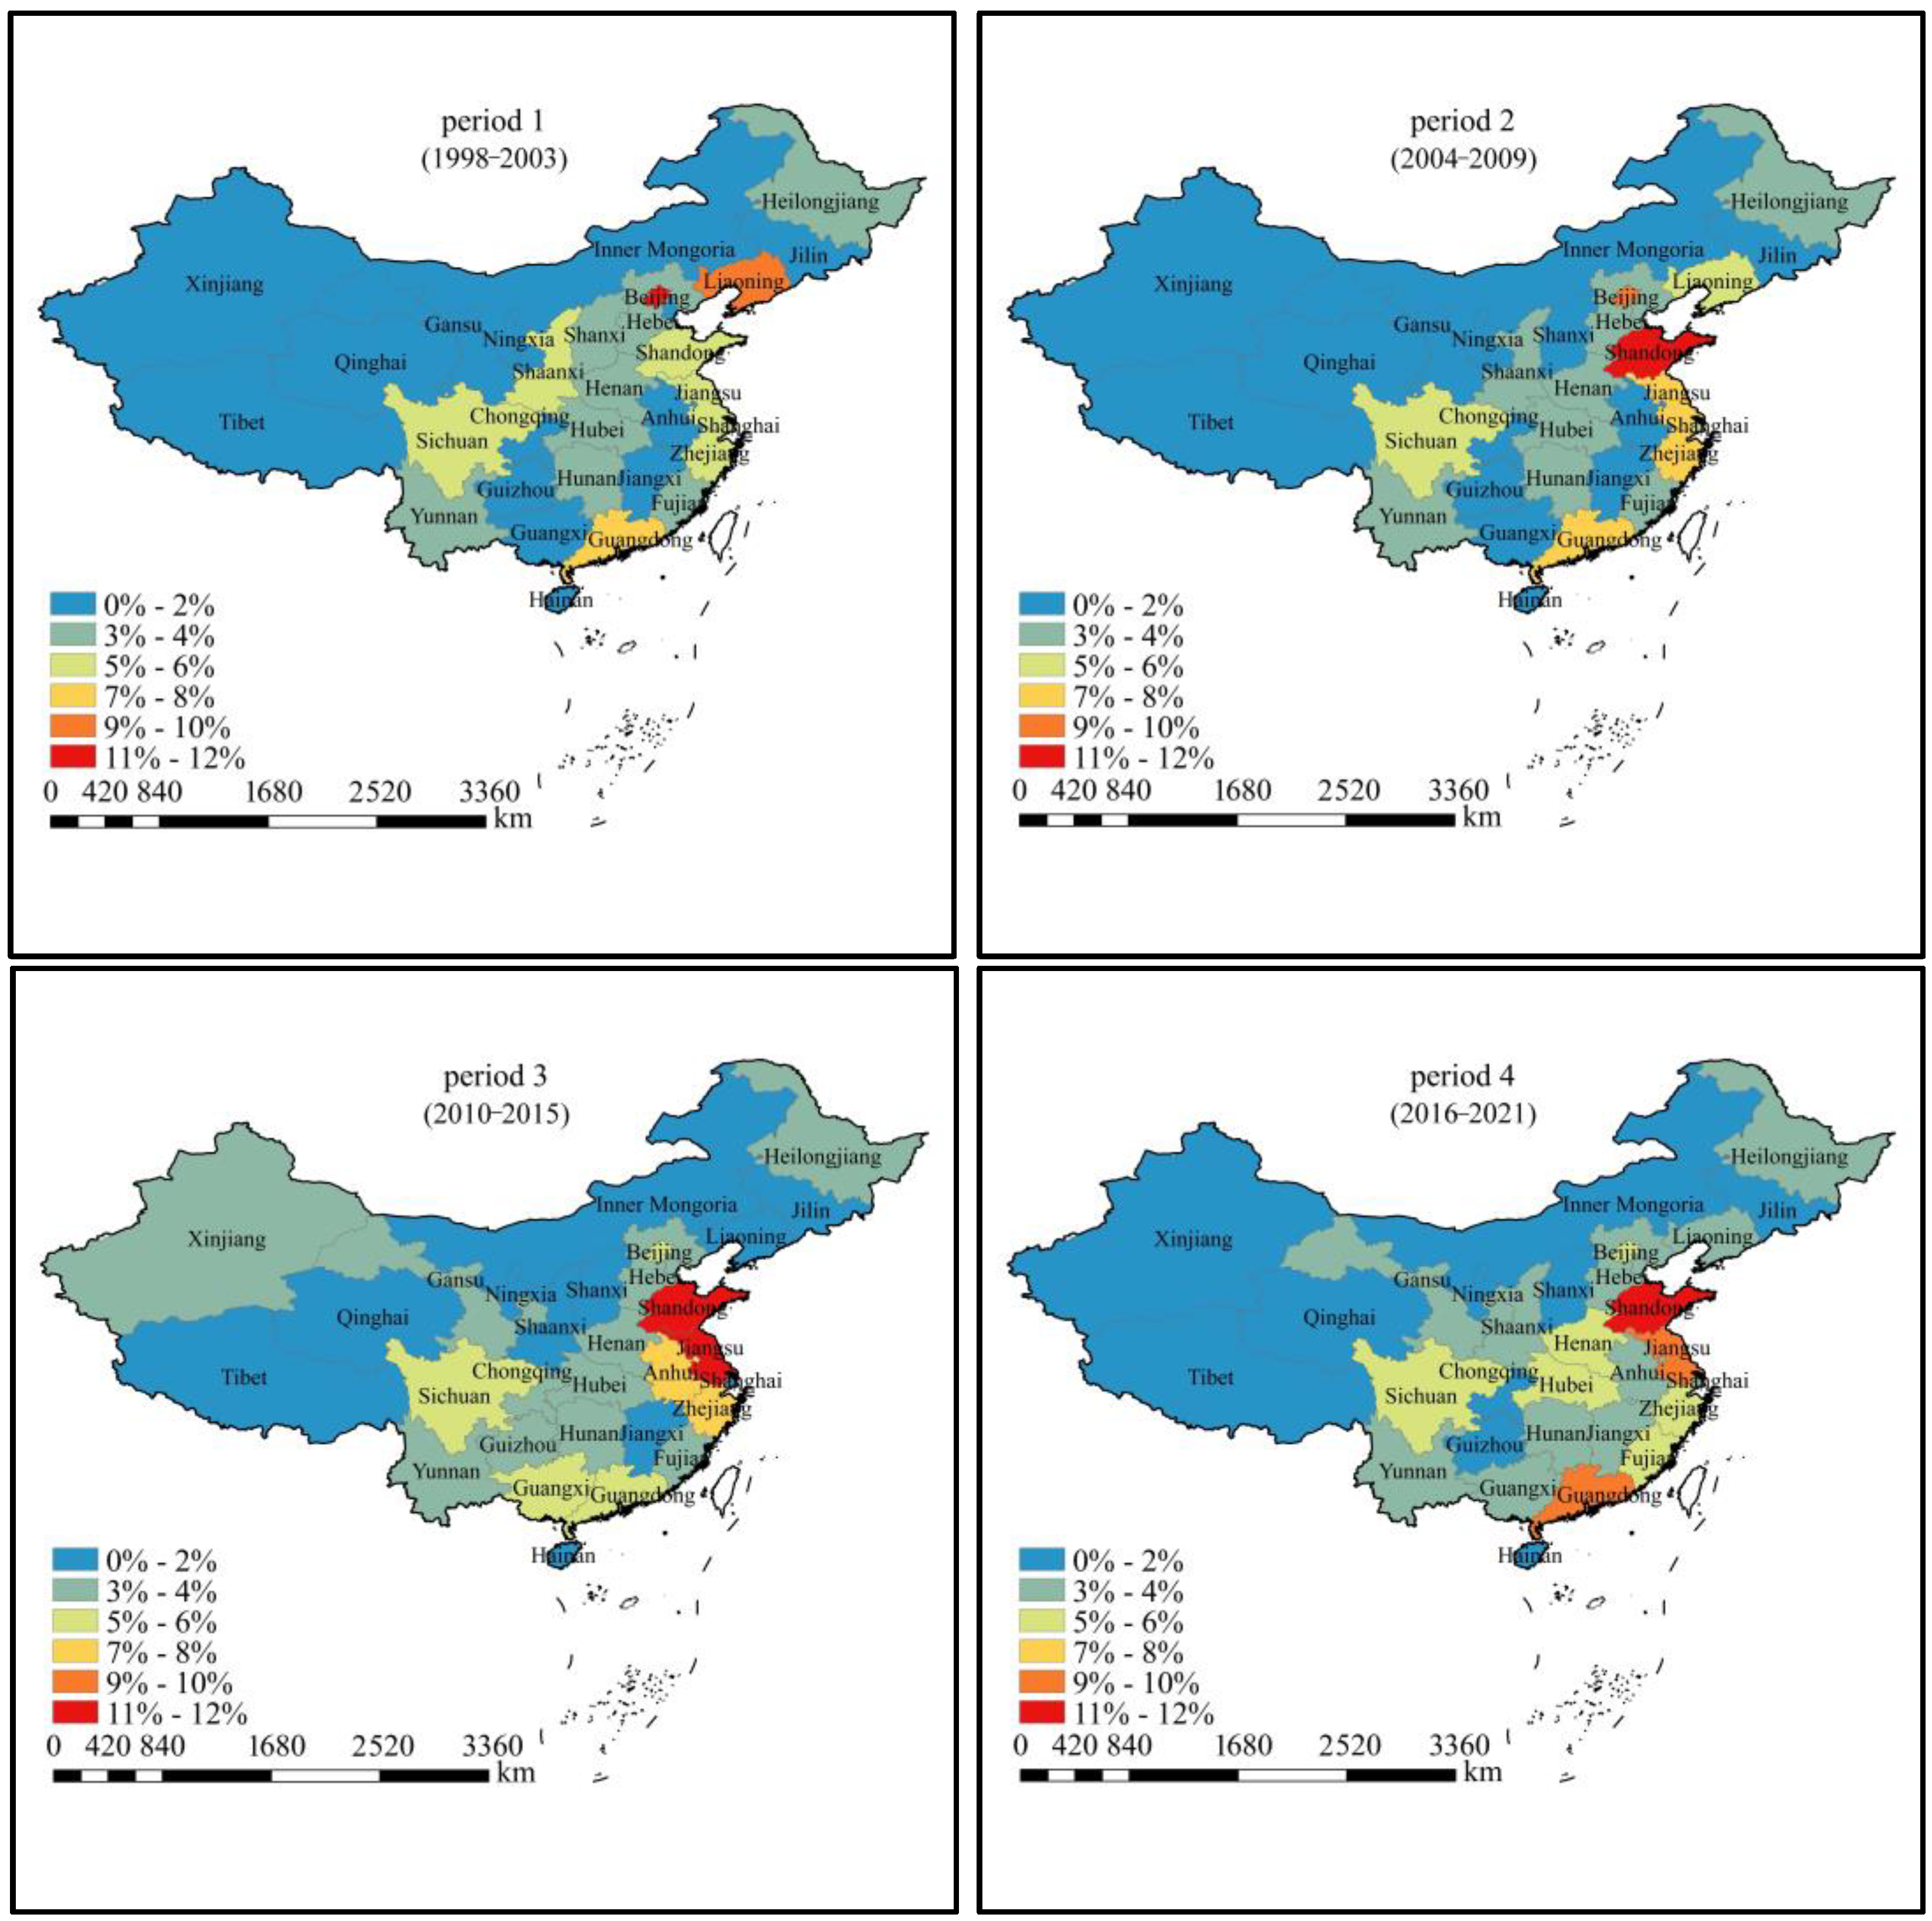
3.2. Evolution of Agricultural Green Patents in China in Spatial Distribution
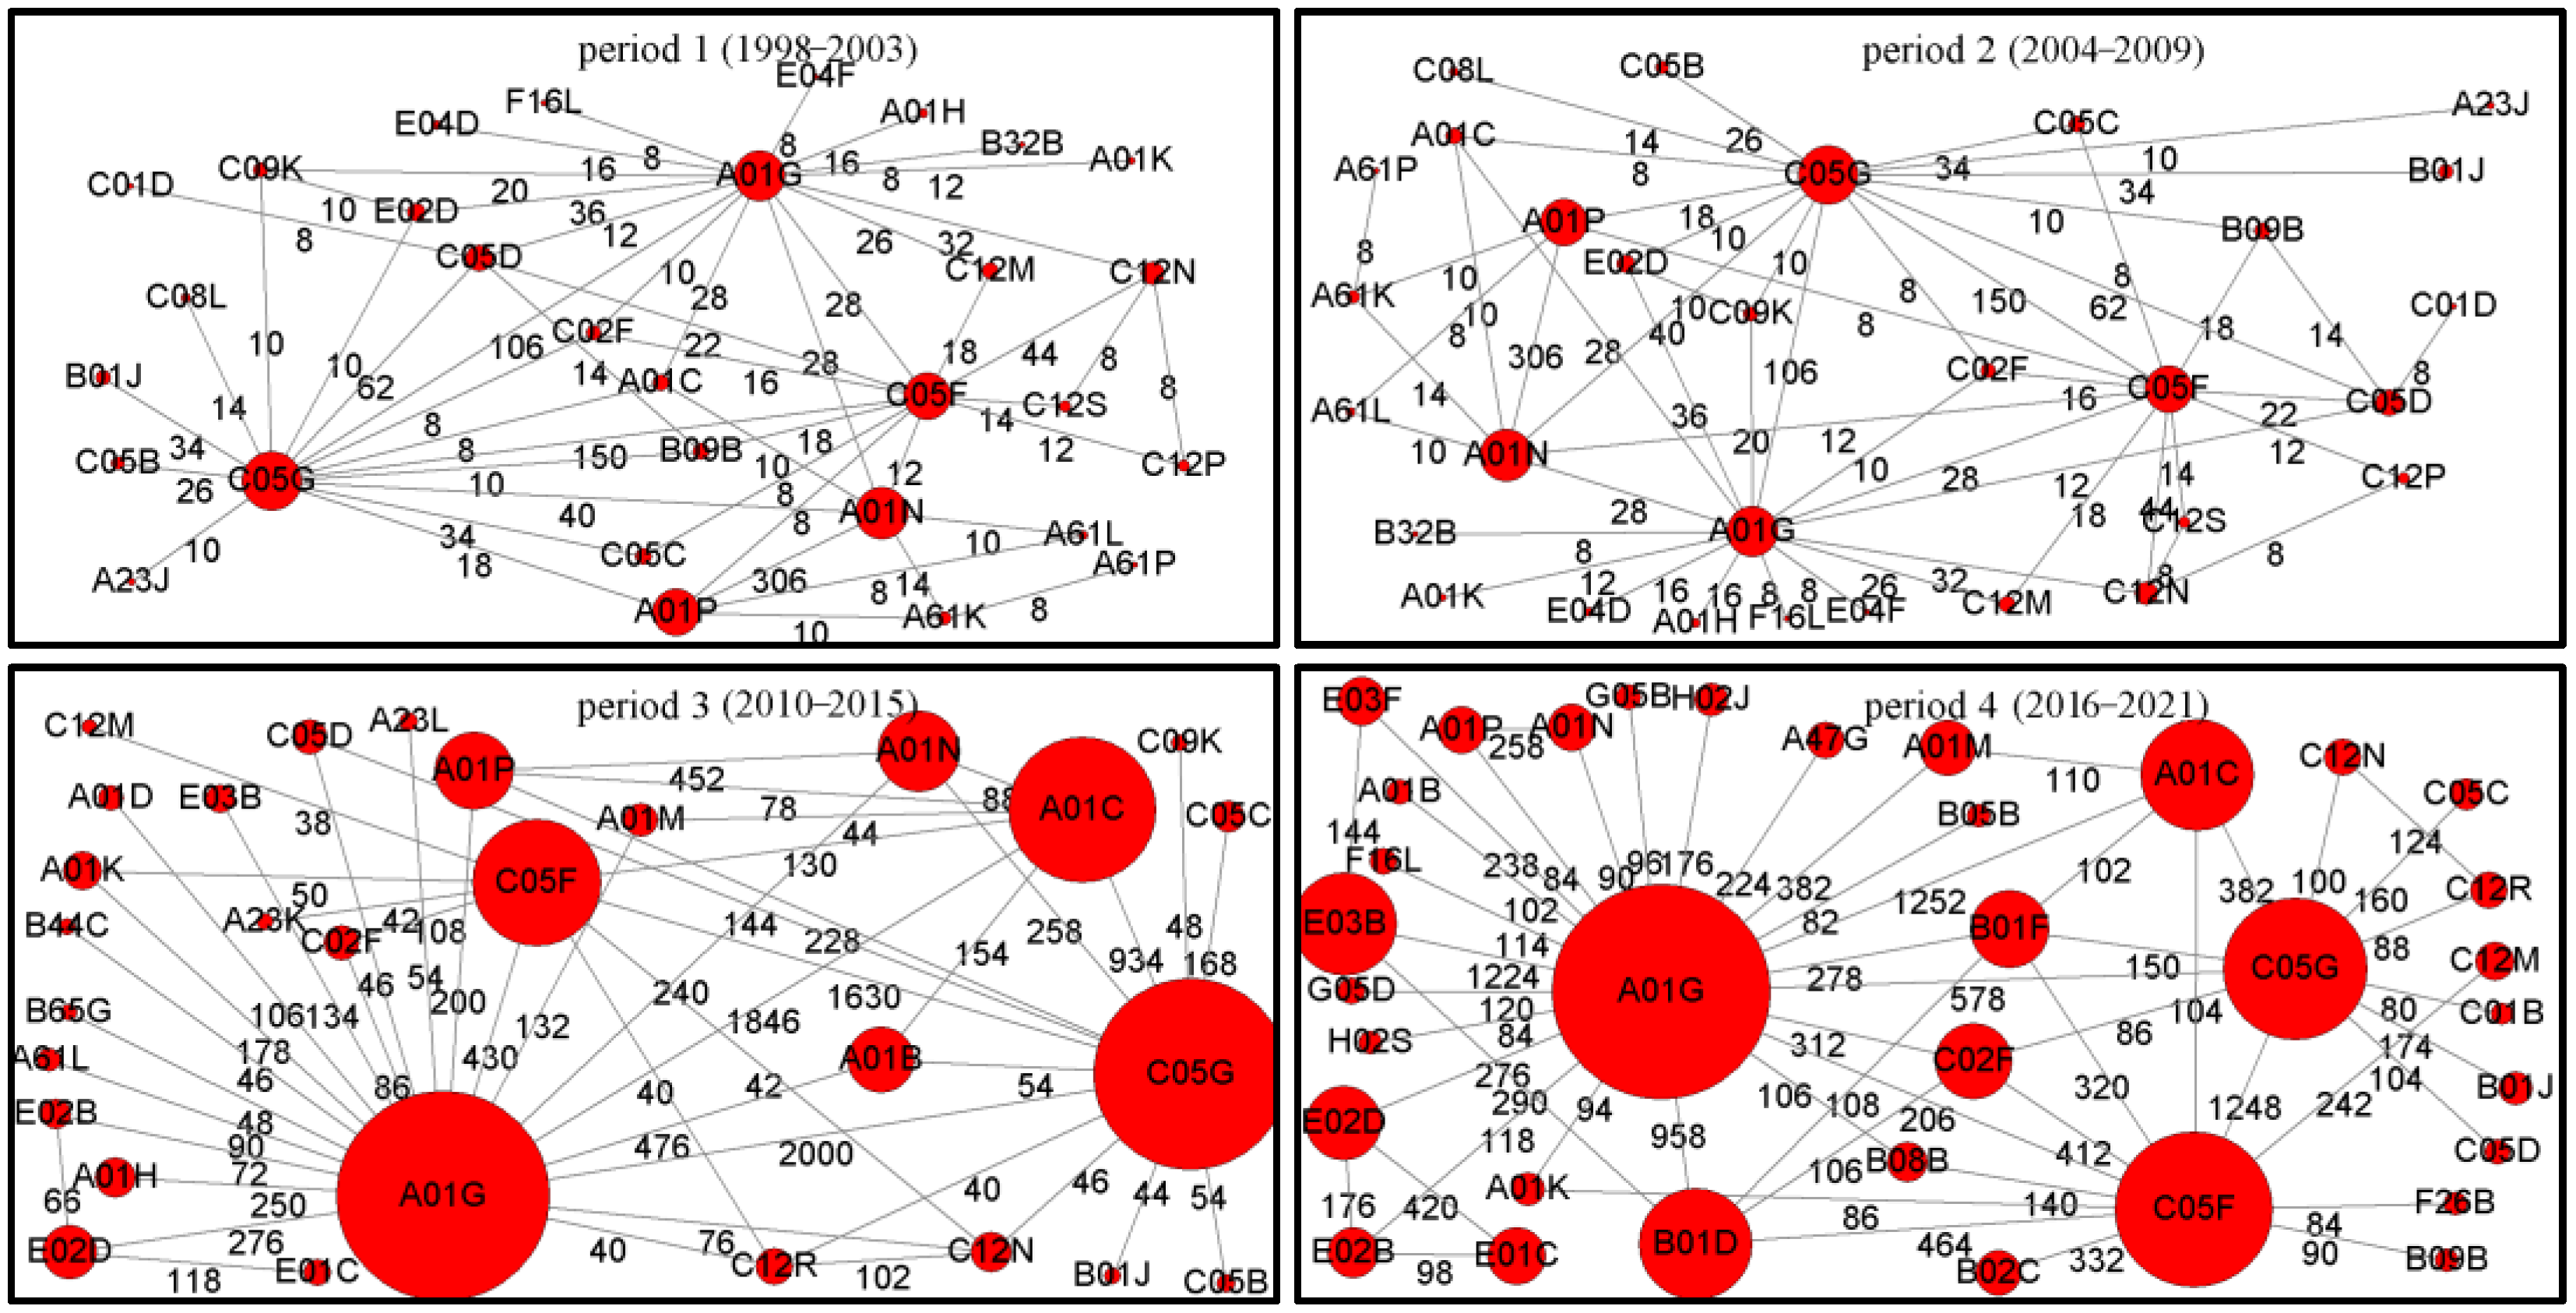
3.3. Social Network Analysis of IPC Co-Occurrence
4. Conclusions
Author Contributions
Funding
Institutional Review Board Statement
Informed Consent Statement
Acknowledgments
Conflicts of Interest
References
- Mirziyoyeva, Z.; Salahodjaev, R. Renewable energy and CO2 emissions intensity in the top carbon intense countries. Renew. Energy 2022, 192, 507–512. [Google Scholar]
- Martin-Guay, M.-O.; Paquette, A.; Dupras, J.; Rivest, D. The new Green Revolution: Sustainable intensification of agriculture by intercropping. Sci. Total Environ. 2018, 615, 767–772. [Google Scholar]
- Tian, L.; Ye, Q.; Zhen, Z. A new assessment model of social cost of carbon and its situation analysis in China. J. Clean. Prod. 2019, 211, 1434–1443. [Google Scholar]
- Pata, U.K. Linking renewable energy, globalization, agriculture, CO2 emissions and ecological footprint in BRIC countries: A sustainability perspective. Renew. Energy 2021, 173, 197–208. [Google Scholar]
- Cui, Y.; Khan, S.U.; Deng, Y.; Zhao, M. Regional difference decomposition and its spatiotemporal dynamic evolution of Chinese agricultural carbon emission: Considering carbon sink effect. Environ. Sci. Pollut. Res. 2021, 28, 38909–38928. [Google Scholar]
- Nayak, D.; Saetnan, E.; Cheng, K.; Wang, W.; Koslowski, F.; Cheng, Y.-F.; Zhu, W.Y.; Wang, J.-K.; Liu, J.-X.; Moran, D.; et al. Management opportunities to mitigate greenhouse gas emissions from Chinese agriculture. Agric. Ecosyst. Environ. 2015, 209, 108–124. [Google Scholar]
- Koohafkan, P.; Altieri, M.A.; Gimenez, E.H. Green Agriculture: Foundations for biodiverse, resilient and productive agricultural systems. Int. J. Agric. Sustain. 2011, 10, 61–75. [Google Scholar]
- Li, Z.; Jin, M.; Cheng, J. Economic growth of green agriculture and its influencing factors in china: Based on emergy theory and spatial econometric model. Environ. Dev. Sustain. 2021, 23, 15494–15512. [Google Scholar]
- Liu, Y.; Sun, D.; Wang, H.; Wang, X.; Yu, G.; Zhao, X. An evaluation of China’s agricultural green production: 1978–2017. J. Clean. Prod. 2020, 243, 118483. [Google Scholar]
- Chang, S.-H.; Fan, C.-Y. Using Patent Technology Networks to Observe Neurocomputing Technology Hotspots and Development Trends. Sustainability 2020, 12, 7696. [Google Scholar]
- Fan, J.; Wang, J.; Liu, M.; Sun, W.; Lan, Z. Scenario simulations of China’s natural gas consumption under the dual-carbon target. Energy 2022, 252, 124106. [Google Scholar]
- Han, J.; Qu, J.; Maraseni, T.N.; Xu, L.; Zeng, J.; Li, H. A critical assessment of provincial-level variation in agricultural GHG emissions in China. J. Environ. Manag. 2021, 296, 113190. [Google Scholar]
- Lin, B.; Xu, B. Factors affecting CO2 emissions in China’s agriculture sector: A quantile regression. Renew. Sustain. Energy Rev. 2018, 94, 15–27. [Google Scholar]
- Zhang, X.; Chen, H. Green Agricultural Development Based on Information Communication Technology and the Panel Space Measurement Model. Sustainability 2021, 13, 1147. [Google Scholar]
- Long, X.; Luo, Y.; Sun, H.; Tian, G. Fertilizer using intensity and environmental efficiency for China’s agriculture sector from 1997 to 2014. Nat. Hazards 2018, 92, 1573–1591. [Google Scholar]
- Xu, X.; Huang, X.; Huang, J.; Gao, X.; Chen, L. Spatial-Temporal Characteristics of Agriculture Green Total Factor Productivity in China, 1998–2016: Based on More Sophisticated Calculations of Carbon Emissions. Int. J. Environ. Res. Public Health 2019, 16, 3932. [Google Scholar]
- Liu, D.; Zhu, X.; Wang, Y. China’s agricultural green total factor productivity based on carbon emission: An analysis of evolution trend and influencing factors. J. Clean. Prod. 2021, 278, 123692. [Google Scholar]
- Liu, Y.; Wang, X. Promoting Competitiveness of Green Brand of Agricultural Products Based on Agricultural Industry Cluster. Wirel. Commun. Mob. Comput. 2022, 2022, 7824638. [Google Scholar]
- Chen, Z.; Sarkar, A.; Rahman, A.; Li, X.; Xia, X. Exploring the drivers of green agricultural development (GAD) in China: A spatial association network structure approaches. Land Use Policy 2022, 112, 105827. [Google Scholar]
- Yang, Z.; Shao, S.; Fan, M.; Yang, L. Wage distortion and green technological progress: A directed technological progress perspective. Ecol. Econ. 2021, 181, 106912. [Google Scholar]
- Ferrari, V.E.; da Silveira, J.M.F.J.; Dal-Poz, M.E.S. Patent network analysis in agriculture: A case study of the development and protection of biotechnologies. Econ. Innov. New Technol. 2019, 30, 111–133. [Google Scholar]
- Zheng, X.; Aborisade, M.A.; Liu, S.; Lu, S.; Oba, B.T.; Xu, X.; Cheng, X.; He, M.; Song, Y.; Ding, H. The history and prediction of composting technology: A patent mining. J. Clean. Prod. 2020, 276, 124232. [Google Scholar]
- Liu, Y.; Ji, D.; Zhang, L.; An, J.; Sun, W. Rural Financial Development Impacts on Agricultural Technology Innovation: Evidence from China. Int. J. Environ. Res. Public Health 2021, 18, 1110. [Google Scholar]
- Aldieri, L.; Brahmi, M.; Chen, X.; Vinci, C.P. Knowledge spillovers and technical efficiency for cleaner production: An economic analysis from agriculture innovation. J. Clean. Prod. 2021, 320, 128830. [Google Scholar]
- Häggmark, T.; Elofsson, K. The drivers of private and public eco-innovations in six large countries. J. Clean. Prod. 2022, 364, 132628. [Google Scholar]
- Souza Piao, R.; Silva, V.L.; Navarro del Aguila, I.; de Burgos Jiménez, J. Green Growth and Agriculture in Brazil. Sustainability 2021, 13, 1162. [Google Scholar]
- Atinkut, H.B.; Yan, T.; Zhang, F.; Qin, S.; Gai, H.; Liu, Q. Cognition of agriculture waste and payments for a circular agriculture model in Central China. Sci. Rep. 2020, 10, 10826. [Google Scholar]
- Li, E.; Yao, F.; Xi, J.; Guo, C. Evolution Characteristics of Government-Industry-University-Research Cooperative Innovation Network for China’s Agriculture and Influencing Factors: Illustrated According to Agricultural Patent Case. Chin. Geogr. Sci. 2018, 28, 137–152. [Google Scholar]
- Liu, W.; Price, S.; Bennett, G.; Maxwell, T.M.R.; Zhao, C.; Walker, G.; Bunt, C. A landscape review of controlled release urea products: Patent objective, formulation and technology. J. Control. Release 2022, 348, 612–630. [Google Scholar]
- Hamm, R.L.; Gregg, A.; Sparks, T.C. Intellectual property in entomology: Analysis and perspective on recent trends in global patent publications. Pest Manag. Sci. 2020, 76, 1603–1611. [Google Scholar]
- Jin, Y.; Liu, J.; Wang, X.; Li, P.; Wang, J. Technology Recommendations for an Innovative Agricultural Robot Design Based on Technology Knowledge Graphs. Processes 2021, 9, 1905. [Google Scholar]
- Ning, L.; Guo, R. Technological Diversification to Green Domains: Technological Relatedness, Invention Impact and Knowledge Integration Capabilities. Res. Policy 2022, 51, 104406. [Google Scholar]
- Son, S.; Cho, N.-W. Technology Fusion Characteristics in the Solar Photovoltaic Industry of South Korea: A Patent Network Analysis Using IPC Co-Occurrence. Sustainability 2020, 12, 9084. [Google Scholar]
- Tong, T.W.; Zhang, K.; He, Z.-L.; Zhang, Y. What determines the duration of patent examination in China? An outcome-specific duration analysis of invention patent applications at SIPO. Res. Policy 2018, 47, 583–591. [Google Scholar]
- Zhang, D.; Rong, Z.; Ji, Q. Green innovation and firm performance: Evidence from listed companies in China. Resour. Conserv. Recycl. 2019, 144, 48–55. [Google Scholar]
- Goto, A.; Motohashi, K. Construction of a Japanese Patent Database and a first look at Japanese patenting activities. Res. Policy 2007, 36, 1431–1442. [Google Scholar]
- Kong, D.; Zhu, L.; Yang, Z. Effects of foreign investors on energy firms’ innovation: Evidence from a natural experiment in China. Energy Econ. 2020, 92, 105011. [Google Scholar]
- Long, X.; Luo, Y.; Wu, C.; Zhang, J. The influencing factors of CO2 emission intensity of Chinese agriculture from 1997 to 2014. Environ. Sci. Pollut. Res. 2018, 25, 13093–13101. [Google Scholar]
- Liu, L.; Bai, X.; Jiang, Z. The generic technology identification of saline–alkali land management and improvement based on social network analysis. Clust. Comput. 2019, 22, 13167–13176. [Google Scholar]
- Wang, Y.; Chen, Y.; Liu, M.; Hu, R. Growth and quality of Chinese journals from 1949 to 2013. Learn. Publ. 2018, 31, 205–214. [Google Scholar]
- Wang, Y.; Hu, R.; Liu, M. The geotemporal demographics of academic journals from 1950 to 2013 according to Ulrich’s database. J. Informetr. 2017, 11, 655–671. [Google Scholar]
- Cai, Z.; Yang, X.; Huang, T.; Zhu, W. A new similarity combining reconstruction coefficient with pairwise distance for agglomerative clustering. Inf. Sci. 2020, 508, 173–182. [Google Scholar]
- Zhang, X.; Ma, X. Feasible carbon-trade model for low-carbon density ecosystem. J. Appl. Ecol. 2022, 59, 1086–1097. [Google Scholar]
- Yuan, X.; Cai, Y. Forecasting the development trend of low emission vehicle technologies: Based on patent data. Technol. Forecast. Soc. Chang. 2021, 166, 120651. [Google Scholar]
- Dong, F.; Li, W. Research on the coupling coordination degree of “upstream-midstream-downstream” of China’s wind power industry chain. J. Clean. Prod. 2021, 283, 124633. [Google Scholar]
- Fan, W.; Wang, H.; Liu, Y.; Liu, H. Spatio-temporal variation of the coupling relationship between urbanization and air quality: A case study of Shandong Province. J. Clean. Prod. 2020, 272, 122812. [Google Scholar]
- Yang, X.; Yu, X. Preventing Patent Risks in Artificial Intelligence Industry for Sustainable Development: A Multi-Level Network Analysis. Sustainability 2020, 12, 8667. [Google Scholar]
- Hu, S.; Liu, S.; Li, D.; Lin, Y. How Does Regional Innovation Capacity Affect the Green Growth Performance? Empirical Evidence from China. Sustainability 2019, 11, 5084. [Google Scholar]
- Zhang, B.; Wang, Q.; Liu, Y.; Zhang, Y.; Wu, X.; Sun, X.; Qiao, H. Uneven development within China: Implications for interprovincial energy, water and arable land requirements. J. Environ. Manag. 2020, 261, 110231. [Google Scholar]
- Du, K.; Cheng, Y.; Yao, X. Environmental regulation, green technology innovation, and industrial structure upgrading: The road to the green transformation of Chinese cities. Energy Econ. 2021, 98, 105247. [Google Scholar]
- Dardonville, M.; Legrand, B.; Clivot, H.; Bernardin, C.; Bockstaller, C.; Therond, O. Assessment of ecosystem services and natural capital dynamics in agroecosystems. Ecosyst. Serv. 2022, 54, 101415. [Google Scholar]
- Daryanto, S.; Fu, B.; Wang, L.; Jacinthe, P.-A.; Zhao, W. Quantitative synthesis on the ecosystem services of cover crops. Earth-Sci. Rev. 2018, 185, 357–373. [Google Scholar]
- Zhou, Y.; Li, X.; Liu, Y. Cultivated land protection and rational use in China. Land Use Policy 2021, 106, 105454. [Google Scholar]
- Shen, J.; Zhu, Q.; Jiao, X.; Ying, H.; Wang, H.; Wen, X.; Xu, W.; Li, T.; Cong, W.; Liu, X. Agriculture green development: A model for China and the world. Front. Agric. Sci. Eng. 2020, 7, 5–13. [Google Scholar]


| IPC Subclass | Descriptions | No. of Patents |
|---|---|---|
| A01G | Horticulture; cultivation of vegetables, flowers, rice, fruit, vines, hops or seaweed; forestry; watering | 21,838 |
| A01N | Biocides, e.g., as disinfectants, as pesticides, or as herbicides; pest repellants or attractants; plant growth regulators | 511 |
| C05F | Organic fertilizers not covered by subclasses C05B, C05C, e.g., fertilizers from waste or refuse | 11,296 |
| C05G | Organic fertilizers | 9635 |
| C09K | Soil-conditioning materials or soil-stabilizing materials | 114 |
| E02D | Improving soil for agricultural purposes a01 | 2456 |
| Level | Indicators | Descriptions |
|---|---|---|
| density | the ratio of direct connections in a network to total numbers of possible connections | |
| network | average path length | the average value of the distance between any two nodes |
| global clustering coefficient | the number of closed triplets (or 3 triangles) over the total number of triplets (both open and closed) | |
| degree centrality | the number of edges directly connected to the node | |
| betweenness centrality | the betweenness centrality for each vertex is the number of these shortest paths that pass through the vertex | |
| node | constraint | measures the extent to which a node is restricted by its social network |
| effective size | the more each node is disconnected from other primary contacts, the higher the effective size would be | |
| local clustering coefficient | a proportion of the number of links between the vertices within their neighborhoods, divided by the number of links that could possibly exist between them |
| Types | Period 1 (1998–2003) | Period 2 (2004–2009) | Period 3 (2010–2015) | Period 4 (2016–2021) | ||||
|---|---|---|---|---|---|---|---|---|
| No. | Growth Rate | No. | Growth Rate | No. | Growth Rate | No. | Growth Rate | |
| Individuals | 323 | 28% | 679 | −17.8% | 1000 | 8% | 1072 | 7% |
| Firms | 109 | 31% | 604 | 39% | 2395 | 16% | 3602 | 21% |
| Universities | 136 | 45% | 727 | 27% | 1547 | 11% | 1273 | 17% |
| SNA Indicators | Period 1 (1998–2003) | Period 2 (2004–2009) | Period 3 (2010–2015) | Period 4 (2016–2021) |
|---|---|---|---|---|
| Density | 0.16 | 0.16 | 0.08 | 0.08 |
| Average path length | 2.27 | 2.27 | 2.20 | 2.25 |
| Global clustering coefficient | 0.26 | 0.26 | 0.16 | 0.22 |
| IPC | Period 1 (1998–2003) | Period 2 (2004–2009) | Period 3 (2010–2015) | Period 4 (2016–2021) | ||||||||
|---|---|---|---|---|---|---|---|---|---|---|---|---|
| DC | BC | Con | DC | BC | Con | DC | BC | Con | DC | BC | Con | |
| A01G | 98.00 | 0.57 | 0.18 | 49.00 | 0.57 | 0.18 | 146.00 | 0.69 | 0.29 | 199.00 | 0.45 | 0.13 |
| C05G | 64.00 | 0.23 | 0.23 | 32.00 | 0.23 | 0.23 | 73.00 | 0.15 | 0.43 | 108.00 | 0.15 | 0.26 |
| C05F | 58.00 | 0.15 | 0.33 | 29.00 | 0.15 | 0.34 | 58.00 | 0.11 | 0.65 | 137.00 | 0.17 | 0.21 |
| A01N | 44.00 | 0.12 | 0.58 | 22.00 | 0.12 | 0.53 | 29.00 | 0.01 | 0.56 | 36.00 | 0.01 | 0.41 |
| C09K | 28.00 | 0.04 | 0.77 | 11.00 | 0.01 | 0.50 | 20.00 | 0.01 | 0.40 | 22.00 | 0.00 | 0.42 |
| A01C | 22.00 | 0.01 | 0.53 | 8.00 | 0.00 | 0.51 | 39.00 | 0.02 | 0.72 | 68.00 | 0.02 | 0.49 |
| B01D | 12.00 | 0.00 | 0.43 | 6.00 | 0.00 | 0.43 | 14.00 | 0.00 | 0.52 | 86.00 | 0.04 | 0.42 |
| E02D | 16.00 | 0.00 | 0.67 | 5.00 | 0.00 | 0.67 | 44.00 | 0.07 | 0.41 | 90.00 | 0.14 | 0.26 |
| A01P | 28.00 | 0.04 | 0.77 | 14.00 | 0.04 | 0.77 | 25.00 | 0.01 | 0.58 | 30.00 | 0.00 | 0.43 |
| C12N | 26.00 | 0.01 | 0.49 | 13.00 | 0.01 | 0.49 | 13.00 | 0.00 | 0.51 | 15.00 | 0.00 | 0.48 |
| Indicators | Information Entropy | Expected Value of Entropy | Weight Coefficient |
|---|---|---|---|
| Degree centrality | 0.91 | 0.09 | 23.75% |
| Betweenness centrality | 0.82 | 0.18 | 45.55% |
| Constraint | 0.98 | 0.02 | 6.21% |
| Effective size | 0.99 | 0.01 | 0.72% |
| Clustering coefficient | 0.91 | 0.09 | 23.77% |
| IPC | C Value | T Value | D Value | Coordination Level | Degree of Coupling Coordination |
|---|---|---|---|---|---|
| A01G | 0.85 | 0.83 | 0.84 | 9 | Good coordination |
| C05G | 0.99 | 0.56 | 0.74 | 8 | Intermediate coordination |
| C05F | 0.97 | 0.50 | 0.70 | 7 | Primary coordination |
| A01N | 0.78 | 0.24 | 0.44 | 5 | On the verge of maladjustment |
| C09K | 0.31 | 0.22 | 0.26 | 3 | Moderate maladjustment |
| A01C | 0.60 | 0.06 | 0.19 | 2 | Severe maladjustment |
| B01D | 0.89 | 0.5 | 0.72 | 7 | Primary coordination |
| E02D | 0.31 | 0.32 | 0.31 | 4 | Mild maladjustment |
| A01P | 0.68 | 0.29 | 0.47 | 5 | On the verge of maladjustment |
| C12N | 0.31 | 0.33 | 0.31 | 4 | Mild maladjustment |
Publisher’s Note: MDPI stays neutral with regard to jurisdictional claims in published maps and institutional affiliations. |
© 2022 by the authors. Licensee MDPI, Basel, Switzerland. This article is an open access article distributed under the terms and conditions of the Creative Commons Attribution (CC BY) license (https://creativecommons.org/licenses/by/4.0/).
Share and Cite
Hu, R.; Xu, W. Exploring the Technological Changes of Green Agriculture in China: Evidence from Patent Data (1998–2021). Sustainability 2022, 14, 10899. https://doi.org/10.3390/su141710899
Hu R, Xu W. Exploring the Technological Changes of Green Agriculture in China: Evidence from Patent Data (1998–2021). Sustainability. 2022; 14(17):10899. https://doi.org/10.3390/su141710899
Chicago/Turabian StyleHu, Ruifeng, and Weiqiao Xu. 2022. "Exploring the Technological Changes of Green Agriculture in China: Evidence from Patent Data (1998–2021)" Sustainability 14, no. 17: 10899. https://doi.org/10.3390/su141710899
APA StyleHu, R., & Xu, W. (2022). Exploring the Technological Changes of Green Agriculture in China: Evidence from Patent Data (1998–2021). Sustainability, 14(17), 10899. https://doi.org/10.3390/su141710899