Article

Is Only the Dedicated Lane for Automated Vehicles Essential in the Future? The Dedicated Lanes Optimal Operating System Evaluation

1
The Department of Smartcity, Hongik University, Seoul 04066, Korea
2
Transport Service Team, Korea Autonomous Driving Development Innovation Foundation, Seoul 06710, Korea
3
The Department of Urban Planning, Hongik University, Seoul 04066, Korea
*
Author to whom correspondence should be addressed.
Sustainability 2022, 14(18), 11490; https://doi.org/10.3390/su141811490
Submission received: 7 July 2022 / Revised: 10 August 2022 / Accepted: 8 September 2022 / Published: 14 September 2022

Abstract

:
As new mobility called automated vehicles (AVs) appears on the road, positive effects are expected, but in fact, unexpected adverse effects may arise due to the mixed traffic situation with human-driven vehicles (HVs). Prior to the commercialization of AVs, a preliminary review and preventive measures are required, and among them, the interaction between the existing vehicle and the new mobility and the interaction with the infrastructure must be considered. Therefore, we propose (i) the positive–negative effect of introducing AVs in a mixed traffic situation and (ii) the optimal operation plan for the dedicated lane for AVs. First, the effect of introducing AVs considering the interaction between vehicles in the mixed traffic situation showed mostly positive such as speed increase, delay time reduction, and capacity increase. However, in a 75% Market Penetration Rate (MPR) environment of all levels of Service (LOS), the effect was diminished compared to the previous MPR. This is contemplated to be the result of a conflict caused by the operation of some HVs (including heavy vehicles) behavior as obstacles in the situation where most of the vehicles on the road are AVs. Based on the previous result, we deployed the dedicated lane to resolve the negative effect in the 75% MPR environment and proposed an optimal operation strategy for the AVs dedicated lane from the perspective of operational efficiency for a more feasible operation. Given the 75% MPR, the Mixed-Use operation strategy of High-Occupancy Vehicles (HOV) and AVs is ascertained as the most suitable operation strategy. This implies that even in the era of AVs, the influence of other vehicles (e.g., heavy vehicles, other mobility) must be considered. This study is significant by considering the negative effects of the introduction of AVs and presenting an optimal operation strategy for dedicated lanes, and it can expect to be used as a new strategy as part of the Free/Expressway Traffic Management System (FTMS) applicable in the era of autonomous driving.

1. Introduction

As the attention of IT technology and artificial intelligence increase worldwide, discussions on the 4th industrial revolution are revitalizing more active, and Automated Vehicles (AVs) are expected to play an essential role among major technologies that will lead the 4th Industrial Revolution. AVs are defined as vehicles capable of navigating, controlling, and avoiding risk partly or totally without human assistance, and AVs can be categorized into six levels, ranging from none autosystem (SAE level 0) to full autosystem (SAE level 5) [1]. Human intervention is minimized from SAE level 3, and driverless driving is possible at level 5. Especially as AVs allow a smaller headway between vehicles while keeping the same velocity level, the introduction of AVs can prevent more than 90% of traffic accidents caused by humans, and improve driving safety, convenience, and mobility [2,3,4,5,6,7,8,9,10]. However, as these positive effects may only take at the ‘ideal’ situation, it is necessary to consider mixed traffic situations where interactions between AVs and human-driven vehicles (HVs). In fact, these benefits mentioned above will be accomplished when AVs commercialization reaches more than a specific Market Penetration Rate (MPR) and AVs fully take root [5,11,12], and in the earlier stage of introduction, there is a possibility that other accident situations will unexpectedly occur due to mixed situations with HVs [7,13,14,15]. Accordingly, various strategies have been proposed to minimize vehicles interaction in a mixed traffic situation and maximize the introduction effects of AVs. Among these strategies, Dedicated Lanes (DLs) for AVs are being proposed in consideration of the additional interaction of between vehicles and infrastructure [16,17,18,19]. DLs are roads that can only operate AVs on roads, and if DLs are deployed, positive effects will be expected, such as reduction of road confusion, traffic shockwave, etc. [11,20,21,22]. On the other hand, the other studies state that DL has different effects depending on AVs MPR. When DLs are operated in a low MPR situation, it is shown that they bring about negative effects, which lead to decrease road capacity [11,20,23,24]. Above all, Talebpour. A. et al. (2017) [20] found that, when the driving of AVs is limited to driving only by DLs, congestion increases significantly due to the formation of shock waves caused by lane changes of AVs. Likewise, Ma, K., & Wang, H (2017) [24] examined when DLs were deployed in a low MPR situation, and it leads to congestion due to waste of road and reduction of capacity. Despite the expected positive effects of DLs deployment, more systematic and feasible strategies are needed, as DLs research on the detailed design and operation of AVs are still insufficient [25]. Given the above issues, both the interaction between vehicles and interaction of vehicle–infra should be considered for feasible commercialization of AVs. Regarding the interaction between vehicles, we should check impacts on other objects by understanding HVs’ unexpected behavior and contemplate interaction between AVs and HVs in mixed traffic situations. Moreover, regarding the interaction of vehicle-infra, since the systemic characteristics of AVs will be an imperative consideration in the design of future high-tech infrastructure, it is necessary to establish a systematic operation strategy for this.
In this paper, we aim to derive the effects of interaction between vehicles in considering AVs MPR and propose an optimal DL operating strategy for AVs to resolve/alleviate negative MPR situations. The study’s detailed purpose follows:
1.
An analysis is made of AVs positive–negative effects based on AVs MPR considering the interaction between vehicles.
2.
Given MPR on the derived negative effect, a simulation of DLs for AVs using the existing infra is conducted.
3.
A proposal of the optimal DLs operation strategy for AVs is detailed.
Therefore, our contribution follows:
1.
When AVs drive in a mixed traffic situation, we contemplate the causes of negative and positive effects.
2.
We build a DL to mitigate negative situations.
3.
We not only check the basic effects of DLs but also extract feasible and optimal operating strategy of DLs by utilizing the existing infrastructure.
The rest of the paper is structured as follows. In Section 2, we set up the simulation circumstance of VISSIM for extracting AVs introduction effects and optimal operating DLs strategy. Based on Section 2, we figure out the AVs introduction effects (simulation 1) in Section 3 and then analyze the DLs benefits (simulation 2) in Section 4. Next, we establish the optimal DLs operating strategy plan and propose the judgment methodology and example of application in Section 5. Finally, we conclude the paper in Section 6.

2. Methodology

In the case of AV, it is difficult to determine the actual phenomenon because it is not the mobility that is actively running on the road. Therefore, PTV VISSIM 10.0 is utilized to extract the AV introduction effect and DLs operation strategy, and in this section, spatial scope and data collection, simulation environment and AV setting, simulation scenario design, and evaluation indicators are proposed. First, Section 2.1 presents the spatial scope and real-world data collection method for composing the simulation environment identical to the real environment. In Section 2.2, the overall network environment of the simulation and parameters for realizing AVs are discussed, and in Section 2.3, the process of establishing a two-step simulation scenario of this study is explained.

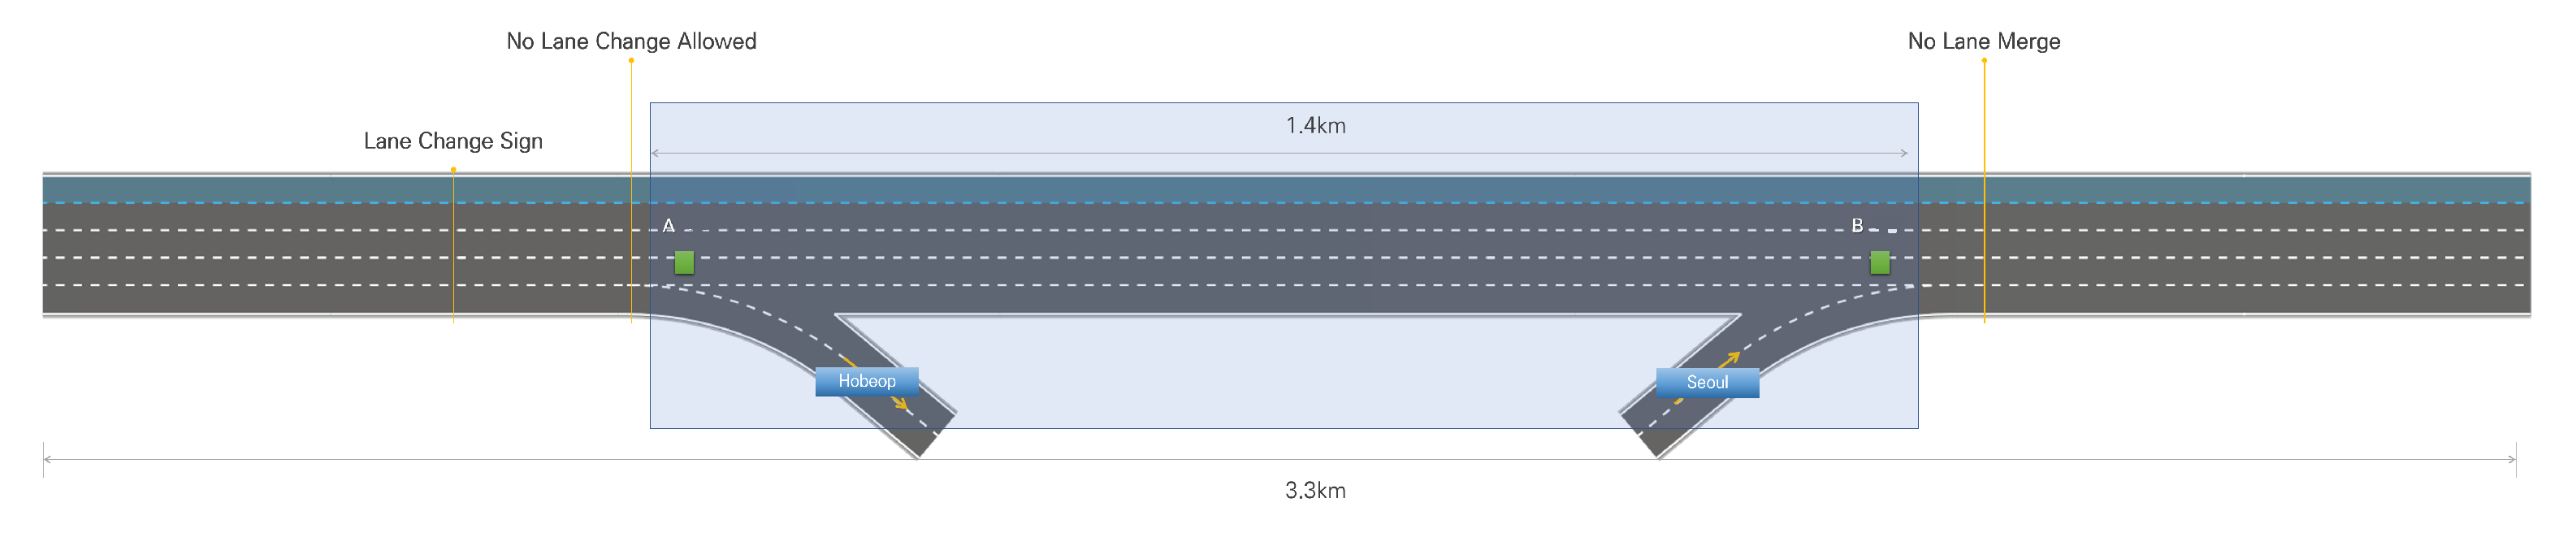
2.1. Spatial Scope and Data Collection

In order to derive practical effects and strategies, we selected the spatial scope of the Singal JC northbound lane and ramp connection of the AVs Expressway testbed (Seoul-Singal-Hobeop, 41 km) currently in operation in Korea (Figure 1). In the case of the target site, a total of 3.3 km, including the 1.4 km section affected by entry/exit, and five general lanes, including the High-Occupancy Vehicle Lane (HOVL) on the Gyeongbu Line Expressway in Korea were set as the analysis section. In addition, in order to utilize the actual traffic volume data for the section, the analysis point was set to 19 May 2018, before the introduction of AVs, without the influence of the weather, and the entire data for that day was utilized. For the traffic volume data, the ratio by vehicle type was calculated using the Vehicle Detection System (VDS) and Automatic Vehicle Classification (AVC) data provided by the Korea Expressway Corporation [26], and the point traffic volume and point speed data in units of one hour were used through the VDS installed in the target section. However, since data on the traffic volume and speed for the entry/exit section are not provided, the estimated traffic volume for each vehicle type of the KTDB Lab Platform provided by The Korea Transport Institute [27] was reflected in the VDS data to calculate the entry/exit traffic volume.

2.2. Simulation Network Environment and AVs Settings

As mentioned above, a simulation network was built at Singal JC (Exit Hobeop, entrance to Seoul), which is 3.3 km northbound road on the Gyeongbu Expressway, which was designated as a testbed for autonomous driving. The main observation section was set to 1.4 km, including 400 m in the influence zone of the connecting part defined in the Korean Highway Capacity Manual (Figure 2). In addition, lane change is not allowed from 300 m before the actual exit section in the direction of Hobeop, and a sign and information providing system (navigation) for changing lanes is provided before 600 m, and it is designed so that the vehicle cannot join before 300 m from the entrance. Moreover, the Gyungbu expressway has a designed speed (120 kph) and a speed limit (110 km/h). Hence, we reflected on all of the road physical conditions in the network environment for embodying the real-world environment. Before building the simulation scenario, on 19 May 2018, based on the VDS traffic volume data of the section, the ratio of vehicles flowing in and out of each LOS time zone and entry/exit section was set to 20%. Moreover, based on the VDS and AVC data of the target site, operating vehicle types were divided into general vehicles, heavy vehicles, and AVs, and actual traffic data was reflected for general vehicles and heavy vehicles.
The vehicle and driving behavior setting of HVs and AVs are as imperative as road environment establishment. As the target site has an uninterrupted flow where other objects do not exist except vehicles, we applied the Wiedemann 99 Model in VISSIM. As for the AVs parameters, the parameters corresponding to Level 4, which allow safe driving even when the driver fails to respond to the request for intervention (take-over) in vehicle control, suggested by SAE, were applied to VISSIM Driving Behavior. Among the VISSIM parameter values, the spacing parameter is the parameter that shows the most remarkable difference from the HVs. CC0 parameter can adjust the distance between stopped vehicles, and the interval for maintaining the headway distance (time) can be adjusted through CC1. In addition, the allowable distance between vehicles other than the safe distance can be adjusted with CC2. Specific definitions of each parameter can be checked through the manual [28], and since VISSIM set HVs as the Default Driving Behavior, parameters suitable for the Level 4 AVs were set, as shown in the Table 1.

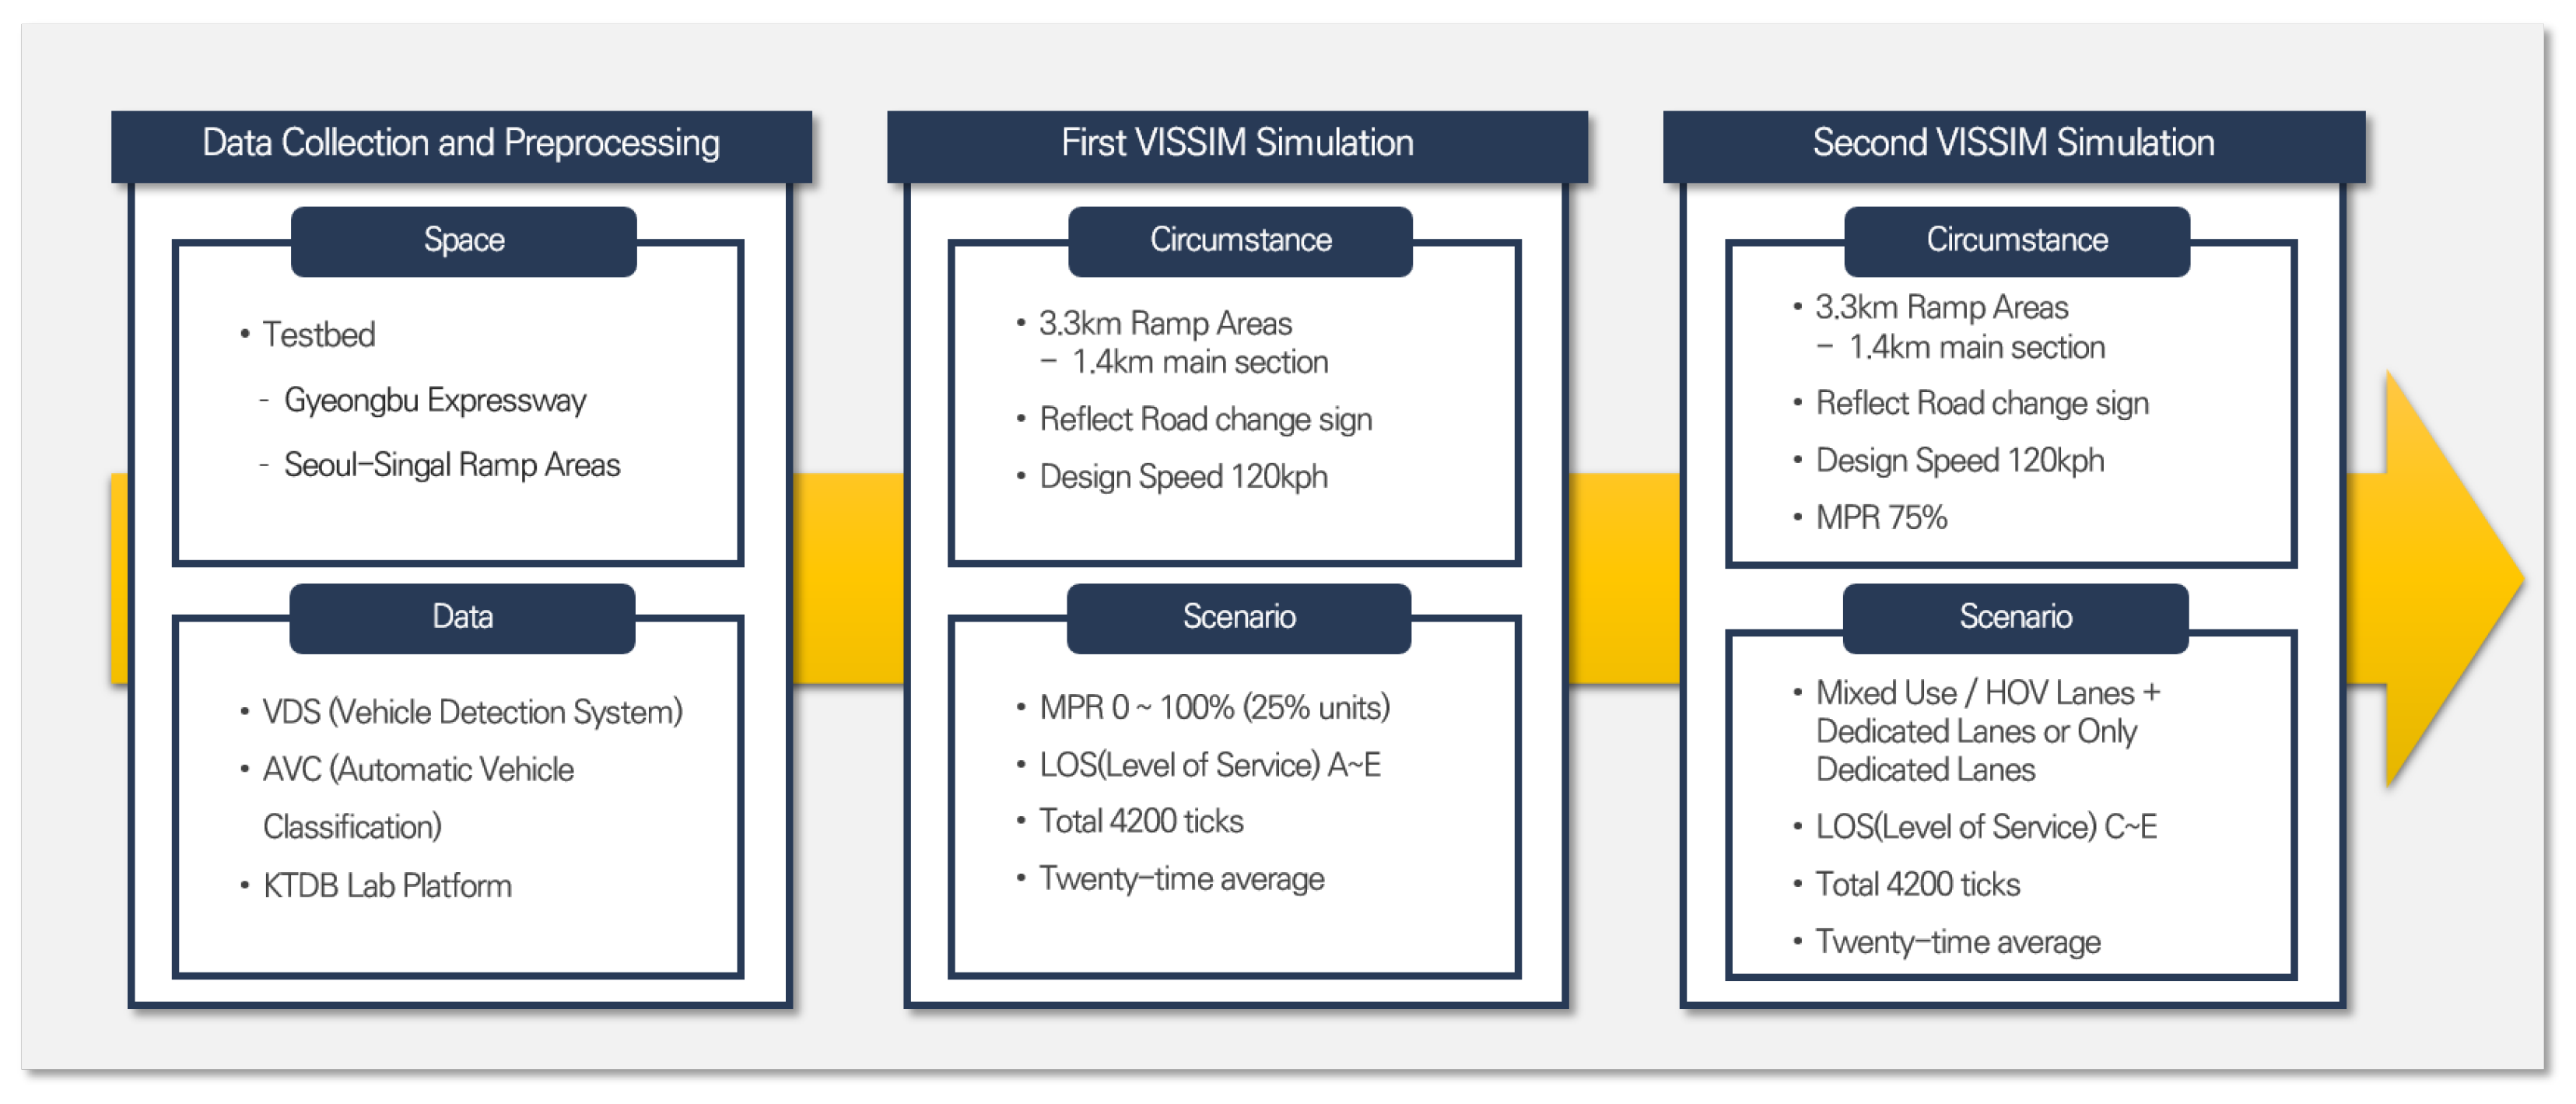
2.3. Simulation Scenarios Design and Evaluation Indicators

As presented above, we simulate the study on AVs Testbed in Gyeongbu Expressway and utilize the real data. The simulation is divided into two phases: (1) simulation of the AVs introduction effects in mixed traffic situations considering the interaction between vehicles, and (2) simulation of the optimal operation plan for the introduction of DLs for AVs. The two simulations are commonly 4200 ticks per simulation, and the average value is calculated from 20 simulations, as shown in the Figure 3.

2.3.1. Simulation of AVs Introduction Effects in Mixed Traffic Simulation

The first simulation attempts to derive the effect of introducing AVs based on the mixed situation of HVs and AVs in order to consider the interactions between vehicles (Table 2). To this end, to derive simulation effects according to the MPR of AVs, the MPRs were applied differentially to 0%, 25%, 50%, 75%, and 100%, and adjusted so that they could be operated in place of HVs. For the simulation scenario, a total of 25 scenarios were set, with five scenarios for each service level according to the LOS A–E level and AVs MPR.

2.3.2. Simulation of Optimal DLs Operation Plan for AVs

The second simulation is a simulation of the introduction and operation of DLs for AVs to consider the interaction between vehicles and infrastructure. The environment is set based on the MPR of the negative effect situation derived from the first simulation. In addition, in the case of LOS A and B, since the service level is in a free-flow condition, introducing DLs is deemed insignificant. Furthermore, in order to present a more realistic DLs operation plan, five operation methods are analyzed in consideration of the HOV lane that currently exists on the Gyeongbu Line (Table 3). Accordingly, considering three service levels and five operation plans, 15 scenarios are set to establish the optimal DLs operation plan.
Each simulation time is set to total 4200 s in total, which includes a preliminary time of 600 s for stabilization and an actual simulation time of 3600 s, and the average of the results is calculated by conducting 20 simulations for each scenario. One of the designated indicators is vehicle density which is defined as the LOS measure of the ramp section, and another is the average traffic speed of the vehicle passing through the ramp section [14,16,29]. Additionally, we decide that the delay caused by the accumulation of vehicles on the road will be a considerable index [30], so we select queue (delay time) as an additional indicator. In summary, we designate vehicle volume, average traffic speed, and queue (delay time) as indicators to investigate AVs introduction effects and DLs operation plans (Table 4).

3. Analysis Result on Scenarios of AVs Introduction Effects (Simulation 1)

Section 3 describes the analysis results of simulation 1 scenarios, analyzes them based on the previously selected indicators, and compares between indicators to determine the negative effects.

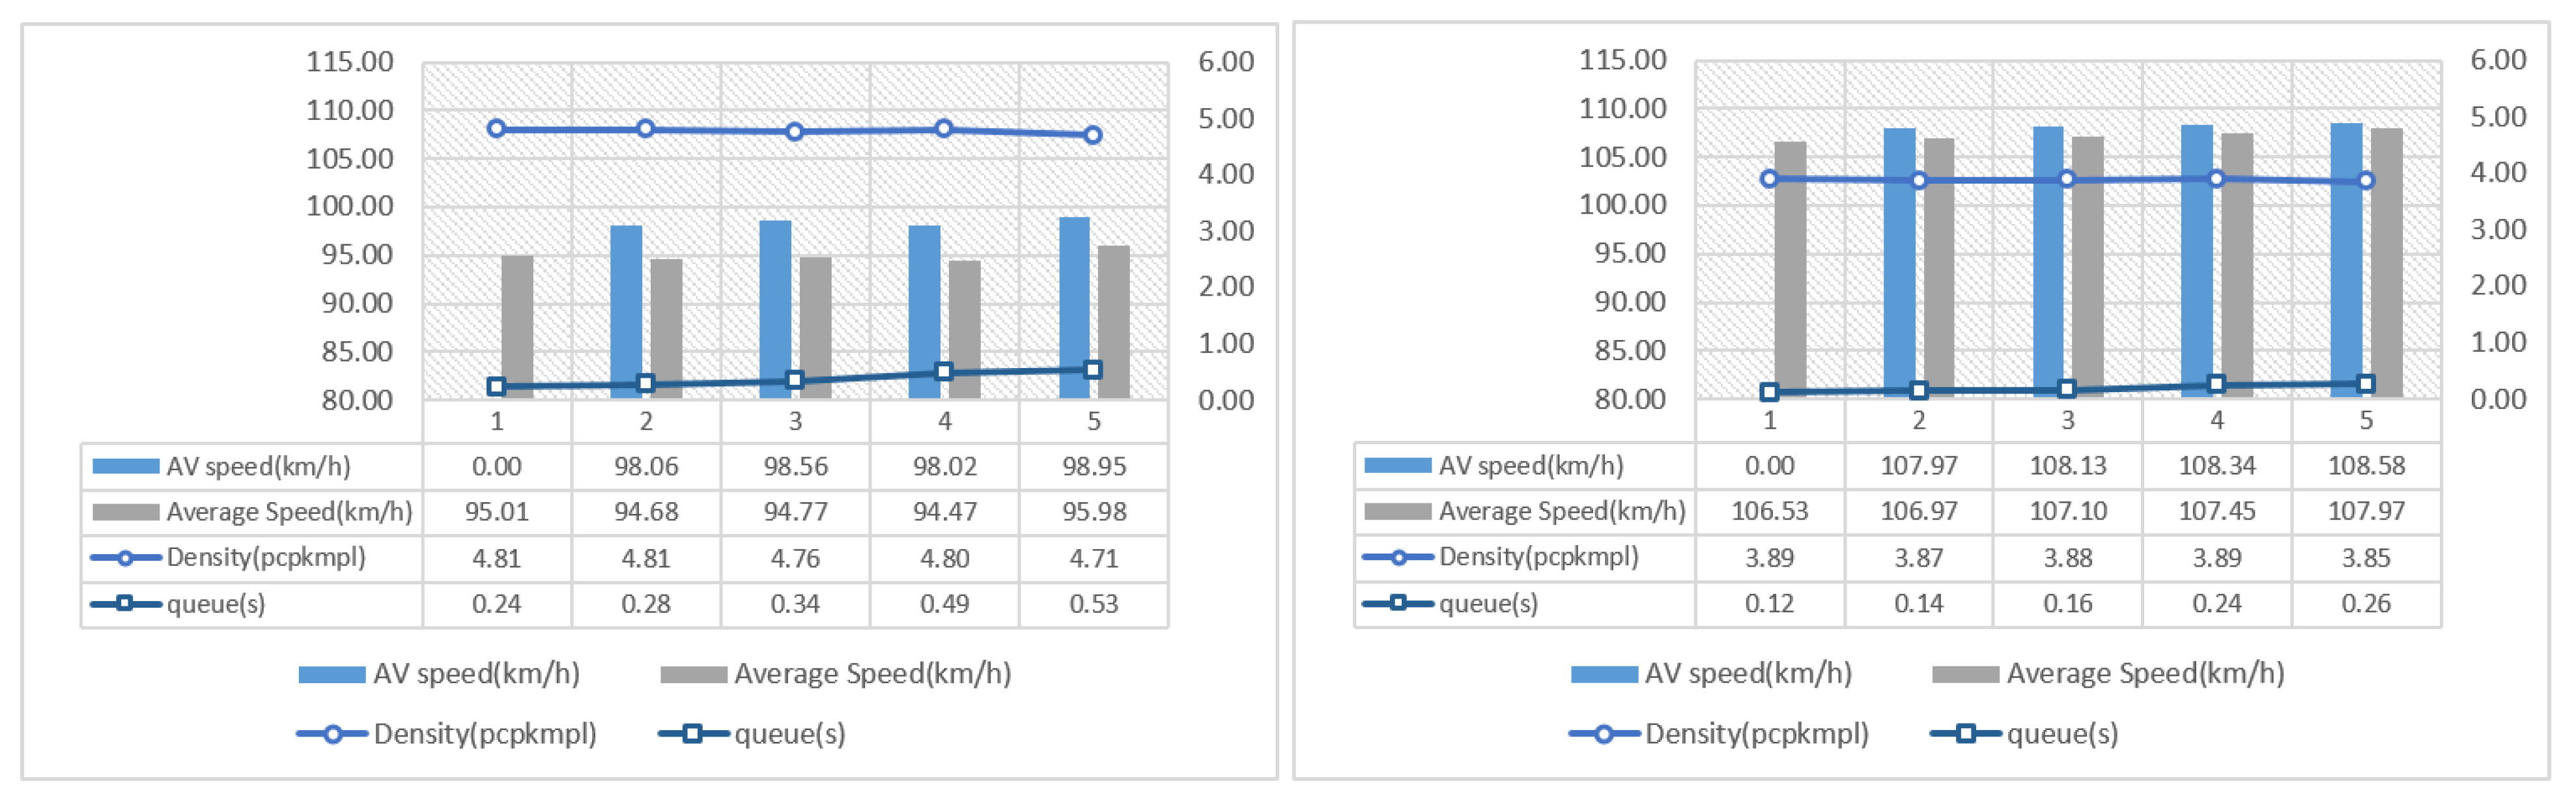
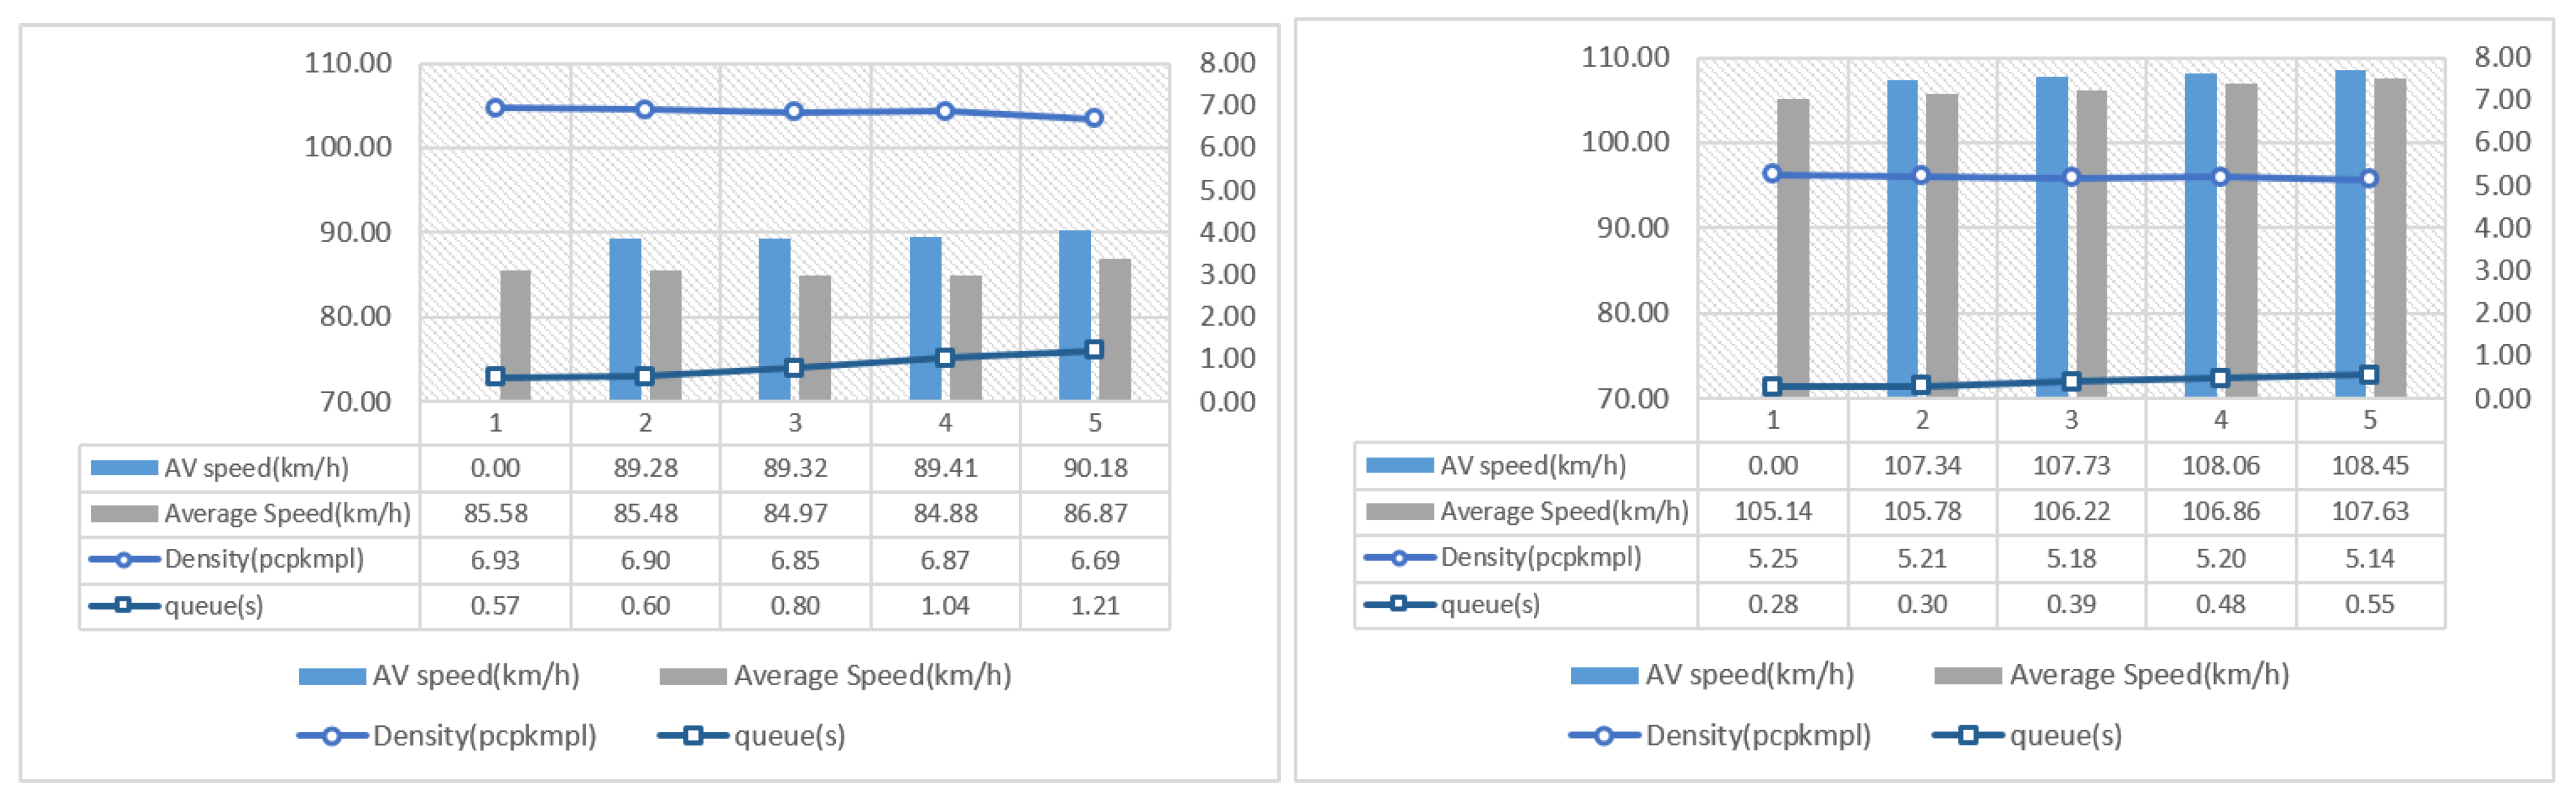
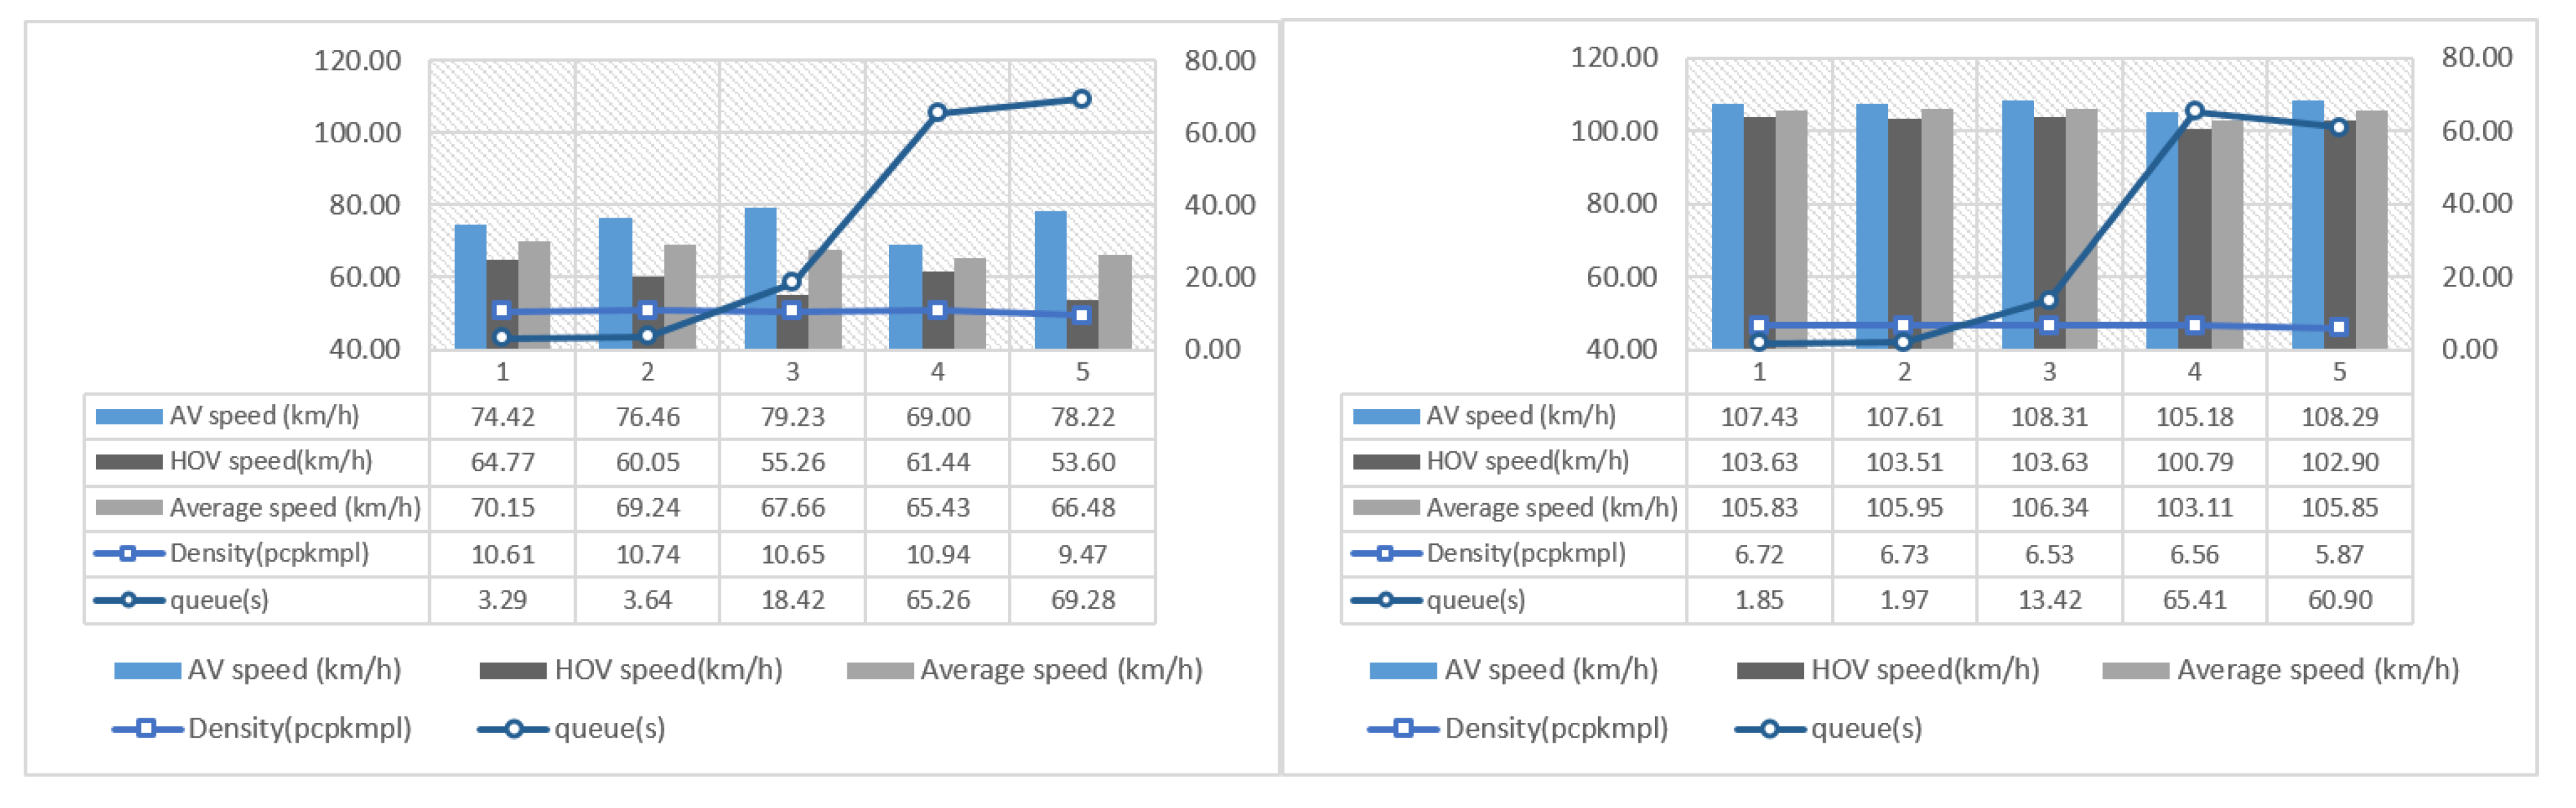
3.1. Result of Simulation 1 Scenarios

As mentioned in above, we composed 25 scenarios based on LOS and MPR, and analyzed them.
First, LOS A environment, as shown in Figure 4, which is in a free flow state with the lowest traffic volume, showed that the overall speed increased as MPR increased in both entry and exit sections. Even though some speed decreased and queue increased in the MPR 75% exit part, the MPR mainly increased, and the density decreased, resulting in increasing the overall capacity.
Similar to LOS A, LOS B, as shown in Figure 5, showed the capacity increasing effect appeared as speed increased and density decreased as MPR increased, but queue slightly increased in both exit/entry as MPR increased.
In LOS A and B, which have low traffic volume, overall capacity increasing effects appear, but queues continuously increase in some MPR environments. This is an environment with low traffic, and some negative indicators appeared as AVs were introduced, but it is considered that it will not affect the overall traffic flow to a negligible level.
As shown in Figure 6, LOS C is a stable traffic situation, but the quality is low due to increased traffic volume and congestion. The overall speed decreased in MPR 50% and 75%, and especially in the 75% environment, the queue value increased compared to the previous MPR queue value.
In the case of LOS D, as shown in Figure 7, it is a service level that increases in density due to an increase in traffic volume. In the environment of 50% and 75% MPR in the exit, the queue is decreased compared to the MPR 25%. However, the speed of AVs and the overall average speed is decreased by about 3.5%. On the other hand, in the case of the entry section, similar to LOS C, the speed increases as the MPR increases, and the delay time also decreases.
As shown in Figure 8, LOS E is the level of traffic flow in an unstable state. As the exit MPR increased, the overall speed decreased, but the queue decreased. In the entry section, the delay time was also reduced, and unlike in the exit section, it was shown that the speed also increased. However, it was found that the queue was slightly increased compared to the previous MPR in the 75% environment of the MPR at the entrance and exit.

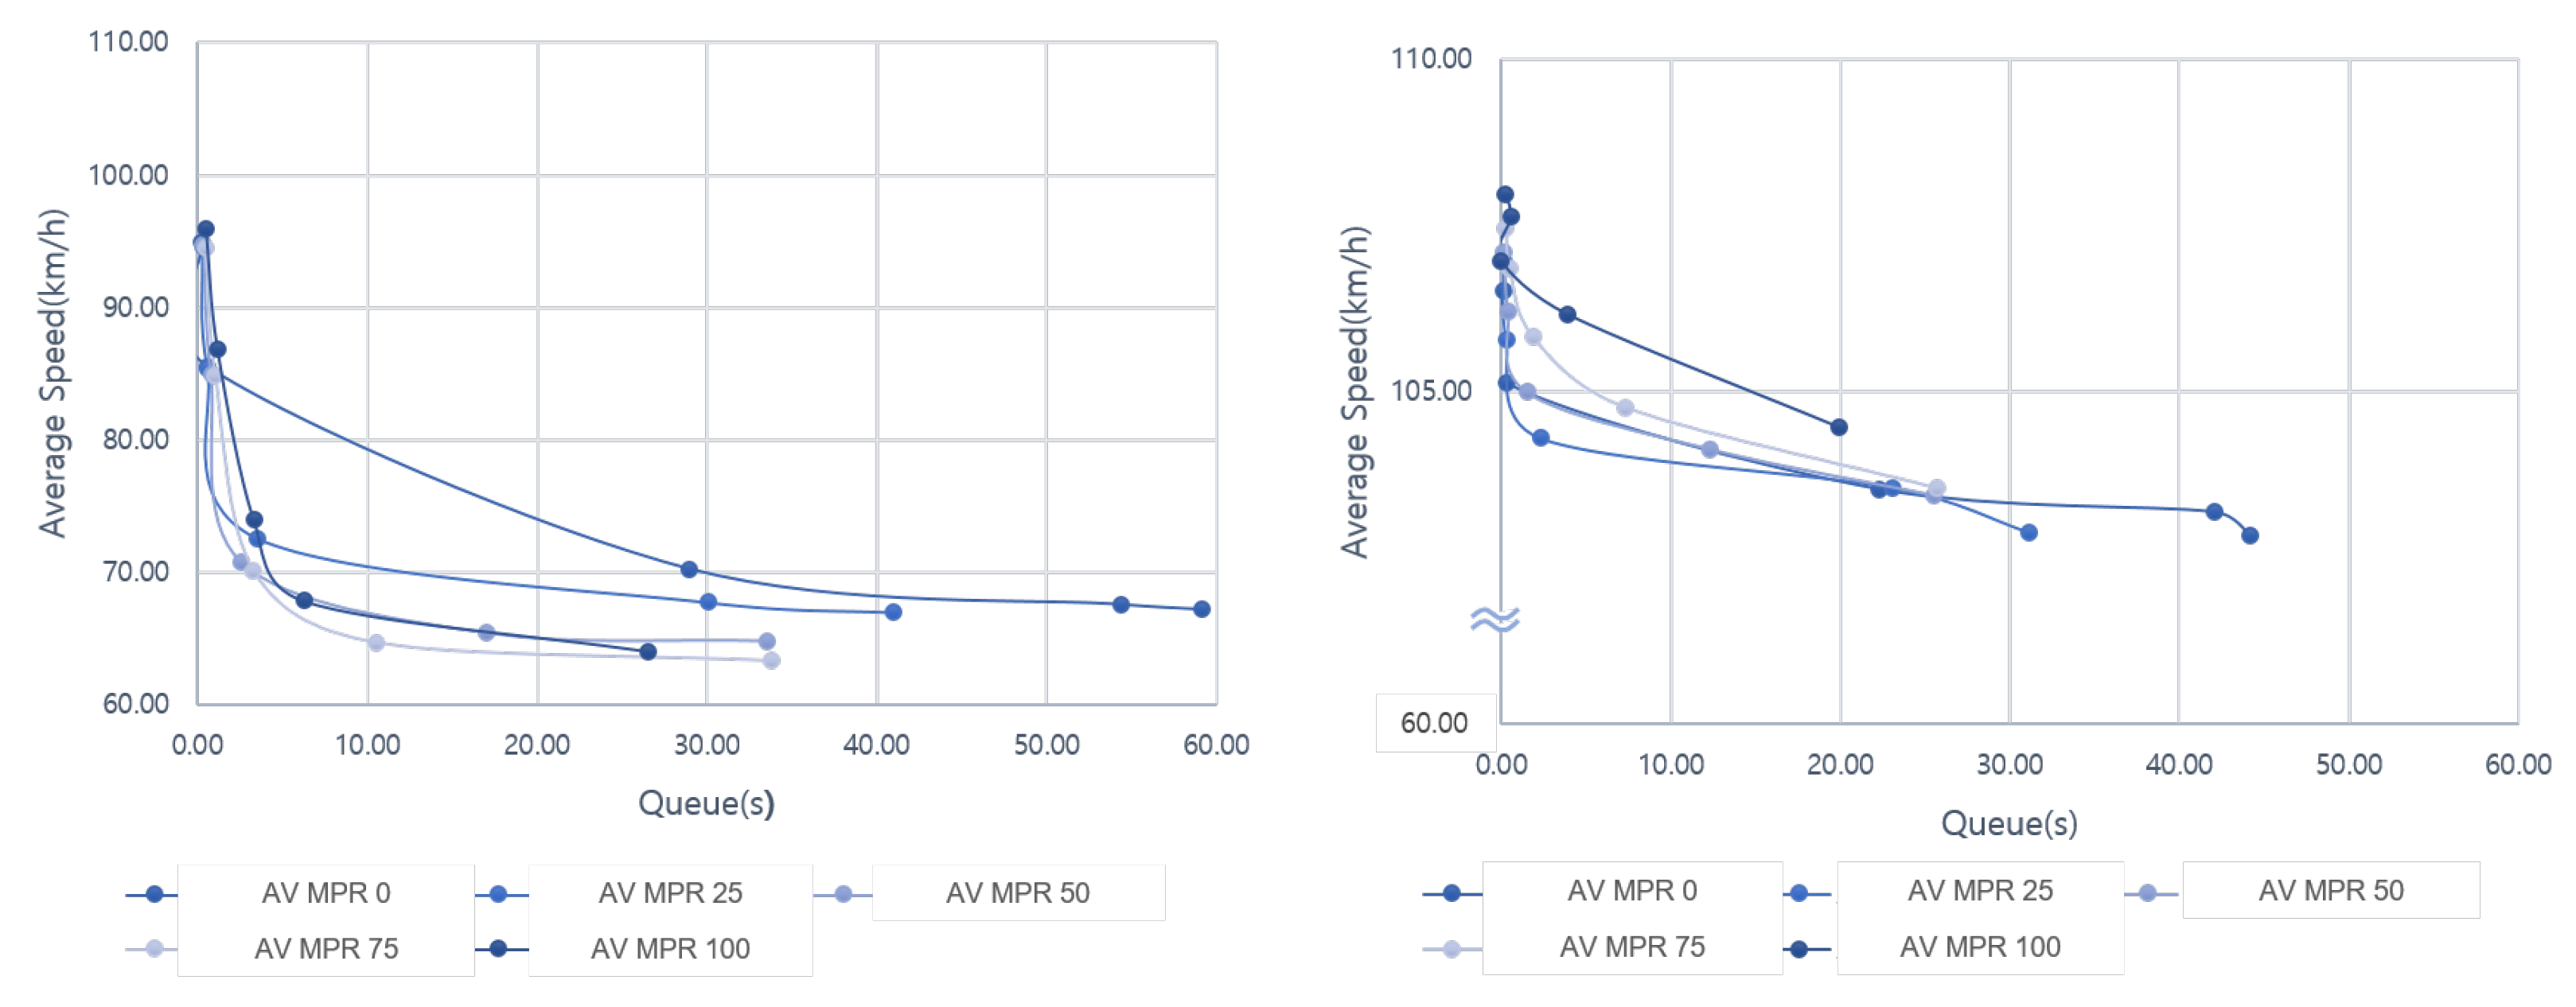
3.2. Comparative Analysis among Simulation 1 Scenario Indicators

In this section, based on the results of the simulation 1 scenario, a comparative analysis between indicators was performed to analyze the relationship between speed, density, and queue according to LOS and MPR for each scenario. The results of analyzing the changes in the density and speed of the entry/exit section are shown in the Figure 9. Overall, the service level decreases, but the road capacity increases and the average speed increases with the introduction of AVs. However, it was confirmed that there was no significant difference from the previous MPR in the 50–75% MPR environment at the entry point, or the effect was rather reduced.
Looking at the relationship between queue and density (Figure 10), it was found that the queue increased as the LOS increased for both entrances and exits, and the queue was relatively alleviated with the introduction of AVs. Although a visible effect occurred at the exit rather than the entry, the queue or capacity was not improved in the 75% MPR environment compared to the previous 50% MPR situation.
In the case of comparison of the relationship between queue and speed (Figure 11), it was found that a similar pattern was observed at the entry/exit section, and the average speed decreased slightly at the entry/exit section, but the queue decreased by up to 45%. In the case of the entry section, the traffic flow performance was improved by reducing the queue and increasing the speed.
To sum up the scenario in Simulation 1, it was found that as the MPR increases as the LOS changes, positive introduction effects such as an increase in speed, decrease in latency, and improvement of service level due to an increase in capacity occur. Since the interaction between vehicles in the exit are affects the mainline traffic flow, and the impact of vehicles from the entry section to the mainline on the mainline traffic flow is relatively small, there was a relative difference in the indicator values of the exit/entry section, so entry section speed values are relatively high. However, as LOS declined, as in some 50% and 75% MPR environments, negative effects occurered, such as lower speed and queue increased compared to the previous MPR. Even when the speed decreased but the traffic volume increased, the density also decreased relatively, increasing the capacity. Accordingly, this is not a negative effect of the introduction of AVs itself, but a new conflict and interaction between existing general vehicles and heavy vehicles as new mobility flows into a mixed traffic situation. Considering the driving behavior, the driving characteristics have changed due to the interaction between the existing vehicles and AVs which were introduced [13]. In addition, since heavy vehicles like trucks have different specifications and speed compared to general vehicles, their result occurred from more interaction or conflict with AVs [14]. For this reason, there was a bottleneck at the exit, and the bottleneck spread upstream [31], resulting in increased queues; however, the main and entrance sections have been shown to alleviate these issues. These are different results from the expected effect that the multifaceted situation of the road will change positively with the introduction of AVs, and a way to solve this problem is required. In order to confirm this more clearly, based on the indicators discussed above, a scenario in which the speed decreases or the density and queue increase compared to the previous MPR was derived. As more interactions occurred in the exit section than in the entry section, we intensively checked the exit section.
In Table 5, MPR 50% and 75% mainly showed degraded indicators in LOS C, D, and E environments with a lot of traffic volume. In addition, even in the LOS A and B environments with low traffic volume, the MPR 75% environment showed negative effects. Notably, most indicator values deteriorated in MPR 75%. Therefore, we established a simulation 2 analysis and operation strategy that consider the interaction with the infrastructure based on the MPR 75% situation in which a relatively negative effect occurred out of 25 scenarios.

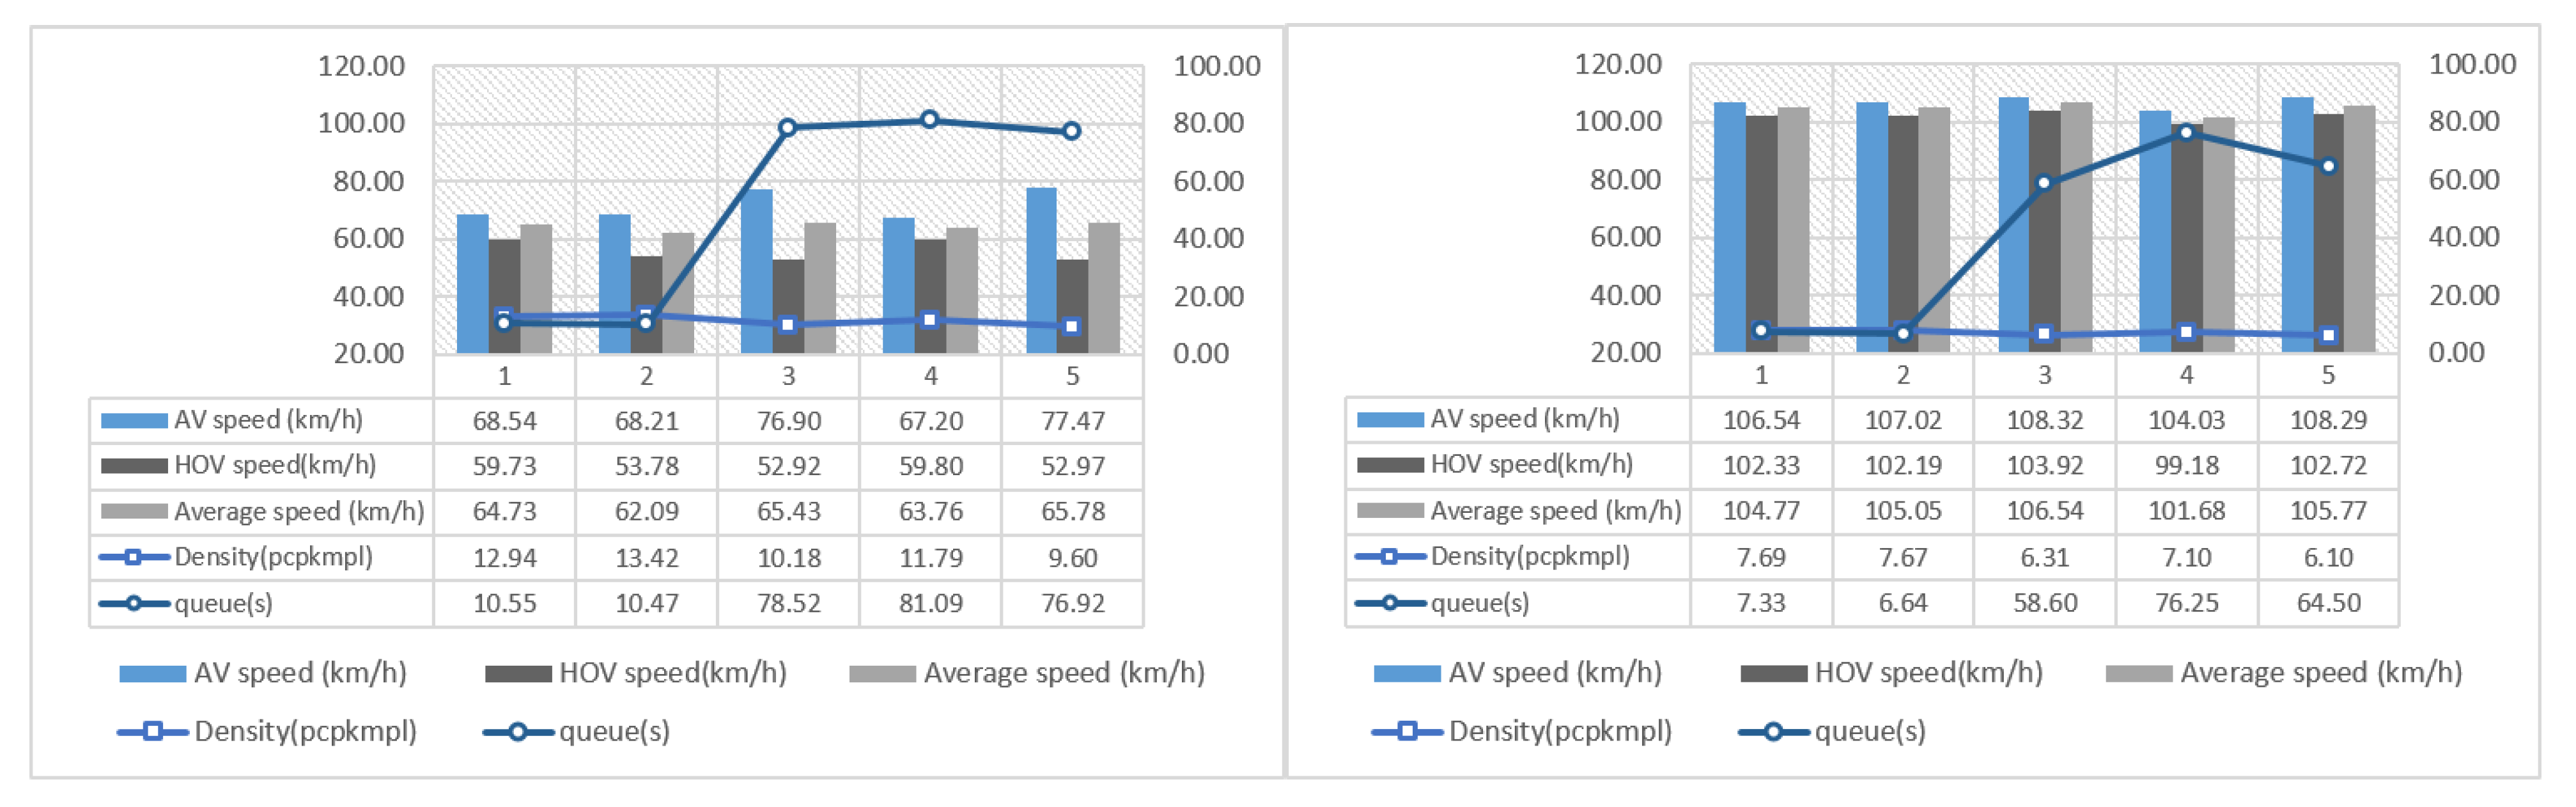
4. Analysis Result on Scenarios of DLs Introduction Effects (Simulation 2)

Section 4 is the analysis of DLs introduction effects, and this section is necessary for extracting optimal DLs strategies. In the case of DLs introduction effect scenario analysis, 15 scenarios considering LOS C to E and DLs operation plans, excluding LOS A and B, which have relatively little interaction between vehicles, were analyzed based on the above results of the 75% MPR situation. In particular, DLs operation strategies consist of five plans, including the Basic plan, Mixed-Use plan, AVs only plan, and Two DLs plans (Table 6). First, strategy 1 as the basic plan is the existing state that operates on a High-Occupancy Vehicles Lane. Second, strategy 2 is a Mixed-Use plan that changes the existing HOVL to a mixed HOV and AV lane. In other words, HOV and AV operate simultaneously on one dedicated lane. Third, strategy 3 is that one of the lanes is a dedicated lane operated only for AVs. Strategies 4 and 5 have two dedicated lanes. In the case of 4, there is an AV-DL on lane 1, a HOV-DL on lane 2, and in the case of 5, the position of the two DLs are opposite. As in simulation 1, we checked exit/entry and analyzed them using density, speed, and queue as indicators. Furthermore, as it is determined that the influence of heavy vehicles is relatively more significant than that of general vehicles as derived from simulation 1, the heavy vehicle speed indicator was additionally checked. Significantly, a vital buffer zone (transition section) was installed in the 600m section that marks the change of lane at the exit, and the part where merging is possible from the entry section was installed after 300 m.
In the LOS C-exit environment (Figure 12), although the speed of AVs increased in strategy 2 compared to strategy 1, HVs and average speed decreased and queue increased. In strategy 3 with only an AVs dedicated lane, the AVs speed was about 6% faster, but the average speed decreased and queue boosted up by about 80% compared to strategies 1 and 2. In addition, in the case of strategies 4 and 5, each with dedicated lanes, relatively negative phenomena such as a decrease in the average speed and a sharp increase in the queue were observed. Even in the entry zone, there is a difference in the degree of the index value, but the phenomenon according to each operation strategy was similar to that of the exit zone.
As a result of analysis on LOS D-exit (Figure 13), it is shown that all values of speed on strategy 2 were low, but the queue decreased compared to strategy 1. Similar to LOS C, AVs speed was faster, but the queue sharply increased in strategy 3. Notably, out of strategies 4 and 5, strategy 5 was found to be superior in all indicators compared to strategy 3, with only one dedicated vehicle. In the entry environment, most of the strategies yielded positive speed results, but in terms of the queue, strategies 1 and 2 were excellent.
Lastly, in the case of the LOS E-exit environment (Figure 14), the speed of the AVs in strategy 2 was high, and the delay time was reduced, and similar index values were shown in strategies 3 and 5. In the entry section, the overall indicators were excellent similar to LOS C and D, but it was confirmed that the delay time increased rapidly in strategies 3, 4, and 5.
Consequently, it was found that most of the indicator values of Strategy 2, which is a mixed lane for HOVs and AVs, were relatively positive in an environment where the service level was lowered. In the case of strategy 3, with only an AVs-DL, the speed value of AVs prevailed, but other negative phenomena such as a decrease in speed indicators and an increase in queue occurred. In addition, in the case of the two dedicated lane strategies, 4 and 5, the results differed depending on the location of the dedicated lane, and the fifth strategy, in which the HOV dedicated lane is in the first lane, and the AVs dedicated lane exists in the second lane, showed relatively positive indicators. Also, in the case of strategy five compared to strategy 3, it was the lower the service level, the higher the speed of AVs, and the lowest density. Considering the relationship between vehicles and infrastructure, the introduction of simple AVs-only lanes (strategy 3) could increase the efficiency of AVs driving itself, but it is contemplated as a result of lowering the overall road efficiency. Moreover, when two dedicated lanes are operated (Strategy 4 or 5), the number of lanes that HVs can operate is relatively reduced, and many conflicts occur in the transition section, resulting in relatively negative indicator values. In the case of strategies 1 and 2, a relatively positive indicator value was derived because the platoon of AVs works similarly to the specifications of a freight vehicle and can be operated without interference from other vehicles. As a result, before the introduction of AVs, heavy vehicles have an enormous impact on roads, suggesting that it is necessary to establish an infrastructure utilization strategy considering both the driving characteristics of AVs and those of heavy vehicles. As mentioned earlier, strategies can be established only by considering the speed of AVs, but establishing strategies only with the speed index of AVs may have unexpected negative effects and raise the issue of vehicle driving equity. Namely, multifaceted considerations such as operational efficiency are required when establishing an operation strategy for a dedicated lane, and it is not appropriate to establish a realistic operation plan if a strategy is established only with the speed index of AVs [25]. Therefore, in this study, we proposed a new operational efficiency indicator and judged the appropriateness of the optimal dedicated lane operation strategy based on this.

5. Measures to Establish an Operation Strategy for DLs for AVs

In this section, to establish an operation strategy for AV-DLs, we define operational efficiency, which is a new indicator, and based on this, we propose the optimal dedicated lane operation strategy and utilization plan for each situation among the five operation strategies considered above.

5.1. Judgment Methodology for Establishment of Operational Strategy for AVs Based Proposed New Indicator

Highway traffic operation and management must be carried out in terms of the construction purpose of the highway itself and services for drivers to ensure mobility beyond the loss of competitiveness due to increased congestion costs and low driving speed. Traffic flow is expected to change with the advent of new mobility in the era of AVs, and it is necessary to diagnose negative situations in advance and decide on appropriate alternatives (strategies) to alleviate unexpected results. In particular, according to [25], when introducing a dedicated lane for new mobility, they affirmed that a comprehensive strategy considering MPR, operational perspective, traffic per-formance, environment, and driver characteristics are needed. Accordingly, various studies have been conducted on AVs lanes, but most of them have only presented the positive effects of the DLs introduction [12,31,32,33,34,35], and research on the presentation of utilization policy for DLs has been understudied. Therefore, we intend to present a judgment methodology for establishing an operation strategy for self-driving cars based on the situation in which negative delay/conflict occurs. To this end, various important factors (safety, environmental factors, etc.) should be considered in combination, but this study presents a new indicator of operational efficiency to establish an operational strategy that utilizes most of the existing infrastructure. This is an indicator that can indicate operational efficiency by minimizing the negative impact of the introduction of AVs. Among the objects on the road, the characteristics of DLs were reflected in order to consider the operating characteristics of heavy vehicles and AVs, which are expected to have many conflicts corresponding to interactions between vehicles, and to consider interactions with infrastructure. The newly defined equation for operational efficiency indicators is as follows.
E r o a d = V L O S ¯ * V L O S A V s * M P R [ ( V H O V L O S * H O V r a t e ) * Q T L O S * D L ]
where
D L : N u m b e r o f D e d i c a t e d L a n e s V L O S ¯ : A v e r a g e s p e e d b y L O S V L O S A V s : A u t o m a t e d v e h i c l e s p e e d b y L O S V H O V L O S : H i g h O c c u p a n c y v e h i c l e s p e e d b y L O S Q T L O S : Q u e u e ( T i m e d e l a y b y L O S )
In order to consider road operation efficiency in a situation where the MPR of AVs is high, indicators were calculated by reflecting the speed of AVs, HOV speed, the average speed of all vehicles on the road, queue (delay time), and the number of operating dedicated lanes. It is assumed that the higher the speed of the AVs, the more positive the operation effect appears, and various characteristics such as platoon driving are reflected. In the case of HOV speed, it was assumed that the higher the speed, the more conflicting effects occurred, resulting in a hindrance phenomenon from the perspective of road operation. In the case of delay time, as previously confirmed, it was assumed that the shorter the delay time, the higher the capacity of the entire road. In addition, in the case of average speed, the operating efficiency of all vehicles on the road can be considered through speed, which is reflected. Finally, in the case of the number of lanes operated by dedicated lanes, it is operated based on vehicles that are heavily affected by conflicts, but it may interfere with the operation of HVs, so we considered and reflected in the equation. The operation strategy score was calculated based on the presented operation efficiency equation, and the operation strategy of a dedicated lane reflecting various situations was evaluated by converting it into 0–1 score using min-max scaling (Table 7).
At LOS C, with relatively low traffic volume, the most appropriate operation strategy is to maintain the existing HOV lane (Basic) for both exits and entries, and the Mixed-Use strategy can also be adopted as an appropriate alternative plan. At LOS D, the most appropriate operation strategy is Mixed-Use, and the estimation score of Mixed-Use is the highest at LOS E; thus, it is derived as the optimal operation strategy. This is because the delay time increases rapidly as the traffic volume increases, but it is contemplated that positive operational efficiency was derived by minimizing the conflict between trucks and AVs in the Basic and Mixed-Use strategies. Significantly, strategy 3 operates only on lanes dedicated to AVs, and even with the advent of a full-fledged autonomous driving era, it is judged not to be the optimal operating strategy considering the relationship with other vehicles. Finally, in the case of strategies 4 and 5, when a dedicated lane for two vehicles with a large influence on the road is introduced, the operating efficiency of the vehicle can be improved, but it could be a strategy that decreases the efficiency in terms of overall road operation. Therefore, in order to introduce AVs-DLs like this, it is necessary to use an operation strategy that can increase the performance of the entire traffic flow, and it is crucial to present an optimal operation strategy plan according to the overall traffic situation. Through this method, the effect of introducing optimal dedicated lanes for each road can be established, and it is expected that it will be possible to support decision-making on the establishment of the optimal operation strategy. Accordingly, we propose a plan to utilize the establishment of an optimal dedicated lane operation strategy.

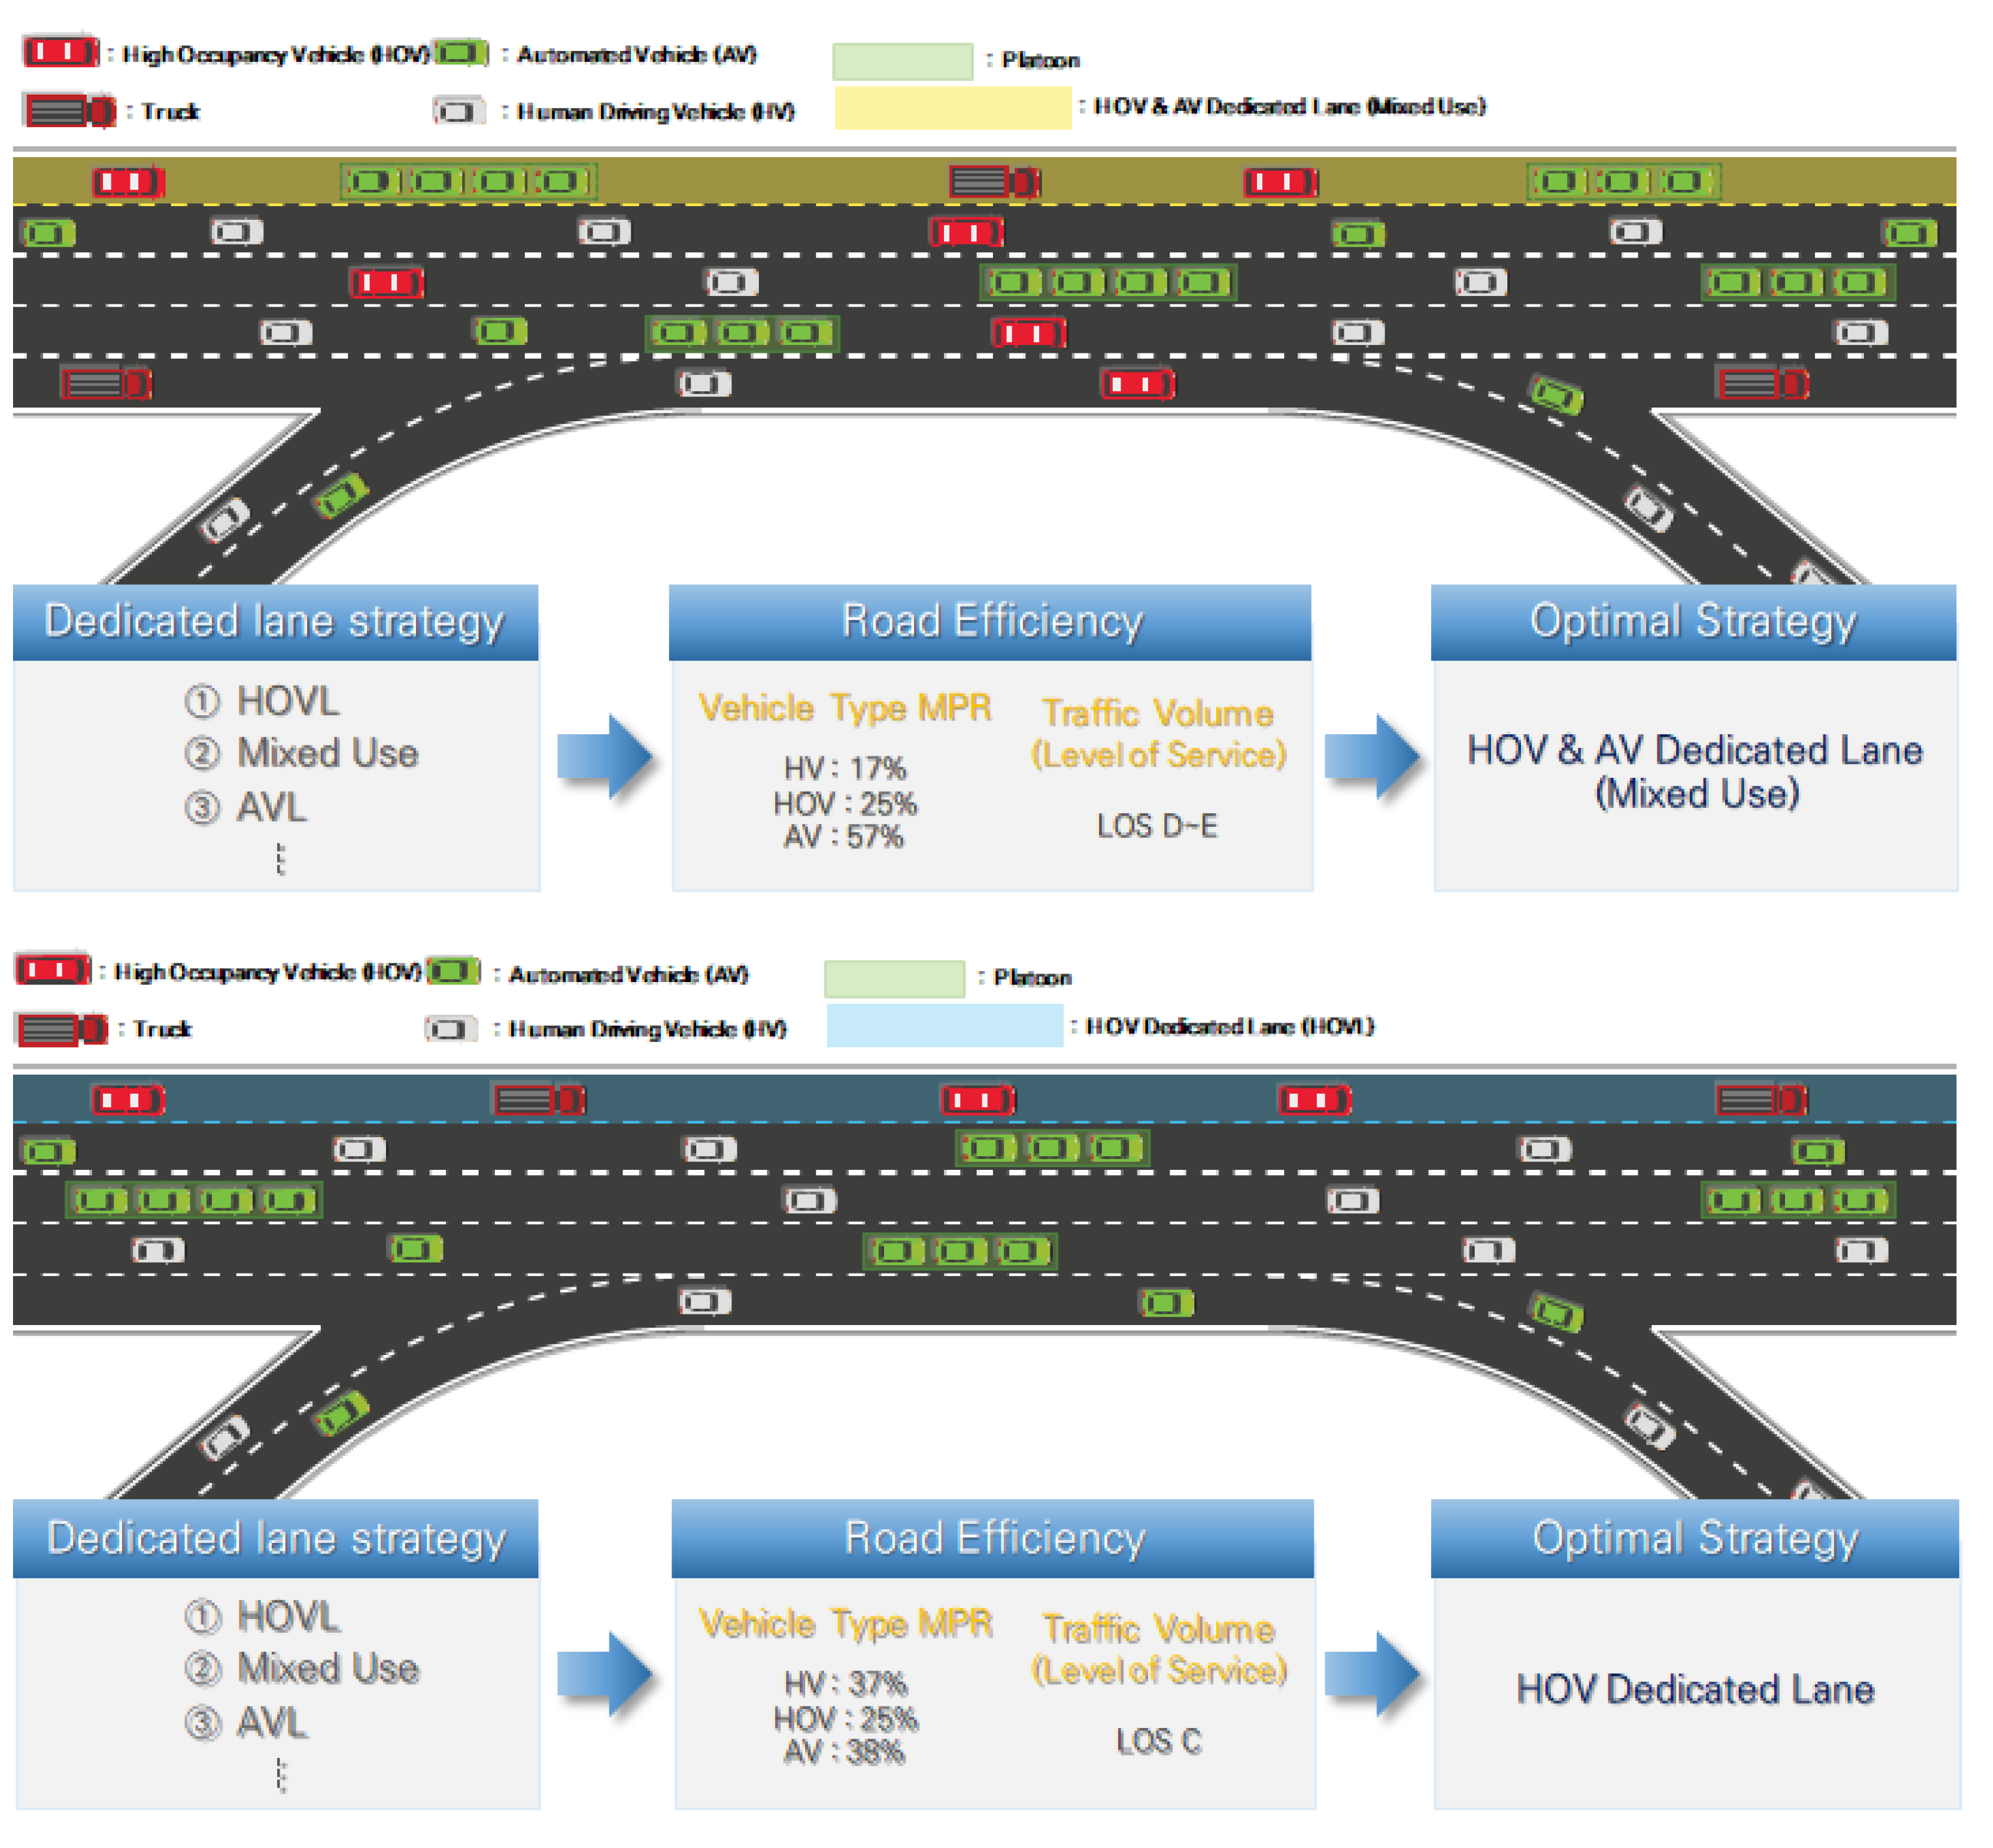
5.2. Examples of Optimal DLs Operation Strategies for AVs

As the commercialization of AVs progresses, various transportation operation strategies are expected to be presented, and the most actively discussed among them is the dedicated lane operation strategy. In line with this trend, and efficient operation strategy that reflects the traffic situation is required so that it can be applied in practice according to the introduction of dedicated lanes for AVs. In particular, since there are still practical difficulties for all vehicles on the road to be AVs, an operation strategy must be established in consideration of the mixed situation with general and heavy vehicles. Considering these various environments and conditions, a Mixed-Use strategy can be proposed as a new AVs-DLs operation strategy. In this study, the Mixed-Use strategy was proposed in the MPR 75% environment, but the optimal operation strategy can be adopted by considering the LOS and the ratio of vehicle types, including AVs in the link. In other words, the vehicle type and traffic volume of the link in which the vehicle is operated are monitored, and the appropriate operation strategy is reflected on the road in consideration of the MPR of the AVs in the link and the link service level. A conceptual diagram and examples for this are presented as shown (Figure 15). For example, in the case of a link with an about MPR 70% environment and traffic volume level of LOS D among the vehicle types in the link in the road condition of the five-lane entry/exit section, a Mixed-Use operation strategy can be adopted when a decision on the introduction of a dedicated lane is required. The optimal dedicated lane operation strategy above can be a new FTMS (Free/Expressway Traffic Management System) strategy that can be applied in the era of autonomous driving. In addition, it is expected that C-ITS and V2X will be able to provide an optimal operation strategy according to the road conditions in real-time. Moreover, it is expected that a more effective dedicated lane operation strategy can be presented when additionally considering the geometric characteristics of the road and the platooning of heavy vehicles from the perspective of optimal dedicated road operation efficiency.

6. Conclusions

As the new mobility era arrives, various positive effects are expected to arise, but unless it is an "ideal" situation, negative phenomena that have not been considered at some commercialization points may occur. These problems need to be prevented by reviewing them in advance before AVs are introduced and commercialized, and most basically, the interaction between existing vehicles and newly introduced vehicles and with existing infrastructure needs to be considered. In particular, since the expressway entry and exit section is a significant section where conflicts due to entry vehicles and exit vehicles joining the main section, it is necessary to preemptively review the effects that may occur due to the introduction of AVs. Accordingly, in this study, an analysis of the introduction effect caused by the MPR of AVs and the optimal dedicated lane plan were proposed to solve the situation in which the introduction establish effect is impeded in terms of infrastructure in the testbed section of the AVs in Korea.
The effect of introducing AVs was accompanied by positive effects, such as an increase in AVs MPR, an increase in road capacity, and a decrease in delay time. However, it was shown that the effect decreased compared to the previous MPR in the 75% MPR environment. This is cogitated as the result of conflicts arising from the operation of some heavy vehicles and general vehicles, although most objects on the road are AVs. Accordingly, in order to solve the effect impediment phenomenon, operating efficiency indicators for various AVs-DLs operational strategies in the MPR 75% environment were newly defined and an operation strategy was established accordingly. As a result of establishing an optimal dedicated lane operation strategy from the perspective of operational efficiency, the Mixed-Use strategy for operating AVs together on the currently operated HOV lane is the optimal dedicated lane. Moreover, when the traffic volume is low, it is appropriate to maintain only the HOV lane environment. This study is significant in that it is an integrated study, not an individual study of the introduction of AVs and DLs, and it is meaningful in suggesting a more effective method of operating dedicated lanes beyond merely presenting the effect of introducing simple AVs and DLs.
This study focused on the entry and exit sections where inter-vehicle interactions occur the most, so it could not consider the expressway mainline section, toll gates, transition section, and urban environment. In addition, AVs were assumed to be passenger cars, and there is a limitation in considering only the driving characteristics of AVs themselves without considering communication such as V2X. Furthermore, by presenting only the operational efficiency indicators defined above, it is imperative to conduct additional research in various road environments in consideration of other important indicators in the future. It is necessary to conduct research considering a more complex environment for presenting detailed operation strategy with available operation time, assuming that other vehicles, such as heavy vehicles, are also applied to employing an autonomous driving system. Lastly, the simulation analysis results were not actually verified. This is an analysis in advance for the efficient operation of Level 4 AVs to be operated on future roads. Nevertheless, we utilized the VDS data for minimizing and synchronizing the difference from reality.

Author Contributions

Conceptualization, M.K. and I.-j.I. methodology, M.K. and I.-j.I.; software, M.K.; validation, M.K.; formal analysis, M.K.; investigation, M.K.; resources, M.K.; data curation, M.K., I.-j.I., and J.S.; writing—original draft preparation, M.K.; writing—review and editing, M.K.; visualization, M.K.; supervision, K.H.; project administration, K.H.; funding acquisition, K.H. All authors have read and agreed to the published version of the manuscript.

Funding

This work was supported by the Korea Agency for Infrastructure Technology Advancement (KAIA) grant funded by the Ministry of Land, Infrastructure and Transport (Grant 22AMDP-C161754-02).

Data Availability Statement

Vehicle Detection System (VDS): http://data.ex.co.kr/portal/traffic/ trafficVds Automatic Vehicle Classification (AVS): https://www.data.go.kr/data/15066742/openapi.do Traffic Volume (KTDB): https://www.ktdb.go.kr/www/selectBbsNttList.do?bbsNo=18&key=301. All accessed on 6 July 2022.

Conflicts of Interest

The authors declare no conflict of interest.

References

  1. J3016_202104; Taxonomy and Definitions for Terms Related to Driving Au-tomation Systems For On-Road Motor Vehicles. SAE International: Warrendale, PA, USA, 2021.
  2. Lee, K.; Jeon, S.; Kim, H.; Kum, D. Optimal path tracking control of autonomous vehicle: Adaptive full-state linear quadratic Gaussian (LQG) control. IEEE Access 2019, 7, 109120–109133. [Google Scholar] [CrossRef]
  3. Singh, S. Critical Reasons for Crashes Investigated in the National Motor Vehicle Crash Causation Survey (No. DOT HS 812 115); US Department of Transportation: Washington, DC, USA, 2015. [Google Scholar]
  4. Wagner, P. Traffic control and traffic management in a transportation system with autonomous vehicles. In Autonomous Driving; Springer: Berlin/Heidelberg, Germany, 2016; pp. 301–316. [Google Scholar]
  5. Liu, H.; Kan, X.D.; Shladover, S.E.; Lu, X.Y.; Ferlis, R.E. Modeling impacts of co-operative adaptive cruise control on mixed traffic flow in multi-lane freeway facilities. Transport. Res. Part C Emerg. Technol. 2018, 95, 261–279. [Google Scholar] [CrossRef]
  6. Khattak, Z.H.; Smith, B.L.; Park, H.; Fontaine, M.D. Cooperative lane control appli-cation for fully connected and automated vehicles at multilane freeways. Transp. Res. Part C Emerg. Technol. 2020, 111, 294–317. [Google Scholar] [CrossRef]
  7. Kang, M.H.; Lm, I.J.; Song, J.I.; Hwang, K.Y. Analyzing Traffic Impacts of Auto-mated Vehicles on Expressway Weaving Sections. J. Transp. Res. 2019, 26, 33–47. [Google Scholar]
  8. Kang, M.; Song, J.; Hwang, K. The Extraction of Automated Vehicles Traffic Accident Factors and Scenarios Using Real-World Data. In Congress on Intelligent Systems; Springer: Singapore, 2022; pp. 1–15. [Google Scholar]
  9. Kang, M.; Song, J.; Hwang, K. For Preventative Automated Driving System (PADS): Traffic Accident Context Analysis Based on Deep Neural Networks. Electronics 2020, 9, 1829. [Google Scholar] [CrossRef]
  10. Kang, M.; Lee, W.; Hwang, K.; Yoon, Y. Vision Transformer for Detecting Critical Situations and Extracting Functional Scenario for Automated Vehicle Safety Assessment. Sustainability 2022, 14, 9680. [Google Scholar] [CrossRef]
  11. Ye, L.; Yamamoto, T. Modeling connected and autonomous vehicles in heteroge-neous traffic flow. Phys. A Stat. Mech. Its Appl. 2018, 490, 269–277. [Google Scholar] [CrossRef]
  12. Amirgholy, M.; Shahabi, M.; Oliver Gao, H. Traffic automation and lane manage-ment for communicant, autonomous, and human-driven vehicles. Transport. Res. Part C Emerg. Technol. 2020, 111, 477–495. [Google Scholar] [CrossRef]
  13. Lee, S.Y.; Oh, C. Lane Change Behavior of Manual Vehicles in Automated Vehicle Platooning Environments. J. Korean Soc. Transp. 2017, 35, 332–347. [Google Scholar] [CrossRef]
  14. Lee, S.; Jeong, E.; Oh, M.; Oh, C. Driving aggressiveness management policy to enhance the performance of mixed traffic conditions in automated driving environments. Transp. Res. Part A Policy Pract. 2019, 121, 136–146. [Google Scholar] [CrossRef]
  15. Litman, T. Autonomous Vehicle Implementation Predictions; Victoria Transport Policy Institute: Victoria, BC, Canada, 2017; p. 28. [Google Scholar]
  16. Lumiaho, A.; Malin, F.; Road Transport Automation: Road Map and Action Plan 2016–2020. Liikenneviraston tutkimuksia ja selvityksiä. 2016. Available online: https://urn.fi/URN:ISBN:978-952-317-263-0 (accessed on 6 July 2022).
  17. McDonald, S.S.; Rodier, C. Envisioning automated vehicles within the built envi-ronment: 2020, 2035, and 2050. In Road Vehicle Automation 2; Springer: Cham, Switzerland, 2015; pp. 225–233. [Google Scholar]
  18. Lee, S.; Oh, C.; Hong, S. Exploring lane change safety issues for manually driven vehicles in vehicle platooning environments. IET Intell. Transp. Syst. 2018, 12, 1142–1147. [Google Scholar] [CrossRef]
  19. Kockelman, K.M.; Avery, P.; Bansal, P.; Boyles, S.D.; Bujanovic, P.; Choudhary, T.; Clements, L.; Domnenko, G.; Fagnant, D.; Helsel, J.; et al. Implications of Connected and Automated Vehicles on the Safety and Operations of Roadway Networks: A Final Report (No. FHWA/TX-16/0-6849-1). 2016. Available online: https://trid.trb.org/view/1428776 (accessed on 6 July 2022).
  20. Talebpour, A.; Mahmassani, H.S.; Elfar, A. Investigating the effects of reserved lanes for autonomous vehicles on congestion and travel time reliability. Transp. Res. Rec. 2017, 2622, 1–12. [Google Scholar] [CrossRef]
  21. Papadoulis, A.; Quddus, M.; Imprialou, M. Evaluating the safety impact of con-nected and autonomous vehicles on motorways. Accid. Anal. Prev. 2019, 124, 12–22. [Google Scholar] [CrossRef]
  22. Machiani, S.G.; Ahmadi, A.; Musial, W.; Katthe, A.; Melendez, B.; Jahangiri, A. Implications of a Narrow Automated Vehicle-Exclusive Lane on Interstate 15 Ex-press Lanes. J. Adv. Transp. 2021, 2021, 6617205. [Google Scholar]
  23. Li, T.; Guo, F.; Krishnan, R.; Sivakumar, A.; Polak, J. Right-of-way reallocation for mixed flow of autonomous vehicles and human driven vehicles. Transp. Res. Part C Emerg. Technol. 2020, 115, 102630. [Google Scholar] [CrossRef]
  24. Ma, K.; Wang, H. Influence of exclusive lanes for connected and autonomous ve-hicles on freeway traffic flow. IEEE Access 2019, 7, 50168–50178. [Google Scholar] [CrossRef]
  25. Rad, S.R.; Farah, H.; Taale, H.; van Arem, B.; Hoogendoorn, S.P. Design and operation of dedicated lanes for connected and automated vehicles on motorways: A concep-tual framework and research agenda. Transp. Res. Part C Emerg. Technol. 2020, 117, 102664. [Google Scholar]
  26. Korea Expressway Corporation. Available online: https://www.ex.co.kr/ (accessed on 6 July 2022).
  27. The Korea Transport Institute. Available online: https://www.ktdb.go.kr/ (accessed on 6 July 2022).
  28. PTV Group. Available online: https://www.ptvgroup.com/en/solutions/products/ptv-vissim/ (accessed on 6 July 2022).
  29. Ministry of Land, Infrastructure and Transport. Available online: https://www.molit.go.kr/english/ (accessed on 6 July 2022).
  30. Mohajerpoor, R.; Ramezani, M. Mixed flow of autonomous and human-driven vehicles: Analytical headway modeling and optimal lane management. Transp. Res. Part C Emerg. Technol. 2019, 109, 194–210. [Google Scholar] [CrossRef]
  31. Xiao, L.; Wang, M.; Van Arem, B. Traffic flow impacts of converting an HOV lane into a dedicated CACC lane on a freeway corridor. IEEE Intell. Transp. Syst. Mag. 2019, 12, 60–73. [Google Scholar] [CrossRef]
  32. Qom, S.F.; Xiao, Y.; Hadi, M. Evaluation of cooperative adaptive cruise control (CACC) vehicles on managed lanes utilizing macroscopic and mesoscopic simula-tion. In Proceedings of the Transportation Research Board 95th Annual Meeting (No. 16-6384), Washington, DC, USA, 10–14 January 2016. [Google Scholar]
  33. Ivanchev, J.; Knoll, A.; Zehe, D.; Nair, S.; Eckhoff, D. Potentials and implications of dedicated highway lanes for autonomous vehicles. arXiv 2017, arXiv:1709.07658. [Google Scholar]
  34. Vander Laan, Z.; Sadabadi, K.F. Operational performance of a congested corridor with lanes dedicated to autonomous vehicle traffic. Int. J. Transp. Sci. Technol. 2017, 6, 42–52. [Google Scholar] [CrossRef]
  35. Zheng, F.; Liu, C.; Liu, X.; Jabari, S.E.; Lu, L. Analyzing the impact of automat-ed vehicles on uncertainty and stability of the mixed traffic flow. Transp. Res. Part C Emerg. Technol. 2020, 112, 203–219. [Google Scholar] [CrossRef]
Figure 1. Spatial scope of the study: The left image presents the metropolitan area in Korea and the yellow part involves the AVs test bed. The yellow dotted line in the right image indicates the specific target site.
Sustainability 14 11490 g001
Figure 2. The simulation network environment (Singal JC Northbound Line Entry and Exit Section). In the exit section, lane change was not allowed from 300 m and the road provided signs (information) about lane change before 600 m. In the entry section, vehicles cannot merge to the main lane before 300 m.
Sustainability 14 11490 g002
Figure 3. Overall flow simulation scenarios design.
Sustainability 14 11490 g003
Figure 4. The result of Simulation 1—LOS A. The left graph is the exit section, and the right graph is the entry section.
Sustainability 14 11490 g004
Figure 5. The result of Simulation 1—LOS B. The left graph is the exit section, and the right graph is the entry section.
Sustainability 14 11490 g005
Figure 6. The result of Simulation 1—LOS C. The left graph is the exit section, and the right graph is the entry section.
Sustainability 14 11490 g006
Figure 7. The result of Simulation 1—LOS D. The left graph is the exit section, and the right graph is the entry section.
Sustainability 14 11490 g007
Figure 8. The result of Simulation 1—LOS E. The left graph is the exit section, and the right graph is the entry section.
Sustainability 14 11490 g008
Figure 9. The comparison of Density and Speed. The left graph is the exit section, and the right graph is the entry section.
Sustainability 14 11490 g009
Figure 10. The comparison of Queue and Density. The left graph is the exit section, and the right graph is the entry section.
Sustainability 14 11490 g010
Figure 11. The comparison of Queue and Density. The left graph is the exit section, and the right graph is the entry section.
Sustainability 14 11490 g011
Figure 12. The result of Simulation 2—LOS C. The left graph is the exit section, and the right graph is the entry section.
Sustainability 14 11490 g012
Figure 13. The result of Simulation 2—LOS D. The left graph is the exit section, and the right graph is the entry section.
Sustainability 14 11490 g013
Figure 14. The result of Simulation 2—LOS E. The left graph is the exit section, and the right graph is the entry section.
Sustainability 14 11490 g014
Figure 15. Establishment and Utilization of Strategy for Optimal Dedicated Vehicle for Self-driving Vehicles.
Sustainability 14 11490 g015
Table 1. AVs parameters for simulation.
DivisionCodeDefinitionVISSIM DefaultAutomated Vehicle (SAE Lv.4)
SpacingStand still distance (CC0)The desired distance between stopped vehicles1.50 m0.5 m
Headway time (CC1)Headway (in second)0.9 s0.6 s
Following Variation (CC2)The distance in addition to the allowed safety distance that is permissible before the vehicle-drive unit moves closer to the preceding vehicle4.00 m0 m
SpeedThreshold for entering following (CC3)Seconds before reaching the safety distance the driver starts to decelerate−8.00 s0 s
Negative following threshold (CC4)The maximum allowable speed difference where following vehicle is faster than preceding vehicle0.41 km/h0 km/h
Positive following threshold (CC5)The maximum allowable speed difference where following vehicle is faster than preceding vehicle0.41 km/h0 km/h
AccelerationSpeed dependency of oscillation (CC6)Influence of distance on speed oscillation11.440
Oscillation acceleration (CC7)Influence of vehicle acceleration during car following oscillation0.25 m0.4 m
Acceleration (CC8)Desired acceleration when starting from standstill3.5 m/s 2 3.8 m/s 2
OtherAcceleration with 80 km/h (CC9)Desired acceleration at 80 km/h1.5 m/s 2 1.8 m/s 2
Look ahead distance observed vehiclesNumber of vehicles that can see forward on the link2 vehicles10 vehicles
Table 2. First Simulation: Scenarios for AVs introduction effects.
DivisionVolumeSpeedEntrance VolumeHVsHOVAVs
Scenario 1720103.31240
Scenario 295099.59368
Scenario 3112086.6648073%27%0∼100%
Scenario 4137772.75624 (25% units)
Scenario 5156560.92742
Table 3. Second Simulation: Scenarios for Optimal DLs plan for AVs.
DivisionDescription
Strategy 1Operate only on existing HOVL
Strategy 2Changed existing HOVL to HOV & AV Lane (Mixed-Use)
Strategy 3Changed existing only AV Lane
Strategy 41-lane for AVs, 2-lane for HOV (Two dedicated lanes)
Strategy 51-lane for HOV, 2-lane for AVs (Two dedicated lanes)
Table 4. Using indicators for AVs and DLs introduction effects.
IndicatorDescription
The average speedAverage vehicle speed in the designated section
DensityThe vehicle density in the designated section (pcpkmpl, D = V/S)
QueueThe vehicle queue in the designated section = delay time (s)
Table 5. Declined indicators compared to previous MPR by using AVs speed, the average speed, density, and queue. The blue font means the environment in which the most indicators are degraded.
LOS0255075100
A-2131
B-2231
C-1341
D-1340
E-1342
Table 6. Second Simulation: Detail Scenarios for Optimal DLs plan for AVs.
StrategyDescription
1Operate only on existing HOVL (Basic)
2Changed existing HOVL to HOV & AV Lane(Mixed-Use)
3Changed existing only AV Lane (AVs only)
41-lane for AVs, 2-lane for HOV (Two dedicated lanes 1)
51-lane for HOV, 2-lane for AVs (Two dedicated lanes 2)
Table 7. Estimation value of operational efficiency to establish an optimal operation strategy for AVs. The blue font indicates the plans in which there are suitable strategies among the values calculated using min-max scaling.
LOSBasicMixed-UseAVs OnlyTwo Dedicated Lane 1Two Dedicated Lane 2
C10.980.1700.01
D0.9210.0400.05
E0.4410.0500.13
Publisher’s Note: MDPI stays neutral with regard to jurisdictional claims in published maps and institutional affiliations.

