Article

Between Tradition, Strategies and Taste: Understanding Fish Consumption Habits in Togo

1
College of Economics and Management, Shanghai Ocean University, Shanghai 201306, China
2
Faculté des Sciences Economiques et de Gestion, University of Lomé, Lomé 1515, Togo
*
Authors to whom correspondence should be addressed.
Sustainability 2022, 14(18), 11475; https://doi.org/10.3390/su141811475
Submission received: 18 July 2022 / Revised: 8 September 2022 / Accepted: 9 September 2022 / Published: 13 September 2022

Abstract

:
Factors and motivations that drive individuals’ decisions on seafood consumption vary by population group and geographical locations. These factors may differ from one particular species to the other. The purpose of this study is to understand fish/shrimp consumption frequency and consumers’ willingness to pay (WTP) more for shrimp locally farmed in Togo. We used a Poisson model to investigate the socioeconomic factors determining fish/shrimp consumption frequency, and a Heckman Selection model to analyze the extent to which consumers are willing to pay extra for locally produced shrimp. To this end, data on fish consumption were collected through a cross-sectional study that analyzed a quantitative survey of consumers (N = 308). Our results show that the populations sampled attach great importance to the quality of fish they consume. The econometric results indicate that the quality of the fish is positively related to fish consumption frequency while the monthly income and proximity of the sea show negative relationships with the outcome variable. In addition, the factors that influence the WTP for shrimp were consuming shrimp and the amount for expenditure on fish/shrimp consumption. Moreover, consumers are willing to pay, on average, 1.2 U.S Dollars (USD) as an extra amount relative to the average price per kilogram, and the extent of their WTP is positively related to the quality of the fish. However, the age of the respondents shows a negative relationship with the value they are willing to pay. In order to fulfill consumers’ needs and preferences, these findings jointly suggest that exceptional steps by the government are needed to value fish/shrimp in a way that persuades and encourages consumers to consume seafood at any age. More importantly, promoting the consumption of fish and shrimp requires action to help improve their quality. Government should: (a) be communicating and raising awareness more among the population on the nutritional value and health benefits of fish/shrimp consumption; (b) support fish/shrimp production through cost reduction actions for the fishermen who in turn can supply fish/shrimp at reasonable prices that encourage fish and shrimp consumption; (c) take appropriate measures to develop a logistics system as an effort to support fish, especially shrimp, supply in a timely way that might help to keep their good appearance and freshness for the consumers’ benefit.

1. Introduction

Fisheries and agriculture are sectors with a non-negligible economic impact for Togo. It plays an important role for local communities on the coast living from fishing [1]. Togo’s fisheries industry employs an estimated population of about 22,000 people including 10,000 indigenous fishermen and aliens, 12,000 fish wholesale women, transformers and fish products traders. Estimated at 4% of the country’s agricultural GDP in late 1990s and early 2000s [2], it contributed about 0.43% to GDP in 2014 [3]. With the post-harvest sector included, the contribution of fisheries was about 5.3% to the total GDP within the same year. According to official statistics, as recorded for 2019, fisheries account for 3.5% of the agricultural GDP and 0.69% of national GDP in Togo [4]. Nutritionally speaking, fish is an essential dietary component in human life [5] by providing quality proteins, fats, vitamins and minerals [6] or fatty acids [7,8,9]. In many Sub-Saharan African countries including Togo, fish contributes on average about 23% of total animal protein intake [10].
Togo has a rich fish-eating culture, where fish is estimated to provide around 13.8% of the animal protein requirement [11]. The annual per capita consumption of fish in Togo is currently estimated to be 14 kg [1], which is higher than the estimated average of 10.1 kg for the whole of Africa. However, Togo’s fishing industry is unable to meet domestic demand for fish and fishery products [12]. To maintain the current per capita levels of consumption, Togo imports about 70% of fish and fish products [13]. Fish and fishery products in the country mainly come from marine small-scale fisheries with estimated contribution of approximately 99% of the marine fisheries production [14]. In addition, aquaculture, initially a subsistence activity, is gradually moving to market-oriented production, contributing, although still weakly, to the fish supply to domestic consumers.
Many factors influence the evolution and dynamics of a country’s fish production [15] and therefore its consumption. Indeed, decisions on the type of fish and what quantity to purchase and to consume are generally viewed to be affected by a variety of factors. First, fish consumption levels are influenced by consumers’ demographic and socioeconomic characteristics and by fish attributes [16]. Second, consumers’ cultural characteristics also impact on their fish consumption preferences [17,18]. Third, consumers’ beliefs are reported to influence seafood consumption in many countries regardless of their economic development [19]. Yet, how Togolese consumers’ characteristics and household features affect fish consumption remains unknown.
Even though there are many studies concerning fish consumption, most refer to countries such as South Korea (e.g., [20]), Italy (e.g., [21]), Japan (e.g., [22]), China (e.g., [23]), etc. Togo has no well-documented report regarding the determinants of fish consumption in socio-demographic terms. A few studies concerning this matter in Togo are much more related to fish production or processing than its consumption in the country (e.g., [15,24]). Against this background, the present article attempts to fill this gap by enquiring into the determinants of fish consumption habits in Togo.
The first objective of this study is therefore to analyze the economic and socio-demographic factors that influence the frequency of fish consumption in Togo. The second purpose is to investigate consumers’ willingness to pay for shrimp consumption in the country. Using shrimp as the focus specific fishery product, the present study contributes novel evidence to the literature by following the Poisson model. A number of reasons explain this specific choice. Shrimps are seafood highly sought after for their flavor, but little research has been devoted to shrimp production and consumption in Togo. Second, shrimp is one of the seafood species that are both locally produced and imported. Another reason lies in the fact that no criticism in terms of quality of the shrimps caught or farmed in Togo’s waters have ever been voiced. Thus, the study findings will help in providing new information about fish consumption frequency, and also in increasing understanding of consumers’ willingness to pay for shrimp locally produced in Togo.

2. Materials and Methods

2.1. Sampling and Data Collection

We use primary data that are obtained via a survey of households. The survey was executed by specialized and well-trained interviewers, who were all university graduates who had studied demography, economics, or statistics. Moreover, they were knowledgeable in surveys, questionnaires, and data collection from having been investigators within the fourth population Census in Togo. The survey was conducted from 4 December 2020 to 30 April 2021. First, a draft questionnaire was prepared based on previously existing, validated and published questionnaires (e.g., [25,26]) in order to be able to compare our findings with those from other studies. It was pre-tested on a handful of respondents to ensure its validity and reliability. The feedback, comments and suggestions were used to modify or rearrange parts of the draft questionnaire, where necessary. The final version of the questionnaire was administered face-to-face to 308 household heads and adults that are home-keepers across the country’s five administrative regions, chosen using a two-stage stratified cluster sampling technique. Within each region, 4 villages or towns were randomly selected and within each village (town), 15 households were randomly selected. In every village (town), the starting household was randomly picked and while moving through such a village (town), the subsequent participants were the fifth, tenth, fifteenth household, and so on. In the specific case of Maritime region, 8 more households were randomly selected in addition to the 15 households of each of the 4 villages (towns), which amounted to 68 households sampled in the Maritime region. Overall, we obtained a useful sample of 308 respondents for the analysis reported in this paper. Survey interviews were conducted in five local languages (Ewe, Mina, Kabye, Kotokoli, and Moba) to minimize errors and potential bias in the interviews.
The survey includes sections on fish consumption in general, factors influencing fish consumption behaviors, shrimp/prawn consumption and socio-demographic characteristics. As consumers might not be familiar with some of the terms used in the questionnaire, a brief explanatory section was added. The questionnaire uses closed-ended questions to collect, among other things, data on fish consumption patterns at household level. Most of the questions are multiple choices related to fish purchasing and consumption frequency, quantity of fish/shrimp, price of fish/shrimp, reasons (main factor considered) for purchasing fish, type of fish, purchasing place, which one of locally produced or imported would be preferred. Thus, participants were asked to select the following fish/shrimp consumption frequencies: (a) Almost every day; (b) 4–6 times per week; (c) 2–3 times per week; (d) once per week; (e) Once every 2 weeks. Regarding the reasons for consuming seafood, we gave the respondents five options (i.e., quality-price ratio, tradition or dietary habits, revenue and social status, health and nutrition, and other). They also were asked to rank the first most important factor considered when deciding to purchase fish/shrimp: “health and nutrition, revenue and social status, quality-price ratio, tradition or dietary habits, and other”.
In addition, the questionnaire includes a series of other multiple-choice questions as follows: “How much quantity (average) of fish/shrimp does your household buy and consume on every occasion? (i) Less than 2 kg; (ii) 2–4 kg; (iii) 4–5 kg; (iv) more than 5 kg”. “Household income per month: (i) USD 60 or less; (ii) UDS 60–148; (iii) UDS 148–208; (iv) UDS 208–248; (v) UDS 248–394; (vi) UDS 394 and above”. “Age of the household head: (i) 18–25; (ii) 26–35; (iii) 36–45; (iv) 46–55; (v) 55 years and above”. In the second part of the questionnaire devoted to shrimp/prawn consumption, respondents are asked whether they are ready to pay more for shrimp/prawn and how much money as an extra-cost relative to the price of the kilogram of shrimp/prawn they may be ready to pay for locally produced shrimp/prawn, if available in the country. Possible answers were: “(i) Not willing to pay additional price; (ii) USD 0.1–4.65; (iii) USD 4.65–USD 9.3; (iv) USD 9.3 and above”. Furthermore, household heads that may not like shrimp/prawn at all, were asked to point out the factors that prevent them from purchasing or consuming shrimp/ prawn. Finally, the respondents were asked to provide their household size, region of residence, gender and education level of the household head.

2.2. Models

2.2.1. Poisson Model

The monthly fish (fishery products) purchasing frequency is used as the dependent variable. Purchasing frequency is a count variable and, therefore, the use of a Poisson model to investigate the socioeconomic factors determining fish/shrimp consumption frequency among Togo’s residents is appropriate. The Poisson regression model is based on the assumption that the dependent variable follows a Poisson distribution, which is a common distribution for the random variable with values ranging from 0, 1, 2, 3 … n. The Poisson regression model can be represented in a general form as follows:
E y i | x i = e x p x i T β
which represents the conditional expected value of y i . Conditional on x i , the count variable y i has a Poisson distribution with expectation λ i = e x p x i T β .
The conditional variance of y i should be equal to λ, otherwise y i ’s variance value higher than λ i would lead to an over-dispersion. Indeed, the over-dispersion issue affects the interpretation of the model. In such a case, it is important to address the problem in order to avoid the wrong estimation of the coefficients, leading to invalid conclusions. To avoid the over-dispersion issue, one can use a quasi-family or a robust Covariance-Estimator to estimate the dispersion parameter. To handle over-dispersion, the generalized Poisson regression model can also be employed. Another way to address the over-dispersion consists of using the Negative Binomial Estimator instead of the Poisson model.
To make the Poisson model operational, we need to define x i T β . We assume that the relationship between fish/shrimp consumption frequency ( y i ) and the predictors in the Poisson model take the following general form:
x i T β = β 0 + β 1 x 1 + β 2 x 2 + β 3 x 3 + β 4 x 4 + β 5 x 5 + β 6 x 6 + β 7 x 7 + β 8 x 8 + β 9 x 9 + μ i
where μ i stands for the error term,     ( β 1   t o   β 9 ) are the coefficients related to the explanatory variables ( x 1   t o   x 9 ) , respectively, as defined in Table 1:
It should be noted that the quality variable measures the sensory quality of the fish, which can be observed in the context of color, texture, smell, and general appearance [27]. We do not call the approach by which we measure the fish/shrimp a Quality Index, because a Quality Index Method is expected to use a numerical score (e.g., 1 to 5 for each of these characteristics), what is not the case in the present study. Here, for simplification and in order to minimize time spent by the respondents on filling out the questionnaire, they were asked to express their opinions on the quality of the fish/shrimp they purchase and consume by taking into account these characteristics combined. For this purpose, the characteristics listed in the questionnaire and which, should be considered in order to give their general appreciation consist of aesthetic appearance, freshness, smell, bright color, and taste of the fish/shrimp as well.

2.2.2. Heckman Selection Model and Willingness to Pay (WTP) for Shrimp Consumption

In this study, the dependent variable, the willingness to pay (WTP) more for locally produced shrimp, is an ordinal variable ranging from 0 to 3. Thereby, 3 indicates that the WTP is 9.3 US dollars (USD) and above; 2 indicates that the WTP is USD 4.65 to USD 9.3; 1 indicates that the WTP is USD 0.1 to USD 4.65; and 0 indicates that the respondent is not willing to pay more for locally produced shrimp at all. The efficient estimation of such a WTP demands that we simultaneously explain both the decision to pay more or not, and the size of the WTP amount. Ordinary Least Squares (OLS) will lead to inconsistent estimates of the average WTP amount, because one would be implicitly assuming that the underlying decision model is the same for respondents that are willing to pay, and respondents who do not express their WTP, which is inappropriate. Running a regression of this dependent variable of WTP on the explanatory variables with OLS would result, among other problems, in incidental truncation bias.
A two-step Heckman Selection model (HSM) is appropriate to allow for different data generating processes in the first stage (positive WTP vs. zero WTP) and the second stage (how much extra, given a positive willingness to pay). HSM explains first, whether a respondent has a positive WTP for locally produced shrimp or not, and in a second-stage the level of their WTP, given that the WTP is positive. Binary variable Z i has entry 1 in case ith individual has a positive WTP for locally produced shrimp (and, 0 otherwise). Variable W i gives the values 1, 2 and 3 of the WTP for those respondents with WTPs > 0. Thus, the model can be fitted via the following equations:
W i * = β w X w i + ε w i ;   W i * = j   i f   a j W i * < a j + 1
and W i * is observed only when Z I = 1 and
Z i * = 1   i f   β z X z i + ε z i 0   0   i f   β z X z i + ε z i < 0
where i = 1 ,   2   ,   3 , ,   N and j = 1 ,   2 , ,   J . N is the total number of useful respondents and J accounts for the amount of WTP chosen by the surveyed respondents, including the implied zero option. The two β   denote the unknown coefficient vectors.
According to Heckman’s two step procedure, the variable Z i * is an unobserved continuous index assumed to determine the observed response to the general WTP question in terms of a vector of exogenous variables X z i . It might be noted that if the respondent chooses to pay any amount ( Z i = 1 ), the index Z i * will thus turn out to be positive. In other words, a non-positive Z i * implies a zero WTP with regard to the individual’s WTP amount ( Z i = 0 ). Therefore, Equation (4) allows a positive probability of not responding to the WTP question, meaning that all values of the dependent variable that take a value of 0 and below are censored at 0.
Similarly, W i * is the true but unobserved continuous variable standing for the WTP amount, which is determined by the set of exogenous variables X z i taken into account. The a j s are the limits for the various WTP amount categories such that ith respondent chooses the jth category if his/her true WTP satisfies the condition a j W i * < a j + 1 . It should also be noted that ε w i and ε z i are the random error terms. A nonzero correlation between them is the result of the dependence of Z i * on the respondents’ true willingness to pay ( W i * ) . A positive correlation between indicates that respondents with greater WTP are more likely willing to pay a higher price for shrimp locally produced through a scheme undertaken for promoting national production, while a negative correlation suggests the opposite.
In its empirical form, the first step of the two-step Heckman model, which consists of the Probit model estimating the probability of a respondent choosing the decision to pay a positive amount versus to pay zero for locally produced shrimp can then be written as:
Pr Z i * = 1 = Φ β 0 + β 1 S h r i m p _ C o n s + β 2 Q u a l i t y + β 3 I n c o m e + β 4 E x p e n d i t u r e + β 5 P r o x i m i t y + β 6 E d u c a t i o n + β 7 A g e + β 8 G e n d e r / σ
where Φ is the cumulative density function and σ the standard error.
The second stage of the Heckman model takes the decision conditional on the choice of positive bid amounts the surveyed respondents stated. It specifies the relationship between the dependent variable and the independent variables in the following linear functional form:
W i *   =   β 0 + β 1 I n c o m e   + β 2 Q u a l i t y     +   β 3 E x p e n d i t u r e   +     β 4 E d u c a t i o n     + β 5 A g e + β 6 G e n d e r + ε i
where ε i denotes the independent identically distributed (i.i.d) error term, assumed to be normally distributed with a mean of zero and constant variance.

3. Results

3.1. Descriptive Results

3.1.1. Demographic Information

Understanding socio-demographic features of the sampled households is necessary as it affects their fish consumption preferences and frequency. They are presented in Table 2. Socio-demographic characteristics of the respondents show that the household head of most of the households (72%) are men. The average household size is five persons, with the average age of household head being 41 years old. In terms of education, the results indicate that three-fourths (76%) of the respondents have junior- and senior- secondary education level. In addition, the monthly income of the household is, on average, 336 US dollars (USD). The average price of seafood consumed by the respondents is USD 1.8 per kg, with majority of the seafood price falling, on average, in the group of USD 1 and USD 2 (Table 2). The majority (92%) of the respondents have reported that the seafood they purchase/consume are of high or good quality. 37% of the respondents have reported being located in an area close to the sea and in the surrounding areas of maritime region, as compared to consumers living in the upper north of the country, so far from the coast. More importantly, the respondents were asked how often they purchased and consumed seafood in the last 12 months. The answers provided by the respondents show that, on average, the sampled households purchase and consume seafood 14 times a month. In other words, this represents, on average, an approximate household expenditure on seafood of USD 40.67 per month. In terms of the type of fish consumed, eleven (11) species have been listed by the respondents. Horse mackerel, anchovy, mackerel, shrimp and sardinella were reportedly said to be the top five ones consumed by 67.5%, 47.4%, 43.8%, 31.5% and 23%, respectively, by the sampled households (Figure 1). Furthermore, 65% of the households have expressed the WTP for shrimp locally produced, if available, with, on average, USD 1.2 per kg as the expected amount of that WTP.

3.1.2. Reasons for Fish/Shrimp Purchasing and Consumption

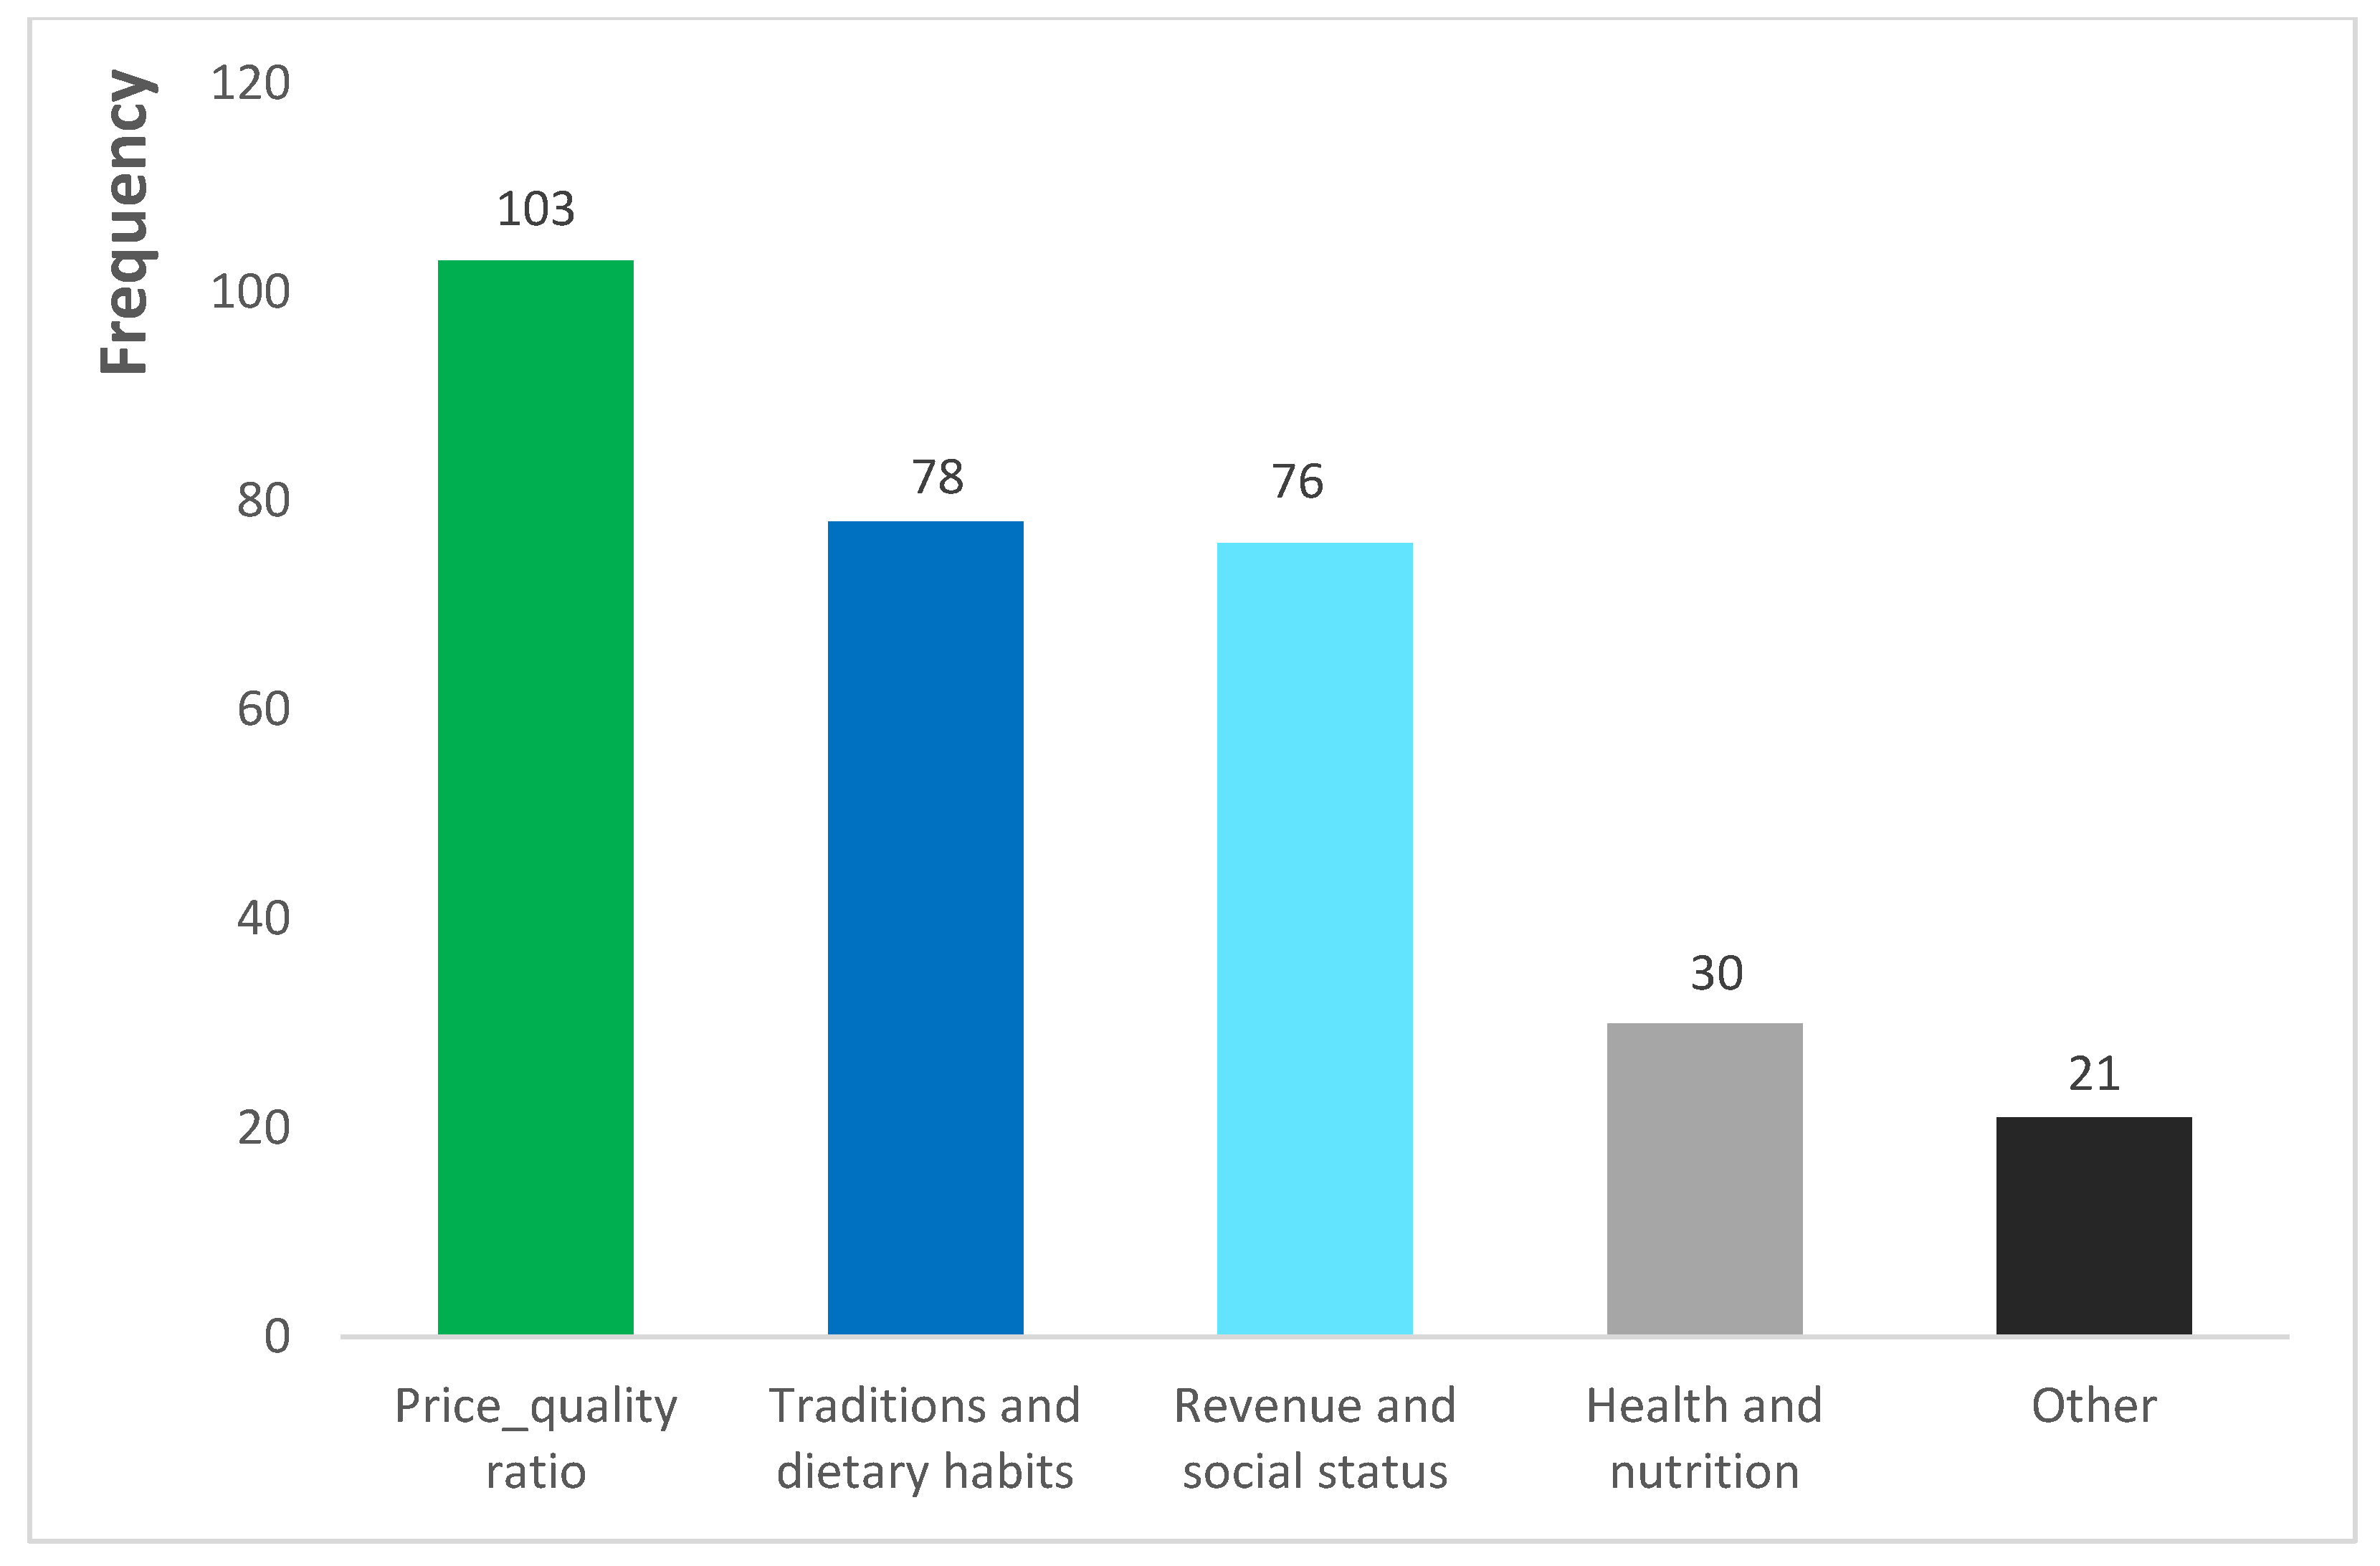
Regarding the reasons for consuming seafood, we gave the respondents five options (i.e., quality-price ratio, tradition or dietary habits, revenue and social status, health and nutrition, and other). They were asked to rank the most important factor taken into consideration when deciding to purchase fish/shrimp. The results show that residents across Togo attach great importance to the quality of seafood they purchase and consume (Figure 2). Tradition or dietary habits is the second main reason for fish/shrimp consumption. For 38.5% of the respondents who reported not to consume shrimp, the main reason is that they do not like it.

3.1.3. Fish Origin and Provenance, “Local” vs. “Imported”

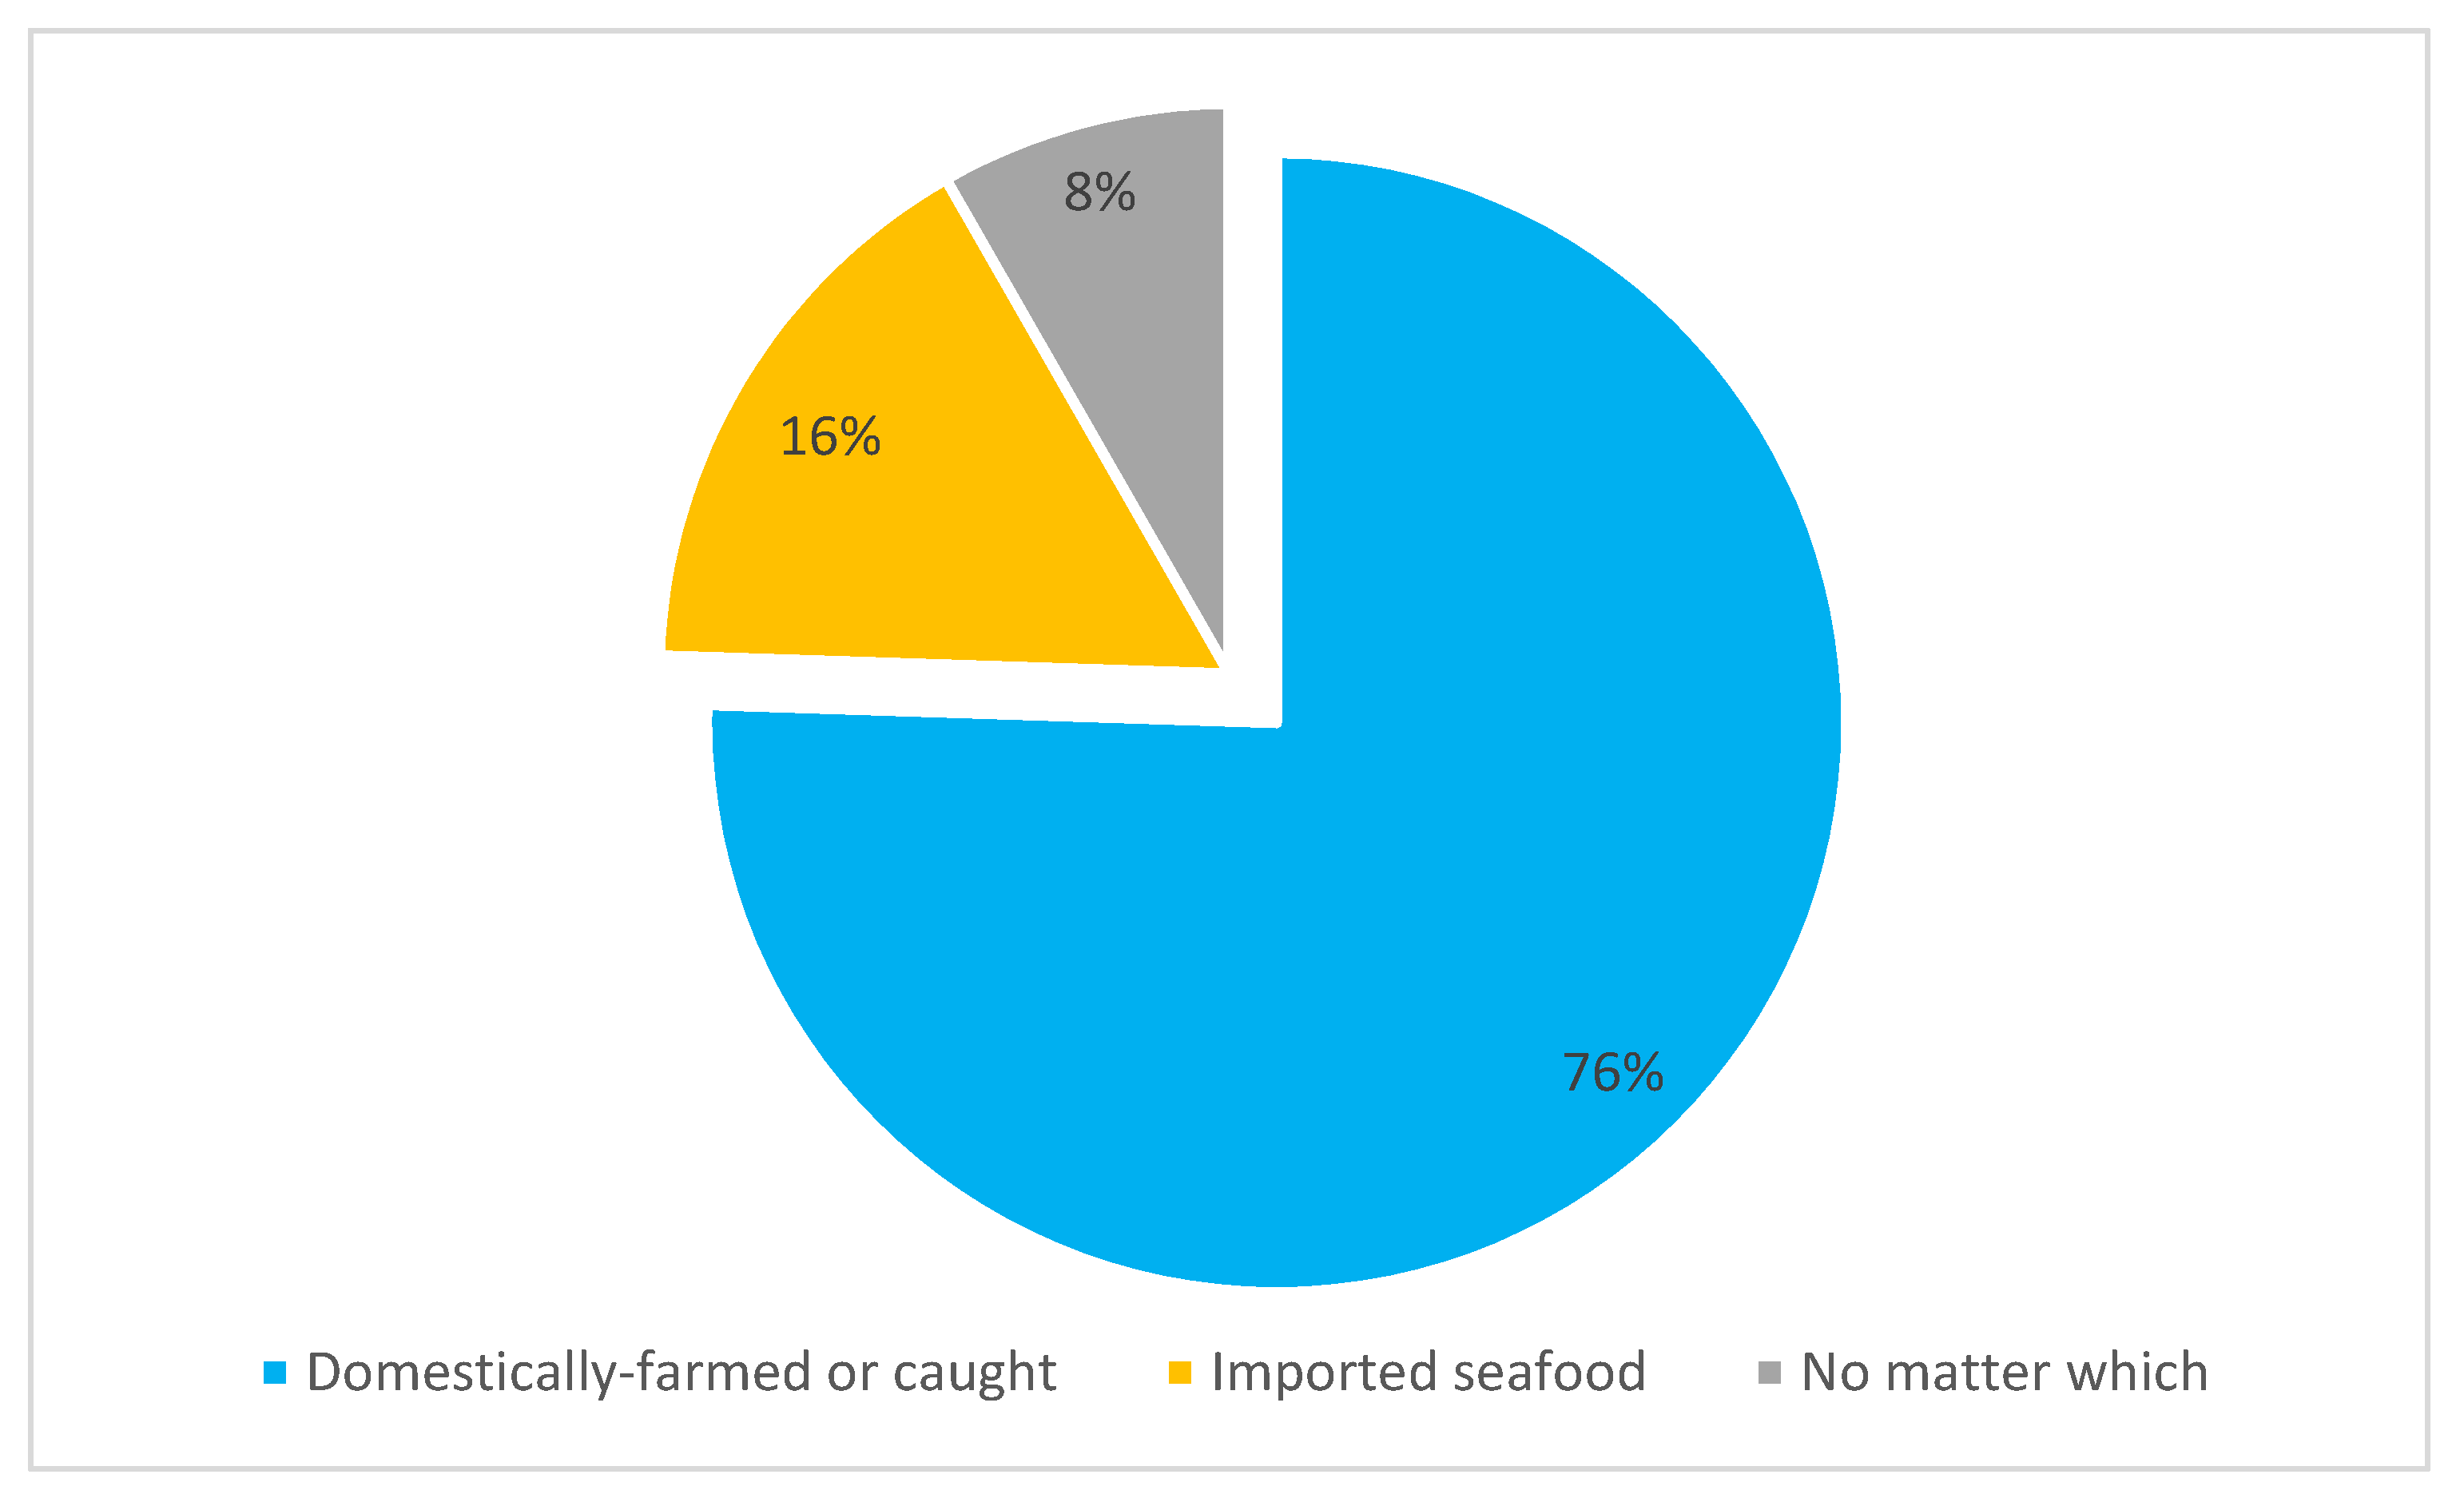
From a demand perspective, consumers’ preference for local or imported fishery products can be explained by intrinsic attributes of a particular fish/shrimp. In the present study, majority (75%) of the respondents prefer domestically farmed/caught fish (Figure 3) in the form of fresh or dried seafood. A possible reason is that local fish/shrimp are perceived as being less expensive. Seafood imports are often found in the form of frozen fish and fishery products. They are preferred by some consumers because of their high quality or the brand.

3.1.4. Obstacles to Shrimp Consumption

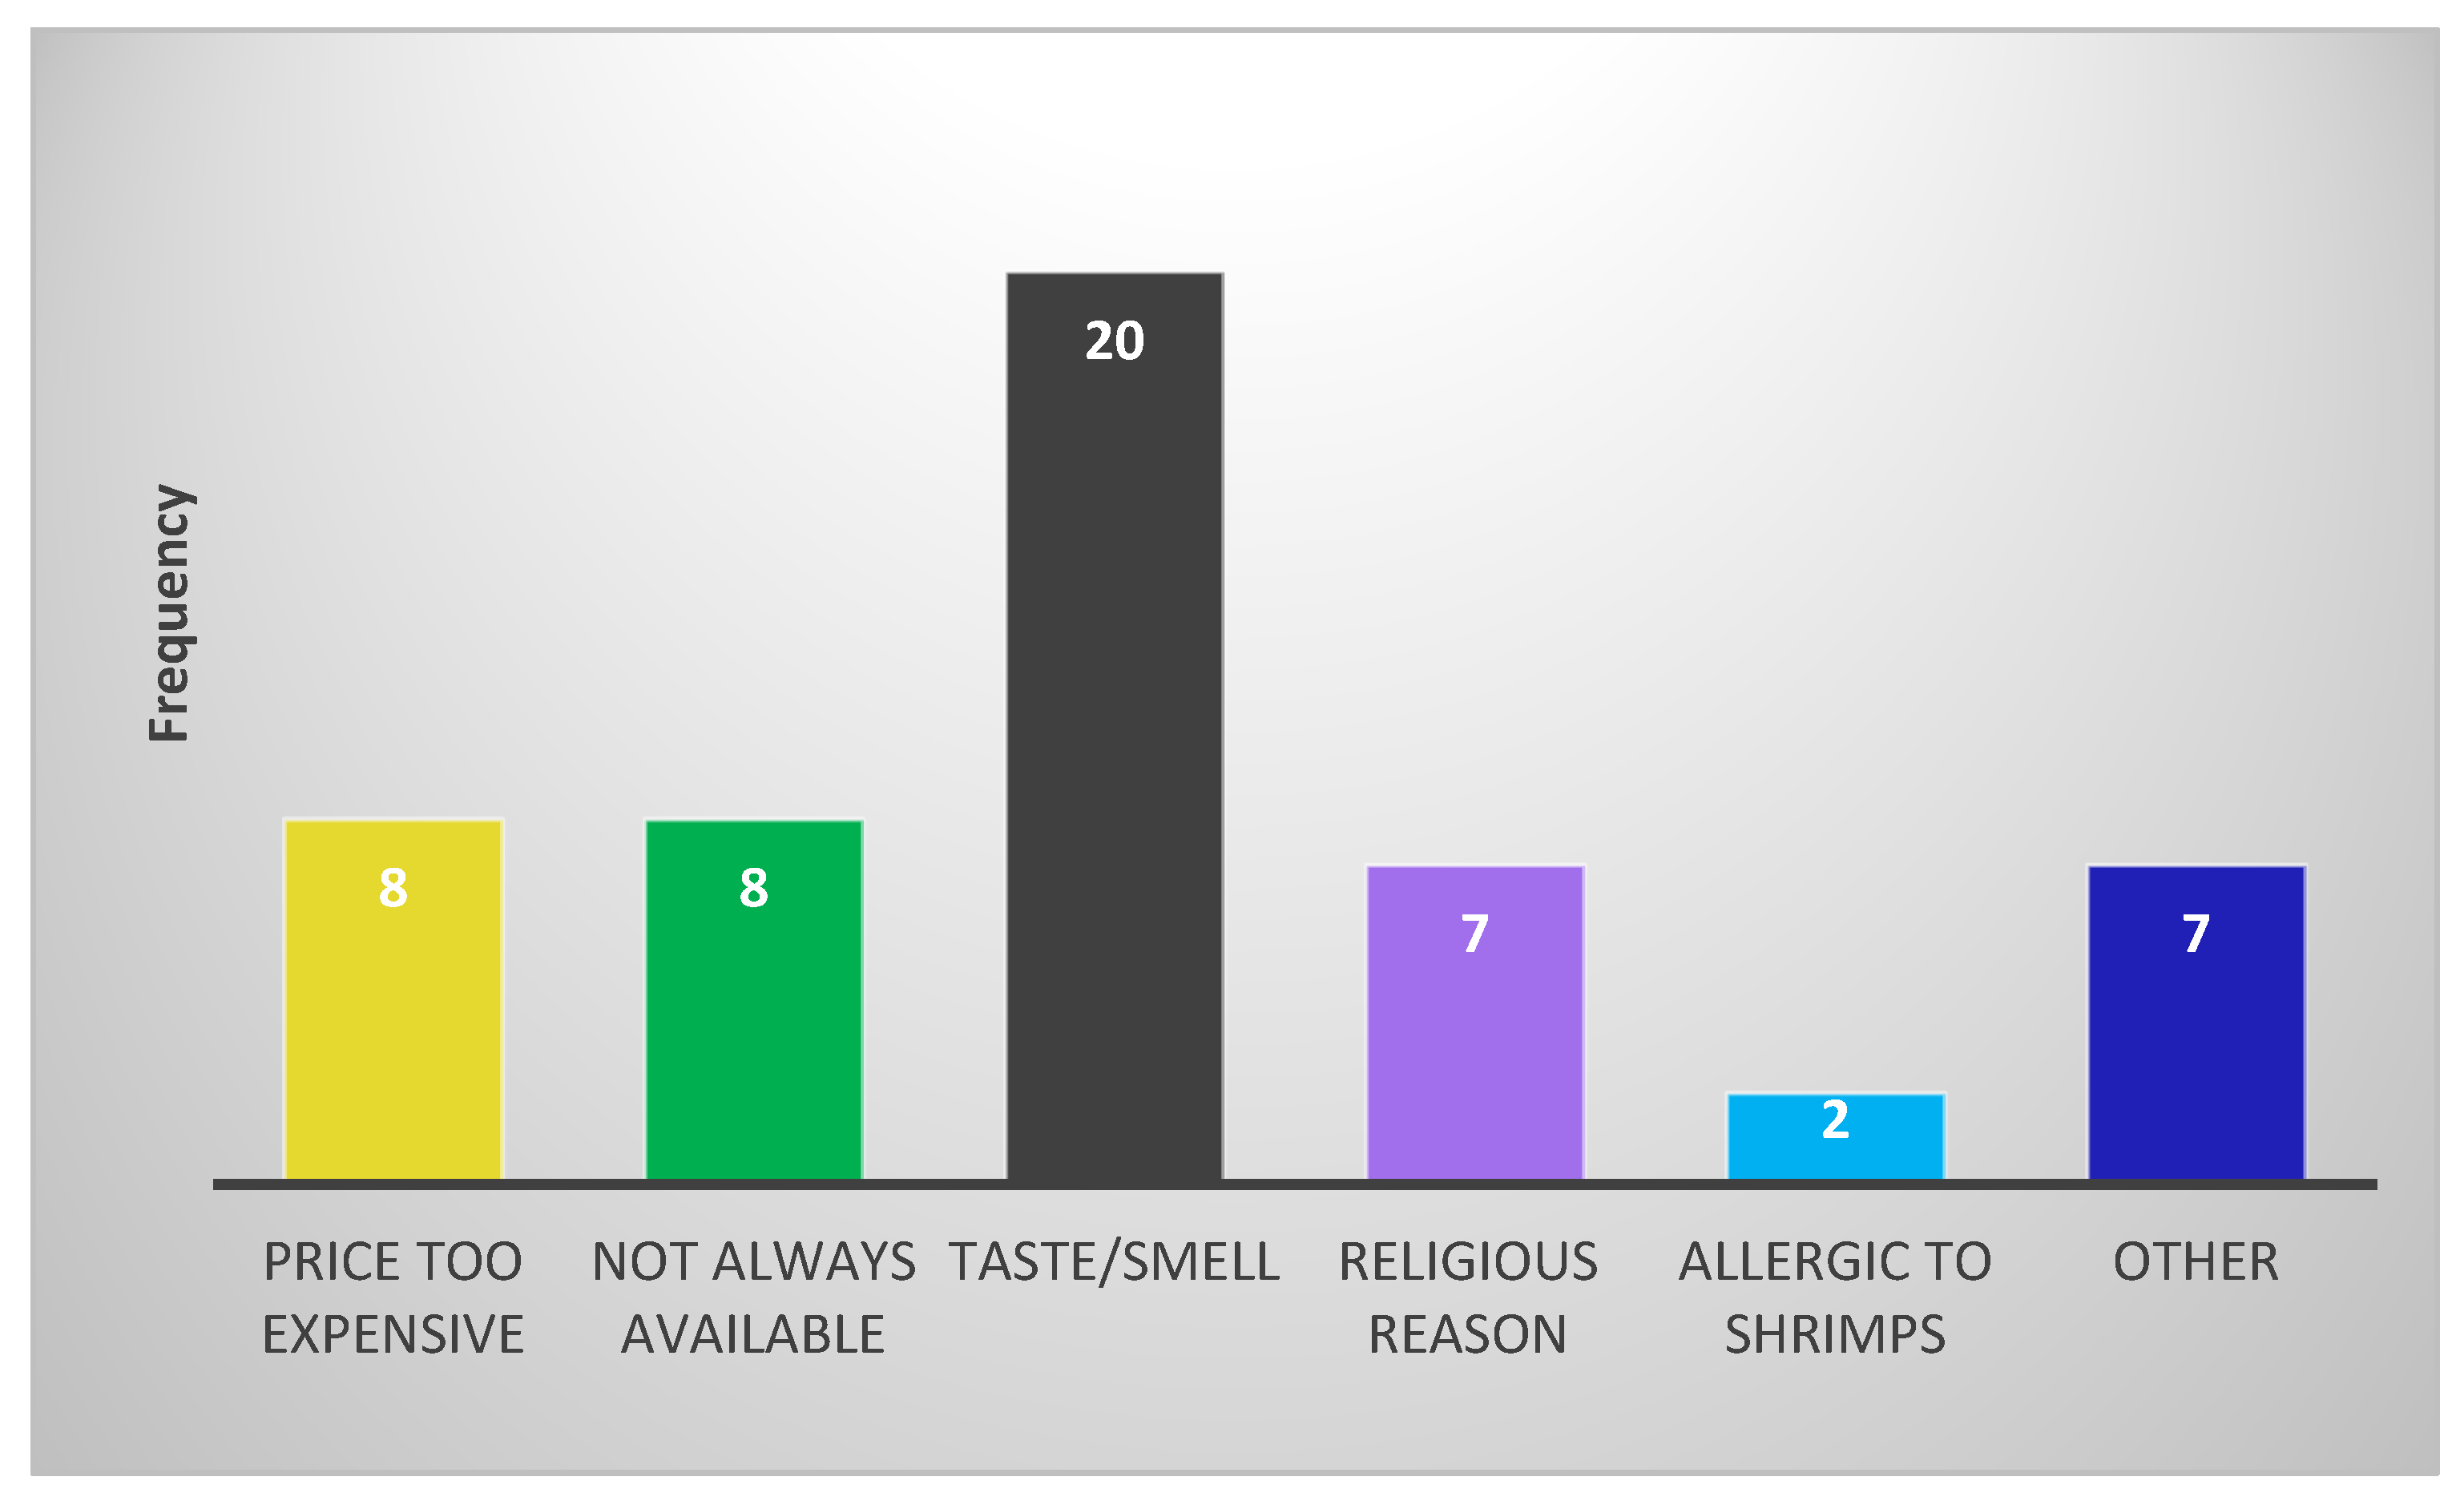
Respondents were next asked to provide information on a series of factors that prevent them from consuming shrimp/prawn. Figure 4 shows that the main constraints observed for shrimp consumption by potential consumers in Togo are “taste/smell”, “non-availability” and “the price”, respectively. Other reasons include the cultural and religious background of the respondents, and the allergy to shrimp/prawn.

3.2. Econometric Results

3.2.1. Poisson Regression Model for Factors Influencing Fish Consumption Frequency

As shown in Table 3, the regression output disclosed that of the total explanatory variables two variables, namely, monthly income and the proximity of the sea are negatively related to the outcome variable. On the other hand, the quality of the fish/shrimp shows a positive relationship with fish/shrimp consumption frequency. Contrary to our expectation, the coefficient of price variable was not statistically significant indicating that no effect of price on fish consumption frequency exists. Similarly, the coefficient of age, education level, and gender variables, among others, are not significant.
Besides, Pearson correlation shows that the household head income correlates to the years of education completed which, correlates to the fact of living in close proximity of sea. There is also a strong and positive correlation between the age of the household head and the size of the household, while a negative correlation is found between the age of the household head and the years of education completed by him/her. (See Table 4).

3.2.2. Willingness to Pay More for Locally Produced Shrimp

To further investigate our understanding on factors that affect shrimp consumption patterns, this study conducted a second analysis on both consumers’ willingness to pay and the extra amount they are ready to pay for shrimp locally produced in Togo. It is found that ‘‘shrimp consumption’’ has a positive association with the consumers’ WTP more (Table 5). Likewise, the share of household expenditure spent on shrimp is positively correlated with their likelihood to pay more for local shrimp. The findings further confirm that the quality of the shrimp is positively related to the value consumers are willing to pay, whilst the “age” variable shows a negative relationship with the amount of money they are willing to pay.

4. Discussion

The fast growth of annual global consumption of seafood products per capita, which has more than doubled over the last 50 years, has led to changing seafood production. It has also created changes in consumption habits and preferences in many countries worldwide. Thus, to ensure food security and nutritional quality for a growing world population in the face of climate change, stagnant fishing catches and increasing aquaculture production, countries must closely examine not only what they produce but also what they consume [28]. Therefore, it is critical to understand the important factors that influence consumers’ preferences for fish/shrimp consumption.
At first glance, the analysis set out in this paper shows that the quality-price ratio was by far the most important factor considered by most consumers ranking the top factors affecting their fish/shrimp consumption. Next are the “culture or traditional dietary habits” and “revenue and social status”. Such a finding coincides with the findings by [29]. As regards the constraints in shrimp/prawn consumption, “taste/smell”, “non-availability” and “price” are reportedly said to be the main obstacles to shrimp consumption. This corroborates the findings of studies that the barriers to fish and seafood consumption in Norway and Russia were, among other things, fish availability, price perception, fish eating habits and health beliefs [30].
In this research, our econometric estimates indicate that the coefficient of quality’’ variable is statistically significant at the 1% level. This result corroborates the findings of previous works on factors affecting seafood purchasing and its consumption (e.g., [31]). This finding can be justified by the fact that consumers generally prefer wild-caught fish to farmed fish because of the quality of the former, which is safe, hygienic, and free from antibiotics and chemicals as compared to the latter [32].
It is known that income level might have an effect on fish consumption [33,34,35,36]. Contrary to our expectation, the result of the present study reveal a negative relationship between the household income and fish/shrimp consumption frequency. A possible explanation of this finding is that consumers with an increasing income tend to make a trade-off between increasing their consumption of red meat and increasing fish. It is in this context that consumption habits of the surveyed respondents change, shifting away from seafood to more red meat as their income rises. This finding differs from other studies carried out worldwide. To mention just a few, it is found that the quantity of goods and services (including seafood) increases with the raise in income level [37], with rich households consume larger quantities of fish than poor households [38]. A recent study conducted in China shows that income positively affected household seafood consumption frequency and expenditure share in total food cost [23]. Similarly, monthly income, among others, significantly influences domestic marine fish consumption in Namibia [39].
Another finding of this paper is that geographic location as a proximity to sea has a negative relationship (p < 0.05) with seafood consumption frequency. This result is very surprising in the sense that seafood is generally of great importance to people living in coastal and lakeside areas, or near water bodies [38,40]. This finding is also in contrast with the work by [41], which demonstrated evidence of a negative relation between proximity to water bodies and fish intake in Pakistan. Recently, [16] pointed out that compared to the south, people living in northern Ghana far from the sea, are more oriented toward the rearing of livestock and therefore consume less fish to supplement meat in many cuisines. A possible explanation for this surprising finding in our study might be “no fish consumption habit”, “bad smell”, “dislike of family members”. Given the limited sample size of the household that participated in the survey used in this study, which is not likely representative of the whole population, even in the context of Togo, the conclusions of this study need to be regarded with caution.
From a perspective of WTP extra cost for shrimp locally farmed, the results of Heckman Selection regression analysis show that the coefficient of “Quality” variable is statistically significant at the 5% level. This result aligns with those of several studies carried out in different countries where a higher-quality product (shrimp) gets more money. Ref. [42] investigated the influence of providing consumers with additional knowledge about organic products and their processing in China. The authors concluded that consumers are generally willing to pay a premium for organic shrimp, which are of better quality than conventional white shrimp. A few years earlier, [43] established the extent to which UK consumers were clearly able to differentiate retail pea products and were willing to pay a price premium for higher quality. However, price and income emerged as potentially limiting factors on demand for high quality frozen peas.
It is also found that the extent to which consumers are willing to pay extra cost is adversely related to the age of the household head. This implies that the older the household head, the less he /she pays more for shrimp locally farmed in the country. As individuals grow older, they usually avoid unnecessary expense; their lower income is used carefully to ensure their survival.
It should be recalled that the amount to be paid for this willingness to pay more depends itself above all on the decision of the consumer to pay extra cost or not. The results of the Heckman Selection model in the first stage about the WTP showed that shrimp consumption and total expenditures for fish/shrimp were the only two factors which had a statistically significant and positive relationship with the consumers’ decision to pay more for shrimp locally farmed in Togo. There is limited evidence about the impact of shrimp consumption and total expenditures for seafood on consumers’ willingness to pay more. However, a plausible explanation of these findings is that, compared to his or her counterpart, an individual who consumes seafood is more likely to pay extra cost for shrimp locally farmed, provided it is of good quality. Second, the positive sign for the coefficient of total expenditures for fish variable could be justified by this: the more the consumer spending on seafood increases, the higher his likelihood to support extra cost for a particular species, provided it is of good quality and included in his basket of goods and services that satisfy his tastes and preferences.

5. Conclusions

In this study, we examined factors that influence fish/shrimp consumption habits and patterns in Togo. The econometric analysis shows that the quality of the fish is significantly and positively related to fish/shrimp consumption frequency while the monthly income and proximity of the sea have negative relationship with the outcome variable. In addition, this study has attempted to investigate whether, and the extent to which, consumers are willing to pay more for shrimp locally farmed in Togo, since consumers wish they could eat more shrimp but cannot find enough shrimp in the markets. It was found that factors that are positively related to consumers’ willingness to pay more for shrimp locally farmed or caught were shrimp consumption and, the amount for expenditure on fish/shrimp consumption. The households are willing to pay, on average, USD 1.2 as an extra amount relative to the average price per kilogram. Such an amount of their WTP is positively related to the quality of the fish. However, the age of the respondents has a negative relationship with the amount they are willing to pay. This paper hence contributes to the literature in two ways. First, it provides useful information on the factors that may influence seafood consumption frequency, particularly for consumers in Togo. Our second contribution is that, we estimated, for the first time, the WTP for shrimp locally produced in Togo.
In order to fulfill consumers’ needs and preferences, these findings jointly suggest that exceptional steps by the government are needed to value fish/shrimp in a way that persuades and encourages consumers to consume seafood at any age. Hence, promoting the consumption of fish and shrimp requires to help improve the quality of fish/shrimp farmed or caught through changes in farming/fishing techniques. Government should be communicating and raising awareness more among the population on the nutritional value and health benefits of fish/shrimp consumption. This study also calls upon the government to support fish/shrimp production through cost reduction actions for the fishermen who in turn can supply fish/shrimp at reasonable prices that encourage fish and shrimp consumption. Further, given that non-availability was found as one of the constraints of shrimp consumption, it is necessary to provide shrimp supply continuously through its enhanced availability. This study thus recommends to take appropriate measures to develop a logistics system as an effort to support fish, especially shrimp, supply in a timely way that might help to keep their good appearance and freshness for the consumers’ benefits.
We would like to mention limitations of this study, in order to better understand how future research can progress. First, the sample size considered in our analysis is small; thus, it is hard to justify implications for all villages and towns at national level. Future projects may survey a broader range of households with greater sampling. Findings can then be fully assessed from a national perspective, and more robust conclusions can be drawn on. Second, this study focuses only on the consumers’ side of fish, especially shrimp, consumption. Future research may include developing farmers and fishermen surveys to analyze their technical efficiency. Third, this paper used cross-sectional data to understand fish consumption habits and frequency, which may vary over time. Studying consumers’ behaviors using time series or panel data could make conclusions more robust. A broader understanding of long-term fish/shrimp consumption trends is an interesting area for future research.

Author Contributions

Conceptualization, B.C.; Data curation, K.N.; Formal analysis, M.L. and B.N.; Funding acquisition, B.C. and C.S.; Investigation, K.N.; Methodology, K.N.; Software, K.N.; Supervision, B.C. and C.S.; Validation, C.S.; Writing—original draft, B.C., K.N. and C.S.; Writing—review and editing, K.N. and M.L. All authors have read and agreed to the published version of the manuscript.

Funding

This study was financially sponsored by the Ministry of Agriculture of People’s Republic of China through the China Agriculture Research System (Grant No CARS-48).

Institutional Review Board Statement

Not applicable.

Informed Consent Statement

Not applicable.

Data Availability Statement

Data available on request due to restrictions eg privacy or ethical.

Acknowledgments

We are thankful to the anonymous reviewers whose comments and suggestions helped improve the manuscript.

Conflicts of Interest

The authors declare no conflict of interest.

References

  1. FAO. Évaluation des Pertes Après-Capture Dans les Pêcheries Maritimes Artisanales du Togo; FAO: Lomé, Togo, 2020. [Google Scholar] [CrossRef]
  2. Horemans, B. Politique de Développement et Programme d’Action—Définition d’Une Politique et d’Un Plan d’Action pour la Pêche; Projet TCP/TOG/34; Revue Sectorielle: Lomé, Togo, 1996. [Google Scholar]
  3. De Graaf, G.; Garibaldi, L. La Valeur des Pêches Africaines; FAO, Circulaire sur les Pêches et l’Aquaculture No.1093; FAO: Rome, Italy, 2014. [Google Scholar]
  4. FAO. Food and Agriculture Organization of United Nations, Togo Globefish Market Profile. 2019. Available online: https://www.fao.org/3/cb9842en/cb9842en.pdf (accessed on 29 August 2022).
  5. Mohanty, B.P.; Ganguly, S.; Mahanty, A.; Mitra, T.; Patra, S.; Karunakaran, D.; Suseela, M.; Chakraborty, K.; Paul, B.N.; Sarma, D.; et al. Fish. In Human Health and Nutrition: Advances in Fish Research, 1st ed.; Narendra Publishing House: Delhi, India, 2019; Chapter 11; Volume 7, pp. 189–218. [Google Scholar]
  6. Meena, D.K. Fish and Its Role in Human Nutrition. 2015. Available online: http://aquafind.com/articles/Fish-and-its-role-in-human-nutrition.php (accessed on 14 April 2022).
  7. Swanson, D.; Block, R.; Mousa, S.A. Omega-3 fatty acids EPA and DHA: Health benefits throughout life. Adv. Nutr. 2012, 3, 1–7. [Google Scholar] [CrossRef] [PubMed]
  8. Sun, G.Y.; Simonyi, A.; Fritsche, K.L.; Chuang, D.Y.; Hannink, M.; Gu, Z.; Greenlief, C.M.; Yao, J.K.; Lee, J.C.; Beversdorf, D.Q. Docosahexaenoic acid (DHA): An essential nutrient and a nutraceutical for brain healthand diseases. Prostaglandins Leukot. Essent. Fatty Acids 2018, 136, 3–13. [Google Scholar] [CrossRef] [PubMed]
  9. Rincón-Cervera, M.A.; González-Barriga, V.; Romero, J.; Rojas, R.; Sandra López-Arana, S. Quantification and Distribution of Omega-3 FattyAcids in South Pacific Fish and Shellfish Species. Foods 2020, 9, 233. [Google Scholar] [CrossRef]
  10. OECD/FAO. OECD-FAO Agricultural Outlook 2020–2029; FAO: Rome, Italy; OECD Publishing: Paris, France, 2020. [Google Scholar] [CrossRef]
  11. FAO. FAO Yearbook. Fishery and Aquaculture Statistics. 2015/FAO Annuaire. Statistiques des Pêches et de L’Aquaculture. 2015/FAO Anuario. Estadísticas de Pesca y Acuicultura; FAO: Rome, Italy, 2017. [Google Scholar]
  12. N’Souvi, K.; Sun, C.; Egbendewe-Mondzozo, A.; Tchakah, K.K.; Alabi-Doku, B.N. Analysis of the impacts of socioeconomic factors on hiring an external labor force in tilapia farming in Southern Togo. Aquac. Fish. 2021, 6, 216–222. [Google Scholar] [CrossRef]
  13. FAO—Food and Agriculture Organisation of United Nations. In Profils des Pêches et de l’Aquaculture par Pays, la République Togolaise; FAO: Rome, Italy, 2019; Available online: http://www.fao.org/fishery/facp/TGO/fr (accessed on 12 February 2021).
  14. Sedzro, K.M.; Fiogbe, E.D.; Guerra, E.B. Pêcheries maritimes artisanales togolaises: Analyse des débarquements et de la valeur commerciale des captures. J. Rech. Sci. L’Univ. Lomé 2017, 19, 2. [Google Scholar]
  15. N’Souvi, K.; Sun, C.; Zhang, H.; Broohm, D.A.; Okey, M.K.N. Fisheries and aquaculture in Togo: Overview, performance, fisheries policy, challenges and comparative study with Ghana, Mali, Niger and Senegal fisheries and aquaculture. Mar. Policy 2021, 132, 104681. [Google Scholar] [CrossRef]
  16. Onumah, E.E.; Quaye, E.A.; Ahwireng, A.K.; Campion, B.B. Fish Consumption Behaviour and Perception of Food Security of Low-Income Households in Urban Areas of Ghana. Sustainability 2020, 12, 7932. [Google Scholar] [CrossRef]
  17. Honkanen, P.; Olsen, S.O.; Verplanken, B. Intention to consume seafood-the importance of habit. Appetite 2005, 45, 161–168. [Google Scholar] [CrossRef]
  18. Verbeke, W.; Vackier, I. Individual determinants of fish consumption: Application of the theory of planned behaviour. Appetite 2005, 44, 67–82. [Google Scholar] [CrossRef]
  19. Zhou, L.; Jin, S.; Zhang, B.; Cheng, G.; Zeng, Q.; Wang, D. Determinants of fish consumption by household type in China. Br. Food J. 2015, 117, 1273–1288. [Google Scholar] [CrossRef]
  20. Lee, M.-K.; Nam, J. The determinants of live fish consumption frequency in South Korea. Food Res. Int. 2019, 120, 382–388. [Google Scholar] [CrossRef] [PubMed]
  21. Pulcini, D.; Franceschini, S.; Buttazzoni, L.; Giannetti, C.; Capoccioni, F. Consumer Preferences for Farmed Seafood: An Italian Case Study. J. Aquat. Food Prod. Technol. 2020, 29, 445–460. [Google Scholar] [CrossRef]
  22. Kitano, S.; Yamamoto, N. The role of consumer knowledge, experience, and heterogeneity in fish consumption: Policy lessons from Japan. J. Retail. Consum. Serv. 2020, 56, 102151. [Google Scholar] [CrossRef]
  23. Zhang, H.; Sun, C.; Wang, Z.; Che, B. Seafood consumption patterns and affecting factors in urban China: A field survey from six cities. Aquac. Rep. 2021, 19, 100608. [Google Scholar] [CrossRef]
  24. Lare, L.Y. La Consommation du Poisson Transforme au Togo: Entre Habitude et Stratégie Alimentaire. 2014. Available online: http://publication.lecames.org/index.php/hum/article/download/645/483 (accessed on 17 July 2022).
  25. FAO. Fish Consumption Survey—Mauritius; SmartFish-FAO Report; FAO: Rome, Italy, 2013; 85p. [Google Scholar]
  26. Hermida, M.; Costa, S. Between Tradition and Taste: Fish Consumption Habits in a Small Portuguese Archipelago. J. Aquat. Food Prod. Technol. 2020, 29, 335–349. [Google Scholar] [CrossRef]
  27. Hossain, M.S.; Hasan, M.M.; Sarwer, M.G.; Bhowmik, S. Comparative analysis of microbiological status between raw and ready-toeat product of black tiger shrimp (Penaeus monodon). Int. J. Biosci. 2015, 6, 43–49. [Google Scholar]
  28. Guillen, J.; Natale, F.; Carvalho, N.; Casey, J.; Hofherr, J.; Druon, J.-N.; Fiore, G.; Gibin, M.; Zanzi, A.; Martinsohn, J.T. Global seafood consumption footprint. Ambio 2019, 48, 111–122. [Google Scholar] [CrossRef]
  29. Murray, G.; Wolff, K.; Patterson, M. Why eat fish? Factors influencing seafood consumer choices in British Columbia, Canada. Ocean Coast. Manag. 2017, 144, 16–22. [Google Scholar] [CrossRef]
  30. Carlucci, D.; Nocella, G.; De Devitiis, B.; Viscecchia, R.; Bimbo, F.; Nargone, G. Consumer purchasing behavior towards fish and seafood products, Patterns and insights from a sample of international studies. Appetite 2015, 84, 212–227. [Google Scholar] [CrossRef]
  31. Mitterer-Daltoe, M.; Latorres, J.; Queiroz, M.; Fiszman, S.; Varela, P. Reasons underlying low fish consumption where availability is not an issue. A casy study in Brazil, one of the world’s largest fish producers. J. Sens. Stud. 2013, 28, 205–216. [Google Scholar] [CrossRef]
  32. Mitra, S.; Khatun, M.N.; Prodhan, M.M.H.; Khan, M.A. Consumer preference, willingness to pay, and market price of capture and culture fish: Do their attributes matter? Aquaculture 2021, 544, 737139. [Google Scholar] [CrossRef]
  33. Burger, J.; Stephens, W.L., Jr.; Boring, C.S.; Kuklinski, M.; Gibbons, J.W.; Gochfeld, M. Factors in exposure assessment: Ethnic and socioeconomic differences in fishing and consumption of fish caught along the Savannah River. Risk Anal. 1999, 19, 427–438. [Google Scholar] [CrossRef] [PubMed]
  34. Hicks, D.; Pivarnik, L.; McDermott, R. Consumer perceptions about seafood—An internet survey. J. Foodserv. 2008, 19, 213–226. [Google Scholar] [CrossRef]
  35. Can, M.F.; Gunlu, A.; Can, H.Y. Fish consumption preferences and factors influencing it. Food Sci. Technol. 2015, 35, 339–346. [Google Scholar] [CrossRef]
  36. Rahman, M.N.; Islam, A.R.M.T. Consumer fish consumption preferences and contributing factors: Empirical evidence from Rangpur city corporation, Bangladesh. Heliyon 2020, 6, e05864. [Google Scholar] [CrossRef]
  37. Hansen, A.L.; Grung, B. Fish Consumption and Heart Rate Variability. In Fish and Fish Oil in Health and Disease Prevention; Academic Press: Cambridge, MA, USA, 2016; pp. 231–238. [Google Scholar] [CrossRef]
  38. Moreau, M.A.; Garaway, C.J. Fish Rescue us from Hunger: The Contribution of Aquatic Resources to Household Food Security on the Rufiji River Floodplain, Tanzania, East Africa. Hum. Ecol. 2018, 46, 831–848. [Google Scholar] [CrossRef]
  39. Erasmus, V.N.; Kadhila, T.; Thyberg, K.; Kamara, E.N.; Bauleth-D’Almeida, G. Public perceptions and factors affecting domestic marine fish consumption in Namibia, Southwestern Africa. Reg. Stud. Mar. Sci. 2021, 47, 101921. [Google Scholar] [CrossRef]
  40. Oliveira, R.C.; Dórea, J.G.; Bernardi, J.V.; Bastos, W.R.; Almeida, R.; Manzatto, Â.G. Fish consumption by traditional subsistence villagers of the Rio Madeira (Amazon): Impact on hair mercury. Ann. Hum. Biol. 2010, 37, 629–642. [Google Scholar] [CrossRef]
  41. Qasim, M.; Qasim, S.; Nazir, N. Factors affecting fish consumption of traditional subsistence fishers in Khyber Pakhtunkhwa, Pakistan. Mar. Sci. Technol. Bull. 2020, 9, 178–187. [Google Scholar] [CrossRef]
  42. Yin, S.; Han, F.; Chen, M.; Li, K.; Li, Q. Chinese urban consumers’ preferences for white shrimp: Interactions between organic labels and traceable information. Aquaculture 2020, 521, 735047. [Google Scholar] [CrossRef]
  43. Hussein, M.; Silva, A.; Fraser, I. Linking intrinsic quality attributes of agricultural produce to revealed consumer preferences. Food Qual. Prefer. 2015, 41, 180–188. [Google Scholar] [CrossRef]
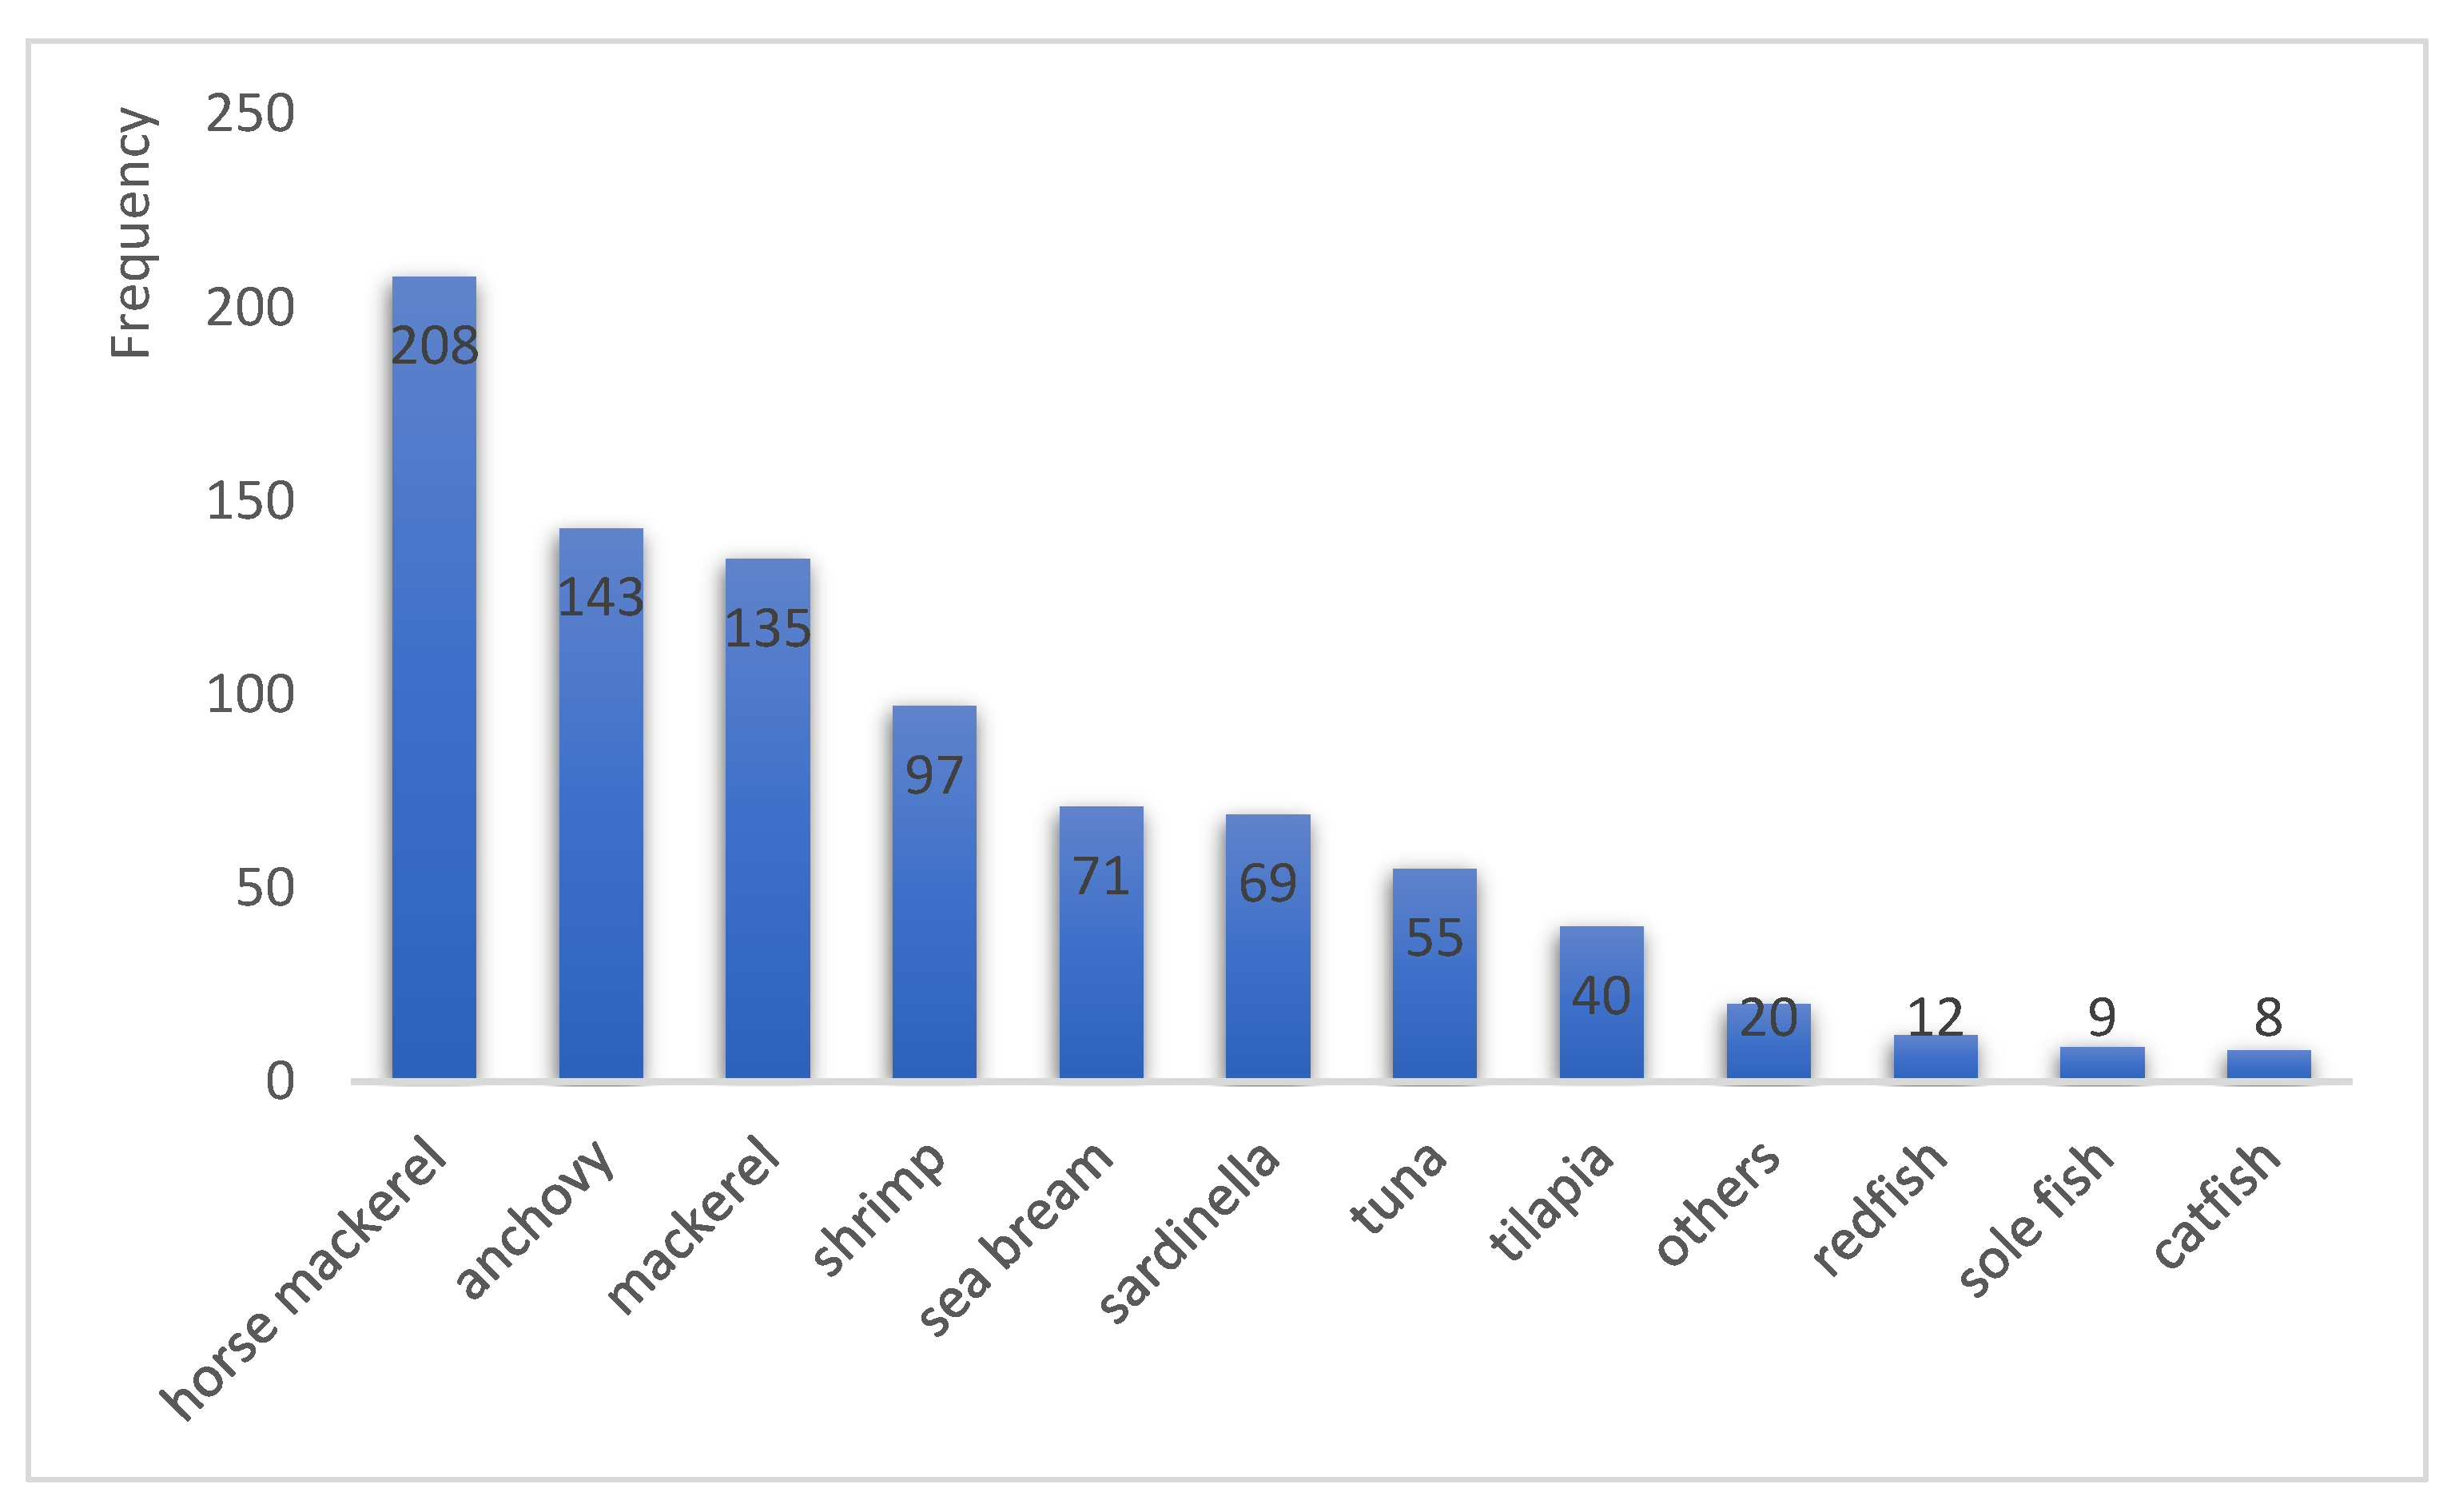
Figure 1. Type of fish species consumed by the respondents.
Sustainability 14 11475 g001
Figure 2. Reasons for fish/shrimp consumption.
Sustainability 14 11475 g002
Figure 3. Preference as to the origin of the seafood consumed.
Sustainability 14 11475 g003
Figure 4. Constraints in shrimp/prawn consumption.
Sustainability 14 11475 g004
Table 1. Variables description for use with the Poisson model.
NotationVariable NameDescriptionVariable Type/Criteria
Dependent Variable
y i FCFFish/shrimp consumption frequency Count variable 0, 1, 2, 3 … n
Independent variables
x 1 PriceAverage price of seafood purchased/consumedContinuous variable
x 2 QualityQuality of fish/shrimp often consumedBinary variable: 1 = Good; 0 = bad.
x 3 Household head incomeHousehold monthly incomeContinuous variable
x 4 ProximityHousehold living in area relatively near seaBinary variable: 1 = Near; 0 = Far.
x 5 Household sizeNumber of people in the household Continuous variable
x 6 EducationYears of schooling of the household headCategorical variable: 0 = No formal education, 1 = Elementary school, 2 = Secondary, 3 = College
x 7 AgeAge of the household head (in years)Continuous variable
x 8 GenderHousehold head genderCategorical: = 1 if the household head is female, 0 otherwise
Table 2. Socio-demographic characteristics collected.
ItemAnswer%ItemAnswer%
Monthly income<60 US Dollars15.9Price of seafood consumed<USD 126.9
USD 60–14827.3USD 1–USD 241.0
USD 148–20813.6USD 2–USD 318.8
USD 208–2487.5USD 3–USD 47.8
USD 248–39413.9USD 4–USD 65.2
>USD 39421.8>USD 60.3
Household size1 people4.9Seafood quantity purchased<2 kg (kg)48.1
2 people10.42–4 kg40.6
3 people16.24–5 kg6.8
4 people21.4 >5 kg4.5
5 people17.5Seafood purchasing frequency (per month)<4 times2.3
>5 people29.64–8 times10.1
GenderMale728–12 times28.2
Female2812–16 times16.2
Willingness to pay extra-costs for shrimp locally farmedYes65.6 >16 times43.2
No34.4
Table 3. Poisson model, seafood consumption frequency as dependent variable.
FrequencyCoef.Std. Err.zp > z
Averag_price_USD0.01140.0132840.860.389
Quality0.1872 ***0.062391 3.000.003
Household_Income−0.0217 **0.009049−2.400.016
Proximity_Sea−0.0775 **0.032129−2.410.016
Household_Size0.01020.0064691.570.116
Education−0.03210.027747−1.160.247
Age0.00110.0146780.070.943
Gender−0.05370.034601−1.550.120
cons2.6008 ***0.11506922.600.000
*** p < 0.01, ** p < 0.05 significant levels. Nb. Obs: 308; LR Chi2(8) = 32.77; Prob > chi2 = 0.0001.
Table 4. Correlation matrix of independent variables.
Price (Average)QualityH_IincomeProximityH_SizeEduAgeGender
Price_average1.0000
Quality0.00621.0000
H_Income0.0864−0.06661.0000
Proximity−0.00590.0260−0.00081.0000
H_size−0.05300.02650.06260.04561.0000
Edu0.0017−0.10360.335 **0.136 *−0.1061.0000
Age−0.0165−0.04060.0378−0.03810.238 **−0.19 **1.000
Gender0.0738−0.0081−0.0148−0.03570.1056−0.08490.0531.000
Note: ** Correlation is significant at the 1% level; * Correlation is significant at the 5% level.
Table 5. Regression analysis of factors influencing households’ willingness to pay for locally produced shrimp.
Coef.Std. Err.zp > z
WTP_Amount
Income0.00430.03250.130.895
Quality0.3462 **0.17601.960.050
Expenditure0.06050.03761.610.107
Education−0.02560.0933−0.270.784
Age−0.0826 *0.0496−1.670.096
Gender−0.06500.1119−0.580.561
Cons1.12130.37882.960.003
WTP
Shrimp_Consumption1.2396 ***0.21315.810.000
Quality−0.34260.3126−1.100.273
Income−0.08070.0498−1.620.105
Expenditure0.1794 ***0.05543.230.001
Proximity−0.25290.1625−1.560.120
Education0.07200.14620.490.622
Age−0.02440.0739−0.330.740
Gender−0.19100.1740−1.080.281
Cons−0.59470.6002−0.990.322
athrho−0.17000.2761−0.620.538
lnsigma−0.34830.0543−6.420.000
Rho−0.16840.2683
Sigma0.70580.0383
Lambda−0.11880.1920
*** p < 0.01, ** p < 0.05, * p < 0.1 significant levels. LR test of indep. eqns. (rho = 0): chi2(1) = 0.32 Prob > chi2 = 0.5707.
Publisher’s Note: MDPI stays neutral with regard to jurisdictional claims in published maps and institutional affiliations.