1. Context and Legal Framework
The prominence of waste management and treatment for societal existence is part of the goals of the European Union (EU) through the Green Deal [
1]. The ambitious goal of zero emissions cannot be achieved without a coherent strategy and legislative synergies in the chemical industry, water, soil and air, pollution sources, occupational health, and safety, but also within the frame of waste management and its components, i.e., reuse, recycling and destruction or disposal. From this perspective, the technical parameters and the socioeconomic and environmental aspects must be substantiated.
In this context, the term essential use appears, heard more and more often in connection with the Green Deal and the circular economy notion. Although this term does not yet have a clear definition, there are working groups set up at the level of the European Commission precisely for this purpose, namely to define the limits within which essential uses of a substance or an object can be discussed. Including the notion of essentiality requires a broad legal and political consideration, which results in directives and regulations’ amendments, and further on, these criteria to apply to every substance and every end-use, to shift the EU in the direction of a planned economy, where major product innovations would be eventually sanctioned by government officials. Moreover, the call-for-evidence initiators intend to propose restrictions for all the substances, aiming at all uses except the essential uses [
2].
The notion of essential use was introduced in the Montreal Protocol [
3] to foster the minimization of the usage of ozone-depleting gases, but at that time it had a very narrow definition and application, only to phase out ozone-depleting substances, including both production and consumption. In this Protocol, essentiality was recognized only concerning health, safety, or its criticality for the functioning of society, when encompassing both cultural and intellectual aspects, and no technically and economically feasible alternatives or substitutes were made available and became acceptable from the environment and health standpoint. The study of Cousins et al. [
4] is an important example of a radical new approach to regulating industrial chemicals, turning from today’s system of chemical regulation that is based on purely scientific, expert evaluation of the risks, hazards, and management of a substance.
When implementing the generic risk assessments, the real risks of individual uses are not considered at all and thus the essential use concept would imply that individual risk assessments are acceptable only for uses already established and considered to be essential. This would have an extremely repressive effect on innovation at the EU level, while an idea that might require the use of a hazardous substance, even at an extremely low-risk level, would be directed and developed outside the EU borders. As a consequence, EU consumers would be deprived of state-of-the-art, useful, and essential products to be developed outside the EU.
The main objective of waste management is the creation of a cleaner and greener environment that has a positive effect on a healthier population, according to the One-Health paradigm (WHO) [
5]. A cleaner environment is dependent on pollution reduction (water, air, soil pollution, noise, electromagnetic field, etc.). It is also dependent on intelligent waste management and treatment (relying on the essential uses of materials and smart technologies) [
6]. Smart waste management conserves energy through recycling (papers, apparel, plastics, glass, home appliances, etc.) and reusing practices (essential uses), which has a positive impact on the ecological footprint. Innovation in waste management practices provides an advantage of creating new jobs and employing people in the recycling industry. At the same time, new companies are created with the main objective of designing innovative services and products from recycled products. Some authors proved that green innovation is a sustainable solution for waste management [
7].
The present research is based on a Web of Science (WoS) search scanning the published literature (both articles and review articles) on the topics of waste treatment, waste management, the Green Deal, and sustainable consumption, in all fields and all WoS categories from 2010–2022. The search returned 166 articles, from which only 58 were selected based on the relevance criteria, the results obtained, and the environmental impact. Both groups of papers that included similar results between each other but were published before 2018, and those without full-text access that were very theoretical or irrelevant to the study, were removed.
Figure 1 shows the results of the authors grouped by main topic and year, together with the connection between them.
Since waste treatment is a very expensive process [
8], the main principle of prevention, which is easier than treatment, should be implemented at the EU level. It is better and more cost-effective to adopt eco-friendly approaches to meet the Green Deal’s objectives of reducing and reusing waste. Companies that embrace corporate responsibility regarding eco-friendly principles are the beneficiaries of free marketing, due to their green brand. Giving a personal, positive example is the best way to convince other companies and people to adopt sustainable eco-friendly behavior; sustainability in all aspects—economic, environmental, social, and time—became the aim of any country or business [
9].
Waste management begins with recurrent actions, such as disposing of the daily garbage in the landfills and sorting it (paper, glass, household waste, iron, used oil, etc.), under Green Deal recommendations. This is also a facile method used to mitigate odors (methane and other landfill gasses), the danger of waste contamination, and consequently reduce pollution. Another measure or rule is waste combustion or incineration, when the waste is transformed into gas, steam, ashes, and residues, reducing the landfill-related concerns and the volume of waste.
The circular economy pattern (prevent—reuse—recycle—recover—dispose) overcomes the old model (take—make—dispose) and makes companies make the commitment to reuse and repair by implementing conventional technologies through innovative methods. This approach recommends collecting and recycling residual waste to recover raw materials (e.g., the platinum from the computer mainboards) and/or transform them into usable heat, electricity, and fuel (greenhouses use less energy from greener sources, such as solar panels and windmills, and preserve natural resources since they are built from ecologic raw materials) [
10].
Electronic and electrical equipment management and e-waste management require a transboundary approach and a coordinated effort in view of eco-design and effective recycling [
11]. While biodegraded organic waste can be converted into nutrients for the soil for future plants [
7], non-recyclable waste is converted into electricity, fuel, or heat by an endless process called waste-to-energy (WtE), making the environment greener and greener [
12]. Meanwhile, hazardous waste (e.g., biomedical-related waste) needs careful handling to avert contamination. Another category of hazardous waste in continuous expansion is the waste from electrical and electronic equipment (WEEE). In states such as Germany, Sweden, and Italy, the collection of waste is greater than 4 kg WEEE/capita while, in Romania, this target is not reached, though the recycling carbon footprint decreased in the last years [
13]. This study emphasized the implementation of a coherent legislative system to achieve sustainable waste management [
14], with a treatment option of over 80% WEEE, regardless of the country, with efforts to develop dedicated sustainable support instruments, collection areas, and recycling facilities [
15]. In other states, such as Slovakia, the treatment is not very common, but the storage overpasses 50%. To solve this problem, the authors suggested legislative updates and promotional actions to raise waste treatment awareness and enforcement [
16,
17]. Additionally, in Slovakia, the main potential to enhance the optimization of resources is agriculture, due to its great waste share of 90% [
18]. Regarding healthcare-related waste, Serbia presents a 60% technical inefficiency, and reducing resource consumption is a necessity [
19]. Another study considered that the biohazard generation rate (0.17 kg/bed/day) is in agreement with the values in the healthcare facilities in Eastern Europe, using safe and affordable methods of medical waste management [
20].
However, there are differences between the states regarding the e-waste management system. Gavrancic et al. [
20] analyzed and presented data regarding the e-waste management system in Italy, one of the founding countries of the EU, and Serbia, an EU candidate country. Within this work, the following aspects were considered: legislative framework and EU directive goals in terms of e-waste, institutional setup, collection system, and existing recycling and treatment technologies. In addition, material flow analysis is used to model mass balance within WEEE treatment plants in both countries.
The mining industry, with its tailings and acid mine drainage activities, is another source of waste with a very important negative impact on the environment and human health since it pollutes the surface and groundwater [
21]. In their study, Đurđevac Ignjatović et al. revealed that other negative consequences of mining come from the use of heavy metals and radioactive elements, and the solution offered is the use of waste as backfill and the synthesis of paste with natural additives, which would result in better synthesized materials with lower negative impact against the groundwater. Other authors consider that the pollution impact can be minimized if replacing industrial waste (e.g., cement) with a safe backfill mixture, without its reprocessing and production [
22]. Furthermore, to reduce the environmental footprint, it is better to extract the valuable components from the previously disposed man-made waste, which is also directly linked to cost reduction [
23]. The circular economy principles refer not only to judicious resource management and saving or preventing negative impact but also to innovation, manifested in renewable technologies, such as geotechnologies. For example, a study showed that acidic or alkaline wastewater has to be treated with a solvent containing modifying additives that help extract valuable components from depleted ones and the subsequent processing of mineralized wastewater and productive solutions, purifying waste before discharge [
24].
Specialists emphasize the role of formal education related to the importance of a circular economy and the impact of green practices to gain green sustainability [
25,
26]. Understanding legal, economic, social, and ethical concerns, next to implementing the most advanced available techniques, such as cloud computing, Internet of Things, artificial intelligence, machine learning, blockchain, big data, etc. [
27], should develop into innovative methods to gain sustainable waste management and treatment [
28,
29,
30,
31].
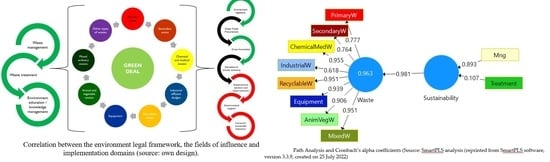
To summarize all of these aspects,
Figure 2 provides an overview of the links between the environmental legal framework and the fields of influence and implementation.
It is very clear that concerns are raised in all of the EU member states, and the very recent literature gives the dimension of legal framework integration and implementation [
32,
33,
34]. One of the mandatory steps taken in this direction should be represented by the enforcement of the revised Waste Framework Directive 2008/98/EC (WFD) [
35,
36], which imposes the establishment of a database with information on articles containing substances of very high concern (SVHC) on the Candidate List established under Regulation (EC) No. 1.907/2006 (REACH) [
37]. In this framework, the substances of concern in the products database (SCIP) includes that the EU member states must ensure that any supplier of an article containing such SVHC in a concentration above 0.1%
w/
w provides public information throughout the whole lifecycle of products and materials, including at the stage of waste.
Various mathematical models have been applied lately in economic waste management system (WMS) optimization, including restrictive constraints as different waste sources, waste fractions, and potential destinations, from an economic perspective, such as economies of scale [
38]. In addition, increased awareness and initiatives in novel technologies have been reported in view of recycling used products for better integration of waste management within the supply chain [
39]. Thus, in view of developing a valid circular economy, it is crucial to make the right decisions regarding some key principles, and mainly to decrease the burden of hazardous substances to reduce adverse impacts on health and the environment and to oblige producers to ensure, as much as possible, safe use, reuse, and disposal.
A viable circular economy should remodel technological flows, commute industrial facilities to get them closer to one another, track availability, and identify and prioritize novel or disruptive technologies that are conducive to the reuse and recycling of waste. The decision makers should take into account environmental, budgetary, and social issues, next to constraints linked to a sustainable WMS [
38], and take appropriate measures. It is therefore essential to establish a cross-cutting approach to address various types of waste, to be integrated into and applied under all relevant domains: primary waste, secondary waste, chemical, and medical waste, industrial effluent sludge, recyclable waste, equipment, animal and vegetal waste, and mixed ordinary waste [
40].
Having in mind the issues and the difficulties of waste management enforcement, the present study aimed to assess the rate of EU member states’ implication in waste management and treatment processes, and a comparison of Romania with the EU average was performed to identify Romanian versus other EU industries and waste sources that produce the highest amounts of waste, and to quantify and make rational decisions on the future development of products and economies. Moreover, the researchers assessed the variations of waste types within European states to target their origin and to raise an inquiry into the state-of-the-art European and national policies. Investigating waste management from this perspective provides significant and valuable input for the real approach to the issue, and the applicability of the datasets obtained is well-recognized in other studies [
41]. In this approach, analyses using official data were performed and discussed: To statistically investigate the waste category differences between states, ANOVA was chosen, followed by cluster analysis to group the EU member states by three criteria (total waste, waste management, and waste treatment). Furthermore, SEM path analysis was performed to assess the treatment influence on each type of waste; the shortcomings of the process were emphasized and recommendations were provided.
2. Materials and Methods
From the waste management point of view, it is necessary to study the quantities of waste obtained within the past 10 years, by category, and their management. The categories chosen were: primary waste, secondary waste, chemical, and medical waste, industrial effluent sludges, recyclable waste, equipment, animal and vegetal waste, and mixed ordinary waste. From a Romanian perspective, it was also important to follow which or if there were deviations from the approach of implementing European regulations versus other EU member states to be able to model future approaches in the field. The study comprised 25 EU member states since, on the one hand, the EU member states Greece and Latvia did not provide data regarding waste management, and on the other hand, the UK withdrew from the EU.
In the first phase of the analysis, graphs of the trend of types of waste produced in Romania and the EU were designed for the period of 2010–2018 with polynomial 4th-degree regression and moving average regression. These results were confirmed by ANOVA made with the SPSS software to determine whether significant statistical differences between the averages of two or several independent groups occur. Data for 2020 and beyond are still unavailable [
42,
43,
44].
In the second phase of the scientific approach, the ratio of managed and treated waste produced by the EU member states was analyzed. In this regard, three other types of data for 2010–2018 were collected: management of waste excluding major mineral waste, by waste management operations (coded wmanag), treatment of categories waste-by-waste, versus hazardousness and operations related to waste management (coded wtreat), and generation of categories waste-by-waste versus hazardousness and activity NACE Rev. 2 (coded wtotal). The spread of states in clusters was also performed by SPSS software. Each group contained states that have the average of wtotal, wmanag, wtreat variables within a narrow range of values, as in the “k-means cluster” algorithm [
45,
46,
47,
48,
49].
In the third step of the research, path analysis was conducted to point out the relationships among all the independent constructs. The outcome was a model that emphasizes the causal structure by which independent constructs determine the effects on a dependent construct. The prerequisites for carrying out such a path analysis are (a) the constructs should present convergent relationships and are not allowed to influence one another and (b) the constructs should reflect the time sequence, taking into account that the predecessor can influence the successor. The causal modeling is based on covariance and correlation analysis and is validated by tests such as F Square, R Square, Chi-square, bootstrapping, and associated p-values. All of these values are presented as a diagram that contains the direction of the relationship, the loading factors, and the associated statistics.
While the methods used in the present study are consecrated in the field, the work performed to outline the level of waste management and waste treatment in Romania versus the other EU member states is original. Thus, the input data of the research were computed from the official statistics provided by Eurostat in [
50,
51,
52], and ANOVA was performed used the following assumptions [
53,
54]:
Assumption 1. The dependent variables must be measured on a continuous scale. This condition was met since the waste was measured in tons.
Assumption 2. The independent variables should belong to at least two independent groups. In the study, eight different types of waste were employed, meaning that the condition was met.
Assumption 3. Independent observations are required, which means that there is no relationship between the observations of each group or between the groups themselves, e.g., there must be different participants in each group, without a participant belonging to more than one group. This is more of a study design input issue than something that may be tested. In the present case, the observations are independent, since there are no strong correlations between types of waste.
Assumption 4. Extreme values should not be considered. Outliers are data points that do not follow the usual pattern. Even in the case of primary waste, its values, which are far from the others, cannot be considered outliers.
Assumption 5. Variables should be distributed normally in each group of independent variables.
In addition, the SmartPls software, which provides a wide variety of tests to be used to ensure a coherent analysis and interpretation of the data, and to assume the results of the research, was employed to validate the assessment. The variables considered had high values for composite reliability, Cronbach’s alpha composite reliability, and rho_A (>0.7 is the lowest authorized value, but some researchers also accept the threshold of 0.6) and AVE is the average variance extracted (>0.5 is the lowest authorized value).
3. Results and Discussion
When agreed upon, the essential use concept considers both the use and its benefits to civil society and the environment while the benefits may be determined using a life-cycle approach and a comparison with the life-cycle socioeconomic benefits of identified alternatives, consequently followed by an assessment of the management evolution.
Thus, for the first phase of the study, data regarding eight different types of waste produced overall at the EU level and in 25 EU-member states were collected for the years 2010, 2012, 2014, 2016, and 2018 [
50]. The major limitation of this study was linked to the fact that data regarding waste management provided by Eurostat are not updated for the 2019–2022 period. (
http://appsso.eurostat.ec.europa.eu/nui/show.do?lang=en&dataset=env_wasgen, accessed on 15 July 2022).
The average data on the waste produced in Romania and the entire EU are presented in
Table 1, and based on these data, the trend of produced waste within the past decade was chartered in
Figure 3 (the EU
stddev = 1.44% and Romania
stddev = 2.96%).
As shown in
Figure 3, which gives provides the trend of types of waste produced in Romania and the EU, it was confirmed that most of the waste produced by the EU and Romania is represented by primary waste (over 84%), while the remaining 16% of waste is composed of secondary waste, chemical and medical waste, industrial effluent sludge, recyclable waste, equipment, animal and vegetal waste, and mixed ordinary waste. One may observe a visible difference between the EU and Romania regarding the primary waste, recyclable waste, and mixed ordinary waste that is produced in far larger ratios at the EU level. This situation may be explained, on the one hand, by a higher living standard in the West European states, which may be associated with an accumulation of more important quantities of primary waste and, on the other hand, by a higher level of WFD implementation, awareness, and sanction regimes in other European member states, which already develop functional and sustainable systems of waste reuse and recycling, by categories, thus contributing to more coherent protection of the environment.
The polynomial regression models developed for Romania and the EU (
Figure 3) produced very similar values in terms of R
2 in the EU (R
2 = 0.98) and Romania (R
2 = 0.97), which means that only 98% of all of the data and 97%, respectively, may be represented by the model.
The validity of the interpretation above is sustained by analysis of variance. In this case, single-factor ANOVA has been used to set the information on whether there are important differences between independent groups’ types of waste (
Table 2 and
Table 3).
Furthermore,
Table 2 presents descriptive statistics (sum, average, and variance) of the eight variables analyzed. Each variable represents a group in the ANOVA: Single Factor variance analysis. Since the ANOVA
p-value for Romania (1.517 × 10
−34) is <0.01, one may conclude that significant differences between the eight types of waste collected in Romania appear. The calculated F value (269.5) is much higher than the critical F value (2.22) for 7 degrees of freedom (df), which strengthens the analysis’ reliability.
The waste analysis for the EU is illustrated in
Table 3. Since the ANOVA
p-value for Europe (3.37741 × 10
−8) is <0.01, one may conclude that, at the EU level, significant differences are also encountered between the eight types of waste collected. The calculated F value (10.26) is greater than the critical F value (2.17) for 7 degrees of freedom (df), which strengthens the analysis’ reliability. However, the difference between Fcalculated and Fcritical is not as important as in the case of Romania. This may be attributed to the fact that, overall, the EU recycles more than Romania.
In the second phase, a cluster analysis was performed in three steps and over three criteria: wtotal, wmanag, wtreat. The variables were collected from five different charts [
50,
51,
52] and an average was made. The results are shown in
Figure 4, where it is very easy to observe that Germany and France have had the highest waste production (ca. three times more waste than other states with a high production of waste), but most of the waste was treated. These rates are explained by the dimension and population of the states, the high living standards, and the production industries. This is a typical case of developed industries, where innovation within each industry should be provided and the new policies recommended by the Green Deal should be enforced.
In this phase, cluster analysis in three steps was designed over three criteria: wtotal, wmanag, wtreat. The observations belong to the cluster with the narrowest average (centroid cluster), serving as a prototype of the cluster. K-means clustering minimizes intra-cluster variances (squared Euclidean distances) [
55]. The distances of each data point (average of three variables for a state) to the centroids are adjacent (
Table 4).
Analyzing the first criterion, wtotal (total waste), one may observe that states such as Germany and France (Cluster 5) have the highest rates of waste production, associated with a very high standard of living (
Table 4). Belgium and Austria (Cluster 1) are small states with low rates of waste production, associated with a high standard of living. The Nordic states Finland and Sweden form Cluster 2 with Spain, Italy, the Netherlands, Bulgaria and Poland, and have high rates of waste production. In the Nordic states, this may occur mainly due to industrial and technological waste. On the other hand, in Spain, Italy, or Bulgaria, these high rates of waste may be associated with the lack of culture regarding recycling (reduce—reuse—repair), lack of punitive legislation in the field, insufficient funds for green innovation implementation, and/or management stiffness in implementing new sustainable methodologies for waste collection and issues in recycling and green innovation supply chains. Romania forms a cluster by itself, producing more waste than states in Cluster 2, and facing the challenges encountered in Spain, Italy, and Bulgaria. The rest of the states, such as Czechia, Denmark, Luxemburg, etc., form Cluster 4, with very low rates of waste production, some due to their size, and others due to the challenges presented above. This finding was also acknowledged in [
56,
57].
From the analysis of the second criterion, wmanag (management of waste), it was noticed that Germany (Cluster 5) reaches the highest rate, relating the values of this criterion to the values of total waste, while it manages to control only one-third of the total value. States like Belgium, Spain, and the Netherlands (Cluster 1) are very close in behavior to Germany. These are states with very high rates of waste production that manage less than half of their total waste production. Meanwhile, France, Italy, and Poland form a different cluster (Cluster 3). They seem to have better control over waste management. Romania encounters very serious problems regarding waste management. Other states, such as Bulgaria, Czechia, and Denmark (
Table 4) are in a similar situation and form, next to Romania, Cluster 2. In Cluster 4, there are states such as Ireland, Croatia, Cyprus, and Luxembourg that claim a low production of waste together with very beneficial waste management (
Figure 4).
Analyzing the third criterion, wtreat (treatment of waste), one may observe that Germany (Cluster 5) and France (Cluster 1) form two different clusters since they have the highest rates of waste production and waste treatment at the same time, but there is a significant distance difference between them. Cluster 2 is formed by Poland, Romania, and Bulgaria, which have almost the same values for total waste and treated waste. They are efficient in waste collection and sorting by category, disposal of the landfill, combustion or incineration, previous reuse and repair technologies, raw material recovery, e-waste management, WtE, etc., and implementing green policies and legislation. Thus, Romania has an adequate ratio in terms of waste treatment. Cluster 3 is formed by Spain, Italy, the Netherlands, Finland, and Sweden, which have some issues regarding waste treatment. Although they produce different quantities, these states treat almost the same ratios of waste. The other states, such as Czechia, Denmark, and Luxemburg, form Cluster 4, with low rates of waste production and high rates of waste management and treatment.
Primary waste represents the main type of waste, almost 95% in the EU and 84% in Romania. The share of services in the economy is lower in Romania than in the EU, and this may explain the difference of 10% between Romania and the EU in terms of primary waste. The higher living standard in the EU is associated with a richer shopping cart and higher expenses on services, which, in turn, are associated with higher amounts of waste.
Another major difference between Romania (0.5%) and the EU (2.2%) is the amount of chemical and medical waste. Within the past 20 years, Romania did not make substantial investments in industry, chemistry and medical laboratories, or hospitals. This might be the main explanation for such a low rate of chemical and medical waste.
At the EU level, the rate of recyclable waste is 9.9, while in Romania this ratio weighs 2.2. In analyzing recyclable and equipment waste, one may observe a weak point in the Romanian legislative system: that it does not sanction polluting companies or does not implement the sanctioning process. Additionally, in Romania, the equipment waste ratio is much higher (2.3%) than in the EU (0.6%), which may be due to the only recently started recycling programs that include selective waste collection in Romania: Baterel campaign (on battery collection), Rabla (on damaged auto collection), home appliance collection, etc.
Overall, most EU member states implemented programs for waste management and waste treatment. Some states have strong policies supported by appropriate legislation in this regard but the main impediments in waste management and treatment are linked to the higher priority given to performance, cost, and appearance, which has been also highlighted in [
56].
Romania is an interesting case when considering waste treatment.
Figure 5 shows that Romania succeeds in treating 98.7% of its waste compared to the EU, which overall appears to be less efficient (91.8%). Nevertheless, Romania still has issues and needs to improve its waste management (EU, 29.3% and Romania, 10.4%), with governmental support.
Furthermore, the research intended to test the hypothesis that waste management and waste treatment have different influences on the types of waste, and to suggest sustainable solutions.
For the model, two variables have been chosen: Sustainability as the formative variable, and Waste as the reflective variable, to measure the influence of the Sustainability variable (consisting of two items, Management (Mng) and Treatment, which reflect the sustainable solutions found to mitigate the waste impact on human health and environment) on the Waste variable that reflects the management of the eight types of waste, consisting of the eight sub-items (PrimaryW, SecondaryW, ChemicalMedW, IndustrialW, RecyclableW, Equipment, AnimVegW, and MixedW), as presented in
Figure 6.
Since it is recommended that the load factors (LF) for the sub-indicators of the two variables (Sustainability and Waste) be larger than 0.6, it implies that these sub-parameters form strong latent constructions.
As in the previous step, the waste treatment appeared to be very high in the Sustainability variable, referring to the waste treatment that influences each type of waste was created. Among the items with higher weight in the Waste variable (
Figure 6), ChemicalMedW (LF = 0.955), RecyclableW (LF = 0.951), MixedW (LF = 0.951), Equipment (LF = 0.940), and AnimVegW (LF = 0.940) need to be highlighted. Less important factors are PrimaryW (LF = 0.777), SecondaryW (LF = 0.764), and IndustrialW (LF = 0.618). Thus, one may affirm that primary, secondary, and industrial waste are the least treated categories of waste and that such waste is not very well-managed.
Furthermore, using the SmartPls software, the consistency of the presented model was validated based on the parameters set in
Table 5 [
57,
58], relying on the fact that the F test has a value (25.662) higher than the tabular rho_A value (0.967), which is greater than 0.7, the minimum acceptable threshold. It was noticed that Cronbach’s alpha (0.956) and composite reliability (0.959) values tend toward the minimum accepted threshold, 0.7 (
Figure 6 and
Table 5).
Furthermore, to verify the validity of the model, bootstrapping analysis was performed to confirm the hypothesis (
Figure 7 and
Table 6), using PLS-SEM analysis, which is a renowned bootstrap procedure that enables testing of the significance of the subsequently applied tests: path coefficients, Cronbach’s alpha, and R² values. From the analysis, the path coefficient (Sustainability → Waste: 0.981) demonstrated and confirmed the hypothesis (
Figure 7). Overall, waste management and waste treatment have different influences on the types of waste and come with sustainable solutions.
In
Figure 7, it can also be noticed that all of the sub-items of the Waste construct have values higher than 1.9, meaning that they have a decisive weight in the coherence of the model. The lowest value is 2.159 for industrial waste and the highest value is 26.489 for chemical waste. However, the most important is the path coefficient (Sustainability -> Waste: 0.981) in
Table 6, which is very large, and the value of T-test is confirmed as statistically significant by
p-values < 0.05. Additionally, the standard deviation is very low (0.012), meaning that this analysis is consistent [
57,
58].
4. Conclusions
What European authorities determine as essential in terms of waste may not be assessed properly. While the European Commission is focusing on industrial restrictions and conversions, the present study showed that primary waste should be better targeted. Resulting differences in interpretation could lead to disputes and the risk of the essential use concept being considered a technical barrier to trade. Recognition should be given to regional and cultural differences in what is seen as essential, and waste-generators throughout the EU. Moreover, due to the nature of the global economy, a whole strategy to mitigate the risk of regional differences in necessities and, consequently, waste management interpretation, should be foreseen. From the analysis performed, one may conclude that the alternative hypothesis is accepted, and most of the waste produced by the EU member states is very well-managed.
The regression model designed in this study emphasized that primary waste is the most important factor to be taken into account in the future policies and implementation of circular economy principles and the Green Deal’s objectives. The finding that primary waste represents 95% of waste in the EU and 84% in Romania is sustained by the weight of services in the current economies, and this ratio is lower in Romania mainly due to a lower living standard, very high cost of living, and too many working hours per capita (versus the EU average).
Furthermore, an insight regarding different attitudes and implementation of waste management was achieved through cluster analysis using the K-means algorithm. The present study revealed that there are member states, such as Germany and France, with very high rates of waste production, which compensate with very high rates of waste management and treatment, due to a high living standard and environmental culture, a high degree of legal compliance, and governmental support through investments in circular economy-related job creation and green industrial patents. Other states, such as Spain, Italy, the Netherlands, Finland, and Sweden, should pay more attention to waste treatment. A very positive example is represented by Czechia, Denmark, and Luxemburg (Cluster 4), which declared low production of waste and, at the same time, very beneficial waste management and treatment approaches. Finally, states such as Poland, Romania, and Bulgaria focus on meeting the Green Deal’s objectives, with improved annual results. Romania proved to be very efficient in waste treatment, although its waste management still has to be improved by governmental support, investments in the field, and urging green public procurements.
In this context, when waste management and waste treatment gain prominent attention, especially in the context of the globally increased need for resources and raw materials and products consumption, it becomes mandatory for Romania that, in the short to medium term, this continuously growing waste production be countered by sustainable strategies and practical innovative approaches, which can facilitate the integration of knowledge and modern technologies both in production and supply chain, in view of reducing the ecological footprint and achieving a sustainable green economy.


