1. Introduction
Due to industrial growth and the exponential rise in population, energy demand is rising [
1]. Energy management (EM) plays a major role in various energy aspects, including energy production [
2], energy distribution [
3], and energy storage [
4], while emerging renewable energy sources provide an alternative long-term solution for energy demand to mitigate climate change and reduce carbon production [
5,
6].
In the past few decades, particular attention has been dedicated to EM in various technological fields such as renewable energy [
7,
8], hybrid renewable energy systems [
9], electric vehicles [
10], energy saving [
11], waste-to-energy management strategies [
12], and building energy [
13,
14]. Recently, EM has found important applications in renewable energy.
Within renewable energy, there are various EM challenges. For example, there are various sources of renewable energy but significant uncertainty in production [
8]. Providing the required functionality between microgrids and consumers in the flow of information is another management challenge. Such a management system should ensure that generation and distribution systems provide energy at nominal operative budgets [
7]. David et al. [
15] utilized the Scopus database to find research published between 2000 and 2019 related to EM for photovoltaic cells. They used the search string ‘(“solar” and “energy” and “management” and “photovoltaic”)’. They found and reported ten trends that could assist researchers in finding ideas for future studies on photovoltaic solar energy. Roslan et al. [
16] explored the Scopus database to find the most cited papers (as of January 2021) in the subject of microgrid control methods for realizing sustainable EM. The most cited publications were from 30 different countries and were published in 33 different journals.
The uncertain and variable nature of renewable energy sources demands particular design considerations, such as backup energy sources and combinations of two or more renewable-energy sources. These considerations could raise capital and operational costs of energy systems. To counter this, the control of the flow of energy and management of energy storage systems and demand are ways that EM principles could help to reduce energy costs [
9].
The recent growth in electric vehicles (EVs) created new challenges for energy management. The battery cost is very significant, as they account for approximately 33% of the cost of the vehicle [
10]. Strategies for EM in EVs during driving cycles and energy source management expose new challenges that should be addressed in this industrial sector [
10]. EM for fuel cells in EVs is a separate challenge that also requires attention [
12]. Raboaca et al. [
17] employed a bibliometric approach to address these issues. They found 127 EM strategies, which were analyzed and classified by multiple criteria. Miah et al. [
18] utilized the Scopus database and explored the papers related to EM for EVs. They found 2704 papers and selected 100 of the most relevant for further analysis, of which 22 were published in 2020, reflecting the rapid increase in interest in the sector.
A building EM system consists of many parts, such as lighting, air conditioning, ventilation, heating, and refrigerating equipment. Statistical results show a notable increase in energy saving when EM systems are implemented [
11]. Applicable control systems and software for building management is already commercially available. However, integrating building energy with novel energy storage systems and renewable energy sources opens new EM challenges that should be addressed. The integration of artificial intelligence with building EM systems is one potential area of development to meet this need.
There are various factors that contribute to waste: Environmental, social, technological, economic, and political. Analysis of and decision making related to waste in EM, therefore, requires multidisciplinary support and relies on multiple measures in the process of decision making. Since various measures are involved, some of these objectives typically conflict with each other and robust management strategies and decision analysis tools are required [
12].
EM is a “hot topic” that has attracted the attention of many researchers [
1,
2,
3,
4,
5,
6,
7,
8,
9,
10,
11,
12,
13,
14]. Many papers and reviews have been published to address critical issues in different fields of energy production [
2], distribution [
3], storage [
4], savings [
11], renewable [
7,
8], hybrid renewable [
9], EVs [
10], waste management [
12], and buildings [
13,
14]. These reviews investigated the trend of progress and advancement in technological aspects of energy. Existing bibliometric studies are available in EM systems related to solar energy management [
15], microgrid control [
16], and EVs [
17,
18]. However, the communication between scientists, organizations and countries for EM is lacking. A scientometric analysis can address the statistics of publications, citations, and worldwide dynamic maps of the connectivity and contribution of scientists, organizations, and countries on energy management.
The present study aims to analyze the topic of EM using a scientometric analysis approach for the first time. The results of the current research answer the following questions: What are the most significant scientists, countries, and organizations advancing energy management in the field? What are the papers with the most citations? What are the organizations and countries with the most publications? What are the characteristics of EM’s global dynamic and thematic map? How are scientists, papers, organizations, and countries coupled?
2. Methods
In the current research, data relating to publications in the field of EM were mined from Web of Science (WoS) Core Collection, a leading database for ranking and collection of scientific publications. WoS was searched on the 5th of May 2022 for the papers published since January 2018. Here, 2018 was selected as the initial year since WoS provides impact factor reports for journals based on the most recent five years of citations. Similarly, Scopus CiteScore (a competitor to WoS) also provides a citation impact report based on a four-year citation impact and use of that database would be more suited to a period of 2019–2022. The data were analyzed automatically using a bespoke MATLAB code. Moreover, the software VOSviewer (Centre for Science and Technology Studies (CWTS), Leiden, The Netherlands) was utilized for bibliographic mapping and cluster illustration. The following search string was used to extract data related to energy and management from WoS: ‘(energy* (Title) AND management* (Title))’. This string combines two important terms related to EM: energy and management that must appear in the title of each article. The asterisk ensures words such as energies or managements are also included in the search domain. The MATLAB code itself is contained in 47 separate files, which are inconvenient to use without guidance. Readers are encouraged to contact the lead author if they wish to obtain copies of the exact codes used in this study. A more user-friendly version of the analysis code will be developed and distributed once ready.
The first 500 records returned by WoS were checked manually for any irrelevant results, of which five such records were identified. Thus, we estimate that 1% of the sample is inappropriate.
Table 1 in [
19] reports the required sample size for a population of 7000 with 95% confidence is 378. Thus, the number of relevant records in the adopted sample size of 500 in the current research is above the 378 records threshold and can represent the total sample with a confidence level in excess of 95%.
During the anlaysis, a threshold of 100 EM citations was applied for entries on the dynamic maps. The tables and graphs are sorted by the highest publication counts and citations. Thus, the samples with a 1% error seem to be adequate for statistical analysis and graphical representation of the outcome. It is also likely that inappropriate articles are from several fields of study. Since the current research aims to provide statistical analysis and worldwide dynamic maps of connectivity and scientists, organizations, and countries within the field of EM, it is likely that the inappropriate articles will not be represented strongly and so the 1% error would effectively diminish further in the computations and maps. Based on these factors, the data collected by the automated procedure were accepted without and manual screening.
3. Bibliometric Analysis
Using the search string explained in the
Section 2, a total of 7030 documents were found and analyzed to reveal the most productive authors, organizations and countries, as well as links between them.
3.1. Publications and Citations by Year
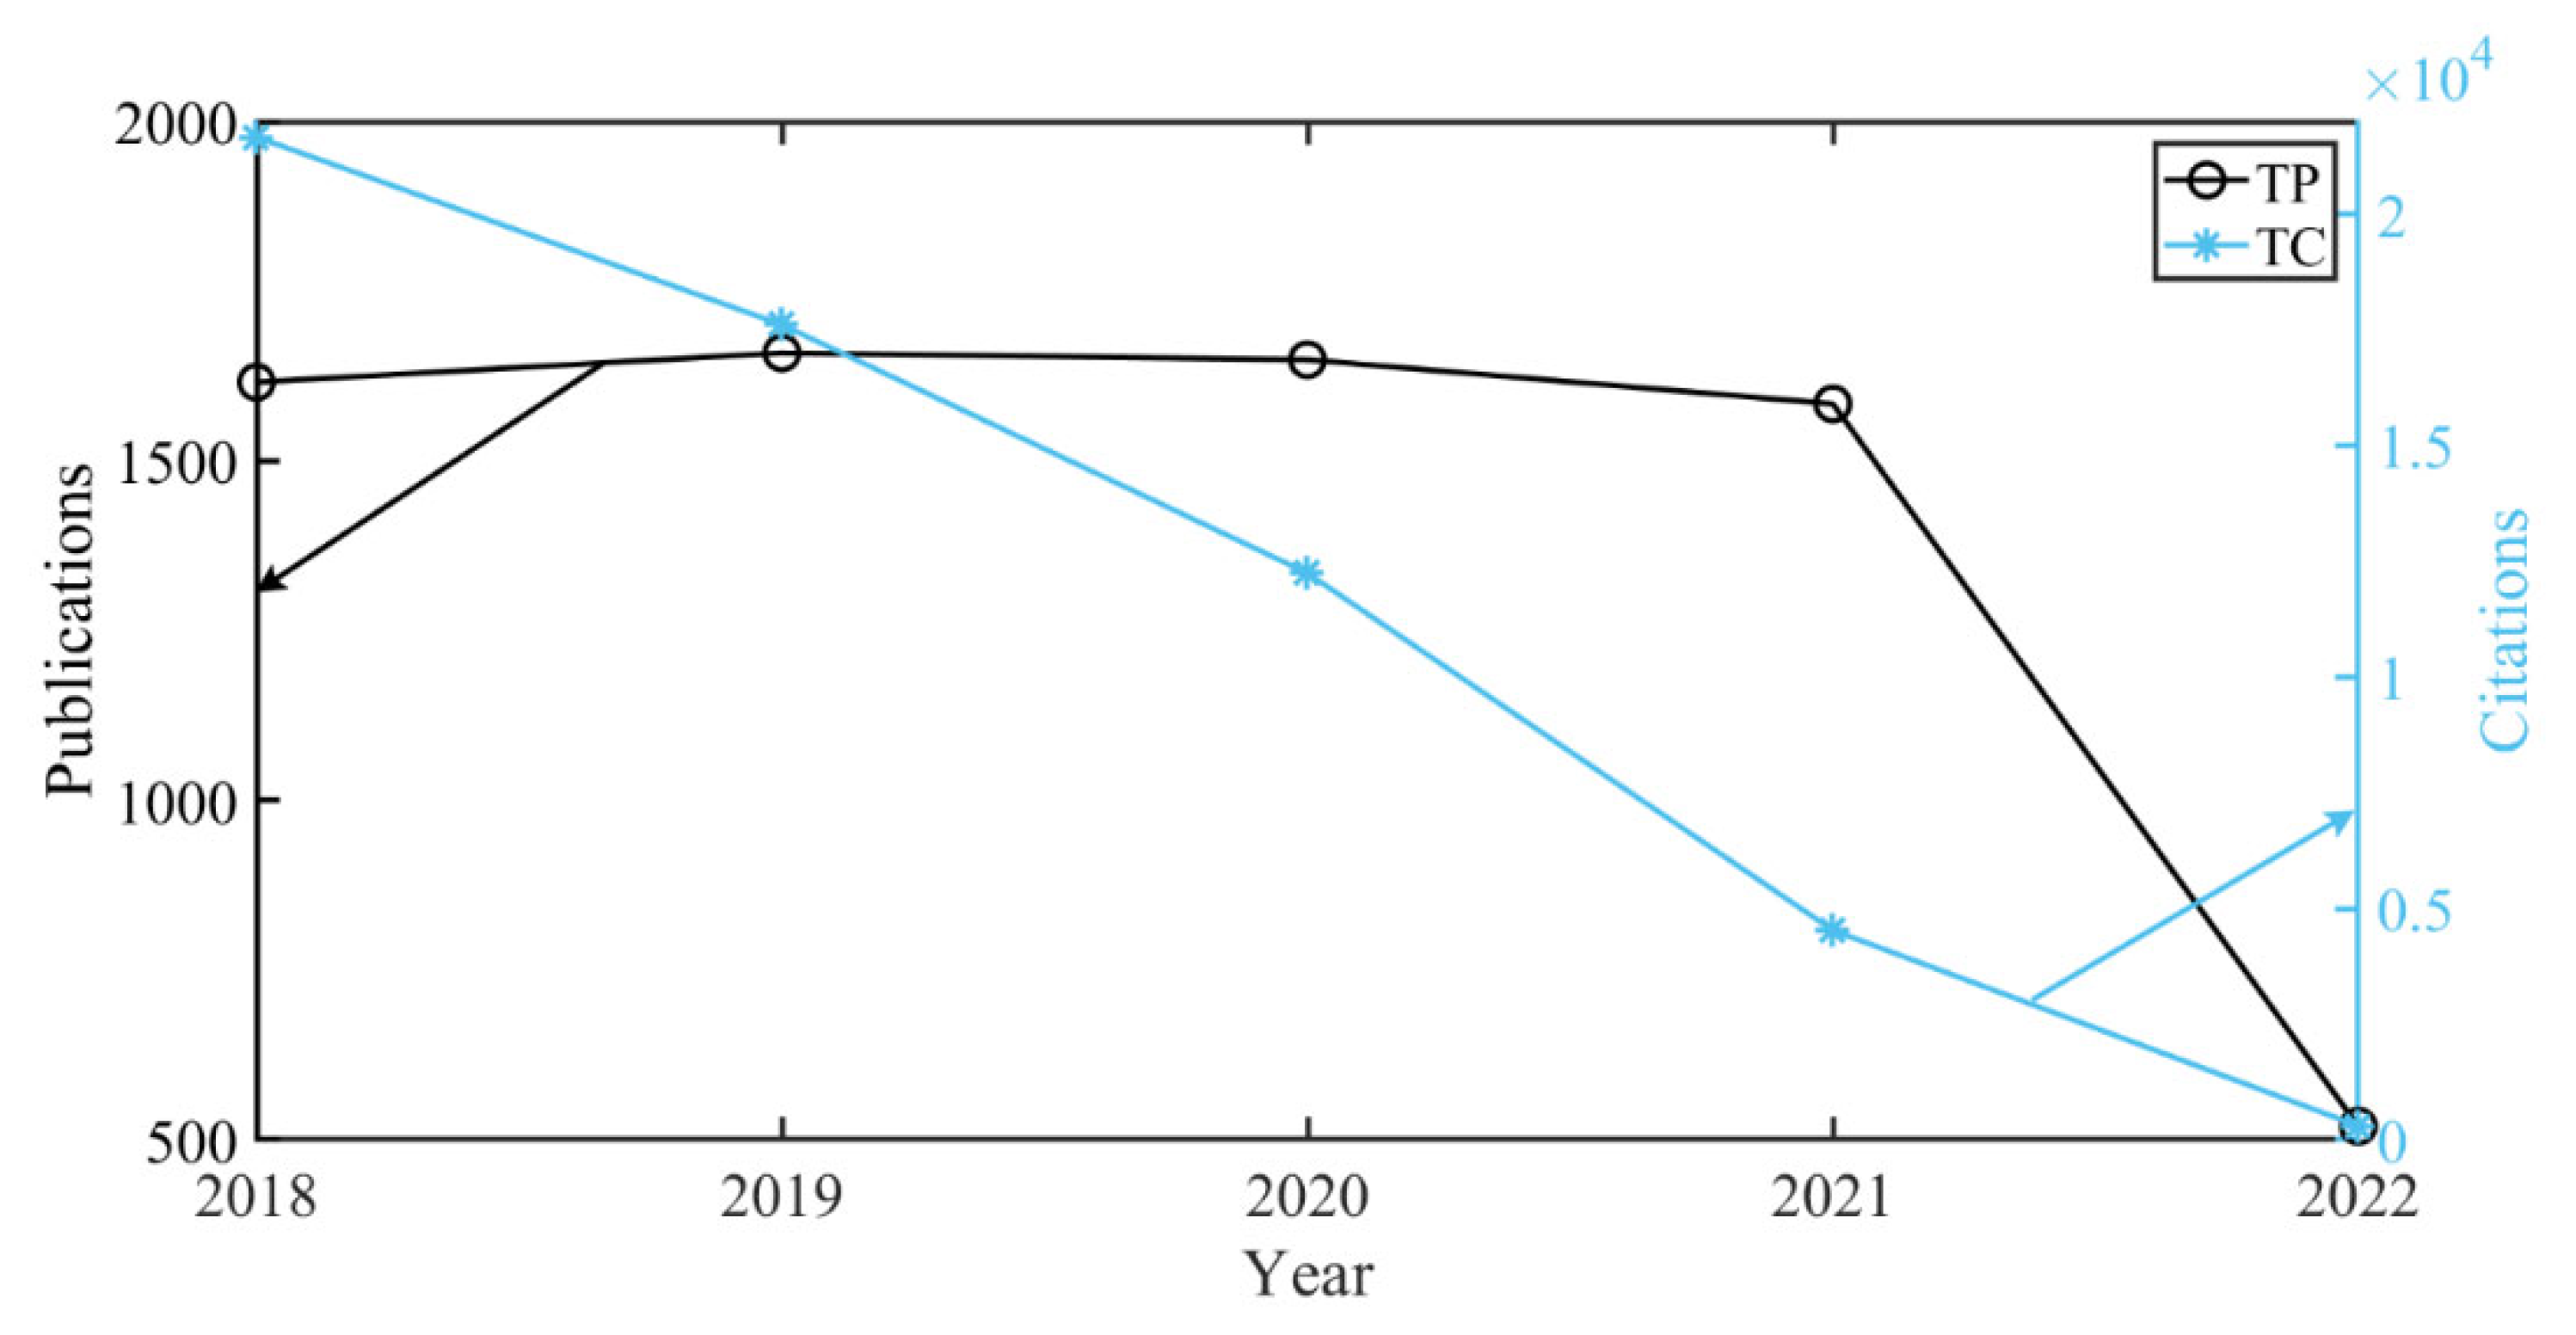
Table 1 and
Figure 1 report the yearly number of the total publications (TP) and the total citations (TC). As can be seen, about 1600 publications were published each year except for 2022, which is still ongoing. The maximum number of citations for any given year was approximately 21,000, which occurred in 2018; then, the number of publications fell slowly each year. This is reasonable and simple to explain, as an older publication has more time to receive citations compared to a more recent one.
Table 1 categorizes the papers with thresholds higher than 1, 5, 10, 25, 50, 100, and 200 citations.
Table 1 suggests that approximately 55% (3876/7030) of articles received at least one citation and nearly 32% (2234/7030) of articles received at least five. The highest number of publications occurred in 2019, after which the number of publications decreased, but has remained at a similar level throughout the period studied.
During the 5-year period that was surveyed in the current study, the number of papers per year that received more than 10, 25, 50, 100, and 200 citations each was the highest in 2018. The number of papers in these categories dropped in subsequent years, which may be due to the time delay between a publication and accumulation of many citations from future papers, especially for publications in 2021 and 2022.
3.2. The Most Productive and Influential Authors
The top authors with publications in EM are analyzed here. It should be noted some authors may have more than one affiliation, and some authors may change their affiliations several times or change their name. Thus, providing a unique affiliation for authors was not feasible. Some authors also use different formats for writing their names in different studies. Similarly, two or more different authors may have similar names and affiliations. There is no concrete automated way of distinguishing such authors. Recently, WoS started to assign a researcher ID to publications so that they are attributed to the correct author(s) reliably and regardless of affiliation or name at the time of writing. However, the researcher ID has not been provided for all authors of the WoS records, so it cannot be used in the current study.
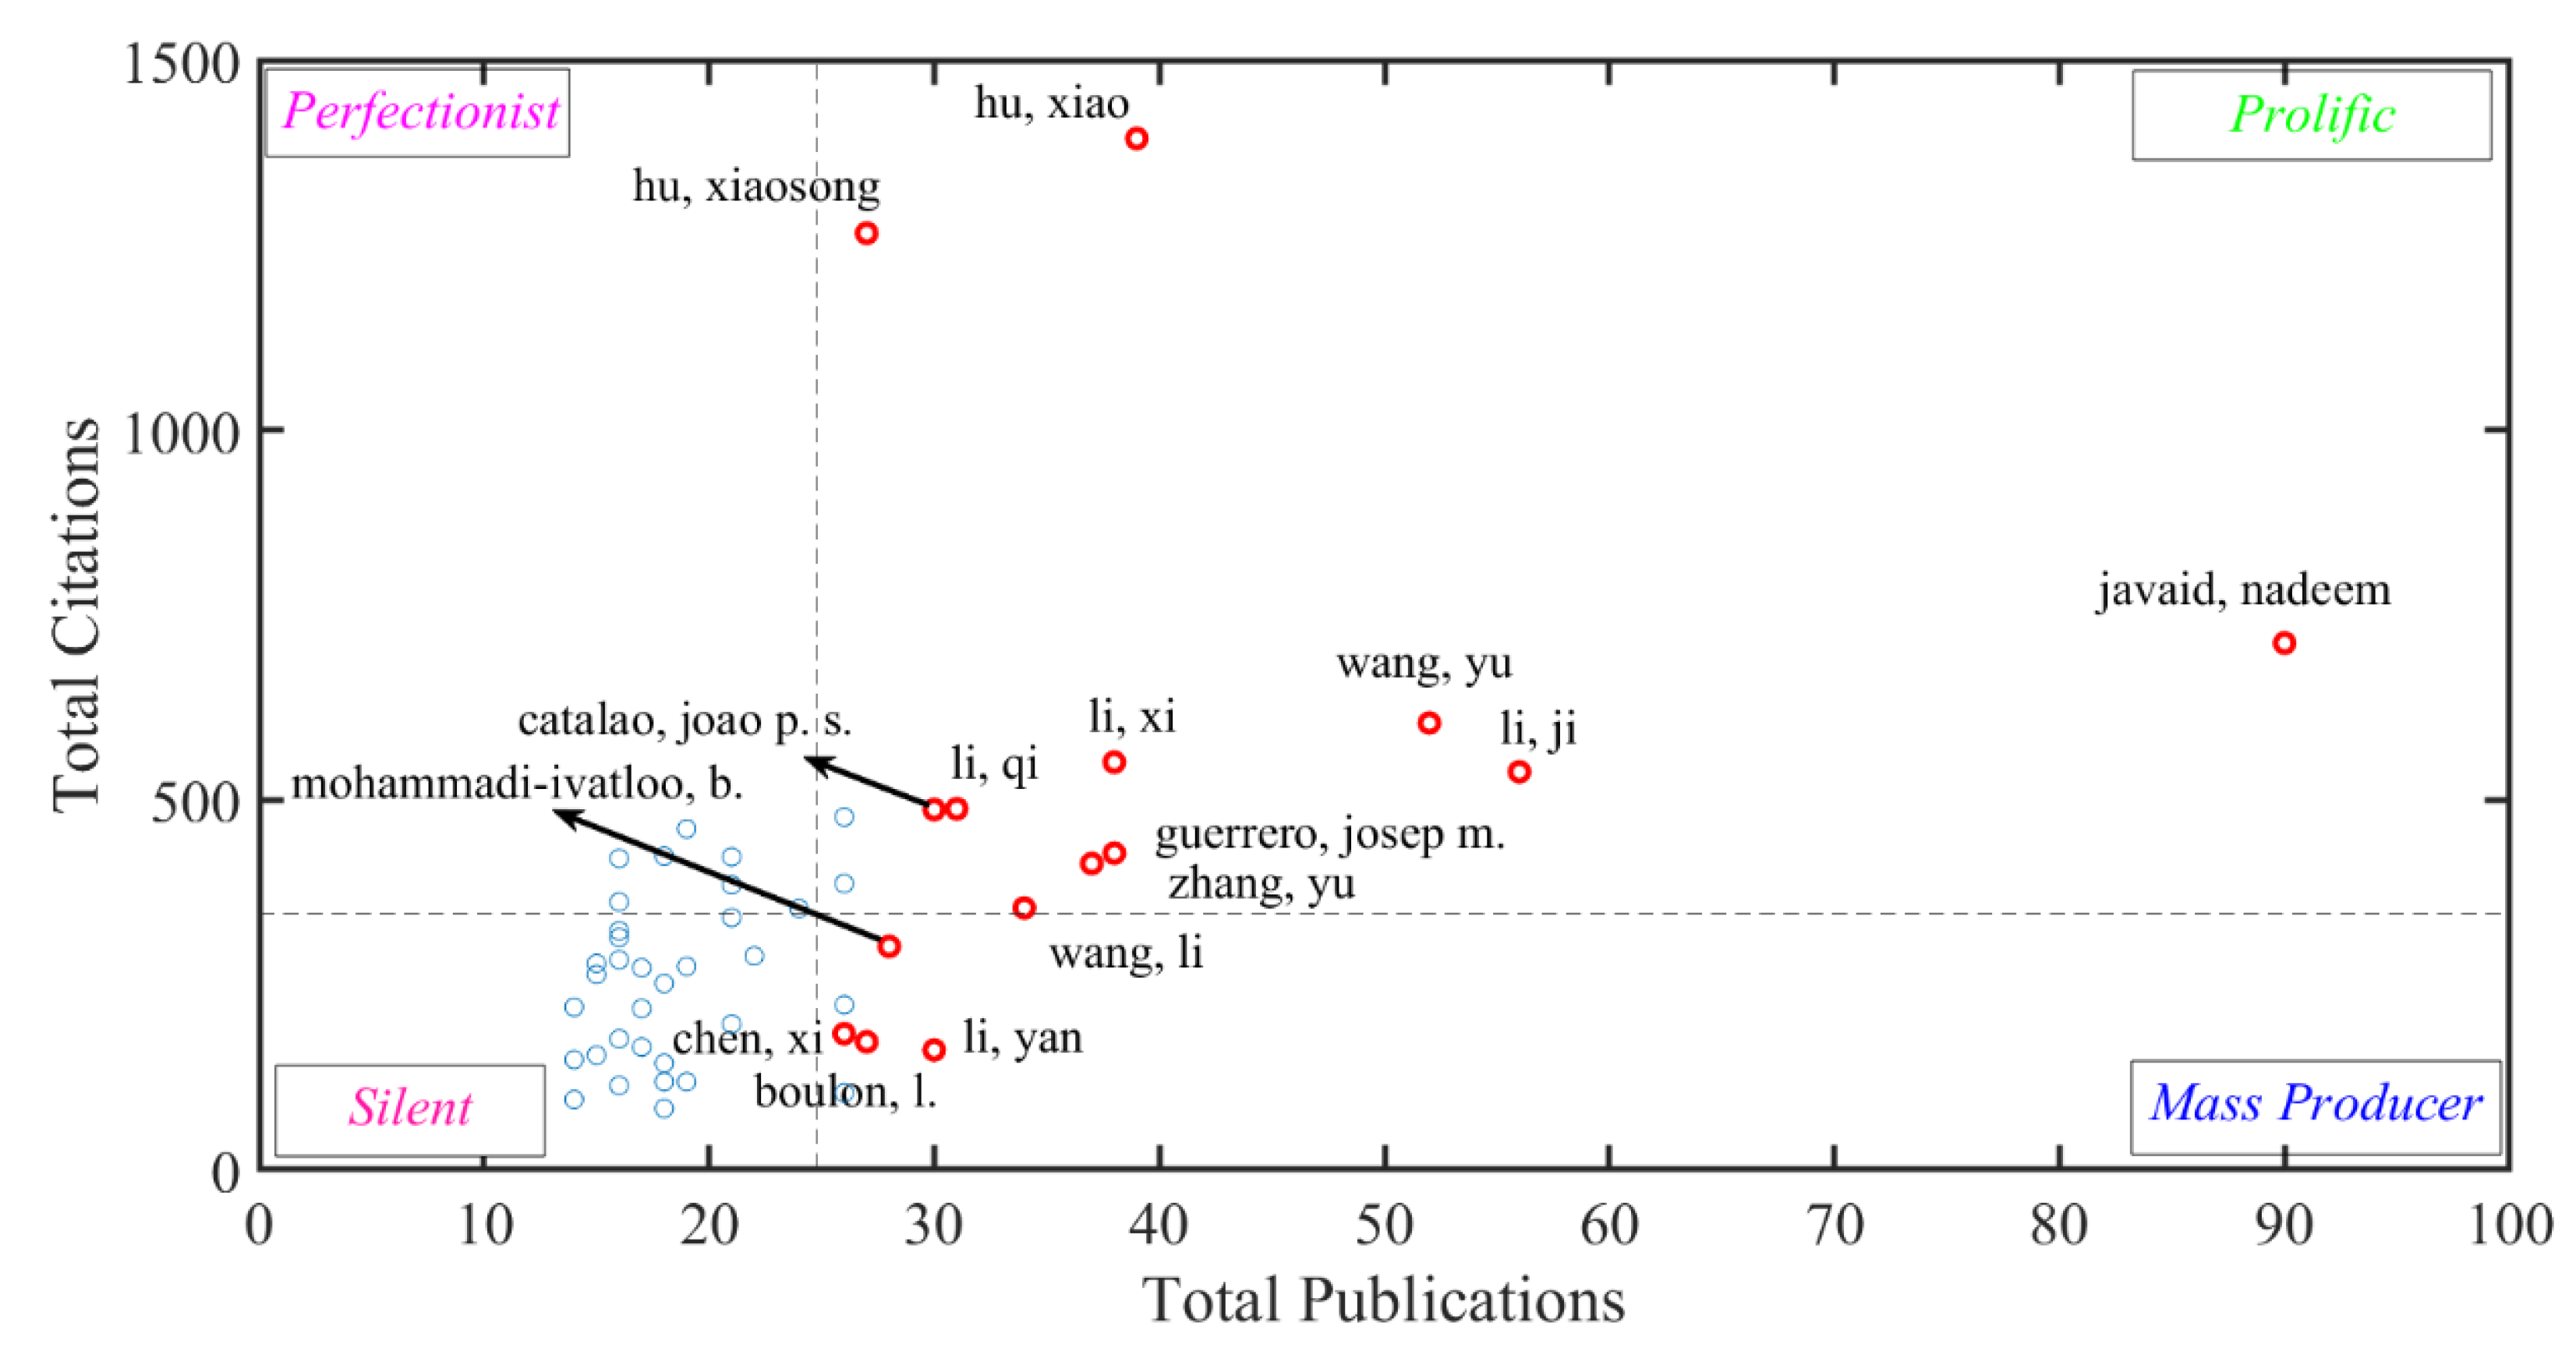
Table 2 lists the top 40 authors who are sorted according to TP. Nadeem Javaid, with 90 publications, is at the top of the list. This author published 60% more additional articles than the next author on the list. After Nadeem, there are six authors with 35 or more papers: Ji Li (56 articles); Yu Wang (52); Xiao Hu (39); Josep M. Guerrero. (38); Xi Li (38); and Yu Zhang (37). All of the authors on this list have published 16 or more papers. Xiao Hu is the most cited author in the field of EM with 39 papers and 1394 citations.
The second most cited author is Xiaosong Hu, with 1266 and the third is Javaid Nadeem with 712 citations. Each of the first ten authors in
Table 2 received 350 citations or more.
The h-index (
h papers cited at least
h times, HI) of 21 out of 40 most prolific authors in EM is at least 10 (
Table 2). These h-indices are solely computed based on EM publications. The top h-indexes belong to Xiao Hu (20) and Xiaosong Hu (28).
Cole and Cole [
20] considered two criteria of
citations and
productivity and defined four categories for authors. Authors with many publications and citations were identified as
prolific. Authors with high TP but low TC were identified as
mass producers. Authors with low TP but high TC were identified as
perfectionists. Finally, authors with low TP and low TC were identified as
silent (
Figure 2). Mas-Tur et al. recently applied these classifications [
21]. Here, the dashed lines shows the mean values of TP and TC in this study.
Xiao Hu, Xiaosong Hu and Nadeem Javaid are placed firmly in the prolific zone based on TC. Although the first two are relatively close to the perfectionist, based on TP. Xiao Hu and Xiaosong Hu are in the prolific zones, these two authors are very close to the border of the perfectionist zone. In terms of quality (measured by the number of citations per publication), Xiaosong Hu is ranked first by receiving 1266 citations and publishing 27 papers (TC/TP = 46.9). In second place is Xiao Hu receiving 1394 citations for 39 papers (TC/TP = 35.7). There is a limited number of authors in the mass producer and perfectionists’ zone, and most of the authors are silent.
3.3. The Most Productive and Influential Universities
Table 3 reports a list of the top 40 universities sorted based on TP. Considering TP, the top five universities are: Islamic Azad University, Beijing Institute of Technology, Aalborg University, North China Electric Power University, and Tsinghua University. Beijing Institute of Technology has the highest number of citations (TC = 2061), followed by Chongqing University (1907), Islamic Azad University (1813) and Nanyang Technological University (1319). According to the h-index, the top four universities are: Beijing Institute of Technology (h = 28), Chongqing University (h = 23), Islamic Azad University (h = 22), and Tsinghua University (h = 22). The University of Waterloo (TC/TP = 22), Chongqing University (TC/TP = 21.9), and Nanyang Technological University (TC/TP = 21.6) have the highest average quality.
Considering these indicators together, no university is clearly superior. In terms of total citations, the top three universities show intense competition: the first-rank university (Beijing Institute of Technology) has a number of citations that is only 14 percent higher than that of the third-rank university (Islamic Azad University). However, the latter has 37% more citations than the fourth rank university (Nanyang University of Technology).
Islamic Azad University, Beijing Institute of Technology, and Aalborg University are amongst the top five universities in terms of three different metrics (TP, TC, and h-index). According to
Table 3, Chongqing University has achieved an excellent performance in terms of two indicators, TC and h-index, but is ranked seventh in terms of TP (87), this university is ranked second in terms of TC and HI after the Beijing Institute of Technology and is ranked second rank in terms of TC/TP.
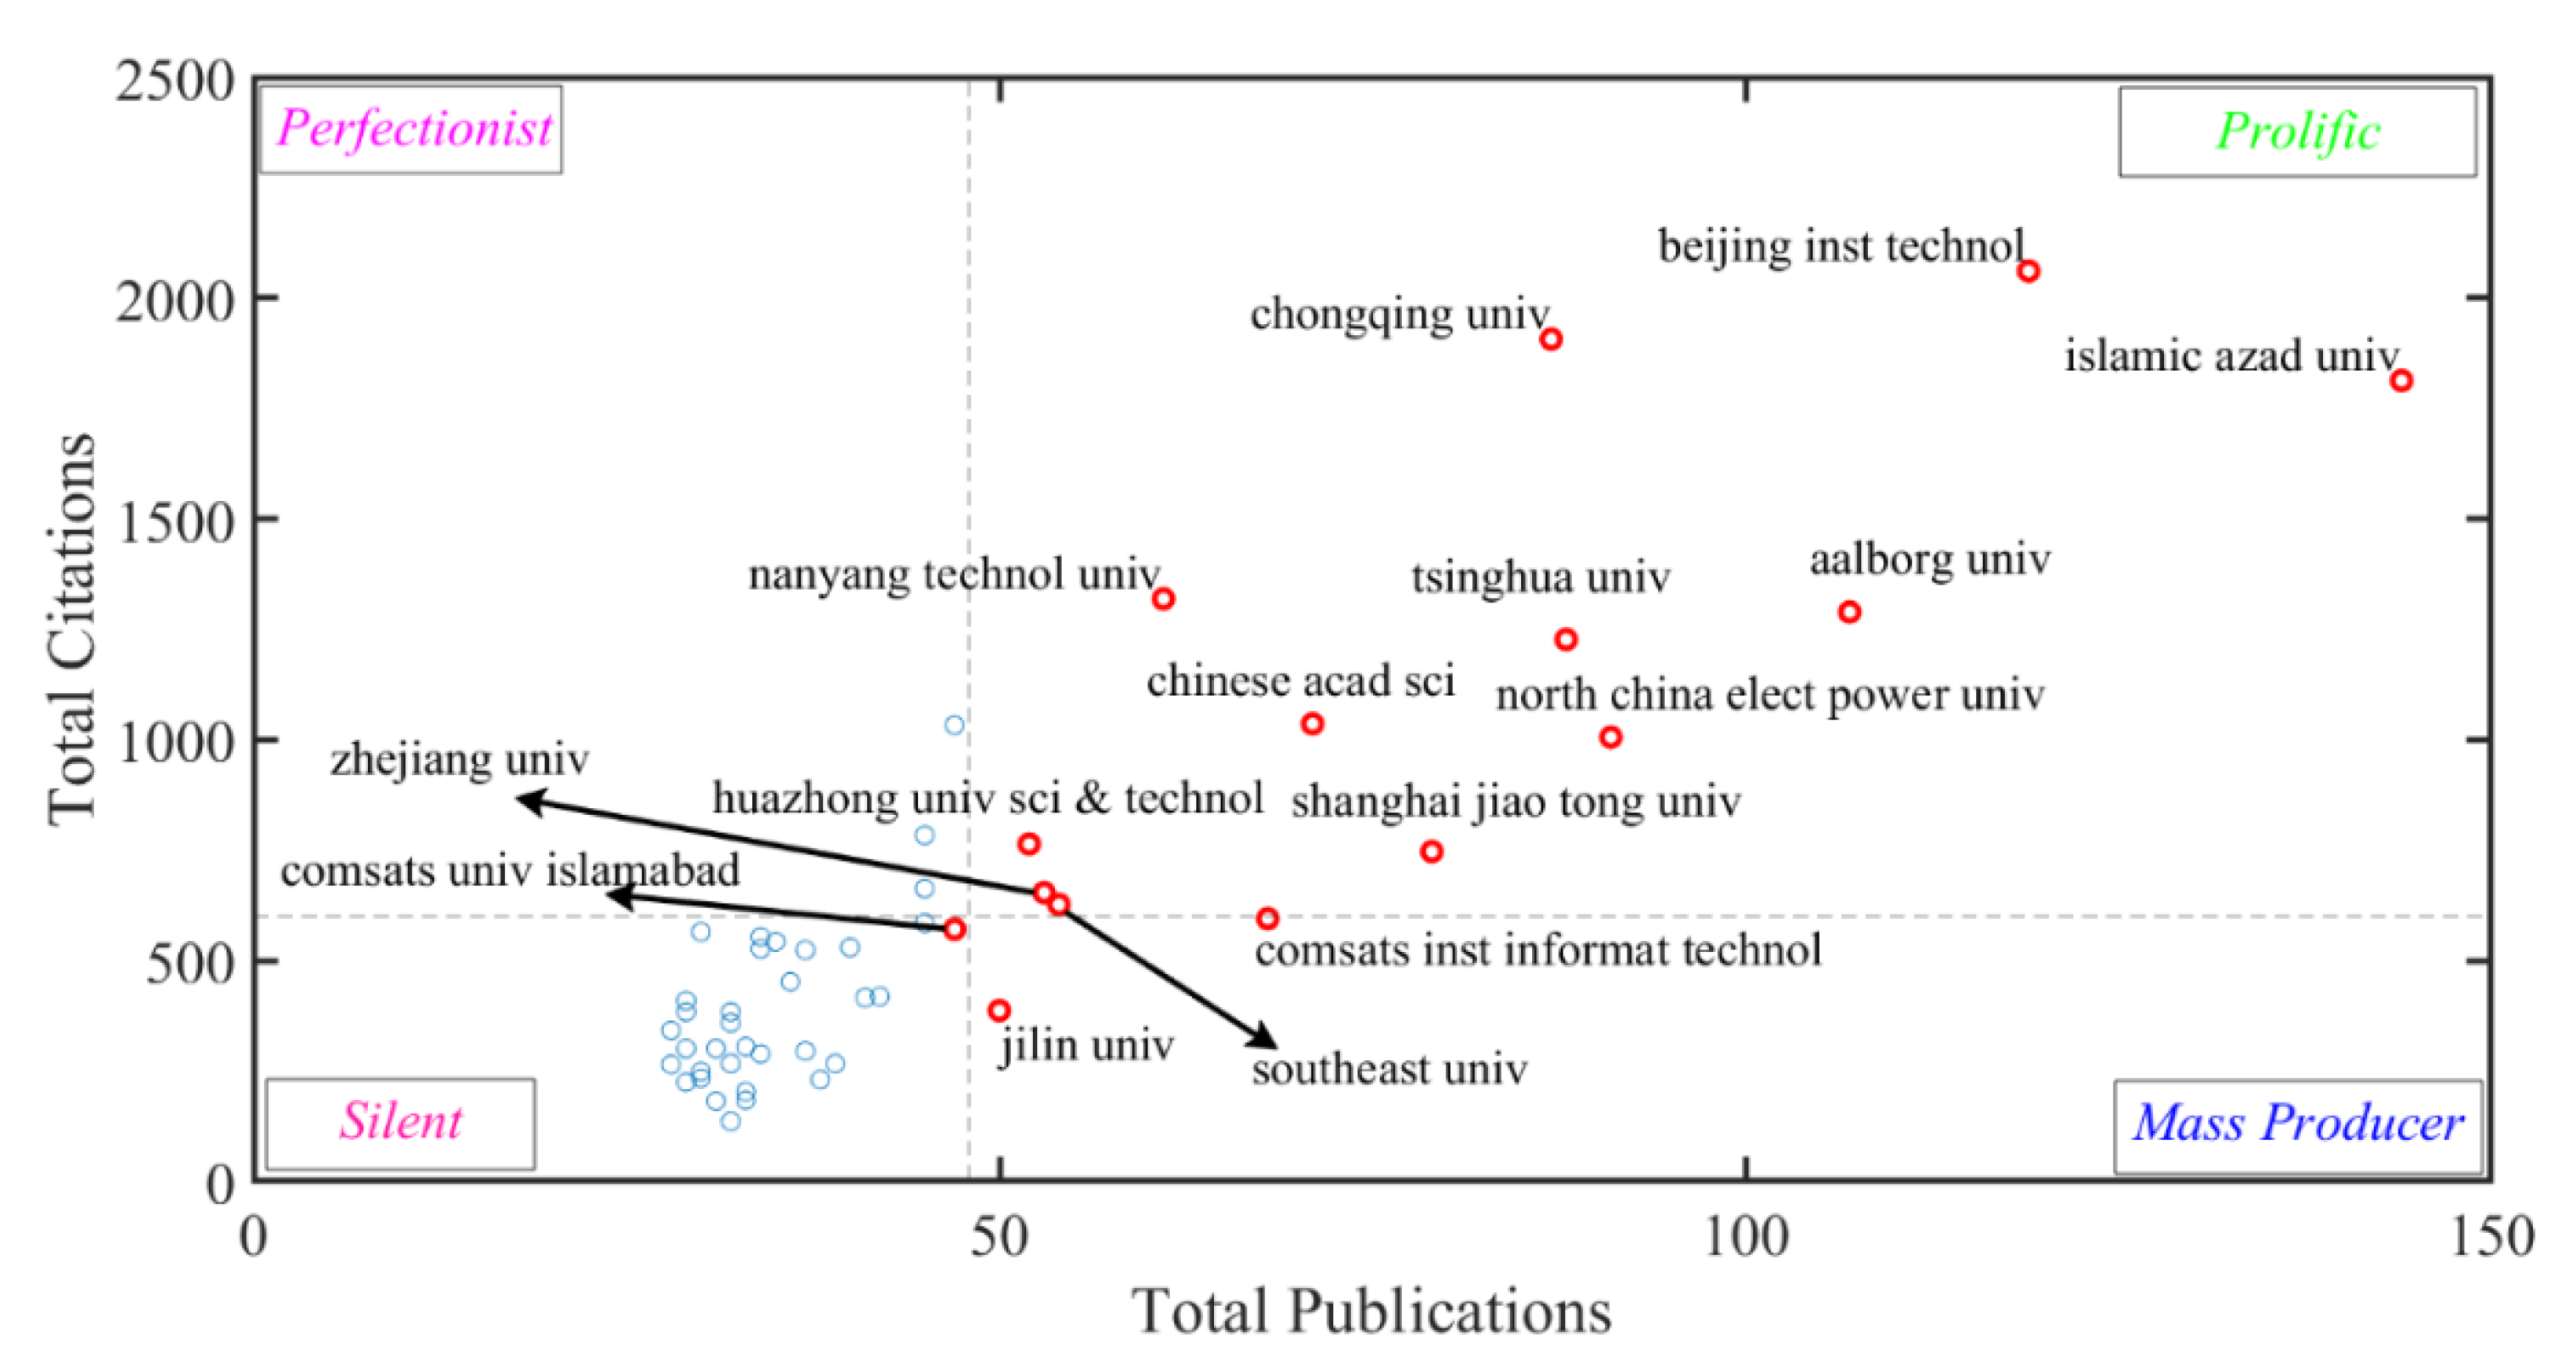
Figure 3 illustrates a map of TC-TP for universities. There seems to be a direct relationship between TP and TC.
Figure 3 shows that many of the universities are in the silent zone. Most of the universities placed at the top of
Table 3 appear in the prolific zone. Jilin University and COMSATS University Islamabad are close to being classified as mass producers. Almost no university from the top of
Table 3 is located in the perfectionist zone, indicating that TC is heavily dependent on TP, i.e., no university achieved high TC with low TP.
3.4. The Most Productive and Influential Countries
Table 4 reports a list of top countries sorted by TP, limited to the top 40. Each country’s population and research and development (R&D) investment is also reported for the sake of normalization. Regarding TP, China leads the ranking, followed by the USA, India, Iran, and England. In terms of total citations and h-index, these countries, except India, are in the top 5 countries in
Table 4. According to
Table 4, China and the United States are first and second in terms of three indicators: TP, TC, and HI. In terms of total publications and total citations, China leads the ranking, and it is almost twice as large as the United States (second rank) in terms of TP and TC. Pakistan also has the highest TP/R&D
. Denmark, Singapore, Finland, and Portugal have the highest publication per million population (TP/POP).
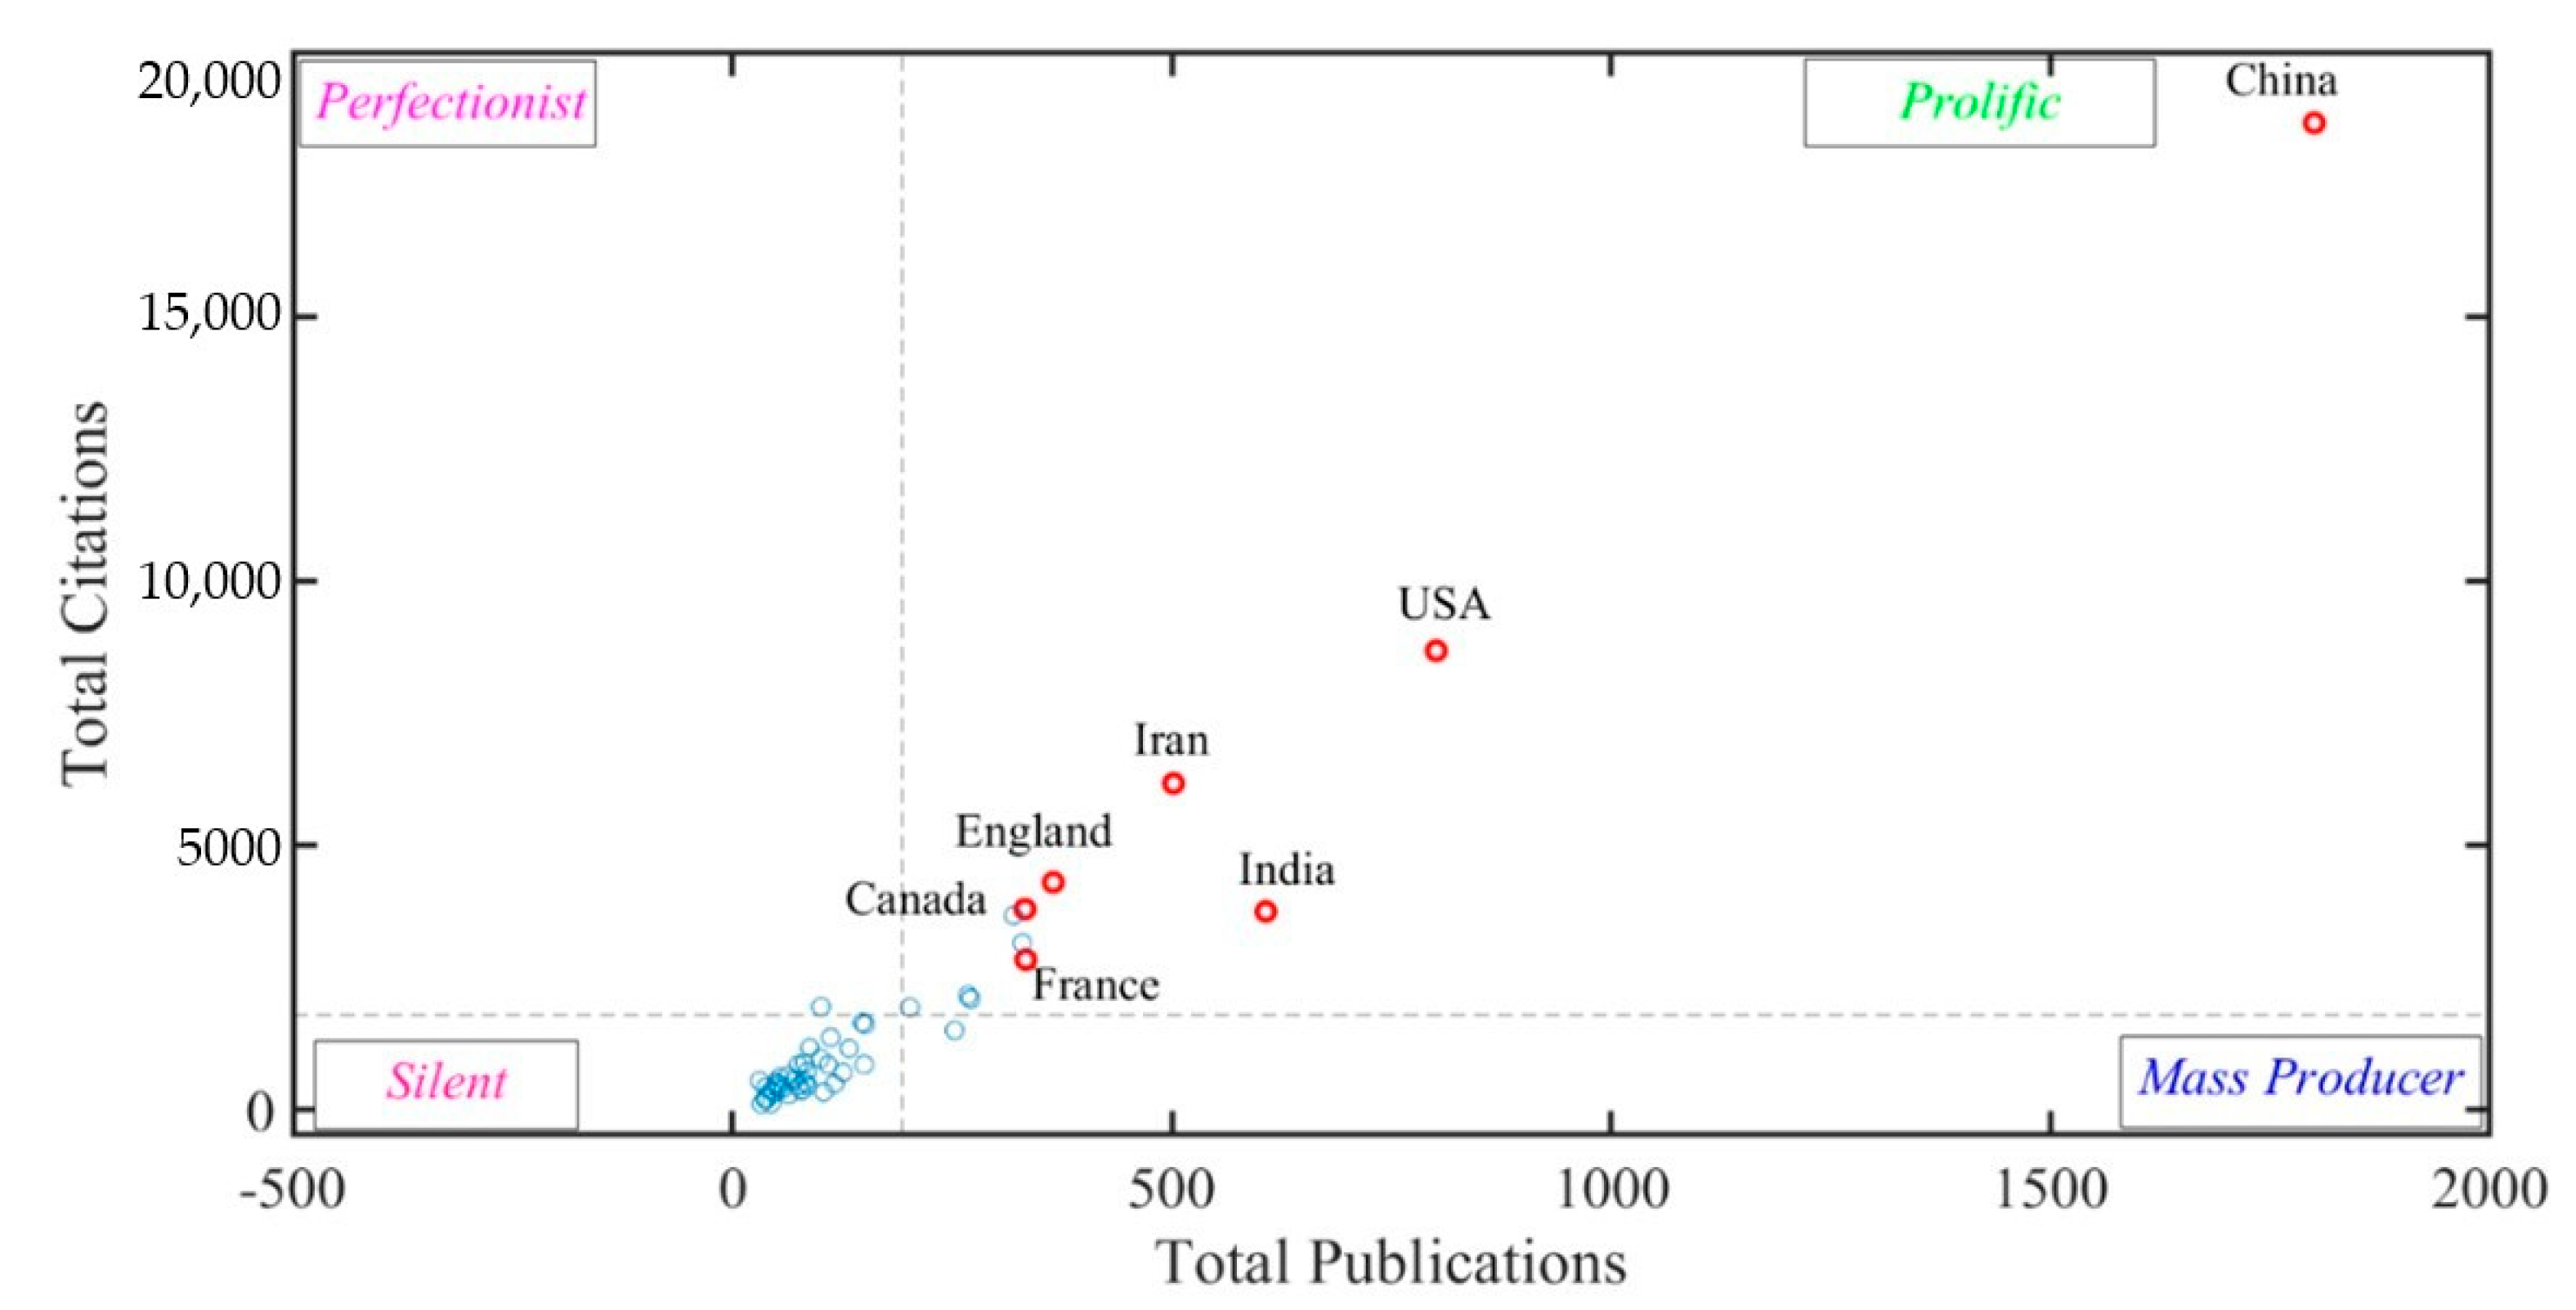
Figure 4 illustrates a map of TP-TC for the top countries. This figure shows that many of the countries are in the silent zone. There are few countries in the Prolific zone. This figure also shows a strong direct relationship between TP and TC for each country in the prolific zone, except India. Although India does not follow the trend of the results, it received a fair number of TC.
3.5. Distribution of Authors, Institutions, and Countries
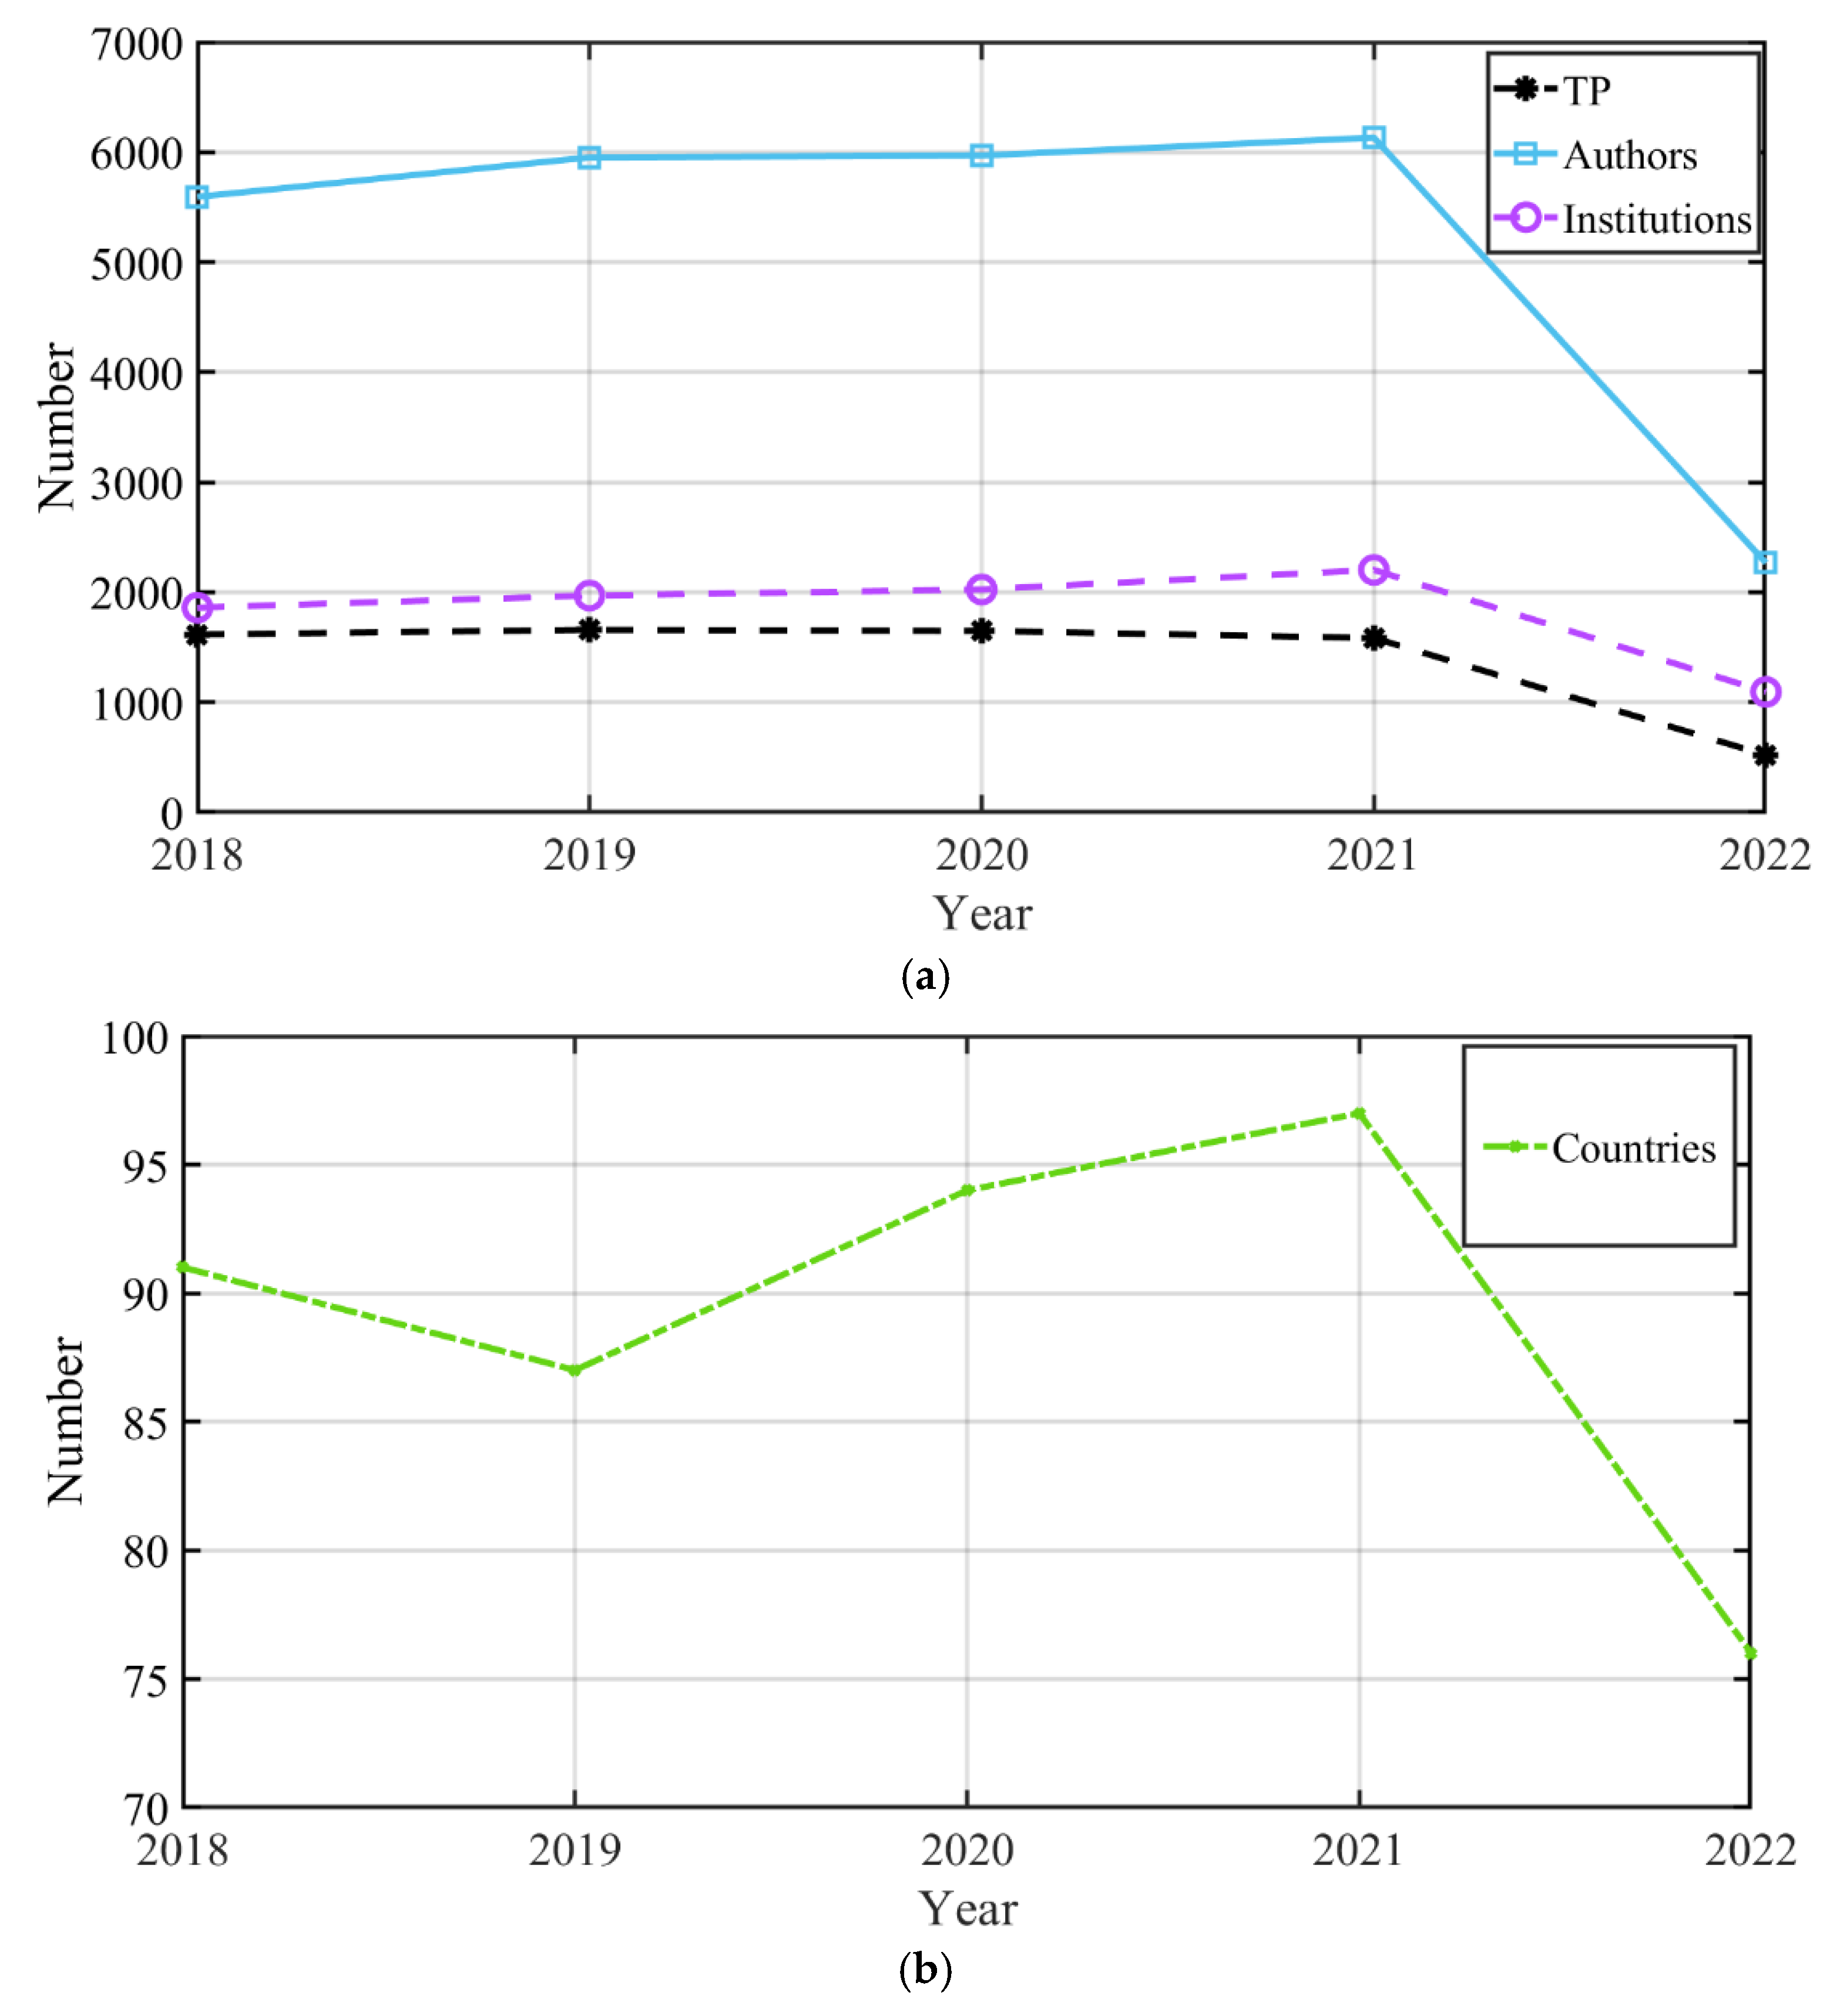
Table 5 and
Figure 5 show the distribution trend of countries, institutions, and authors over the past five years. There is only a slight difference in the number of articles published between 2018 and 2021.
Table 5 shows that the trend in the number of institutions and authors has experienced an upward trend from 2018 to 2021. The number of publications, countries, and institutions shows a drop in 2022, since the data are incomplete for that year (the current year at the time of writing).
4. Network Visualization
The dynamic maps of connections in network visualization were plotted for the author’s co-citation, co-authorship, and authors’ bibliographic coupling, organizations, and countries.
4.1. Author’s Co-Citation
Co-citation occurs when two documents receive a citation from the same third document [
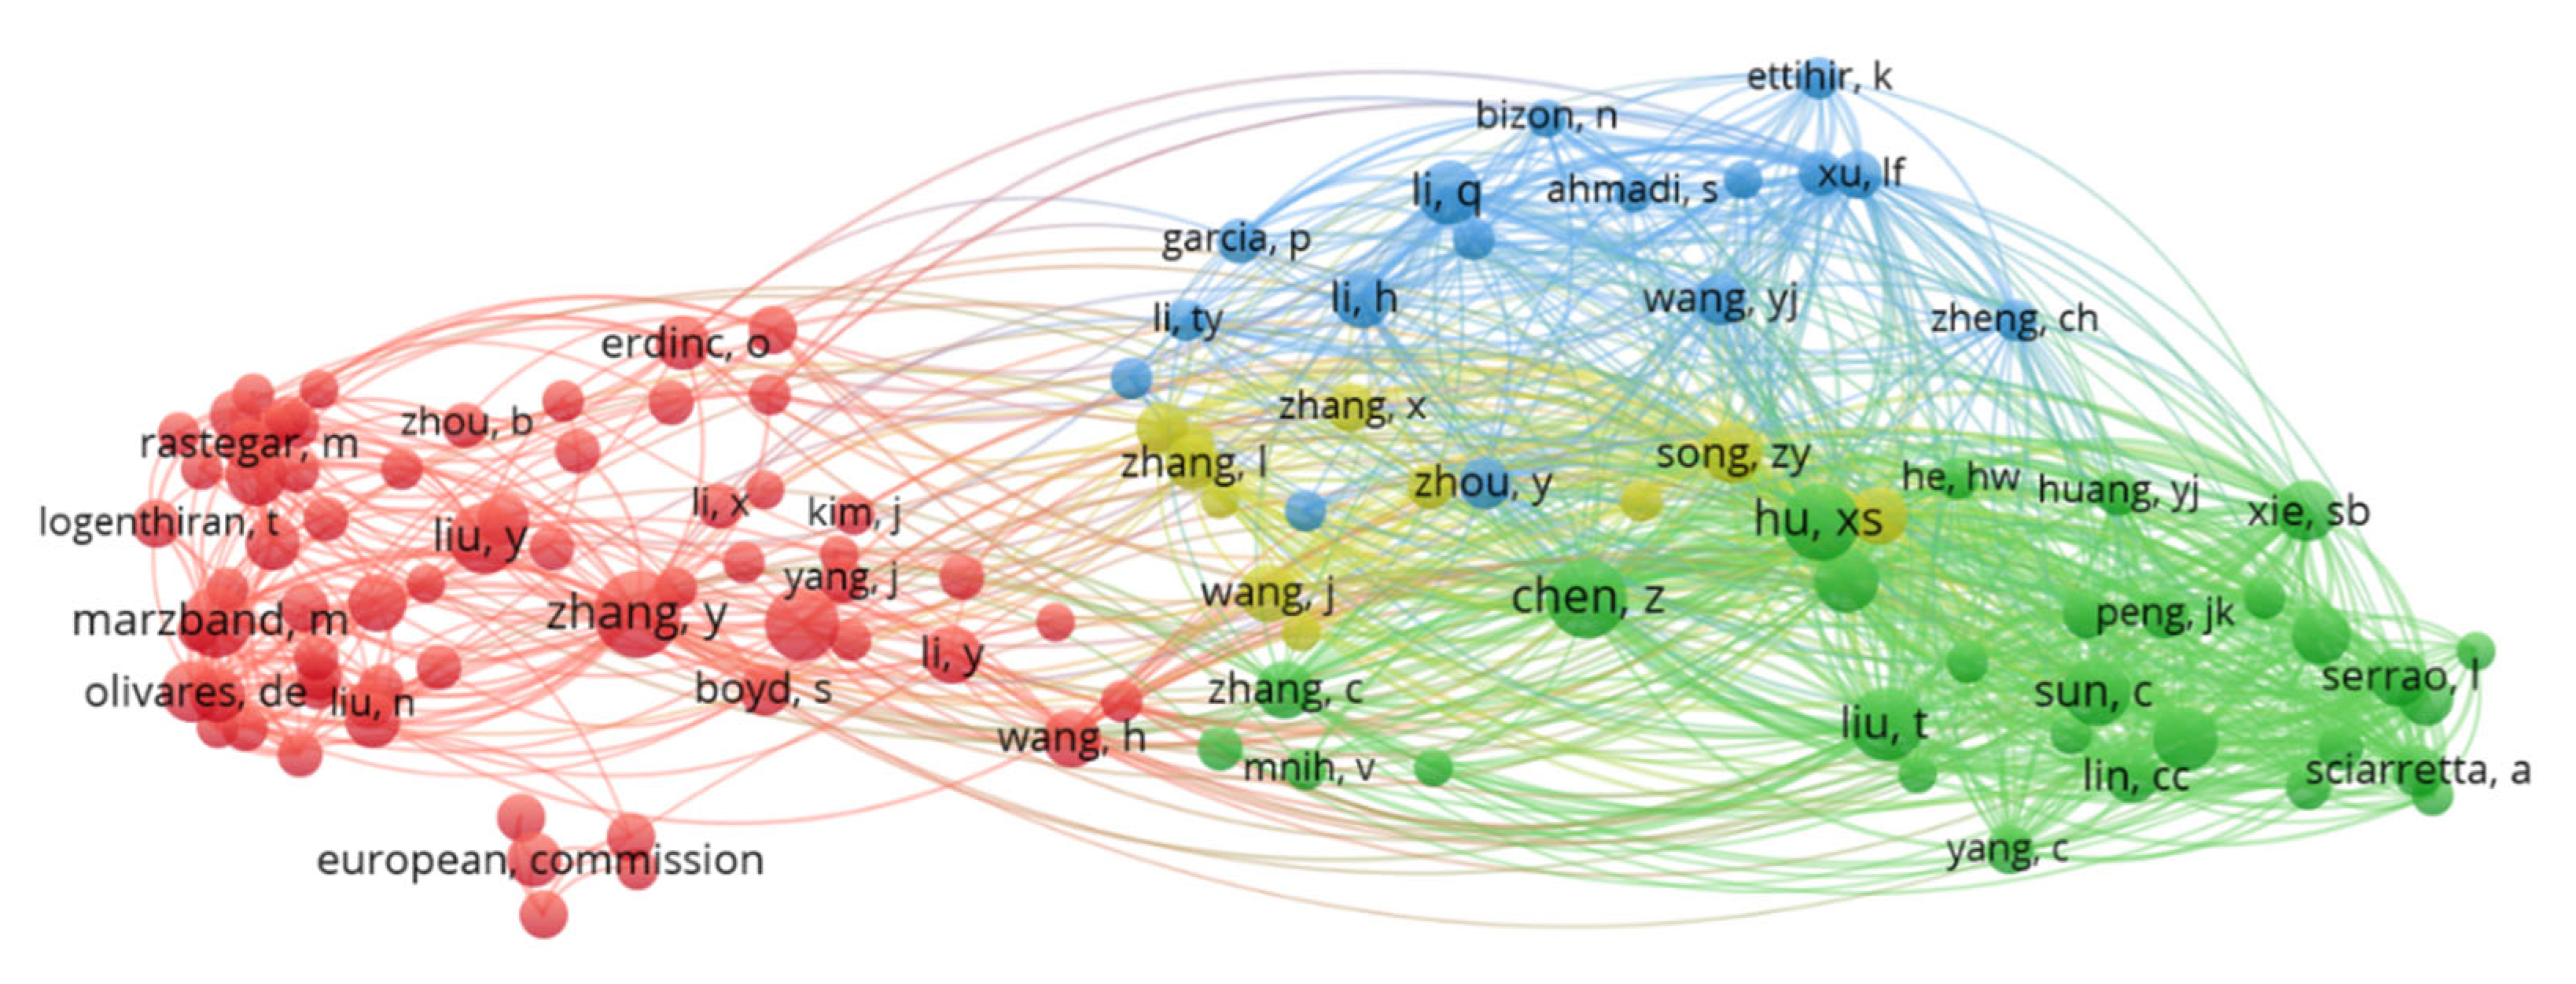
22]. Thus, the authors of cited articles are related, and, hence, they can be clustered in a co-citation map. A threshold of 100 EM citations was applied to filter the authors before analyzing the co-citation data for plots. There were 93,614 authors in the overall dataset, and applying this filter reduced the number of authors to 120. In the network visualization map, authors are indicated by circles, while the lines between the circles denote the co-citation relationships (
Figure 6). The distance between two authors on the map approximately indicates the relatedness of the two authors in terms of co-citations [
23]. The total overall strength of links for each author determines the size of the circle and the author’s name.
Figure 6 illustrates four clusters. A first cluster (red), with 64 authors, is anchored by authors Sb Xie and Y Zhang, with total link strength of 3193 and 2527, respectively. The second cluster (green), with 29 authors, is anchored by authors Xs Hu and Z Chen. The second cluster contains the top four researchers in terms of total link strength. Xs Hu had the highest total link strength in the second cluster with a link strength of 4522, followed by Z Chen (4105), T Liu (3755), and C Sun (3336). The third cluster (blue), with 16 authors, is anchored by authors Q Li with total link strength (2384) and Lf Xu (2007).
The fourth cluster (yellow), with 11 authors, is anchored by authors R Xiong and Zy Song with total link strength of 2694 and 2635, respectively. Among the top ten authors with the highest total link strength, there are six authors from the second cluster (green). This means that 60% top ten authors’ highest total link strength belongs to the second cluster in EM. According to
Figure 6, the connections between the first cluster (red) and the second cluster (green) are fragile. The fourth cluster (yellow) is located in the middle of the map and has a good relationship with all clusters.
4.2. Co-Authorships
Co-authorship is one of the most tangible forms of research association. A co-authorship network is a way in which the authors are linked to each other through joint participation in one or more publications either directly or via third parties. The VOSviewer software was utilized to plot the network visualization maps of co-authorship for a group of authors (
Figure 7). Authors with TC ≥ 100 and TP ≥ 10 (52 authors) were selected for the co-authorship visualization map. The size of the text and circles shows the overall co-authorship link strength of an author, while the line thickness denotes the connection strength between authors. The authors with the strongest relationships are clustered together and illustrated by a color.
In
Figure 7, the authors are divided into 21 zones. Many zones include only one researcher. A large group of seven authors can be identified in a research network (the zone illustrated in red). These groups of authors are termed clusters. This means they work together in the same area and combine their publishing efforts. No Author in the red cluster dominates the others because their total link strengths are approximately the same. Freed Blaabjerg was the connection point between the res and the blue clusters.
The purple cluster is dominated by Javaid Nadeem, Javaid, who is the best connected author in this study (40 total links to other authors in this network).
Javaid Nadeem is the most productive author and established uniform links with other members of the cluster in which he is represented. However, there is no link between the cluster centered on him and any other clusters. This indicates that Javaid Nadeem and other members of that cluster are isolated from the community in terms of co-authorship.
4.3. Bibliographic Coupling of Authors, Institutions, and Countries
A bibliographic coupling occurs in cases where two articles cite the same third article. As explained by Martyn [
24], “two papers that share one reference contain one unit of coupling, and the value of a relationship between two papers having one or more references in common is stated as being of strength one, two, etc., depending on the number of shared references”. Bibliographic coupling utilizes citations to explain the similarities between two items. In the case of authors’ bibliographic coupling, two articles citing the third article are closely linked, and they should be denoted by similar colors and placed in a cluster. A bibliographic coupling strength was evaluated by the total citations or references of the other third documents they share.
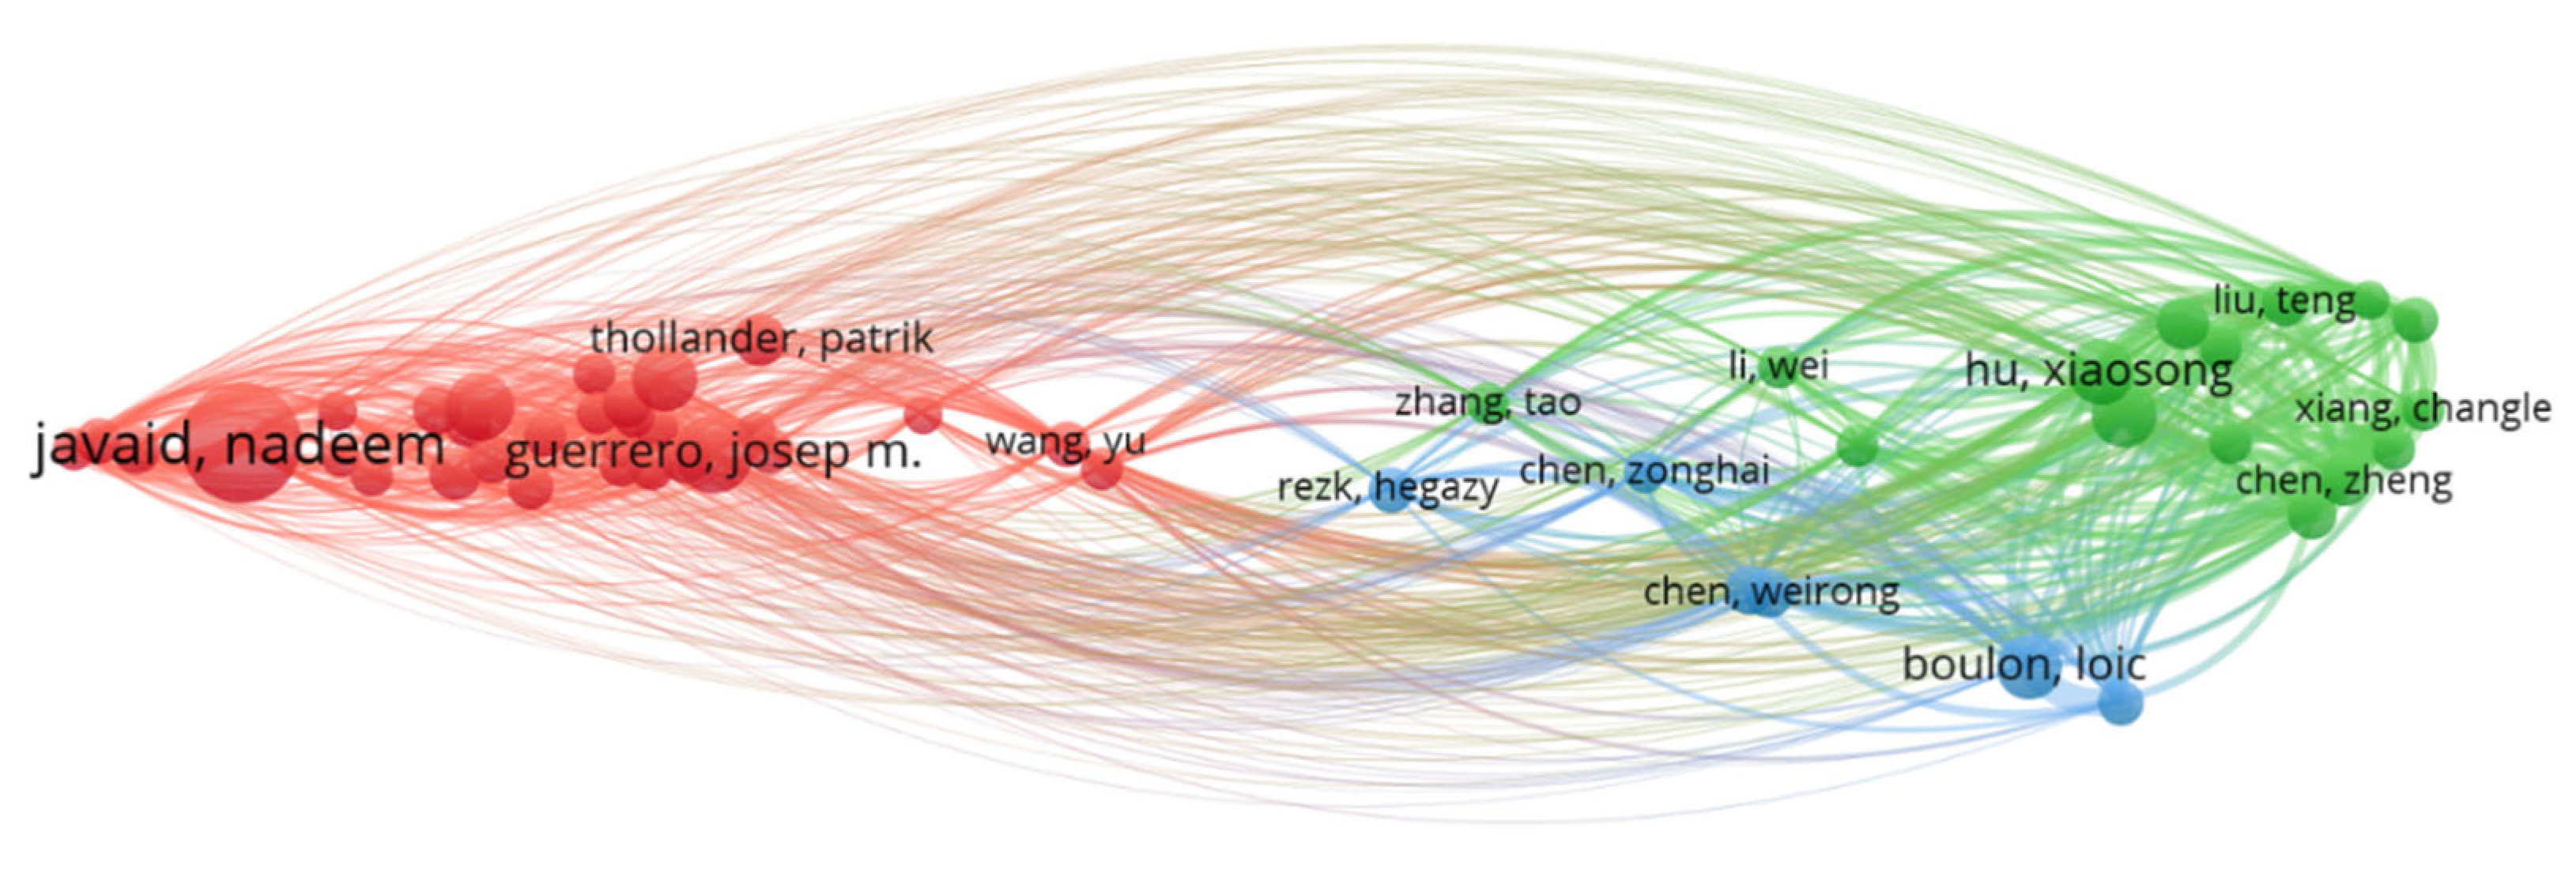
Figure 8 illustrates the map of the authors’ bibliographic coupling map. The authors with TC ≥ 100 and TP ≥ 10 were selected (52) for the bibliographic coupling analysis. Distance between the nodes in the network is directly proportional to their subject relatedness. The thickness of the lines between the network nodes represents the bibliographic coupling strength between them.
Figure 8 shows three clusters, in red, green, and blue. The first cluster (red) consists of 31 researchers, the second cluster (green) consists of 15 researchers, and the third cluster (blue) cluster consists of 6 researchers. The most important authors in this metric were Xiaosong Hu from the second cluster, who was assessed to have the highest link total strength (9215), followed by Javaid Nadeem from the first cluster (8907). According to
Figure 8, it can be seen that the whole system is heterogeneous. This heterogeneity has led the red cluster to establish a strong bibliographic pair with itself and weaker integration with the other two clusters. The green cluster also establishes a strong internal bibliographic pairing, but it is somewhat integrated with the blue cluster.
The institutions’ bibliographic coupling happens when articles affiliated to two institutions cite a publication of a third institution.
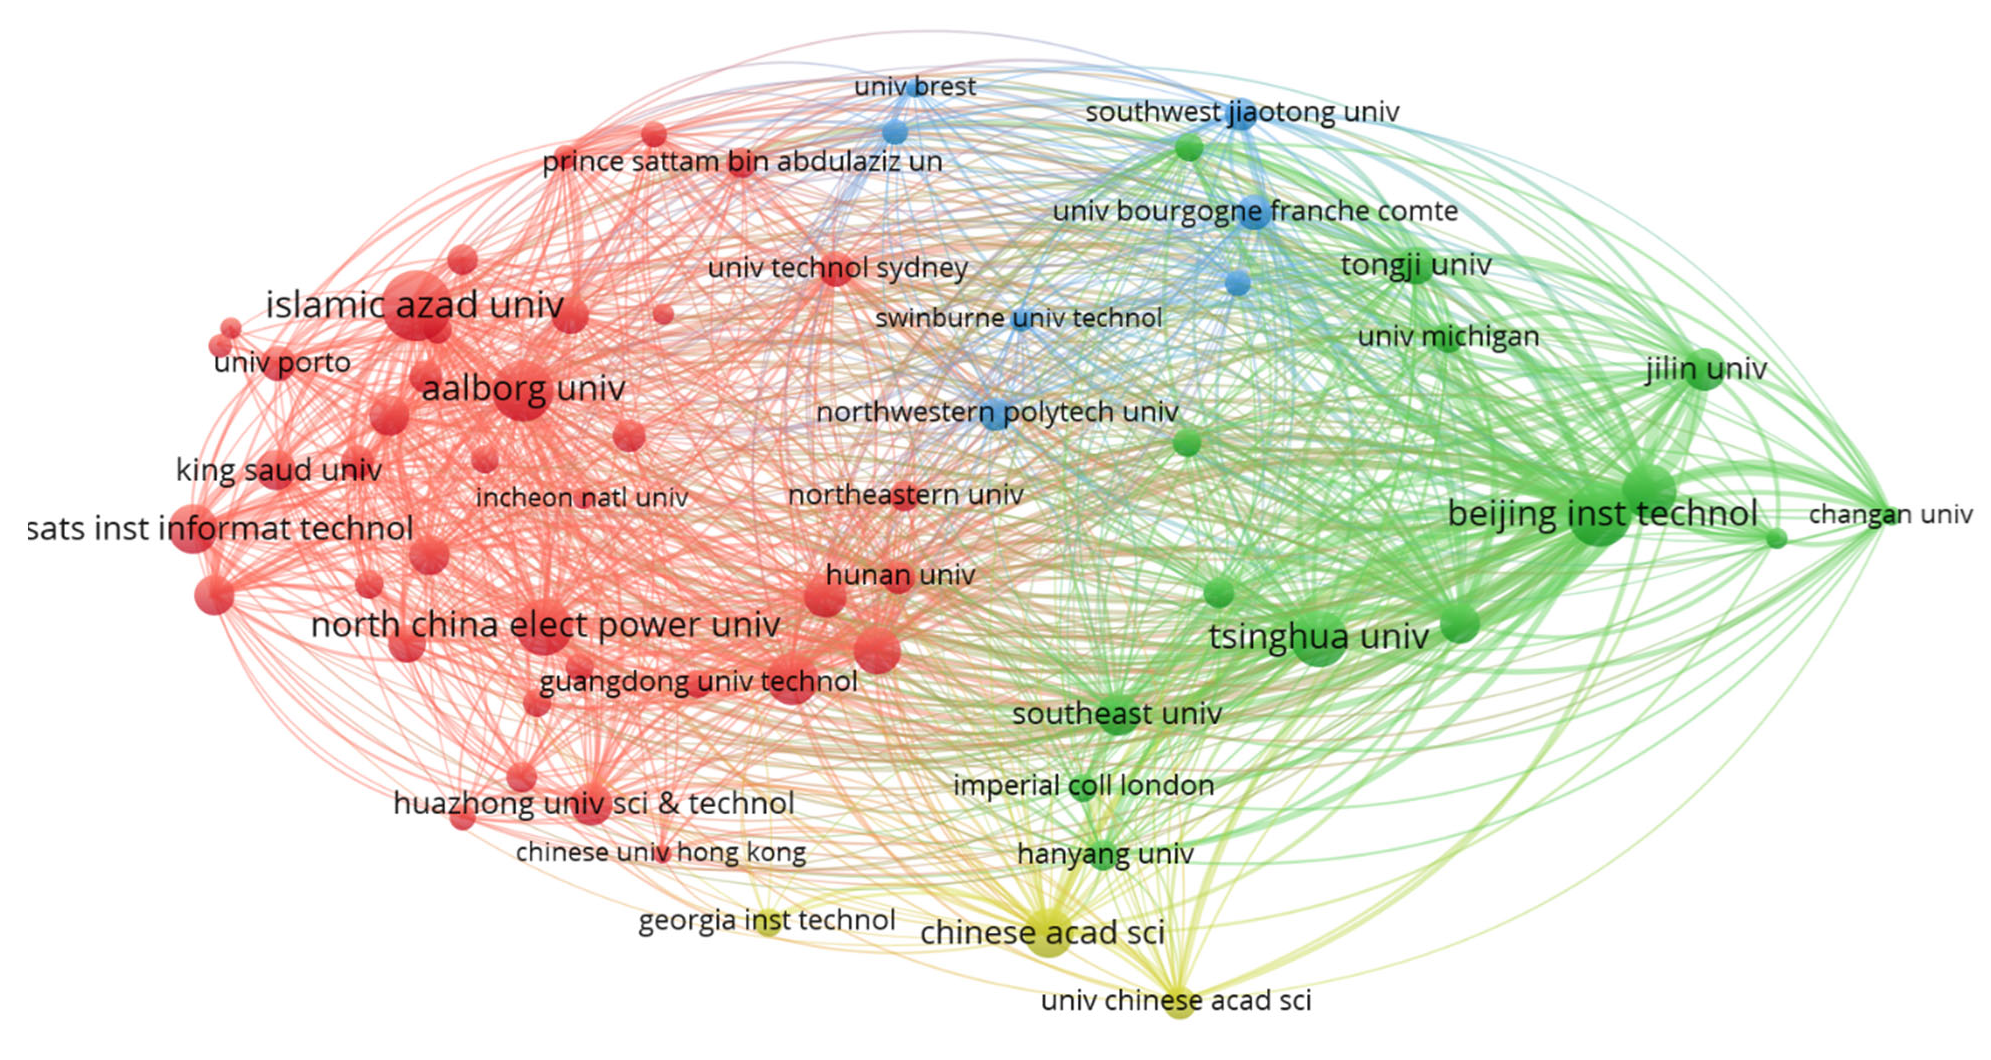
Figure 9 depicts the map of institutions’ coupling for institutions with TC ≥ 300 and TP ≥ 10 (63). There are four clusters (
Figure 9): The red cluster with 38 institutions, the green cluster with 15 institutions, the blue cluster with seven institutions, and the yellow cluster with three institutions.
Table 6 lists the papers, citations, and total link strength of the top ten institutions. Beijing Institute of Technology from China received the highest link strength (52,584), followed by Chongqing University from China (163,925), Tsinghua University from China (21,322), and University Waterloo from Canada (20,335), and Jilin university from China, which received 20,251 total link strength. Four of the top five of universities in terms of bibliographic coupling in EM belong to China, as are two of the next top five (to make a total of six of the top ten).
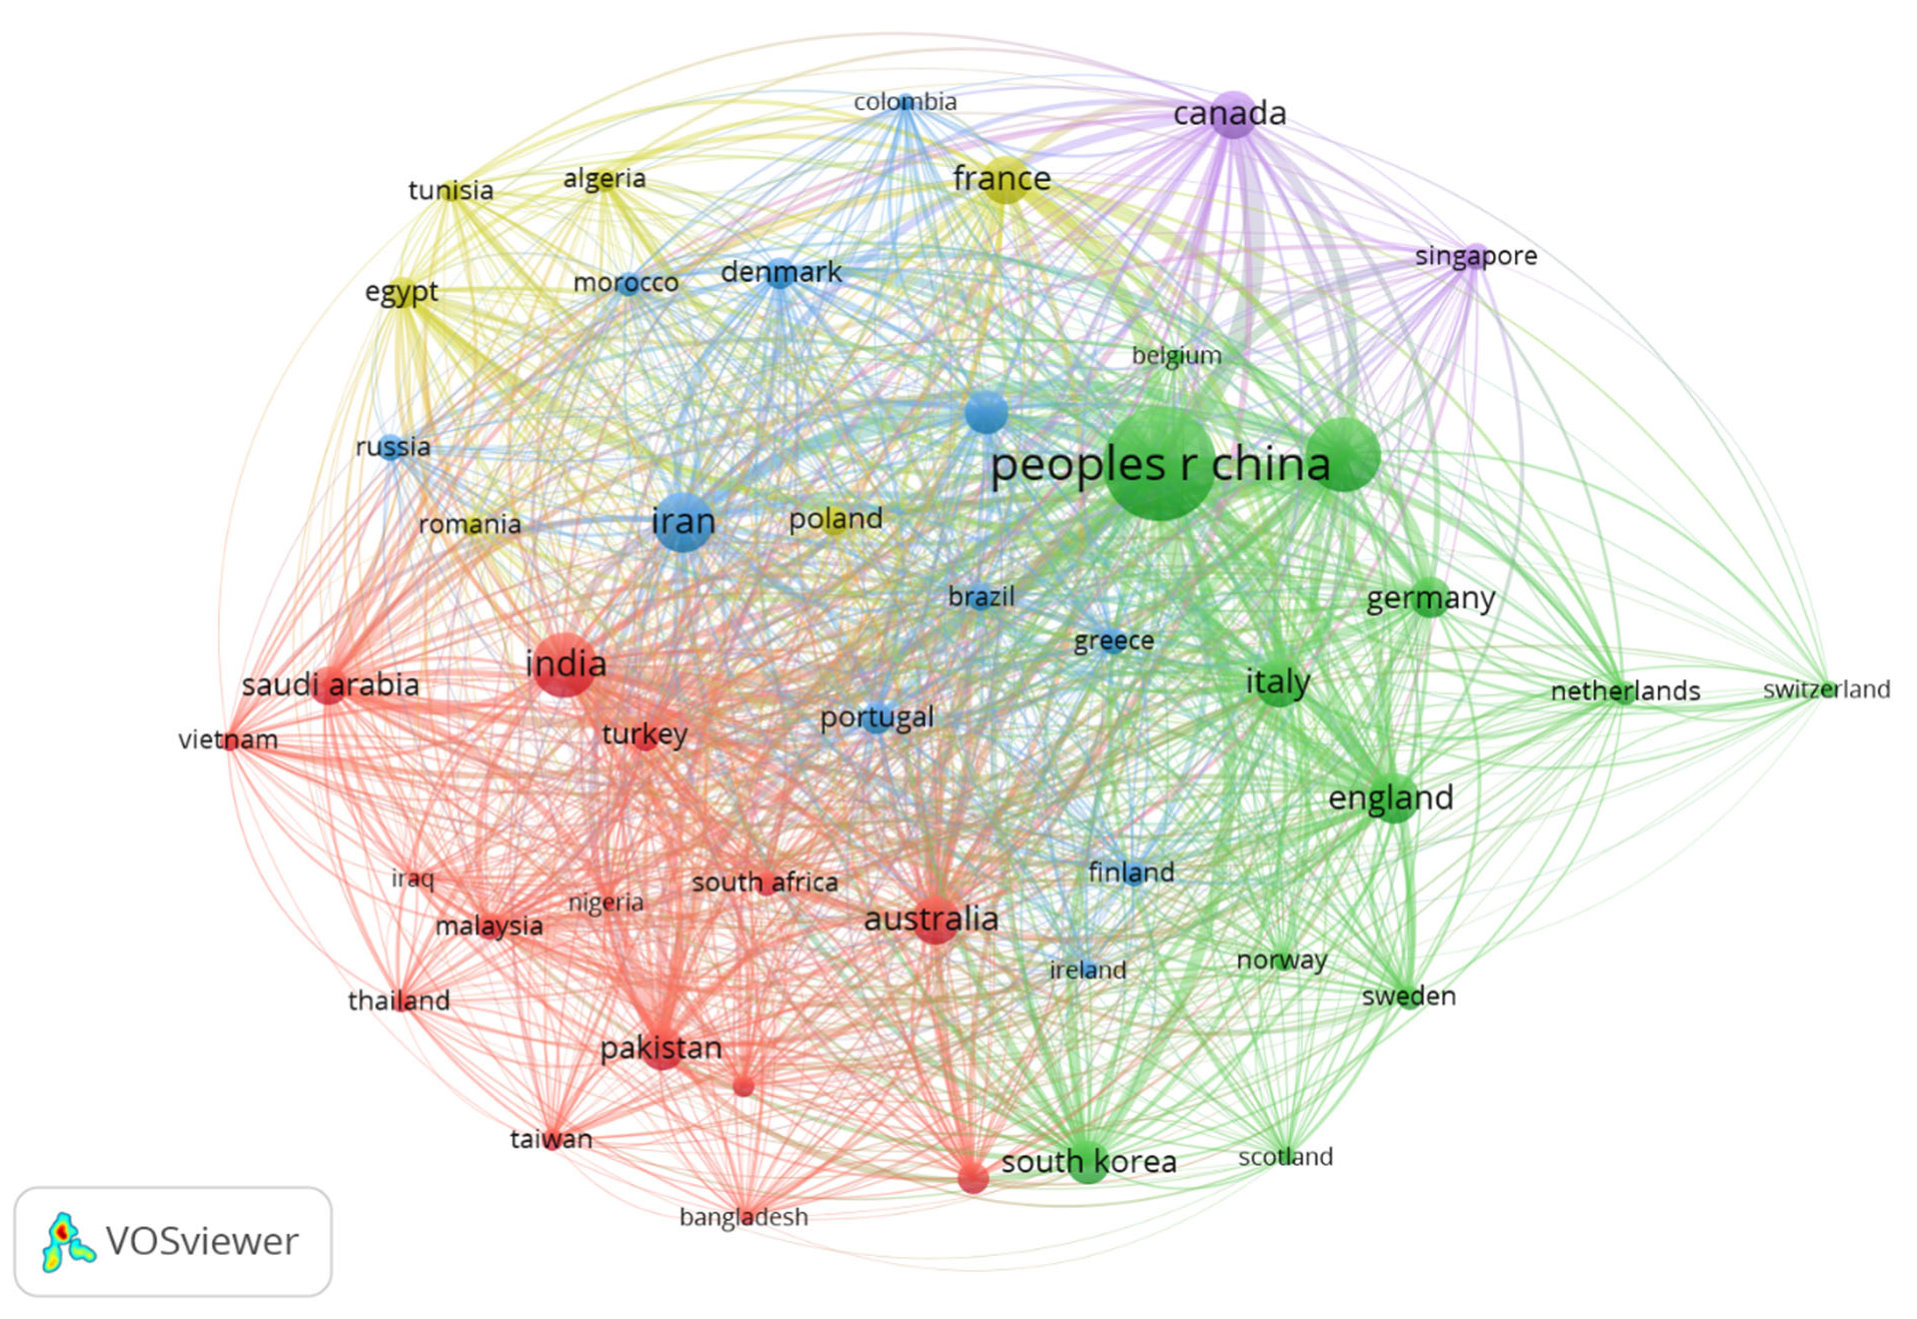
Figure 10 illustrates the bibliographic coupling for countries with TP ≥ 10 and TC ≥ 300 (126This reduced the total of 126 countries in the study to 46. In this map, countries are divided into five clusters. Cluster 1 (red), cluster 2 (green), cluster 3 (blue), cluster 4 (yellow), and cluster 5 (purple) consist of 15, 12, 11, 6, and 2 countries, respectively. The most important two countries (China and USA) with the highest total link strength in EM are in cluster 2 (green).
Table 7 reveals the papers, citations, and the total link strength of the top ten countries. China received the highest total link strength (517,865), followed by the USA (223,921), Iran (178,641), India (165,583), and Canada (165,476). In addition, China is almost twice as large as the next country (United States) in total link strength, publications, and citations.
The top 20 articles with the most citations published in EM are presented in
Table 8. The Web of Science category of each paper is also summarized in the table. As seen, most of the papers are in the categories of engineering and energy.
5. Conclusions
The recent publications on energy management (EM) were analyzed using a scientometric analysis approach. WoS bibliographic data for publications in the date range 2018–2022 were employed, and a dataset of papers related to EM and their citations and metadata details was created. The dataset was analyzed using a bespoke code, and visualization maps of connectivity were plotted using VOSviewer. After analyzing the data, the most influential individual authors, organizations, and countries were identified, and the dynamic network maps of connection between them were explained. Finally, the most cited articles in EM were identified and their WoS categories were reported. The major findings of this research can be summarized as follows:
Considering top authors, Javaid Nadeem published the most papers (90). Javaid Nadeem published 60% more articles in EM than the second-ranked author, Xiao Hu (1394). The top h-indexes belong to Xiao Hu (h = 20) and Xiaosong Hu (h = 18).
Islamic Azad University was the institution that published the most articles. Beijing Institute of Technology has the highest rank considering combined TC and h-index. In terms of citations per paper, the University of Waterloo (22), the Chongqing University (21.9), and Nanyang Technological University (21.6) are ranked highest. Authors affiliated with these universities have significantly influenced EM compared to other universities.
From the countries’ point of view, China and the United States are in the first and second rank in terms of TP, TC, and h-index, respectively. China is almost twice as large as the United States (second rank) in terms of TP and TC. Pakistan has the most TP relative to its R&D investment level.
In terms of the co-citation of authors, there were four clusters, each of which was anchored by a specific researcher. Among all the researchers surveyed, the most cited researcher, the most productive researcher. The most highly cited researcher, and the researcher with the highest citations per paper were in the green cluster. The connections between the red and the green clusters were poor. In addition, the yellow cluster is located in the middle of the map and has a good relationship with all the clusters.
The co-authorship network of authors and publishing in EM was examined in this study. Authors are divided into 21 clusters, and among all authors, Javaid Nadeem showed the highest total link strength. In addition, cluster 5, including Javaid Nadeem, Javaid, was isolated from the community regarding co-authorship. In addition, the bibliographic coupling of the authors revealed that the most influential author is Xiaosong Hu. The other important author was Javaid Nadeem.
Bibliographic coupling of institutions showed that Beijing Institute of Technology from China received the highest link strength, followed by Chongqing University (China), Tsinghua University (China), the University of Waterloo (Canada), and Jilin University (China).
Bibliographic coupling of countries revealed five clusters. China received the highest total link strength, followed by USA, Iran, India, and Canada. China established almost twice the link strength, TP, and TC compared to the United States (second rank). Moreover, China and USA are influential contributors to EM, and other countries were coupled through these countries.
There is not yet a good explanation for why researchers are badly connected to each other. It is conceivable that the broadness of the field contributes to this, as authors do not consider other authors that work on EM to be in the same part of the field and so do not feel it necessary to cite them or consider their work. Future studies could address this question and analyze what parts of the EM field are most active, or the most cited.
