Article

Effect of Freeze-Thaw on Mechanical Properties of Loess with Different Moisture Content in Yili, Xinjiang

1
College of Geology and Mining Engineering, Xinjiang University, Urumqi 830017, China
2
Xinjiang Key Laboratory for Geodynamic Processes and Metallogenic Prognosis of the Central Asian Orogenic Belt, Xinjiang University, Urumqi 830017, China
3
Collaborative Innovation Center of Green Mining and Ecological Restoration for Xinjiang Mineral Resources, Xinjiang University, Urumqi 830017, China
4
State Key Laboratory for Geomechanics and Deep Underground Engineering, China University of Mining and Technology, Xuzhou 221116, China
*
Author to whom correspondence should be addressed.
Sustainability 2022, 14(18), 11357; https://doi.org/10.3390/su141811357
Submission received: 27 July 2022 / Revised: 2 September 2022 / Accepted: 6 September 2022 / Published: 10 September 2022

Abstract

:
Various geological disasters such as collapses, landslides, and mudslides occur frequently in Yili, Xinjiang. The loess in this area provides a basis for the occurrence of landslides and other disasters. At the same time, Yili Valley is typically a seasonally frozen soil region. The freeze–thaw cycle is an essential disaster-inducing factor. However, scholars have lain a research emphasis on the material source of the Yili Loess, while lacking a systematic investigation of the degradation mechanism of the soil’s physical and mechanical properties under the freeze–thaw action. Therefore, it is prudent to investigate the changes in mechanical properties of loess in this region under the freeze–thaw cycle. In this study, focusing on a typical loess landslide in Yili, some in situ soil samples were collected to conduct related physical and mechanical tests. According to the maximum dry density and optimum moisture content of the loess in the region, four different groups of soil samples with varying moisture contents were prepared and subjected to different freeze–thaw cycles. The changes of apparent individual characteristics under freeze–thaw cycles were observed, and a consolidated undrained (CU) shear test was carried out to obtain the changes of shear strength indices of loess samples with varying moisture contents under freeze–thaw cycles. The results showed the obvious development of characteristics during freeze–thaw cycles, with the growth of many frost and ice crystals. At the freezing stage, the growth of ice crystals led to hexagonal peeling bodies on the surface layer. At the thawing stage, a rapidly melting network ice crystal pattern imposed a thermal thawing disturbance on the surface rock soil. After multiple freeze–thaw cycles, the soil’s peak strength dropped significantly and the internal friction angle changed slightly, but the cohesion was adversely affected, with frequent fluctuations. The present study enhances the research level of loess’s mechanical and strength properties under freeze–thaw cycles and provides a theoretical foundation for preventing loess landslides in this region.

1. Introduction

Yili valley is one of the 17 key prevention and control areas of geological disasters in China [1]. It is the key prevention and control area of landslide and debris flow in Yili, Xinjiang. The geological disasters in this area are distributed in a network. Landslides along the valley are connected with their derivative debris flow valleys. The trailing edge of the landslide basically has a linear distribution, which is roughly distributed near the winter snow line. The old and new landslide deposits on both sides of the valley are overlapping, which easily forms a dammed lake and then evolves into a dam-break debris flow, which poses a great threat to the lives and property of local residents. At the same time, Yili Valley is a typical seasonally frozen soil region. In seasonally frozen soil regions, the freeze–thaw cycle deteriorates the physical and mechanical properties of soil, which is instrumental in slope instability and failures of various types of foundations. Reza Mikaeil et al. [2] found that freezing was a destructive agent, and thus caused undesirable stone conditions, reduced quality, and efficiency. Sainan Zhu et al. [3] found that the landslide instability in Yili Valley was closely related to the freeze–thaw cycles of underground water.
The deterioration of physical and mechanical properties of rock and soil due to freeze–thaw cycles is mainly manifested in the influence of the freeze–thawing on the shear strength of rock and soil. In recent years, many scholars have studied this through triaxial testing and direct shear testing. Some scholars experimentally concluded that the soil’s shear strength and cohesion dropped exponentially with the increasing number of freeze–thaw cycles. However, the internal friction angle showed no variation nor clear patterns with the number of cycles [4,5]. At the same time, some scholars pointed out an increase or decrease of internal friction angle with the number of freeze–thaw cycles [6,7]. The damages to shear strength mainly occur in the early freeze–thaw cycles. At the early stage, an increasing number of freeze–thaw cycles has a relatively pronounced effect on soil’s shear strength; in particular, the shear strength decays significantly after the first freeze–thaw cycle. Generally, the change tends to stabilize after 3~7 freeze-thaw cycles. However, the critical number of freeze-thaw cycles differed in various studies [8,9,10,11]. In addition, some scholars pointed out that the stress–strain relation was irrelevant to freeze–thaw cycles and that the freeze–thaw action imposed almost no effect on the soil’s stress–strain curve pattern [12,13]. However, some scholars held different opinions and indicated the correlation of the stress–strain curve with the number of freeze–thaw cycles and moisture content [14,15,16].
In addition, many scholars have investigated the effects of various factors on the degradation mechanism of soil mechanic properties under a cyclic freeze–thaw action and have constantly tried to improve soil under freeze–thaw cycles [17,18]. The influence factors under investigation were of two types: environmental factors, which mainly included the number of freeze–thaw cycles, amplitude, and freeze–thaw temperature; and the soil’s physical indices, such as moisture content and density. Jian Xu et al. [19] concluded that the stability of a loess slope was closely related to the number of freeze–thaw cycles, freeze–thaw depth, moisture content, and slope gradient. Yao Wei et al. [20] performed a factorial experiment and found that the number of freeze–thaw cycles imposed the most significant effect on the unconfined compressive strength, followed by moisture content and the freezing temperature. Despite these differences in research results, they confirm that the above factors did affect soil’s physical and mechanical properties. Under freeze–thaw cycles, different moisture contents damaged the soil to varying degrees. Specifically, shear strength and cohesion dropped as the moisture content increased, while the internal friction angle showed only an inconspicuous or slight decrease [21,22,23,24]. Nevertheless, Zhang Sui et al. pointed out there was always about 30% of the most unfavorable moisture content, which made the shear strength of frozen clay minimum at this moisture content [25]. Soil strength and cohesion were generally negatively correlated with the freeze–thaw temperature, but the friction angle showed no noticeable change [26,27,28]. Scholars further studied the influence of freezing temperature and thawing temperature on soil strength, but the results were different. Yu Linlin et al. found that the lower the freezing temperature, the smaller the influence of freezing and thawing on the cohesion and internal friction angle, while the influence of thawing temperature on the shear strength of the test soil was small [29]. While some scholars held the opposite view, Li Shuanghao et al. believed that compared with the freezing temperature, the thawing temperature was the dominant factor [30].
The freeze–thaw temperature showed uniqueness to a certain degree because of its unique climate conditions in Yili Valley. The soil in Yili Valley differs from the other regions regarding mineral components, structural compositions, and physical properties [31,32,33]. Studies of the physical and mechanical properties of soil in other areas are not suitable for Yili, because of different freezing and thawing temperatures, amplitude, mineral composition, structural composition, moisture content, and density of soil. In recent years, scholars have placed a research emphasis on the material source of Yili Loess, while lacking a systematic investigation of the degradation mechanism of the soil’s physical and mechanical properties under the freeze–thaw action. Tengfei Mo et al. [34] analyzed the effects of moisture content on the deformation and shear strength indices of Yili Loess, but without considering freeze–thaw cycles. With the policy response of the “Belt and Road” initiative, the density of engineering construction in the Yili Valley is increasing, and the contradictions between urbanization and geological environment are increasing. Therefore, it is urgent to study the effect of freeze–thaw cycles on the mechanical properties of loess in the Yili area of Xinjiang.
Based on previous research results, this study focused on a typical loess landslide in Yili Valley, analyzed the variations of shear strength indices of loess samples with different moisture contents, and investigated the effect of the moisture content change on the mechanical properties of Yili Loess under freeze–thaw cycles. The present study provides a theoretical reference for preventing and controlling loess landslides.

2. Materials and Methods

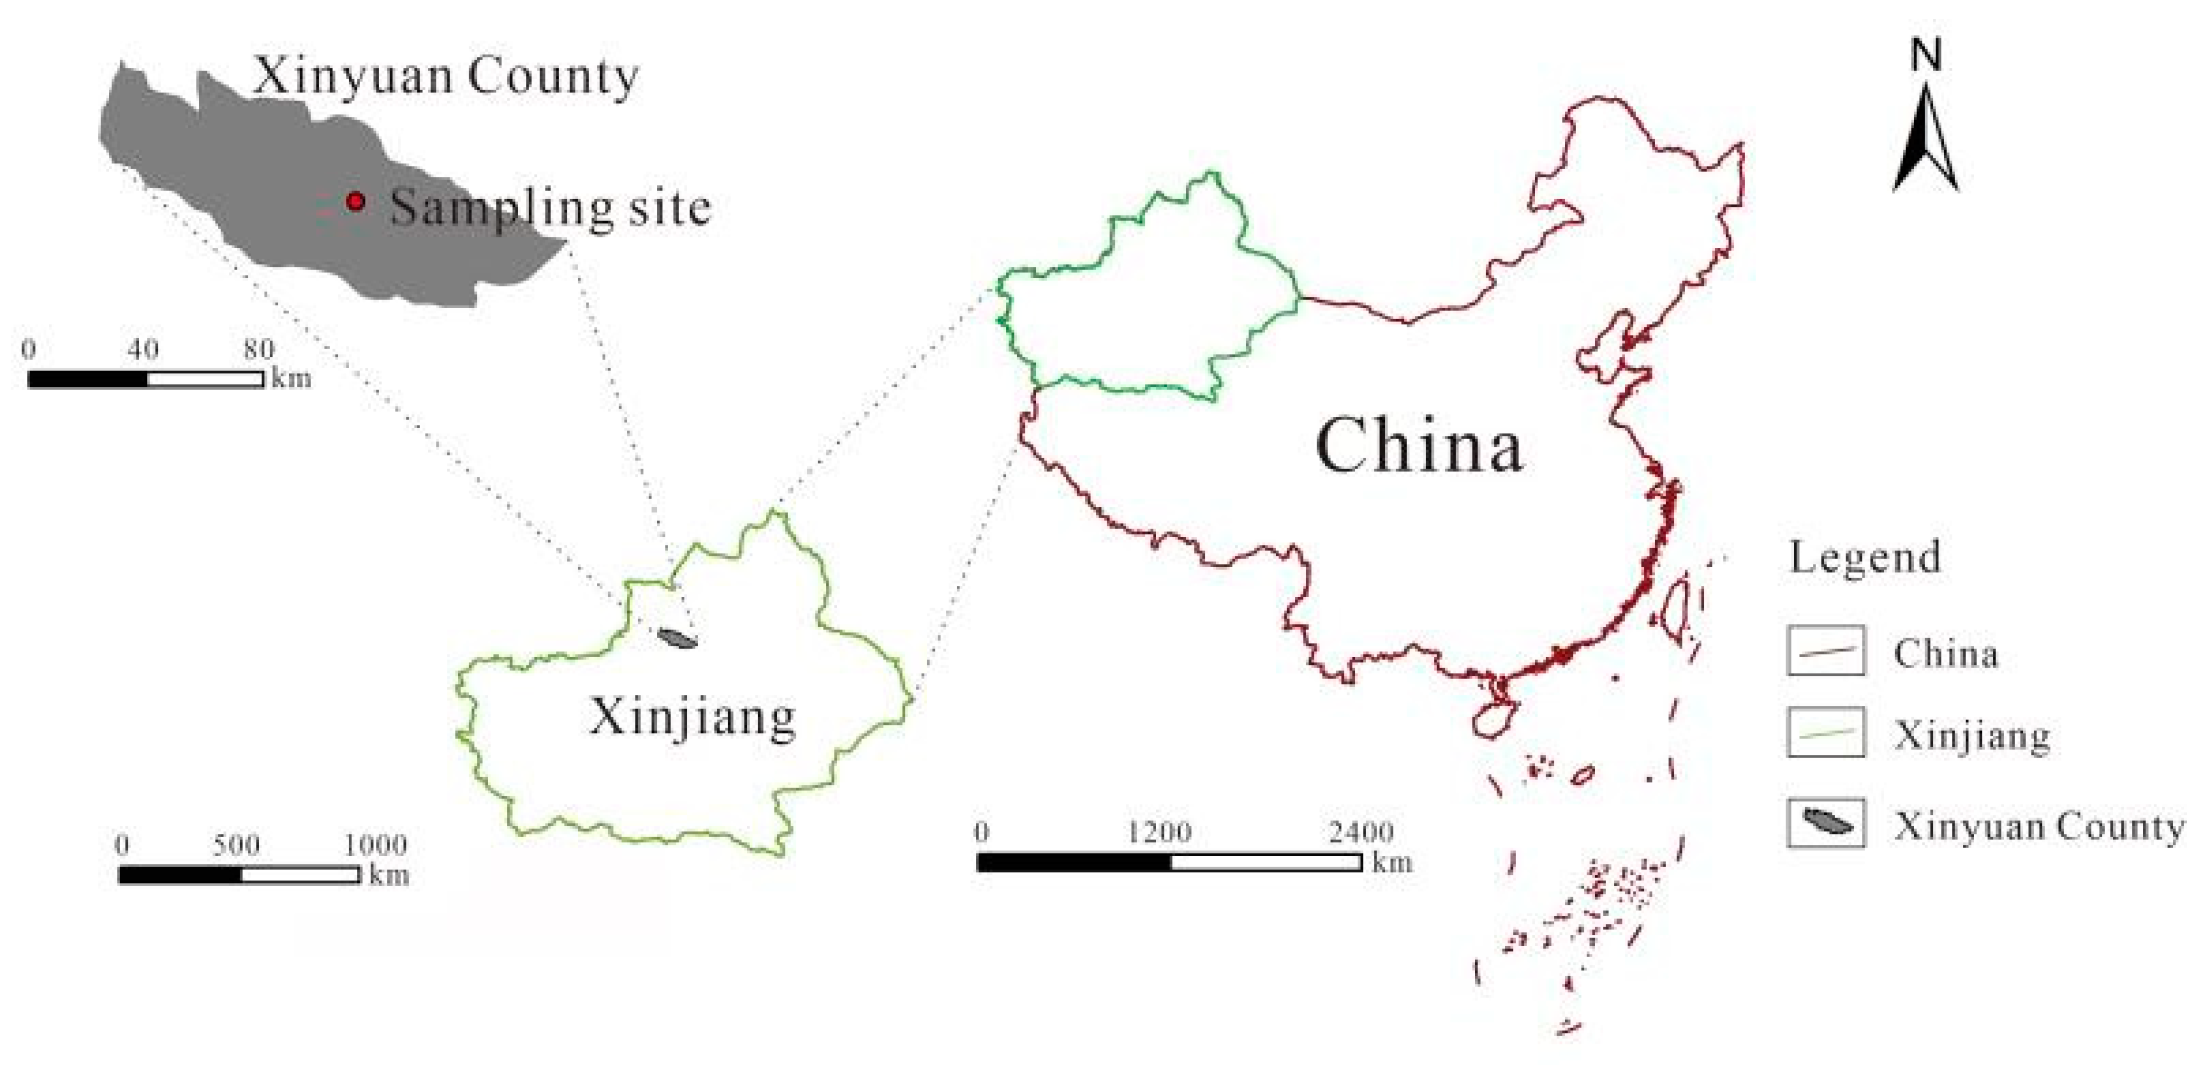
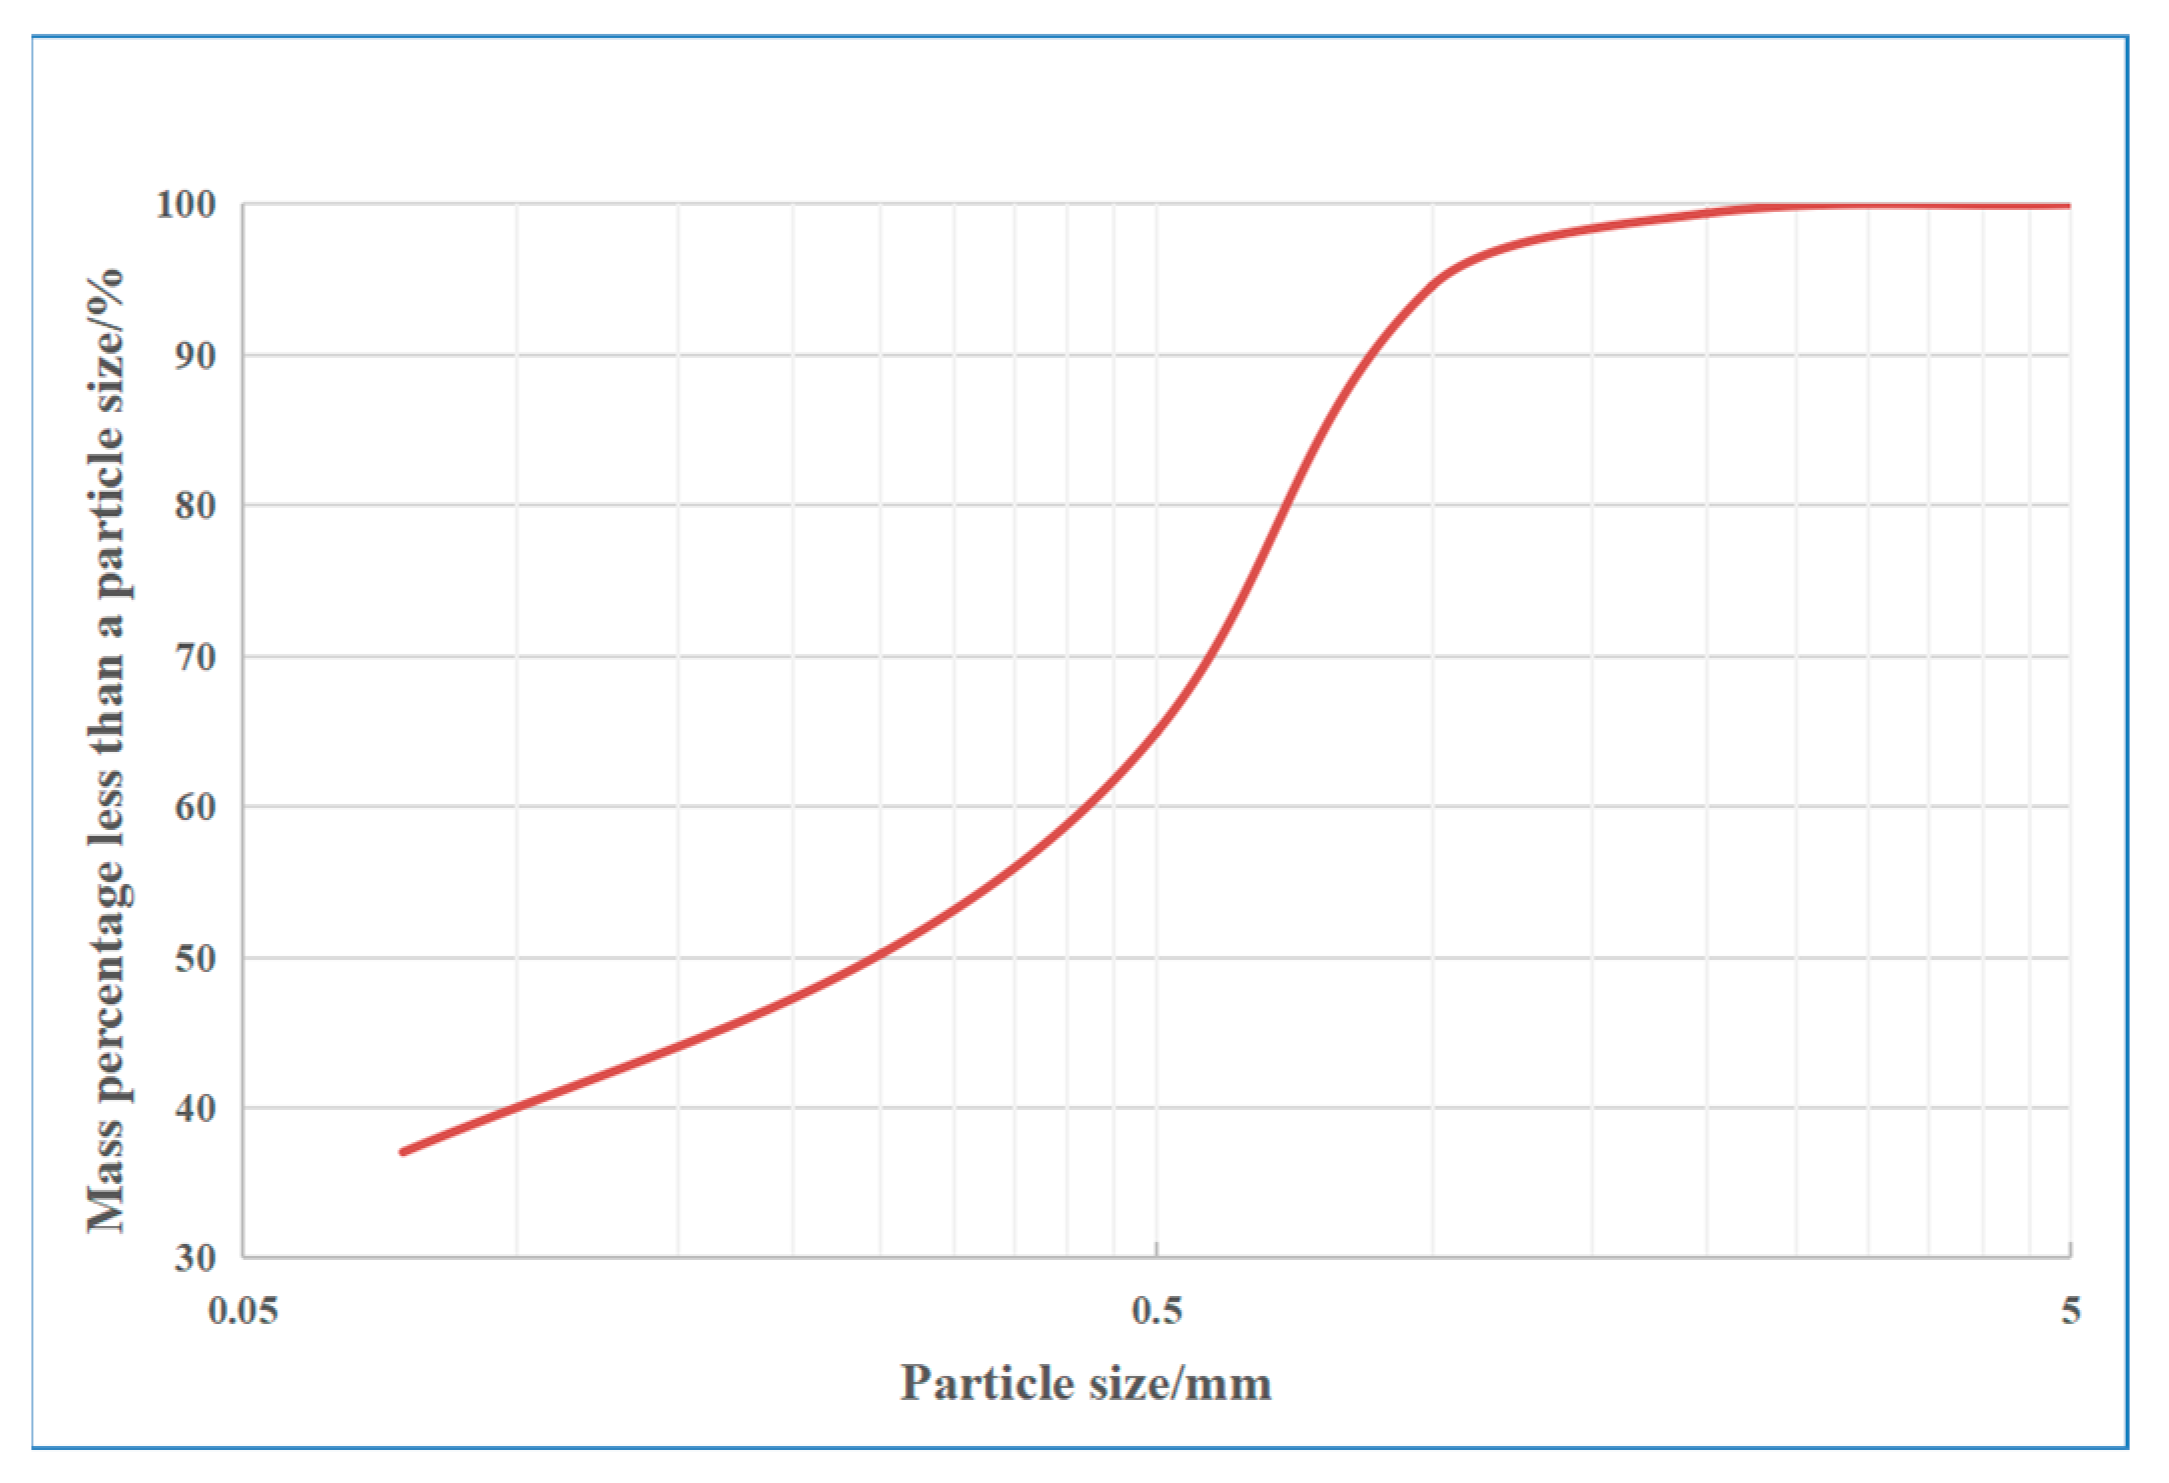
2.1. Acquisition and Basic Physical Properties of Soil Samples

The soil samples were taken from the debris flow gully in Hinedesayi, Xinyuan County, Yili Prefecture, Xinjiang, and a location map of the study area is shown in Figure 1. The sampling area belongs to the key prevention and control area of landslides and debris flows in Yili, Xinjiang. The debris flow valley in Hinedesayi has running water all year round, and there are two landslide groups on both sides of the valley. The geological environment is complex, and the vulnerability to geological disasters is strong. The slope instability is representative of the Yili valley. According to the field investigation, there were 8 landslides in the study area, as shown in Figure 2, and many landslides have produced secondary landslides.
We sampled twice in the field. During the freeze–thaw period, soil freezing made it difficult to sample, so we only investigated and photographed areas, and obtained a small amount of soil samples for moisture content determination. Freeze–thaw cycle test soil was mainly obtained in July, the sampling site was located in the undeformed area of the slope toe of the old landslide, where there was water accumulation. The sampling depth was approximately 6 m, and the total mass of soil samples was about 650 kg. The soil sample was raw material from undisturbed soil and remolded samples used in the later test. The soil depth used in the subsequent freeze–thaw cycle-related experiments was 5–6 m, and the amount used was about 30 kg. Both undisturbed and remolded samples were collected, transported, and prepared according to the Standard for Geotechnical Testing Method (GB/T 50123-2019) [35]. To prevent the occurrence of fracturing induced by water migration, we sealed the collected undisturbed and remolded samples for further processing. After the samples were transported back to the laboratory, the density test, moisture content test, liquid-plastic limit test, size distribution test, and compaction test were carried out, according to the standard of geotechnical test method (GB/T 50123-2019) [35], on the original sample, to obtain the primary physical indices of the soil, as shown in Table 1. Figure 3 is the particle grading curve of the soil samples.

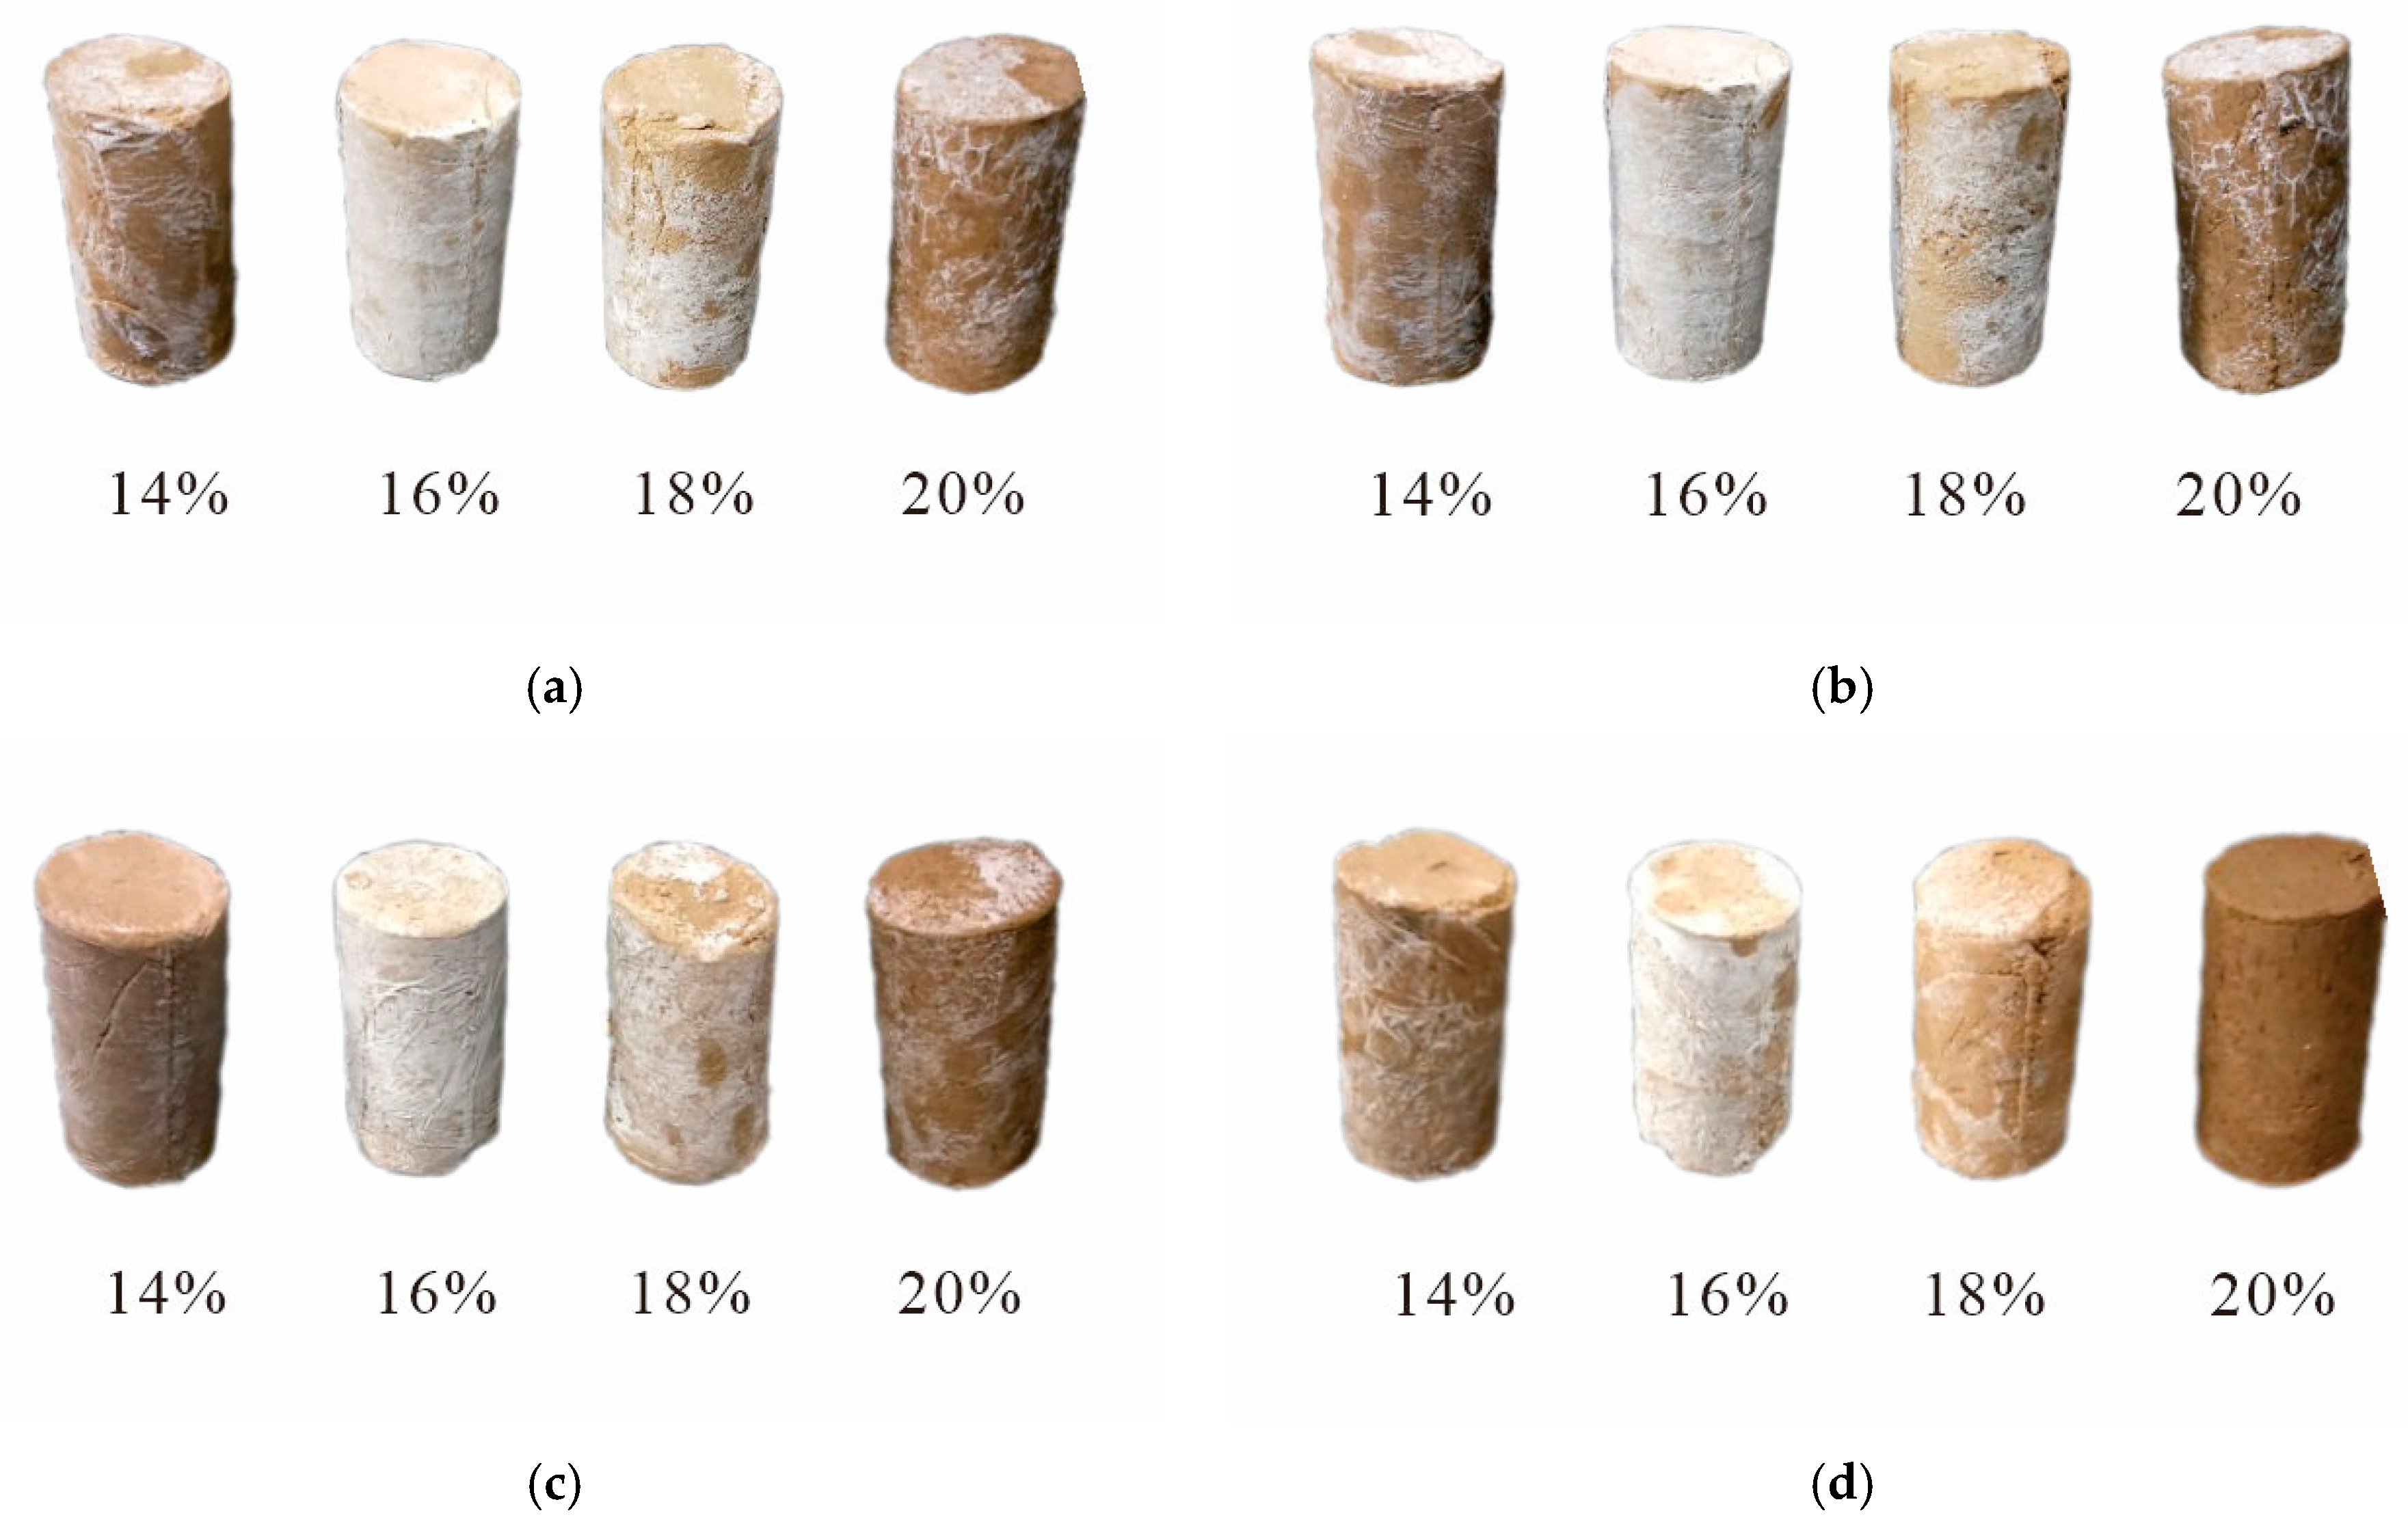
2.2. Specimen Preparation
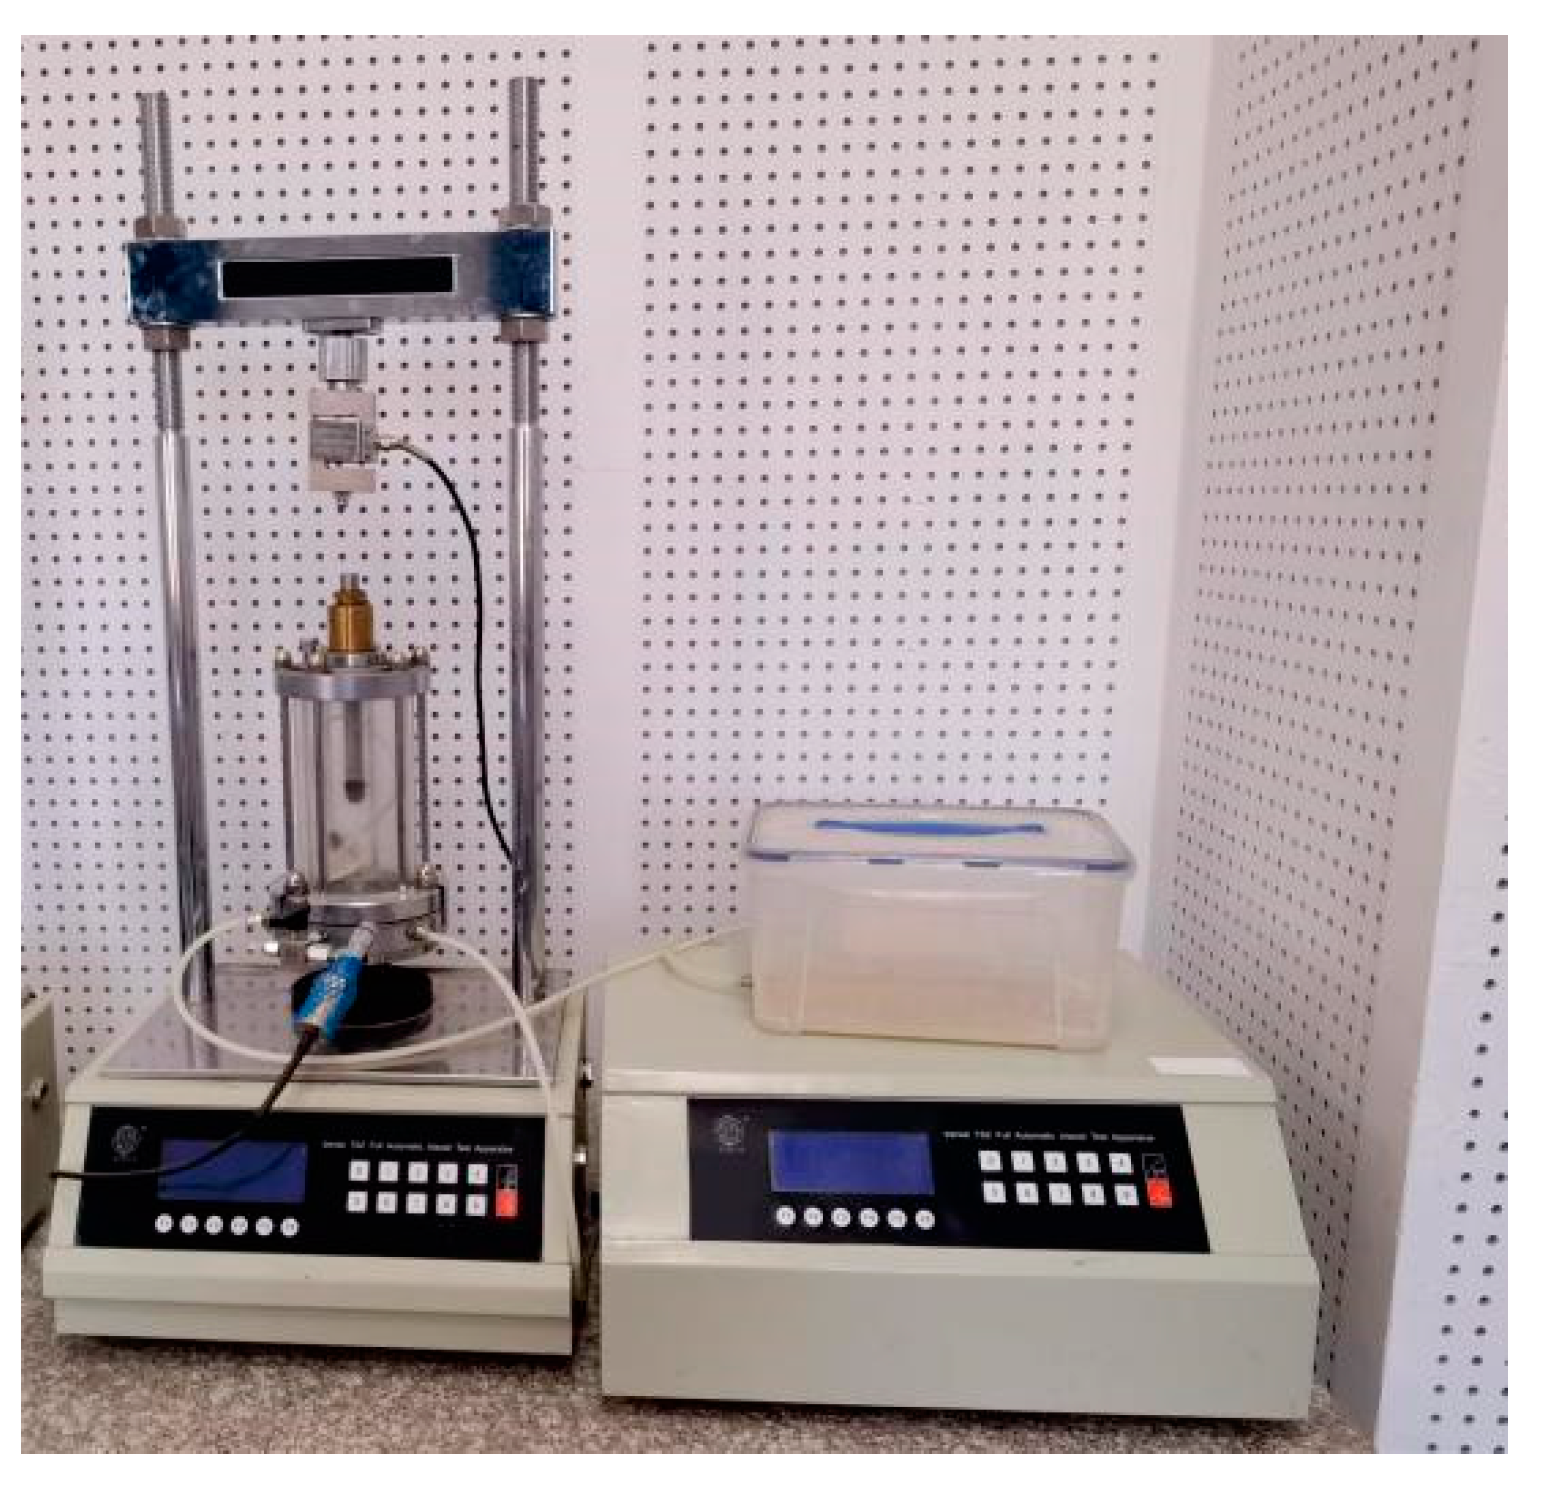
During the preparation of remolded samples, the air-dried soil samples were sieved via a 2-mm sifter, to eliminate the disturbance of large soil particles on the soil’s mechanical properties. The optimal moisture content of the test soil sample was 18.5%, the natural moisture content was 20.25% (sampled in July, during the rainy season and the sampling site was located at the foot of the landslide slope, the natural moisture content was high), the plastic limit was 22.85%, and the liquid limit was 30.55%. In order to study the influence of moisture content on the soil, the experiment was carried out with a 2% spacing near the optimal moisture content. In addition, according to the field monitoring and related exploration reports, the natural moisture content of the soil in the study area during the freeze–thaw period (November to April of the following year) was generally 13–20%, due to the dry season. Accordingly, four moisture contents of 14%, 16%, 18%, and 20% were selected in the freeze–thaw cycle experiments. A total of 2 kg sieved air-dried soil was taken and laid flat on a non-absorbent plate. The amount of water required for the four levels of moisture content was calculated according to Formula (1).
m ω   =   m 0 1 + 0.01 ω 0   ×   0.01 ( ω     ω 0 ) .
In the equation, m ω is the amount of water required for soil samples (g); m 0 is the quality of dry soil for wind (g); ω is the moisture content required for soil samples (%); and ω 0 is air-dried moisture content (%). The predicted amount of water was sprayed with a sprayer and left for a period of time. The water was sealed in a glass cylinder and left for one day and night.
The samples were prepared using the sample striking method. The maximum dry density of 1.74 g/cm3 was selected to prepare the standard sample for the triaxial test, with a diameter of 39.1 mm and a height of 80 mm. The required total soil mass was calculated using Formula (2).
m = ( 1 + 0.01 ω 0 ) ρ d V .
In the equation, m is the total soil mass required for preparing the disturbed soil samples (g); ω 0 is the air-dried moisture content (%); ρ d is the dry density required for the preparation of soil samples (g/cm3); and V is the volume of compacted or molded soil (cm3). Figure 4 shows the four groups of soil samples with different moisture contents (14%, 16%, 18%, and 20%).

2.3. Method

This experiment included three parts: Freeze–thaw cycle test, apparent characteristics observation, and triaxial compression test. First, the freeze–thaw cycle test was carried out on the remolded samples, and the samples were quickly taken out after each freezing period and the end of the thawing period, to observe their characteristics. Finally, triaxial compression tests were carried out on the samples that reached the set number of freeze–thaw cycles.

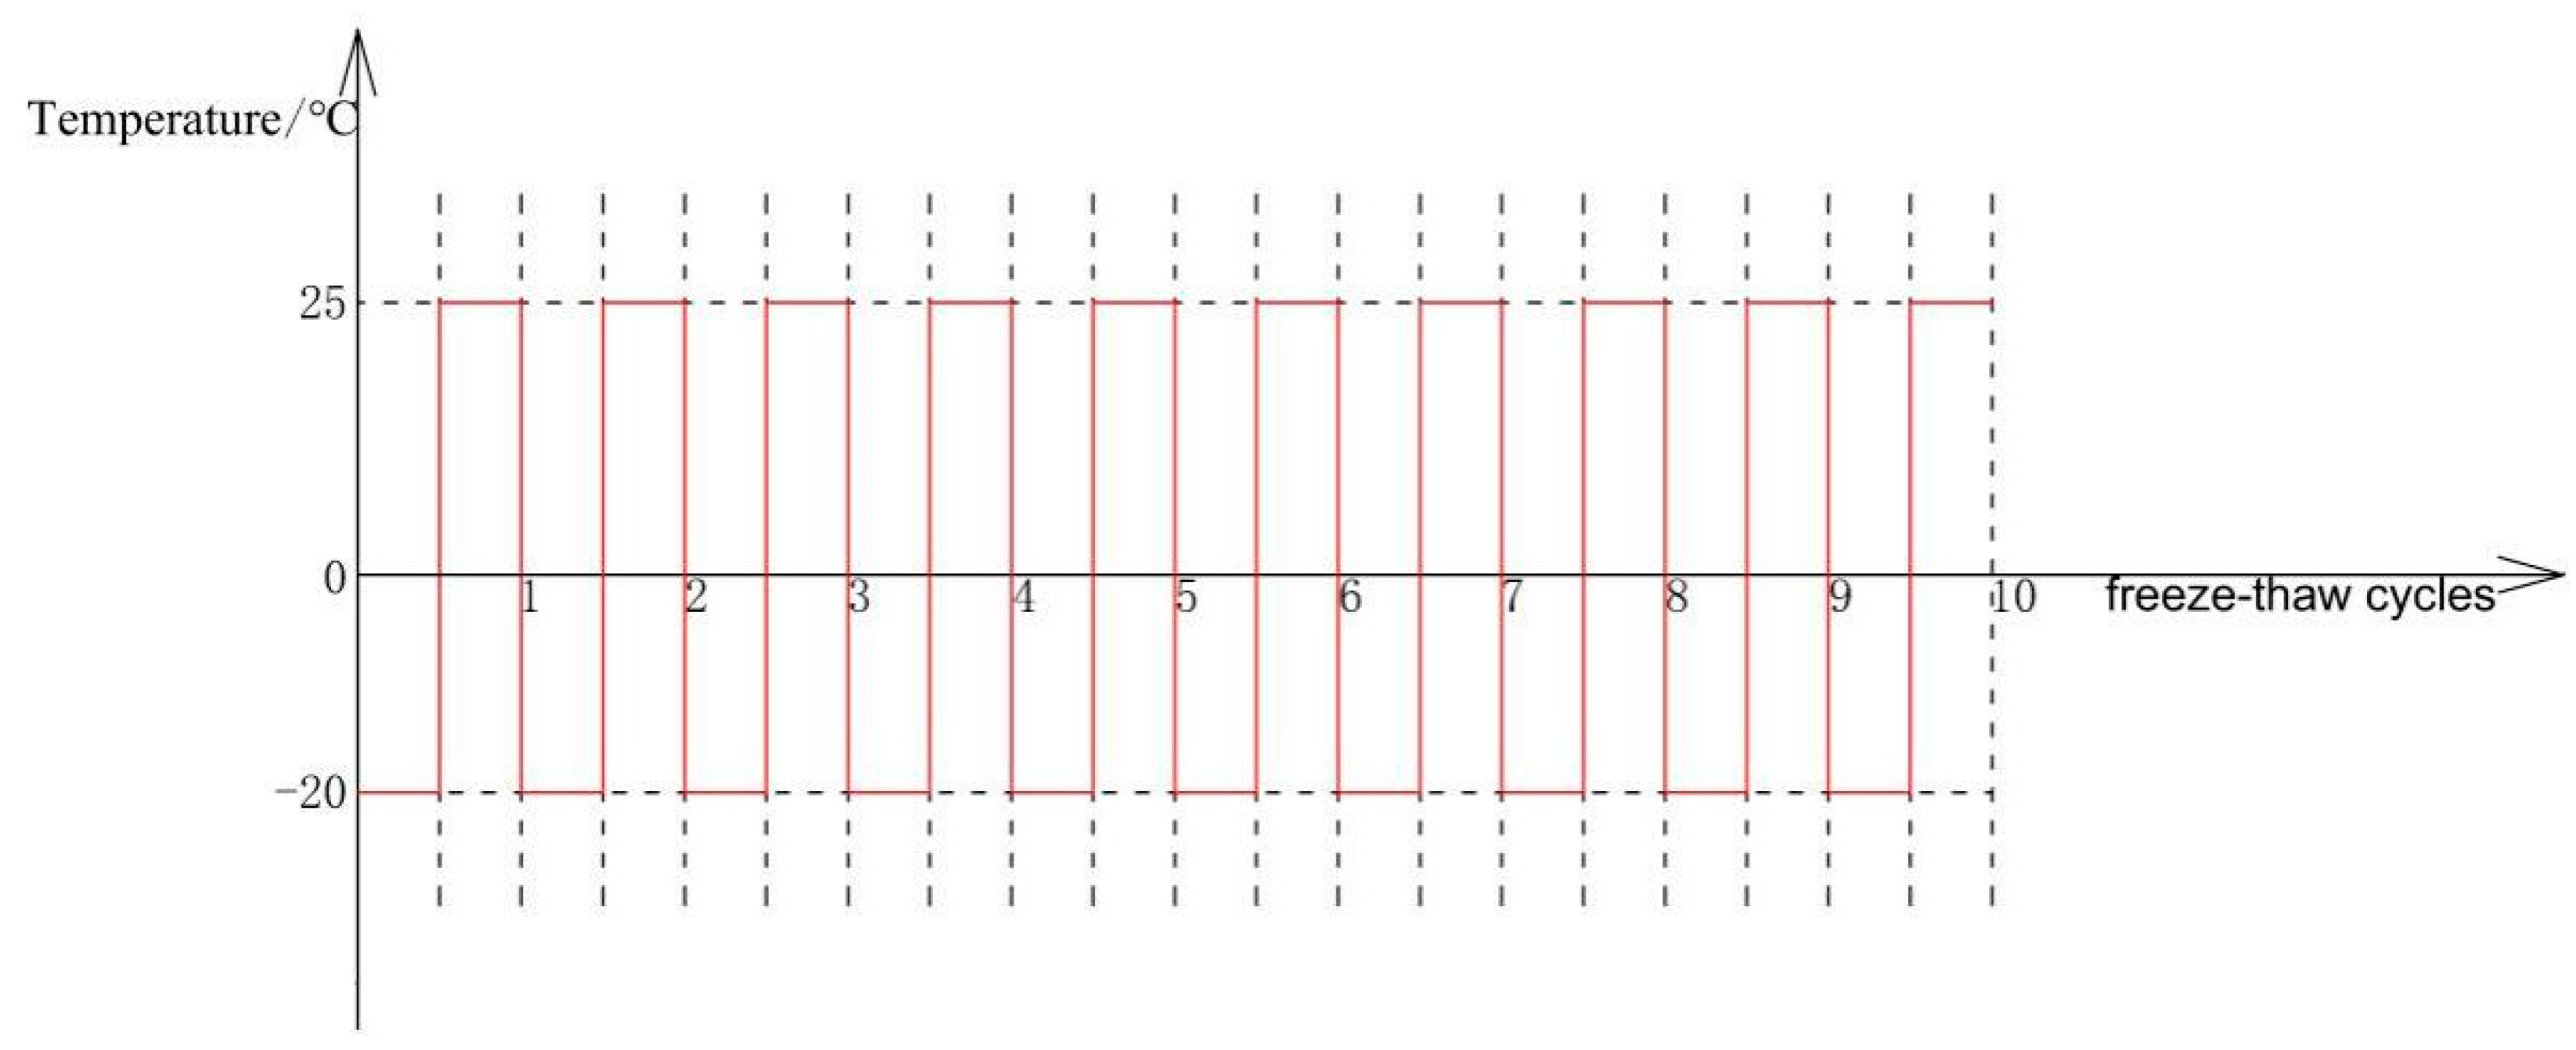
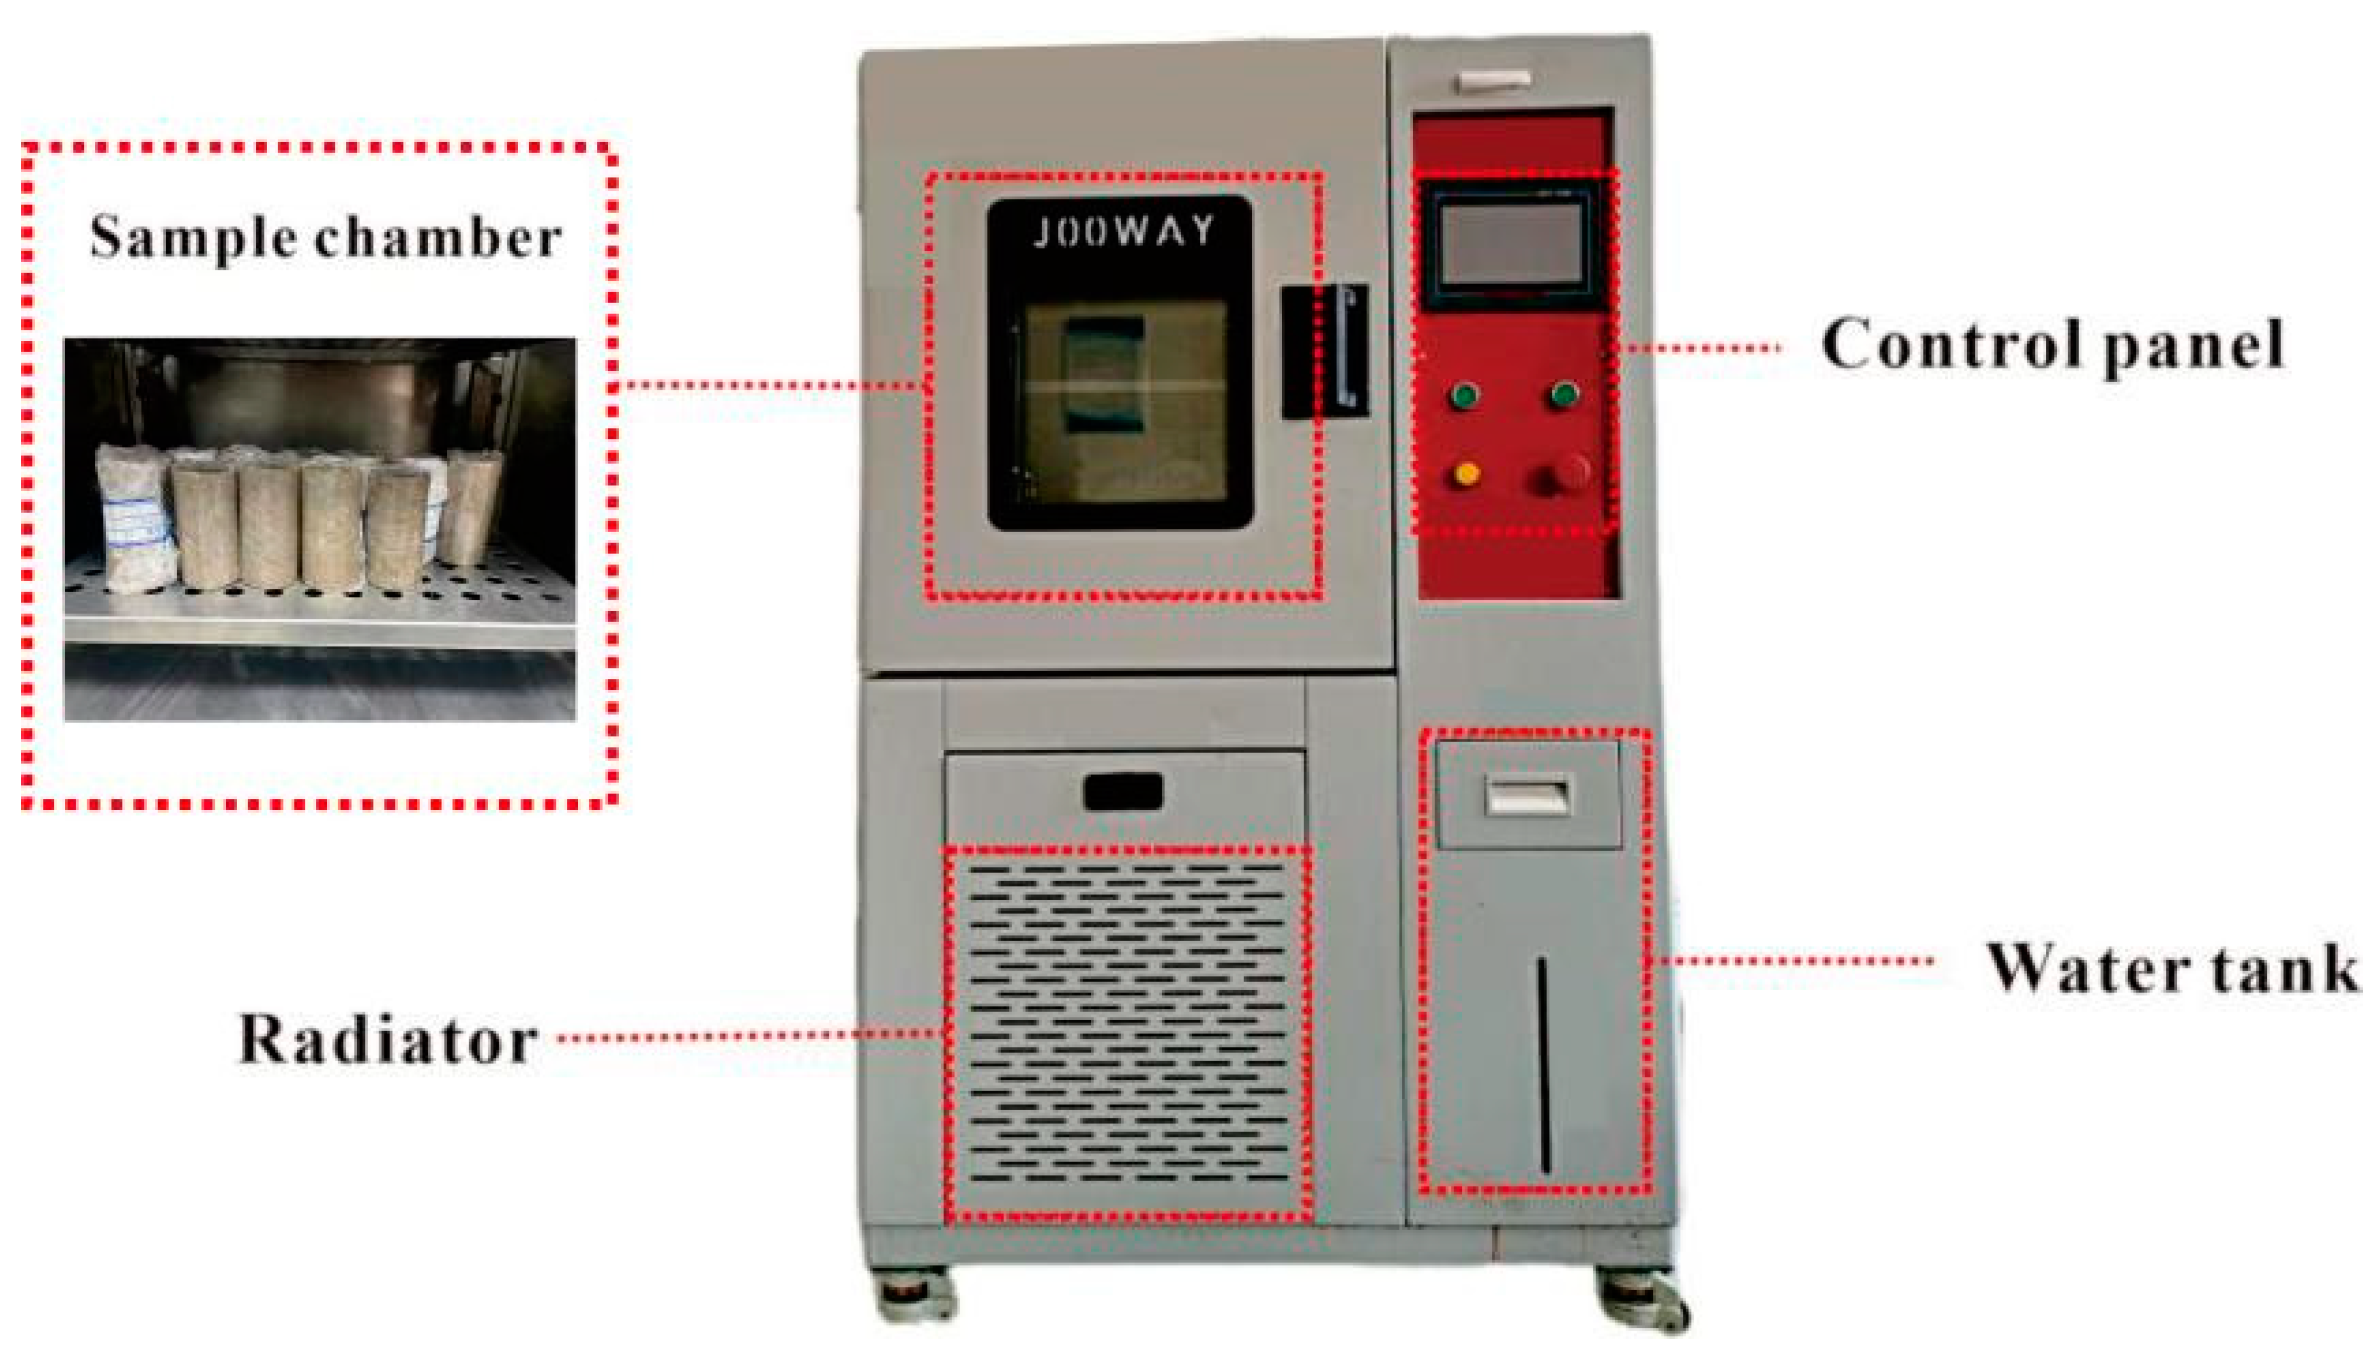
2.3.1. Freeze–Thaw Cycle Test

According to locally measured air and earth temperature data, the extreme high temperature was 26 °C and the extreme low temperature was −21 °C during the freezing and thawing period from 2011 to 2020 in the study area. The temperature extremes during the freezing and thawing period of the study area in the past decade are shown in Table 2. Combined with the actual situation of the study site, the freezing temperature and the freezing time in the freezing stage were −20 °C and 12 h, respectively, while the respective temperature and time in the thawing stage were 25 °C and 12 h. Each freeze–thaw cycle consisted of a thawing period and a freezing period lasting 24 h. Therefore, the number of freeze–thaw cycles was set as 0, 1, 3, 5, 7, and 10. The freeze–thaw cycle path is shown in Figure 5.
The freeze–thaw testing was performed in an enclosed environment. The samples were rapidly wrapped in a preservative film and placed vertically in a programmable constant temperature and humidity test chamber, manufactured by Shanghai Juwei Company, for simulating the freeze–thaw environment, as shown in Figure 6. There were 6 groups of freeze–thaw cycles, each containing 4 moisture contents, with 4 samples under each moisture content. A total of 96 samples were subjected to freeze–thaw cycles. After reaching the set number of freeze–thaw cycles, the samples were immediately taken out for apparent characteristic observation and the triaxial compression test.

2.3.2. Observation of Apparent Characteristics

After the end of the freezing and thawing stages, the samples were quickly taken out, and the morphological characteristics of the frost crystals and ice crystals precipitated on the surface of the samples were qualitatively analyzed. An A6300 Sony micro single camera was used for photography, to observe and analyze the fractures and bed separation in the morphology of the samples during the freeze–thaw cycle, so as to obtain the morphological changes of the samples during the freeze–thaw cycle.

2.3.3. Triaxial Compression Test

Figure 7 shows the series TSZ full automatic triaxial test apparatus for triaxial compression testing.
According to the estimation of static earth pressure, and referring to the triaxial test of Yili loess by Mo Tengfei et al. [34], we used confining pressures of 50 kPa, 200 kPa, and 400 kPa in the consolidated undrained (CU) testing. The shear strain rate was set to 0.1%/min according to the Standard for Geotechnical Testing Method (GB/T 50123-2019) [35] and considering the soil properties. Triaxial shear tests were carried out on samples with different moisture contents (14%, 16%, 18%, and 20%) after the freezing and thawing cycles. The stress–strain curves of samples with different moisture contents under multiple freeze–thaw cycles were obtained, and the shear strength and shear strength parameters of the samples were calculated. The shear strength parameters were calculated by the Mohr-Coulomb method, according to Formula (3).
τ f   =   C + σ   tan φ .
In this equation, τ f is shear stress (kPa); C for cohesion (kPa); σ is stress (kPa); and φ is internal friction angle (°). A Mohr circle was drawn according to the test data, and the strength envelope of the soil was obtained. The inclination angle of the strength envelope was the friction angle of the soil sample, and the intercept with the longitudinal axis was the cohesive force.

3. Results

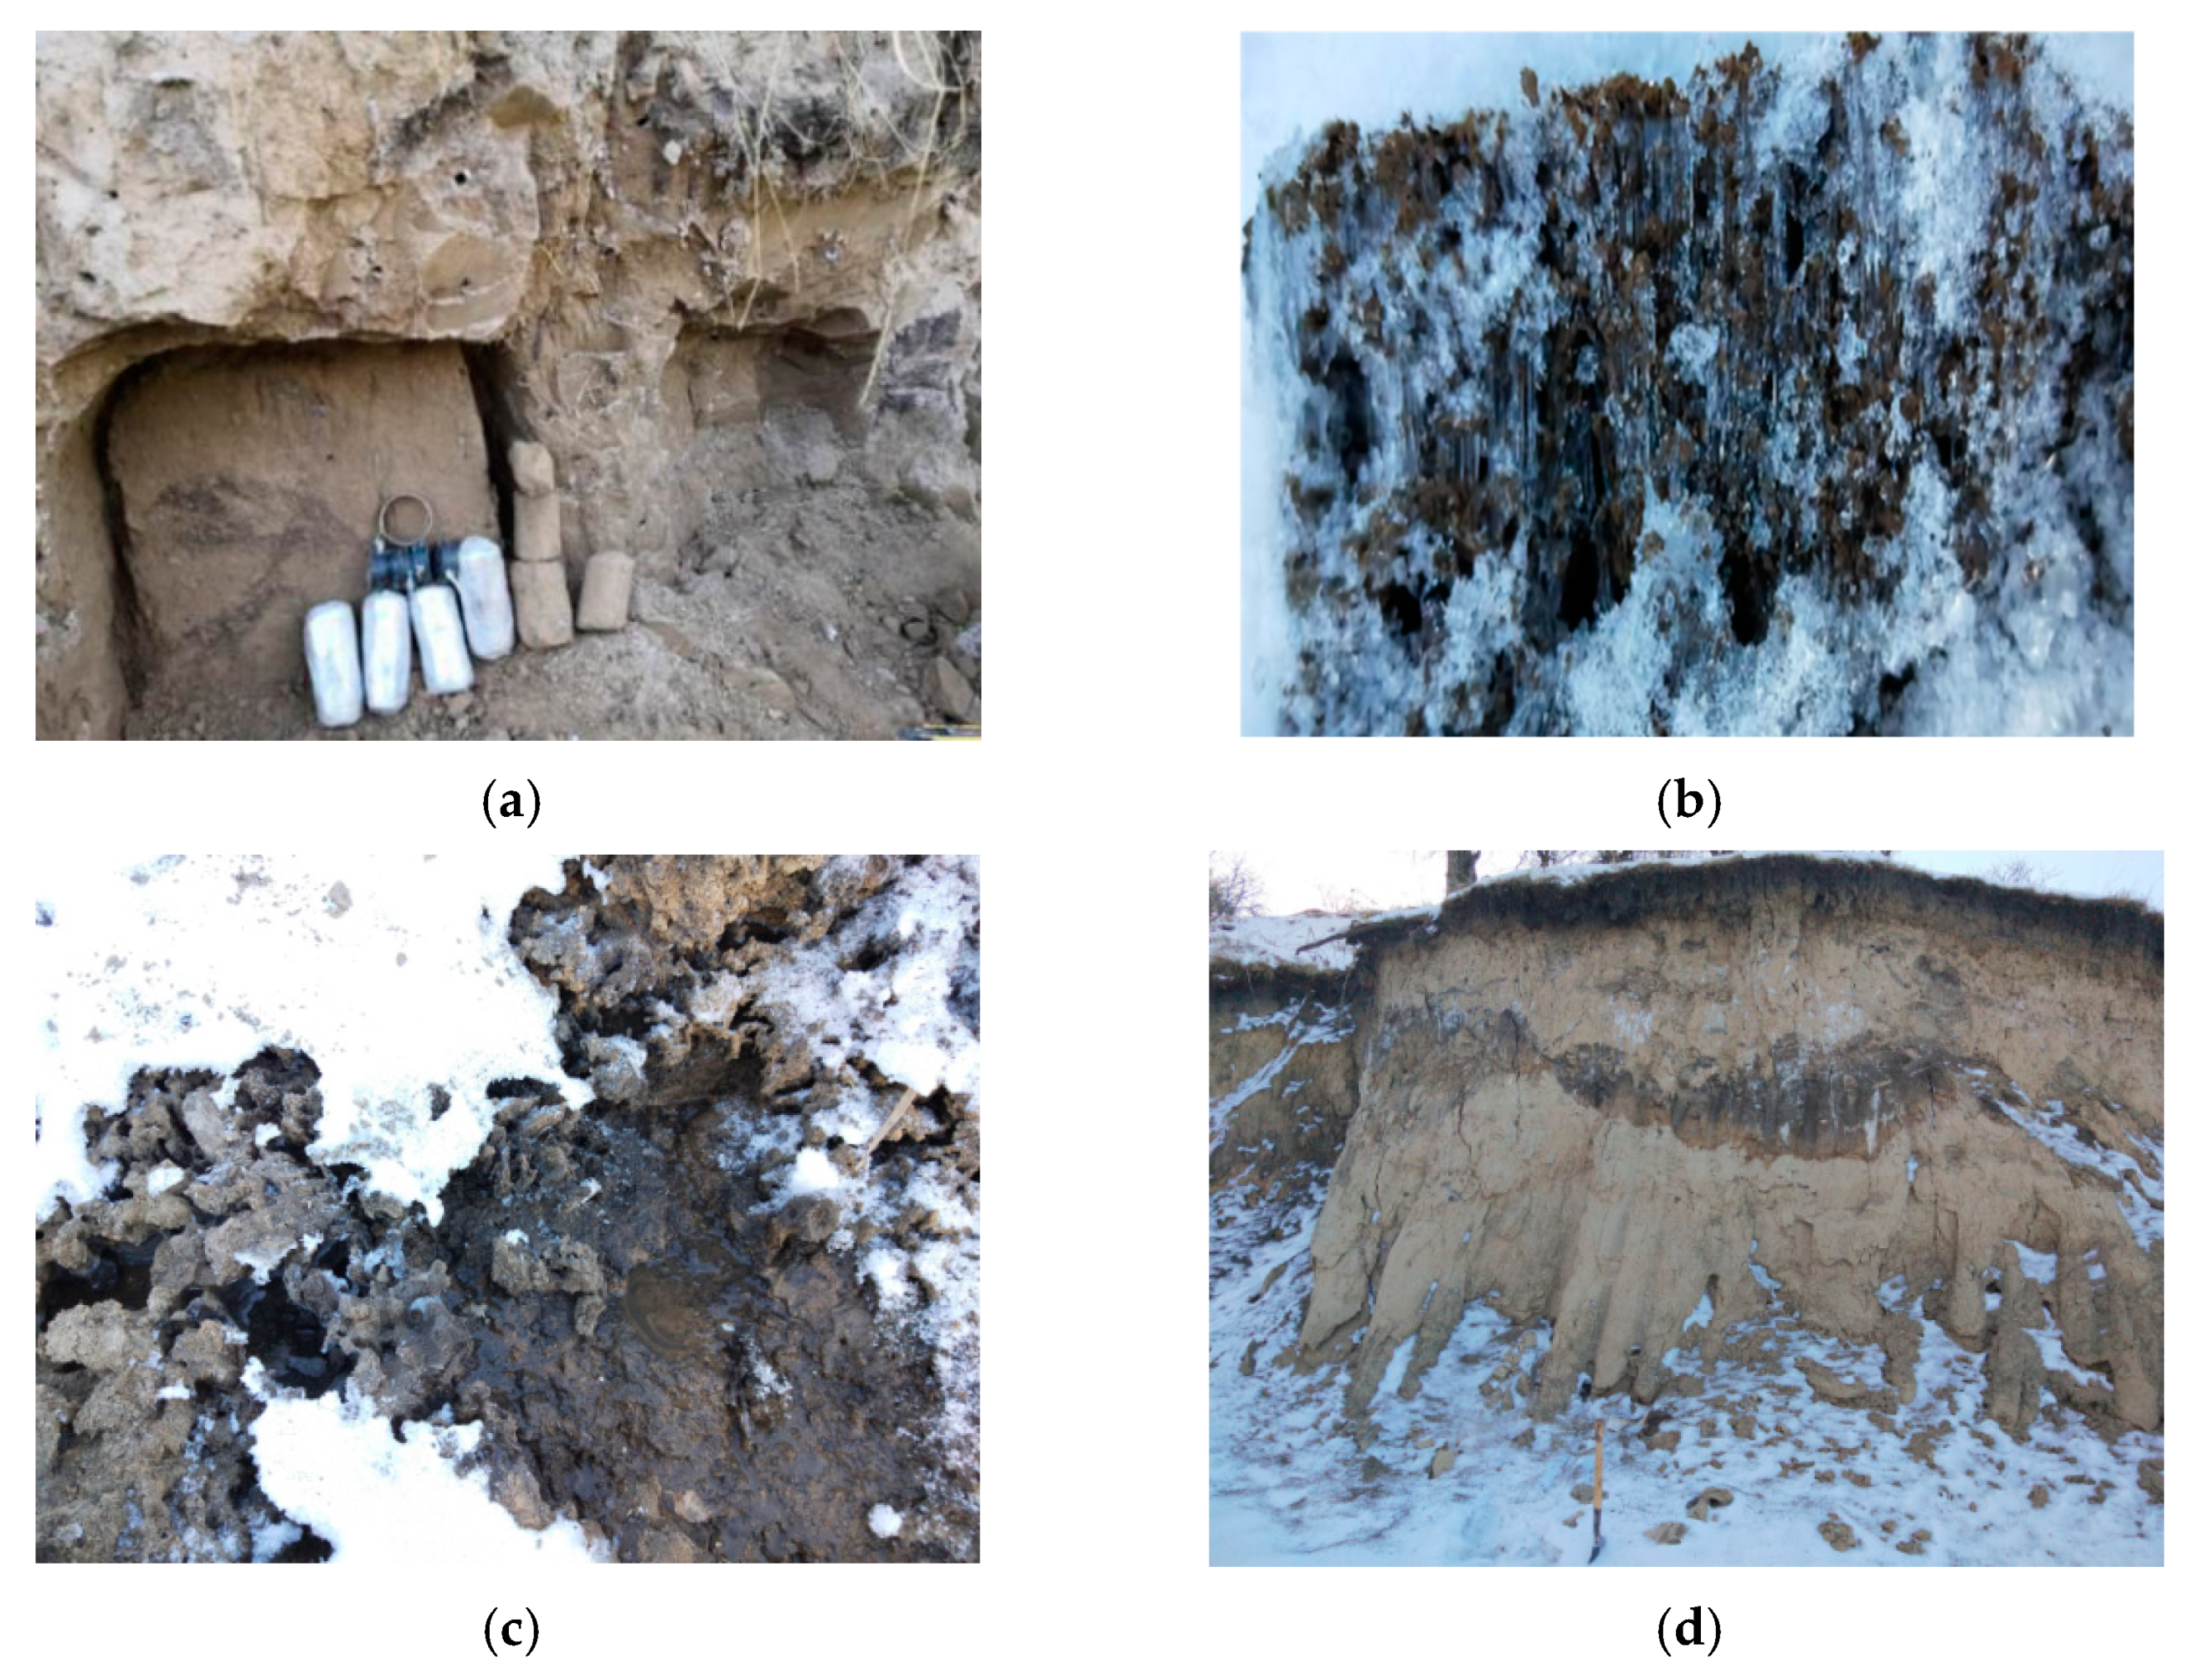
3.1. Analysis of Loess Apparent Characteristics

The appearance characteristics analysis of the soil samples and triaxial specimen specifications were the same: the dry density was 1.74 g/cm3, diameter was 39.1 mm, and the height was 80 mm. They were prepared at the same time with triaxial specimens and experienced freeze–thaw cycles. Figure 8 shows the apparent characteristics of different soil samples after different freeze–thaw cycles. After the end of the freezing stage in the first freeze–thaw cycle, frost crystals occupied a dominant part of the soil surface. The distribution of crystals showed no apparent correlation with the moisture content. The soil sample with a moisture content of 16% had a remarkable abundance of frost crystals, followed by the soil samples with the moisture contents of 18% and 14%, and finally by the soil sample with a moisture content of 20%. Image pro plus was used to process the images, and the corresponding proportions were 90.8%, 55.3%, 48.4%, and 38.7%. Therefore, we deduced that the precipitation abundance of frost crystals was related to the moisture content and the maximum dry density. Compared with the soil sample with a moisture content of 18%, the 16% moisture content sample was looser, and water precipitated from the fractures among particles by crystallization. Since the moisture content of 16% was closer to the optimum value, the soil sample with a moisture content of 16% showed a greater abundance of frost crystals than that with a moisture of 14%. Both frost and ice crystals appeared on the surface of the 20% moisture content soil sample, which rapidly froze at the freezing stage, and a layer of ice was formed as a shell on the surface, preventing the outward migration of water. Moreover, only frost crystals formed on the sample’s upper and lower surfaces, with small distribution areas.
During the 3rd and the 5th freeze–thaw cycles, the abundance of frost crystals in various samples increased gradually; for the soil sample with a moisture content of 20%, the frost crystals on the upper and lower surfaces gradually changed to ice crystals. After three freeze–thaw cycles, the abundance of frost crystals was 16%, 18%, 14%, and 20%, which was consistent with one freeze–thaw cycle. The corresponding proportions of the four moisture contents were 94.2%, 63.8%, 56.7%, and 42.3%, and compared to one freeze–thaw cycle increased by 3.4%, 8.5%, 8.3%, 3.6%. After five freeze–thaw cycles, the frost crystal abundance was also 16%, 18%, 14%, and 20% from large to small, and the corresponding proportions were 94.7%, 69.1%, 61.2%, and 43.7%, respectively. Compared with three freeze–thaw cycles, they increased by 0.5%, 5.3%, 4.5%, and 1.4%, respectively. Finally, after ten freeze–thaw cycles, most of the frost crystals precipitated were converted into clustered ice crystals, and minor fractures in a network distribution appeared on the surface layer.
After ten freeze–thaw cycles, most of the water had already migrated towards the surface layer to form ice crystals, accompanied by the appearance of inflated fine-vein fractures. The layered distribution of ice crystals observed along the vertical direction of soil caused the formation of hexagonal peeling bodies on the surface layer. Layered peeling dominated the deformation failure. During the ten freeze–thaw cycles, the top surface was relatively loose with assertive water abundance, thereby quickly forming ice shells. Ice shells exceeded the soil in heat-conducting properties, resulting in an increase of freezing rate. Based on the minimum energy principle, soil water migrated outwards to the outer layer, forming layered ice crystals. The layered ice crystals further expanded, thereby aggravating the soil peeling phenomenon.
In the actual field investigation, frost crystals, and layered and reticular ice crystals were formed in the surface soil of the slope. In addition, some hard shells separated from the slope surface were also found. Figure 9 shows the field investigation photos. According to the analysis, during the freezing process of the slope surface soil, due to the thermal convection exchange between air and soil, the surface soil temperature decreased, and the moisture in the deep soil moved from the deep warm region to the surface layer, resulting in frosting and other phenomena. However, due to the lack of long-term observation conditions, it is impossible to confirm whether the field phenomenon is consistent with the tests.

3.2. Triaxial Compression Test Results

In this experiment, the stress–strain curve obtained by triaxial test was analyzed, and the curve types were quantitatively classified. Second, the influence of freeze–thaw cycles and moisture content on the shear strength parameters of the soil was analyzed.

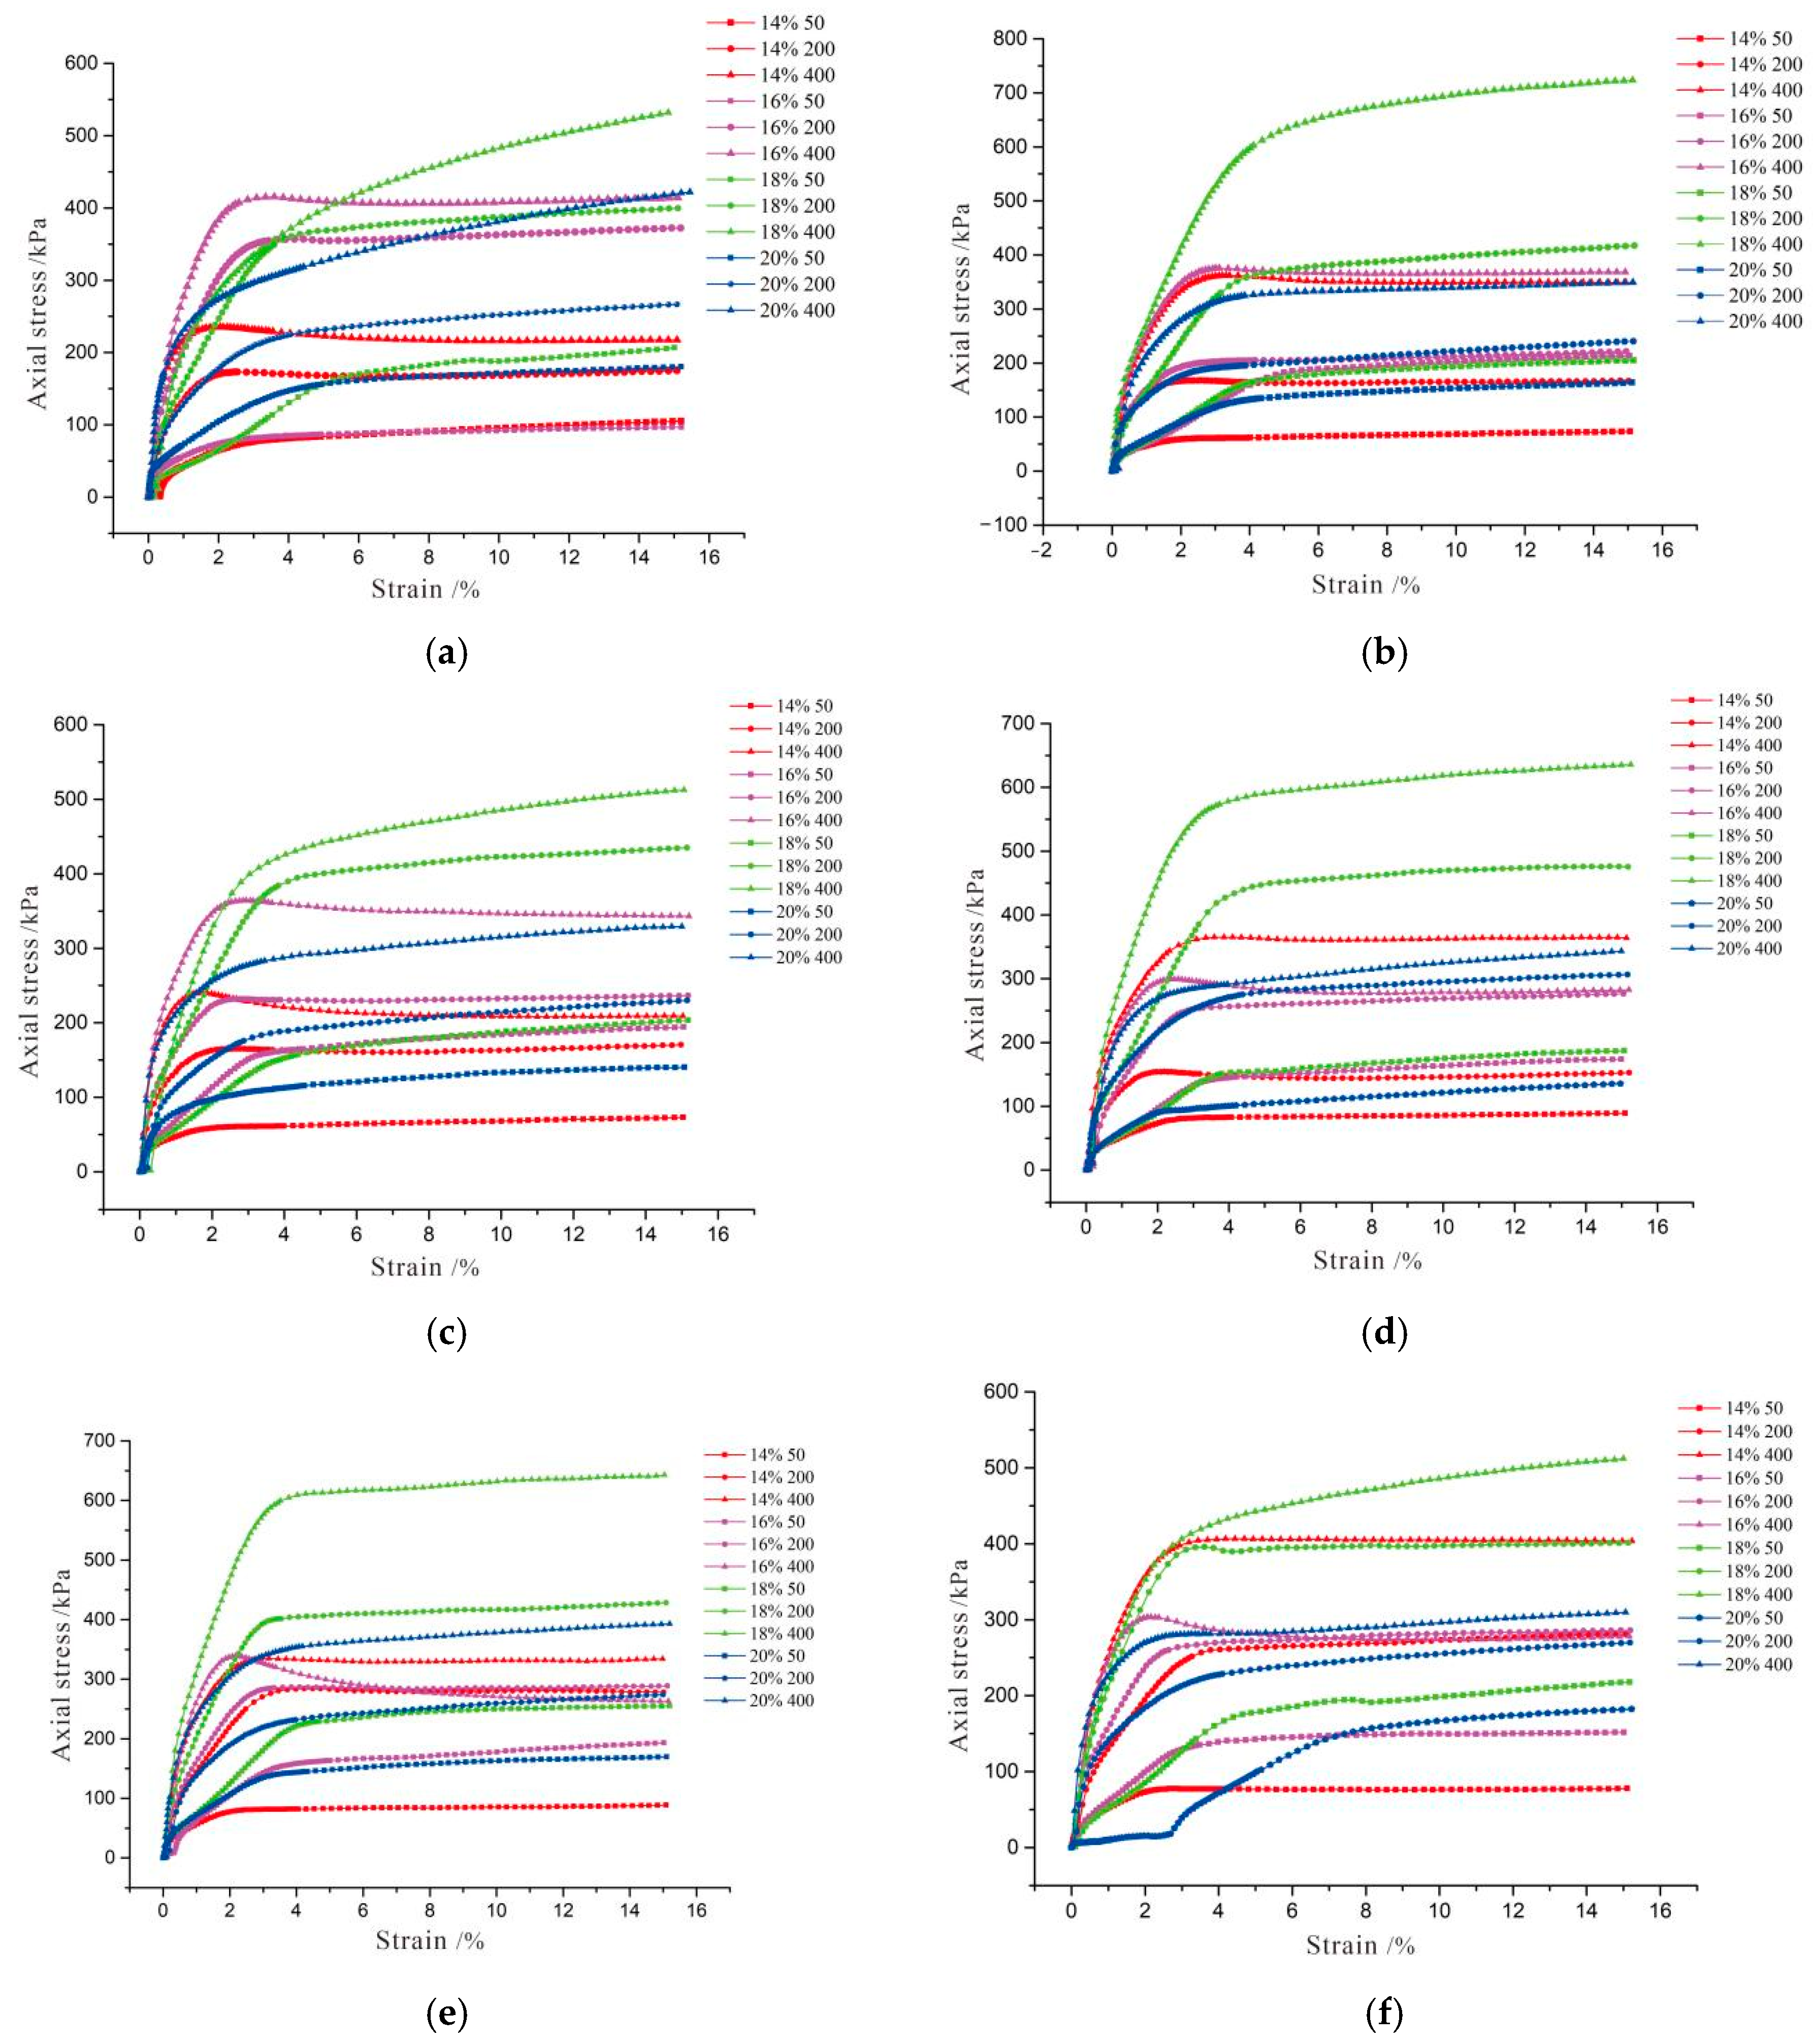
3.2.1. Stress-Strain Characteristics of Loess

Figure 10 shows the stress–strain curves of various soil samples with different moisture contents after different freeze–thaw cycles. As shown in Figure 10a, linearly elastic change was mainly concentrated within the 0~2% strain range of the rock–soil body before the freeze–thaw action. For the samples with 14% and 16% moisture contents, the stress–strain curves first increased, then decreased, and finally tended to be stable. For the samples with different moisture contents of 18% and 20%, the stress–strain curves increased steadily. The axial stress increment under a confining pressure of 400 kPa was more significant than the values under 50 kPa and 200 kPa. Under a confining pressure of 50 kPa, the axial stress peak first dropped, then increased, and finally decreased with increased moisture content. Under confining pressures of 200 kPa and 400 kPa, the axial stress peak first increased and then decreased with the gradual increase of moisture content. Under the optimum moisture content, the engineering properties of soil were the best.
Figure 10b–f shows that after one, three, and seven freeze–thaw cycles, linear elastic change was mainly within the 0~4% strain range; with five freeze–thaw cycles, the linear elastic range was within the 0~3% strain; finally after ten freeze–thaw cycles, the linear elastic range was within the 0~7% strain. After different freeze–thaw cycles, the stress-strain curves under a confining pressure of 50 kPa changed much more slowly than in the curves under 200 kPa and 400 kPa.
Among them, 20% of the soil samples showed abnormal curves after 10 freeze–thaw cycles, and the reason for this was that the soil was destroyed twice. After the test, the local shear deformation at the end of the soil sample broke quickly, but the soil was not destroyed as a whole. After that, the soil sample was destroyed as the stress increased. In addition, the moisture content loss of soil samples with 20% moisture content after 1–3 freeze–thaw cycles was measured. The actual moisture content of soil samples after one freeze–thaw cycle was 19.7%, being 19.5% after two freeze–thaw cycles and 18.7% after three freeze–thaw cycles.
The stress–strain curves of samples with moisture contents of 18% and 20% mainly show a continuous increasing trend; that is, a strain hardening phenomenon. The stress of the samples with 14% and 16% moisture content increased gradually with the increase of strain under partial confining pressure, and decreased gradually to the residual strength after reaching the peak strength. The strain softening “dilatancy” phenomenon occurred in the samples. The stress–strain curves of this test mainly included the above two types, hardening type and softening type. The degree of strain hardening and softening of loess is judged according to the absolute value of the slope of the linear stress–strain curve, after fitting the stress–strain curvature and the normalized peak stress [36]. The formula (4) is the curvature calculation formula:
ρ = 2 a 0 b 0 [ a 0 2 + 1 ] 3 2 .
In this equation, ρ is curvature at a point on the curve; a0 is the intercept of linear equations ε / δ   and   ε ;   ε   for   strain ,   δ   for   normalized   peak   stress ; b0 is gradients of linear equations ε / δ   and   ε .  Table 3 is a classification table of the hardening stress–strain curve, and Table 4 is a classification table of the softening stress–strain curve. The classification results are shown in Table 5. It can be seen that the stress–strain curves of samples with moisture contents of 14% and 16% under high confining pressure are mostly softening. Among them, the soil samples with a moisture content of 14% mainly show strain hardening under the confining pressure of 50 kPa, but when the confining pressure increases to 200 kPa and 400 kPa, the stress-strain curve begins to transform from strain hardening type to strain softening type. When the confining pressure is 50 kPa and 200 kPa, the soil sample with 16% moisture content shows a strain hardening phenomenon, but when the confining pressure increases to 400 kPa, the stress–strain curve shows a strain softening type.
This analysis showed that the internal disturbance forms of samples with 14% and 16% moisture content were different under different confining pressures, resulting in two kinds of stress–strain curve. Freeze–thaw cycles caused local disturbance inside the soil. Under the action of low stress, the soil sample entered the “shear contraction” stage, and the pore water pressure did not change. The soil particles were gradually compacted under the action of the external load, and the total stress intensity increased, so that the strain hardening phenomenon was shown. Under the action of high stress, the soil sample entered the “dilatancy” stage. The dilatancy cracks appeared at the end of the sample, and the pore water pressure decreased. The soil particles were further compacted under the action of the external load, and the total stress decreased. Therefore, the strain softening phenomenon was shown.

3.2.2. Effects of the Number of Freeze–Thaw Cycles on Shear Strength Parameters

Based on the Mohr–Coulomb strength criterion, the shear strength was defined by the rock-soil body’s internal friction angle and cohesion. Taking the number of freeze–thaw cycles and moisture content as X and Y axes, and the cohesion or internal friction angle as Z axis, three-dimensional cloud images of the change of cohesion or internal friction angle with the number of freeze–thaw cycles and moisture content were drawn, as shown in Figure 11.
As shown in Figure 11a,b, during the freeze–thaw process, soil cohesion showed a variation pattern of increase–decrease–increase–decrease with the increasing number of freeze–thaw cycles. The cohesion of samples with medium moisture contents of 16% and 18% far exceeded that of those with high and low moisture contents (14% and 20%). However, the effective cohesion increased initially and subsequently decreased. In Figure 11a, we see that the high-moisture-content sample’s cohesion increased after a freeze–thaw cycle. However, the low-moisture-content samples showed a slight change; after three freeze–thaw cycles, the cohesion of the samples with moisture contents of 14% and 18% dropped significantly; after five freeze–thaw cycles, the cohesion increased; and afterward, the overall cohesion rose with increased freeze–thaw cycles.
Both the cohesion and effective cohesion first increased and then decreased with the increased soil moisture content. After one and seven freeze–thaw cycles, the sample’s cohesion and effective cohesion first dropped, then increased, and finally fell. For samples with the same moisture content, the cohesion first increased and then dropped with the increasing number of cycles, which changed significantly after the third and fifth freeze–thaw cycles.
Figure 11c,d shows that, during the freeze–thaw cycles, both the internal friction angle and effective internal friction angle first increased, then decreased and rose, and finally maintained transient stability. After three and seven freeze–thaw cycles, the soil’s internal friction angle increased significantly. After five freeze–thaw cycles, the soil’s internal friction angle dropped demonstrably. For the soil sample with a moisture content of 16%, the internal friction angle dropped steadily and then stabilized.
The internal friction angle first increased and then dropped with the high moisture content, while the effective internal friction angle was slightly changed.
In the process of freeze–thaw cycles, the overall change of soil internal friction angle was small, the general range of change was between 3% and 5%, but the cohesive force fluctuated repeatedly, due to water migration and morphological changes. The analysis showed that the ice crystal expansion in the positive freezing period and the thawing settlement in the positive thawing period disturbed the rock and soil many times. The change of the original contact type of soil and the friction performance between particles led to the change of the effective contact area and bonding ability between particles, and then the internal friction angle and cohesion of the soil changed.

4. Discussion

In the past, scholars laid a research emphasis on the material source of Yili Loess, while lacking a systematic investigation of the degradation mechanism of soil’s physical and mechanical properties under a freeze–thaw action [32]. Therefore, this study was necessary. Based on previous research results, in this paper, the typical loess landslide in the region was taken as the research object. Four samples with different moisture contents were prepared and subjected to different freeze–thaw cycles. The apparent characteristic changes under the action of freeze–thaw cycles were observed, and a consolidated undrained (CU) shear test was carried out. The changes of shear strength and shear strength indexes of loess samples with different moisture contents under the action of freeze–thaw cycles were studied and analyzed.
The research results of this paper were similar to those of other loess areas. Some scholars experimentally concluded that soil’s shear strength and cohesion dropped exponentially with the increasing number of freeze–thaw cycles. Nevertheless, the internal friction angle showed no variation nor clear patterns with the number of cycles [4,5]. During the research in this paper, it was found that the rock soil’s spatial structure changed with the disturbance from the expansion of ice and frost crystals at the freezing stage and the thawing collapse at the thawing stage during the freeze–thaw process, diminishing the shear strength. The effect of freeze–thaw cycles on shear strength and cohesion was obvious, which changed significantly after the third and fifth freeze–thaw cycles. In the process of freeze–thaw cycles, although the internal friction angle changed, the overall change was small, and the general range of change was between 3% and 5%.
In addition, previous studies indicated a correlation of the stress–strain curve with the number of freeze–thaw cycles and moisture content [14,15,16]. The research results of this paper also confirmed this point. Moreover, it was found that the shape of the stress–strain curve was also related to the confining pressure. The experimental data showed that the stress–strain curve of samples with high moisture content always showed strain hardening, but the hardening degree was different with the increase of freeze–thaw cycles. The stress-strain curve shape of the low moisture content sample was related to the number of freeze–thaw cycles and the confining pressure, and there were two stress–strain curves of hardening and softening.
As for the moisture content, scholars reported that the shear strength and cohesion dropped as the moisture content increased, while the internal friction angle showed only an inconspicuous or slight decrease [21,22,23,24]. However, the research in this paper showed that the cohesion and internal friction angle mainly increased at first and then decreased with the increase of moisture content. The engineering properties of the soil were the best near the optimal moisture content. The analysis showed that when the water among soil particles only provided bound water for the double electrode layer, the cohesion and internal friction angle increased with the increased moisture content. However, as the moisture content increased, the water destroyed the soil’s cementing structure when free water appeared among the soil particles. This water quickly formed ice and frost crystals during freeze–thaw cycles, leading to the appearance of frost heaving. Accordingly, the cohesion and internal friction angle dropped at a macroscopic level.
The test results in this paper can provide a reference for the study of the change of physical properties of loess in the Yili region of Xinjiang under the freeze–thaw cycle. At the same time, this experiment can also provide a reference for other similar areas. Although the properties and external conditions of loess in similar areas are different from those in this study area, the influence of moisture content and freeze–thaw cycle on loess is generalizable. Geotechnical engineers in engineering practice or disaster prevention can refer to the experimental design, methods, and results of this paper, when considering the influence of freeze–thaw cycle and moisture content on soil. Despite the specific results, the number of freeze–thaw cycles in this study was low, due to limitations such as time restraints and investigating only soil samples with different moisture contents. Future research could perform multiple freeze–thaw tests, in which the coupling effects of numerous factors, including moisture content, freeze–thaw temperature, dry density, and freeze–thaw cyclic amplitude, are taken into account. Moreover, instruments such as scanning electron microscopes and nuclear magnetic resonance spectrometers could be utilized for explaining the macro-variation mechanisms from a micro-structural perspective.

5. Conclusions

In view of the physical properties of Xinjiang loess and the uniqueness of the freeze–thaw environment, and based on apparent characteristic observation results and triaxial compression test data of different soil samples after different freeze–thaw cycles, this study analyzed the shear strength indices and their related changes in loess samples with varying moisture contents, after other freeze–thaw processes. The conclusions are as follows:
(1)
During the freeze–thaw process, the frosting rate of the sample increased with the increase of freeze–thaw cycles, accompanied by a gradual conversion from frost crystals into ice crystals. Moreover, peeling occurred on the sample surface. The distribution of crystals showed no apparent correlation with the moisture content.
(2)
The ice and frost crystals produced in the cyclic freeze–thaw process changed the soil structure and reduced the soil’s shear strength. As a result, we observed dilatancy to varying degrees during the shearing process, and the strain-softening was mainly in the 2%~7% strain range.
(3)
During freeze–thaw cycles, the number of freeze–thaw cycles differently affected the shear strength parameters. As the number of freeze–thaw cycles increased, soil cohesion first dropped, then rose, and finally fell, while the internal friction angle first increased, then dropped, and finally tended to stabilize.
(4)
The cohesion and internal friction angle mainly increased first and then decreased with the increase of moisture content. The engineering properties of the soil were the best near the optimal moisture content.

Author Contributions

Conceptualization, Z.Z.; Data curation, Z.G. and Y.M.; Formal analysis, Z.G.; Investigation, Z.G., T.L. and G.S.; Software, Y.Z.; Supervision, Z.Z. and T.L.; Visualization, Z.G. and Y.M.; Writing—original draft, Z.G.; Writing—review and editing, Z.Z., Y.Z. and G.S. All authors have read and agreed to the published version of the manuscript.

Funding

This research was funded by the Open Foundation of State Key Laboratory for Geomechanics and Deep Underground Engineering (SKLDUEK2028), the National Natural Science Foundation of China for Instability mechanism of loess landslides in Yili Valley under multiple freeze–thaw cycles (41967036) and the Special Program for Key Research and Development Tasks of Xinjiang Uygur Autonomous Region (2021B03004).

Institutional Review Board Statement

Not applicable.

Informed Consent Statement

Not applicable.

Data Availability Statement

The data used to support the findings of this study are included within the manuscript.

Conflicts of Interest

The authors declare no conflict of interest.

References

  1. Ministry of Land and Resources. Issued the 13th Five–Year Plan for National Geological Disaster Prevention and Control. China Emerg. Manag. 2016, 12, 39–44. [Google Scholar]
  2. Mikaeil, R.; Esmaeilzadeh, A.; Shaffiee Haghshenas, S.; Ataei, M.; Hajizadehigdir, S.; Jafarpour, A.; Kim, T.H.; Geem, Z.W. Evaluation of dimension stone according to resistance to freeze–thaw cycling to use in cold regions. J. Soft Comput. Civ. Eng. 2022, 6, 88–109. [Google Scholar] [CrossRef]
  3. Zhu, S.; Yin, Y.; Wang, W.; Wei, Y.; Shao, H.; Huang, Z.; Zhuang, M.; Shi, A. Mechanism of Freeze–thaw Loess Landslide in Yili River Valley, Xinjiang. Acta Geosci. Sin. 2019, 40, 339–349. [Google Scholar]
  4. Han, Y.; Wang, Q.; Wang, N.; Wang, J.; Zhang, X.; Cheng, S.; Kong, Y. Effect of freeze–thaw cycles on shear strength of saline soil. Cold Reg. Sci. Technol. 2018, 154, 42–53. [Google Scholar] [CrossRef]
  5. Kong, F.; Nie, L.; Xu, Y.; Rui, X.; He, Y.; Zhang, T.; Wang, Y.; Du, C.; Bao, C. Effects of freeze–thaw cycles on the erodibility and microstructure of soda-saline loessal soil in Northeastern China. CATENA 2022, 209 Pt 1, 105812. [Google Scholar] [CrossRef]
  6. Wang, M.; Meng, S.; Sun, Y.; Fu, H. Shear strength of frozen clay under freezing–thawing cycles using triaxial tests. Earthq. Eng. Eng. Vib. 2018, 17, 761–769. [Google Scholar] [CrossRef]
  7. Wang, L.; Zuo, X.; Zheng, F.; Wilson Glenn, V.; Zhang, X.; Wang, Y.; Fu, H. The effects of freeze–thaw cycles at different initial soil moisture contents on soil erodibility in Chinese Mollisol region. CATENA 2020, 193, 104615. [Google Scholar] [CrossRef]
  8. Cui, H.; Qin, X.; Wang, W.; Wang, P. Study on the strength and microscopic characteristics of unsaturated subgrade soil under freezing–thawing conditions. J. Glaciol. Geocryol. 2019, 41, 1115–1121. [Google Scholar]
  9. Lei, D.; Lin, H.; Chen, Y.; Cao, R. Effect of Cyclic Freezing–Thawing on the Shear Mechanical Characteristics of Nonpersistent Joints. Adv. Mater. Sci. Eng. 2019, 2019, 9867681. [Google Scholar] [CrossRef]
  10. Wang, S.; Ding, J.; Xu, J.; Ren, J.; Yang, Y. Shear Strength Behavior of Coarse–Grained Saline Soils after Freeze–Thaw. KSCE J. Civ. Eng. 2019, 23, 2437–2452. [Google Scholar] [CrossRef]
  11. Jing, X.; Cui, Z.; Doh, S.; Ma, L.; Wei, L.; Liu, D. Effect of freeze–thaw cycles on shear strength of unsaturated bentonite modified clay. Phys. Chem. Earth Parts A/B/C 2021, 121, 102955. [Google Scholar] [CrossRef]
  12. Cheng, S.; Wang, Q.; Wang, J.; Han, Y. Experimental Study on Undrained Shear Properties of Saline Soil under Freeze–Thaw Cycles. Geofluids 2021, 2021, 9987414. [Google Scholar] [CrossRef]
  13. Zheng, F.; Shao, S.; Wang, S. Influences of freeze–thaw on strength of loess under complex stress path. Chin. J. Geotech. Eng. 2021, 43 (Suppl. S1), 224–228. [Google Scholar]
  14. Zhang, W.; Ma, J.; Tang, L. Experimental study on shear strength characteristics of sulfate saline soil in Ningxia region under long–term freeze–thaw cycles. Cold Reg. Sci. Technol. 2019, 160, 48–57. [Google Scholar] [CrossRef]
  15. Yang, Z.; Zhang, Q.; Shi, W.; Lu, Z.; Tu, Z.; Ling, X. Study of a strength prediction model of unsaturated compacted expansive soil under freeze–thaw cycles. Arab. J. Geosci. 2022, 15, 130. [Google Scholar] [CrossRef]
  16. Ma, B.; Yang, G.; Tian, J.; Pan, Z.; Liu, H. Variation law of remolded loess strength under the action of freeze–thaw cycle based on nuclear magnetic resonance. Sci. Technol. Eng. 2019, 19, 318–323. [Google Scholar]
  17. Chen, S.; Luo, T.; Li, G.; Zhang, Y. Effects of Cyclic Freezing–Thawing on Dynamic Properties of Loess Reinforced with Polypropylene Fiber and Fly Ash. Water 2022, 14, 317. [Google Scholar] [CrossRef]
  18. Wang, W.; Cao, G.; Li, Y.; Zhou, Y.; Lu, T.; Zheng, B.; Geng, W. Effects of Freeze–Thaw Cycles on Strength and Wave Velocity of Lime-Stabilized Basalt Fiber-Reinforced Loess. Polymers 2022, 14, 1465. [Google Scholar] [CrossRef]
  19. Xu, J.; Ren, J.; Wang, Z.; Wang, S.; Yuan, J. Strength behaviors and meso–structural characters of loess after freeze–thaw. Cold Reg. Sci. Technol. 2018, 148, 104–120. [Google Scholar] [CrossRef]
  20. Wei, Y.; Yang, G.; Ye, W.; Wang, L. Factorial experiment on unconfined compression strength of freeze–thawing loess. J. Xi’an Univ. Sci. Technol. 2019, 39, 103–111. [Google Scholar]
  21. Ye, W.; Qiang, Y.; Jing, H.; Zou, Y. Freeze–thaw cycle experiment of loess paleosol with different moisture content based on nuclear magnetic resonance. J. Eng. Geol. 2022, 30, 144–153. [Google Scholar] [CrossRef]
  22. Ye, W.; Wei, W.; Zheng, C.; Chen, M. Effect of Initial Moisture Content on Mechanical Properties of Expansive Paleosol. J. Civ. Eng. Manag. 2019, 36, 28–32. [Google Scholar] [CrossRef]
  23. Ye, W.; Chen, Y.; Zhang, D.; Bai, Y. Macro and Micro Experimental study on the influence of Moisture migration on the strength of compacted loess under freeze–thaw cycling. China J. Highw. Transp. 2021, 34, 27–37. [Google Scholar] [CrossRef]
  24. Li, B.; Ping, G.; Zhang, Y.; Yang, Q. Effects of freeze–thaw cycles on mechanical properties of loess under plane strain. J. Civ. Environ. Eng. 2021, 43, 41–48. [Google Scholar]
  25. Zhang, S.; Kuang, H.; Jin, Z.; Xu, G. An experimental study of the stress–strain characteristics of frozen silty clay with high moisture content. Hydrogeol. Eng. Geol. 2020, 47, 116–124. [Google Scholar] [CrossRef]
  26. Sun, Y.; Meng, S.; Wang, M.; Mu, H.; Tang, X. Deterioration effect of freeze–thaw on mechanical properties of roadbed clay under unfavorable conditions. Bull. Eng. Geol. Environ. 2021, 80, 4773–4790. [Google Scholar] [CrossRef]
  27. Long, J.; Zhang, L.; Xing, X.; Guo, X. Study on the strength and microstructure of loess under freezethaw based on temperature path. Coal Geol. Explor. 2021, 49, 242–249. [Google Scholar] [CrossRef]
  28. Liu, L.; Zhang, W.; Zhang, B.; Gu, Y.; Xie, B. Effect of freezing–thawing cycles on mechanical properties and microscopic mechanisms of loess. Hydrogeol. Eng. Geol. 2021, 48, 109–115. [Google Scholar] [CrossRef]
  29. Yu, L.; Xu, X.; Qiu, M.; Yan, Z.; Li, P. Influnce of freeze–thaw on shear strength properties of saturated silty clay. Rock Soil Mech. 2010, 31, 2448–2452. [Google Scholar] [CrossRef]
  30. Li, S.; Li, Y.; Gao, X.; Shi, D. Effect of freezing and thawing on shear strength of intact loess. J. Civ. Environ. Eng. 2020, 42, 48–55. [Google Scholar]
  31. Zhang, A.; Xing, Y.; Hu, X.; Wang, H.; Guo, M.; Zhang, B.; Gao, Y. Influence factors of strong self–weight collapsibility of Ili loess. Chin. J. Geotech. Eng. 2016, 38 (Suppl. S2), 117–122. [Google Scholar]
  32. Zeng, M.; Song, Y. Mineral Composition and Their Weathering Significance of Zhaosu Loess–Paleosol Sequence in the Ili Basin. Xinjiang Geol. Rev. 2013, 59, 575–586. [Google Scholar]
  33. Lv, Q.; Zhang, Z.; Zhang, T.; Hao, R.; Guo, Z.; Huang, X.; Zhu, J.; Liu, T. The Trend of Permeability of Loess in Yili, China, under Freeze–Thaw Cycles and Its Microscopic Mechanism. Water 2021, 13, 3257. [Google Scholar] [CrossRef]
  34. Mo, T.; Guo, M.; Lou, Z.; Gao, Y. The Effect of Moisture Content on Deformation and Shearing Characteristics of Ili Loess. China Rural. Water Hydropower 2018, 4, 87–90, 94. [Google Scholar]
  35. GB/T 50123-2019; The Standard for Geotechnical Testing Method. Ministry of Housing and Urban–Rural Development of the People’s Republic of China. China Planning Press: Beijing, China, 2019.
  36. Wu, X.; Liang, Q.; Niu, F.; Li, C. Study on Hardened and Softened Classification in Shear test. Chin. J. Undergr. Space Eng. 2017, 13, 1457–1466. [Google Scholar]
Figure 1. Location of study area.
Sustainability 14 11357 g001
Figure 2. Distribution map of landslides in the study area.
Sustainability 14 11357 g002
Figure 3. Particle grading curve of soil samples.
Sustainability 14 11357 g003
Figure 4. Flow chart of sample preparation.
Sustainability 14 11357 g004
Figure 5. Path diagram of a freeze–thaw cycle.
Sustainability 14 11357 g005
Figure 6. Programable constant temperature and humidity test chamber.
Sustainability 14 11357 g006
Figure 7. TSZ series full automatic triaxial test apparatus.
Sustainability 14 11357 g007
Figure 8. The apparent characteristics of different soil samples after a different number of freeze–thaw cycles. (a) One freeze−thaw cycle. (b) Three freeze−thaw cycles. (c) Five freeze−thaw cycles. (d) Ten freeze−thaw cycles.
Sustainability 14 11357 g008
Figure 9. Field investigation photos. (a) Frost crystals. (b) Layered ice crystals. (c) Reticular ice crystals. (d) Hard ice shells.
Sustainability 14 11357 g009
Figure 10. Stress–strain curves of various soil samples with different moisture contents after different numbers pf freeze–thaw cycles. (a) Zero freeze−thaw cycles. (b) One freeze−thaw cycle. (c) Three freeze−thaw cycles. (d) Five freeze−thaw cycles. (e) Seven freeze−thaw cycles. (f) Ten freeze−thaw cycles.
Sustainability 14 11357 g010
Figure 11. Variations of cohesion and internal friction angle with the number of freeze–thaw cycles and moisture content. (a) Effect of freeze–thaw cycles and moisture content on cohesion. (b) Effect of freeze–thaw cycles and moisture content on effective cohesion. (c) Effects of freeze–thaw cycles and moisture content on the internal friction angle. (d) Effects of freeze–thaw cycles and moisture content on the effective internal friction angle.
Sustainability 14 11357 g011
Table 1. Primary physical indices of undisturbed loess.
Natural Density
(g·cm−3)
Natural Moisture Content
(%)
Plastic Limit
(%)
Liquid Limit
(%)
Plastic IndexLiquid IndexMaximum Dry Density
(g·cm−3)
Optimum Moisture Content
(%)
1.9420.2522.8530.557.70−0.341.7418.5
Table 2. Extreme temperatures during freeze–thaw period in the study area in the last ten years.
YearMonthExtreme High Temperature
(°C)
Extreme Low Temperature
(°C)
YearMonthExtreme High Temperature
(°C)
Extreme Low Temperature
(°C)
201126−142016216−17
320−11326−4
201228−172017210−16
323−9324−6
201327−172018213−14
326−4325−5
201427−21201928−18
322−11324−3
2015210−112020212−9
324−7320−9
Table 3. Types and classification criteria of hardening.
Hardening DegreeHighly HardenedGeneral HardenedWeakly Hardened
ρ <0.10.1~0.4>0.4
Table 4. Types and classification criteria of softening.
Softening DegreeHighly SoftenedGeneral SoftenedWeakly Softened
|k|>1.00.1~1.0<0.1
Table 5. Classification results of hardening-softening degree.
SampleHardening/Softening DegreeSampleHardening/Softening Degree
ω = 1 4%, σ3 = 50 kPaD = 0General hardened ω = 1 6%, σ3 = 50 kPaD = 0Weakly hardened
D = 1Weakly hardenedD = 1General hardened
D = 3Weakly hardenedD = 3Weakly hardened
D = 5Weakly hardenedD = 5Weakly hardened
D = 7Weakly hardenedD = 7General hardened
D = 10Weakly softenedD = 10Weakly hardened
ω = 1 4%, σ3 = 200 kPaD = 0Weakly hardened ω = 1 6%, σ3 = 200 kPaD = 0General hardened
D = 1Weakly softenedD = 1Weakly hardened
D = 3Weakly hardenedD = 3Weakly hardened
D = 5Weakly softenedD = 5Weakly hardened
D = 7Weakly softenedD = 7Weakly hardened
D = 10Weakly hardenedD = 10Weakly hardened
ω = 1 4%, σ3 = 400 kPaD = 0Weakly softened ω = 1 6%, σ3 = 400 kPaD = 0Weakly softened
D = 1Weakly softenedD = 1Weakly softened
D = 3Weakly softenedD = 3Weakly softened
D = 5Weakly softenedD = 5Weakly softened
D = 7Weakly hardenedD = 7Weakly softened
D = 10Weakly softenedD = 10Weakly softened
ω = 1 8%, σ3 = 50 kPaD = 0General hardened ω = 2 0%, σ3 = 50 kPaD = 0Weakly hardened
D = 1General hardenedD = 1Weakly hardened
D = 3Weakly hardenedD = 3Weakly hardened
D = 5Weakly hardenedD = 5Weakly hardened
D = 7Weakly hardenedD = 7Weakly hardened
D = 10General hardenedD = 10General hardened
ω = 1 8%, σ3 = 200 kPaD = 0General hardened ω = 2 0%, σ3 = 200 kPaD = 0Weakly hardened
D = 1Weakly hardenedD = 1Weakly hardened
D = 3Weakly hardenedD = 3General hardened
D = 5General hardenedD = 5Weakly hardened
D = 7Weakly hardenedD = 7Weakly hardened
D = 10Weakly hardenedD = 10Weakly hardened
ω = 1 8%, σ3 = 400 kPaD = 0Highly hardened ω = 2 0%, σ3 = 400 kPaD = 0General hardened
D = 1General hardenedD = 1General hardened
D = 3Highly hardenedD = 3Weakly hardened
D = 5Weakly hardenedD = 5Weakly hardened
D = 7Weakly hardenedD = 7Weakly hardened
D = 10General hardenedD = 10Weakly hardened
Publisher’s Note: MDPI stays neutral with regard to jurisdictional claims in published maps and institutional affiliations.

