Article

Under the Background of AI Application, Research on the Impact of Science and Technology Innovation and Industrial Structure Upgrading on the Sustainable and High-Quality Development of Regional Economies

1
School of Economics, Tianjin University of Finance and Economics, Tianjin 300222, China
2
School of Economics and Management, Guangxi Normal University, Guilin 541000, China
3
South China Business College, Guangdong University of Foreign Studies, Guangzhou 510545, China
4
School of Business, Macau University of Science and Technology, Macau SAR 999078, China
*
Author to whom correspondence should be addressed.
Sustainability 2022, 14(18), 11331; https://doi.org/10.3390/su141811331
Submission received: 10 August 2022 / Revised: 2 September 2022 / Accepted: 6 September 2022 / Published: 9 September 2022
(This article belongs to the Special Issue Artificial Intelligence Applications for Sustainable Urban Living)

Abstract

:
In the opening year of the 14th Five-Year Plan, China has made significant progress in upgrading its industrial structure and improving the quality of economic growth based on the goal of technological self-sufficiency and self-improvement, and more and more artificial intelligence is being used in the market. Artificial intelligence is playing an important role in the innovation and market construction of the economy. This manuscript constructs a spatial Durbin model by measuring the level of science and technology innovation and sustainable high-quality economic development of 283 prefecture-level cities in China from 2010–2019, and explores the effects and mechanisms of science and technology innovation in promoting the sustainable high-quality economic development of Chinese cities under the background of AI application. It is found that China’s science and technology innovation not only promotes the improvement of economic quality in the region, but also has positive spatial spillover, leading to the improvement of economic quality in neighboring regions. In combination with this established background, this manuscript introduces the variable of industrial structure upgrading and explores its mechanism of action in this field. Research shows that industrial structure upgrading is an important transmission path for science and technology innovation to promote sustainable and high-quality economic development. At the same time, considering the impact of the interaction between science and technology innovation and industrial structure upgrading on the sustainable and high-quality development of regional economy, this manuscript also constitutes an innovative study. Therefore, the government should continuously promote science and technology innovation and industrial structure upgrading, take advantage of China’s mega-market, make full use of the spatial spillover effect, guide the effective allocation of innovation resources, promote the orderly flow and reasonable allocation of innovation factors, and improve the institutional mechanism for promoting the market-oriented application of independent innovation results to support sustainable and high-quality economic development.

1. Introduction

General Secretary Xi Jinping said, “With one heart and one mind in innovation and one heart and one mind in development, the future of China’s economic development will definitely be brighter” [1]. To generate new development momentum with scientific and technological innovation and to achieve high-quality development, we must achieve innovation-driven organic growth and accelerate our country’s “intensive growth” towards technological innovation and industrial structure upgrading. AI application has become the main battlefield of the international strategic game [2]. In 2020, a new generation of AI technology accelerated its deep integration and application in various industries [3,4,5,6], which promoted the accelerated leap from digitalization and networking to intellectualization in all fields of the economy and society. At present, the impact of science and technology innovation and industrial structure upgrading on economic growth has received wide attention from scholars, but there is still a lack of authoritative research on how science and technology innovation and industrial structure upgrading promote the sustainable and high-quality development of China’s regional economies in the new era, under the background of the application of AI technology innovation; therefore, it is of great practical significance to study the impact of the interaction between science and technology innovation and industrial structure upgrading on the sustainable and high-quality development of regional economies.
Regional innovation capacity is an integral part of the national technology innovation system, and enhancing regional innovation capacity is an essential cornerstone for promoting sustainable and high-quality regional economic development, improving national innovation ability, and building an innovative country. In November 2020, China Academy of science and technology development published the “China Regional Technology Innovation Evaluation Report 2020” (from now on referred to as “report”), which systematically evaluated and analyzed the innovation capacity of thirty-one provinces (autonomous regions and municipalities directly under the central government) in China, from this comprehensive index of regional innovation, the overall innovation capacity of China shows regional imbalance, inefficient development and low economic efficiency. In addition, in some places where technological innovation is weak, there are also long-term characteristics of single-pillar industries, high consumption of resources and low development innovation capacity, and these regions have severe industrial-development-path dependence and stagnant industrial structure upgrading, which, in turn, lead to the poor quality of economic development within the region [7].
Due to this, this manuscript takes 283 prefecture-level cities in China from 2000–2019 as research samples, constructs a benchmark model and spatial model, crawls the panel data of sustainable and high-quality economic development, science and technology innovation and industrial structure upgrading in the database by employing Python, and conducts benchmark regression analysis on the obtained data. The finding shows that science and technology innovation can significantly promote economic-quality development. From the spatial spillover perspective, a spatial Durbin model is constructed to explore the effect and mechanism of science and technology innovation to promote the sustainable and high-quality economic development of Chinese cities. It is found that science and technology innovation not only promotes economic quality in the region but also drives the improvement of economic quality in surrounding regions. In combination with this established background, this manuscript innovatively introduces the variable of industrial structure upgrading to explore its mechanism of action in this field. The study shows that promoting industrial structure upgrading is a vital transmission path for science and technology innovation to promote the high-quality development of the urban economies. At the same time, considering the impact of the interaction and correlation between science and technology innovation and industrial structure upgrading on the sustainable and high-quality development of the regional economy, this manuscript indicates the synergistic effect of science and technology innovation and industrial structure upgrading by constructing the interaction term between them, and the study finds that science and technology innovation and industrial structure upgrading have coupled synergistic effect and jointly support the sustainable and high-quality development of the regional economy.
According to Sun Qixiang [8], science and technology innovation affects the quality of economic development through the cooperative effect of factors; Li Feng [9] divided China into three regions, namely, the eastern, central and western regions, to study the impact of science and technology innovation on high-quality economic development, and concluded that industrial structure upgrading plays a mediating role in the process of science and technology innovation’s impact on high-quality economic development; Li Xiang [10] found, through his research, that there is a threshold effect between science and technology innovation; Li Xiang [10] found that there is a threshold effect between science and technology innovation and industrial structure upgrading, and the two can better play the role of promoting economic growth when they match each other; Ren Xiaoyan [11] also found that the synergistic effect of technological innovation and industrial structure upgrading can significantly promote the high-quality development of China’s economy; while Li Zheng [12] found that industrial upgrading has a suppressive effect on economic growth, but a linkage mechanism can be formed between industrial upgrading, science and technology innovation and economic growth.
The contributions of this study are as follows: First, few studies integrate scientific and technological innovation, industrial structure upgrading and the sustainable and high-quality development of regional economies into the same research framework. This manuscript innovatively combines the three to expand upon the existing literature and research. Second, in this framework, the existing literature lacks a large-sample, spatial study approach to explore in depth the impact of the interaction between science and technology innovation and industrial structure upgrading on sustainable and high-quality economic development, as well as the fact that existing studies only consider innovation as a mediating variable for industry to influence economic quality, while, in fact, industrial evolution also has a feedback effect on innovation. This manuscript attempts to explain how scientific and technological innovation mainly affects economic development in the context of AI application, and clarifies the impact of scientific and technological innovation on the upgrading of industrial structure and the sustainable and high-quality development of regional economies, which has great theoretical and practical significance. Third, it attempts to complement the empirical methods of research in this field. Focusing on the impact of scientific and technological innovation on the region, the temporal and spatial evolution characteristics and impact relationship between scientific and technological innovation and the sustainable and high-quality development of the regional economy are discussed in more detail.

2. Theoretical Analysis and Research Hypothesis

2.1. The Sustainable and High-Quality Development of the Regional Economy under the Science and Technology Innovation Scenario

Science and technology innovation is innovation in an open environment; the spatial spillover effect generated by science and technology innovation can produce demonstration and imitation effects on other regions through inter-regional information exchange, human-capital and technological-capital spillover, and inter-regional industrial linkage, thus encouraging technologically “backward” regions to accelerate their transformation and catch-up speed by learning from and studying these experiences [13].
Regarding the relationship between science and technology innovation and sustainable high-quality economic development, in a study by Shi-Bo et al. [14], it was pointed out that the high-quality development of the urban economy in the Yellow River Basin cannot be achieved without the improvement of the region’s science and technology innovation level. The Yellow River Basin is a vast area with a large population. With the improvement of the urbanization level, the government’s expenditure on science and technology innovation has increased in recent years, which is also one of the driving forces of high-quality urban economic development. Ding Chenhui et al. [15] argue that the digital economy has two essential characteristics: compressing spatial and temporal distances, enhancing the breadth and depth of inter-regional economic activity linkages, and the impact of the digital economy on high-quality development forms a positive spatial spillover effect. Since technologies can also enhance the breadth of inter-regional economic activity linkages, it can also be argued that science and technology innovations can drive sustainable and high-quality economic development and have positive spatial spillover effects.
Regarding analyzing and measuring the coupling degree of science and technology innovation on high-quality economic development, Xie Siwei et al. [16] take the Beijing-Tianjin-Hebei region as their research object. They measure the coupling relationship between science and technology and economic development in terms of the regional economy’s innovation, coordination, robustness, sharing and ecology. Wei Wei et al. [17] apply the grey correlation and coupling coordination model to measure the correlation order and coupling coordination degree between science and technology innovation subsystems and high-quality economic development. Yang Weili et al. [18] empirically find that the innovation efficiency of cities in Shaanxi Province gradually tends to be coordinated with the level of high-quality economic development, but the coupling degree varies significantly between cities. Based on the above analysis, the following research hypotheses are proposed in this manuscript.
H1. 
Science and technology innovation has a positive contribution effect on the sustainable high-quality development of a region’s economy.
H2. 
Science and technology innovation has a positive spatial spillover effect on sustainable high-quality economic development in other regions.

2.2. The Mediating Role of Industrial Structure Upgrading

Indirect Effects of Science and Technology Innovation

Innovation brings new momentum to industrial development and is the key to industrial structure optimization and upgrading. Innovation creates industrial agglomeration and efficiency improvement through the introduction, digestion and absorption of new technologies, which is conducive to the adjustment and upgrading of industrial structures. From the perspective of a spatial spillover effect, Ruijun Duan [19] studied the impact of technological innovation on industrial structure upgrading from different levels, and found that technological progress and technical efficiency have significant promotion and spatial spillover effects on industrial structure upgrading in local and neighboring areas from the national level. Li Honghan [20] proposes that technological innovation promotes industrial structure upgrading in the region and has a spatial spillover effect on industrial structure upgrading in extra-territorial regions. In addition, there is spatial dependence on industrial structure upgrading among provinces, and workforce-innovation input, capital-innovation input, environmental-innovation input, and urban-innovation input all have a spatial spillover effect on industrial structure upgrading. Industrial structure upgrading is the main driving force in promoting economic growth or sustainable high-quality economic development. Chen Hua [21] believes that there is a long-term balanced and synergistic relationship between industrial structure upgrading and China’s economic growth and that industrial structure upgrading benefits China’s sustained economic growth. Chang-Tai Hsieh [22] argues that the transfer of production factors to more productive sectors in the process of industrial restructuring would lead to a change in the distribution of production factors among different industries, thus promoting economic growth; Erumban [23] argues that the optimization of industrial structure helps to improve labor productivity and its effect on economic growth is positive. There is a two-way promotion and cause-and-effect relationship between industrial structure upgrading and high-quality economic development. Jia Hongwen [24] argues that technological innovation can correct the negative effect of industrial structure upgrading on economic quality development, thus indirectly promoting economic-quality development. There is a dual path for the impact of technological innovation on economic quality development. Based on the above analysis, this manuscript proposes the following research hypothesis:
H3. 
Science and technology innovation promotes the sustainable and high-quality development of regional economies by optimizing industrial structure.

2.3. The Interaction between Science and Technology Innovation and Industrial Structure Upgrading

The interaction between science and technology innovation and industrial structure upgrading is significant for the dynamic development of sustainable high-quality economic development. Science and technology innovation can effectively promote industrial integration, and, as the level of technology improves, specific similar industries will become technologically integrated, promoting the transformation and upgrading of traditional industries. Thus, promoting industrial innovation and development, science and technology innovation can stimulate the market vitality of enterprises, thus improving the supply of products and services. At the same time, the upgrading of industrial structure can also cause the improvement of the innovation environment by gathering capital, facilities and services and effectively improve the output of innovation results; at the same time, the process of upgrading industrial structure will generate the demand for new processes and technologies, which will lead to technological innovation. There is close intrinsic cooperation between the two, and they influence each other. Research shows that only when science and technology innovation and industrial structure upgrading reach a dynamic match, can the interaction between the two effectively promote the effect of sustainable and high-quality economic development. Based on the above analysis, this manuscript proposes the following research hypothesis:
H4. 
The interaction between science and technology innovation and industrial structure upgrading has a positive effect on the sustainable high-quality development of a region’s economy.
The following Figure 1 is the mechanism diagram of science and technology innovation and industrial structure upgrading on the sustainable and high-quality development of regional economies. The dotted line indicates the interaction between science and technology innovation and industrial structure upgrading, which, in turn, has an impact on the sustainable and high-quality development of regional economies.

3. Research Design

3.1. Benchmark Model Construction

In order to test the effect of science and technology innovation to promote sustainable high-quality economic development, this manuscript constructs the following benchmark model with reference to Guo Zhigang [25], Ren Xiaoyan [11] and others on the impact of science and technology innovation and industrial structure on economic growth, and Su Jinqi [26] on the impact of digital economy on industrial structure upgrading.
h q e d i t = α 0 + α 1 i n n o v a t i o n i t + α c Z i t + μ i + δ t + ε i t
where i n n o v a t i o n i t is the level of science and technology innovation in city i in period t , and h q e d i t is the level of sustainable and high-quality economic development of city i in period t. Z i t is the set of control variables, μ i is the individual fixed effect, δ t is the time fixed effect, and ε i t is the random error term. To avoid the influence of inter-city correlations on the study findings, the standard errors are clustered to the city level in this manuscript. The estimated coefficient α 1 indicates the identification of the causal effects of science and technology innovation and sustainable high-quality economic development: α 1 > 0 indicates that science and technology innovation can promote sustainable and high-quality urban economic development,   α 1 < 0 indicates that science and technology innovation inhibits sustainable and high-quality urban economic development, and   α 1 = 0 indicates that there is no significant relationship between science and technology innovation and sustainable high-quality urban economic development.

3.2. Spatial Model Construction

In this manuscript, we employ a combination of a geographic-distance spatial weight matrix and economic-distance matrix for spatial measurement analysis as follows.
(1) Geographical-distance matrix ( W d i s ). According to the first law of geography [27], the geographic-distance matrix is constructed by the reciprocal of the geographic distance between two regions. The closer the geographic distance between two regions is, the greater the weight assigned to it. Therefore, firstly, this manuscript constructs a geographic matrix based on the geospatial attributes of each city W d i s . The geographic-distance spatial weight matrix is set as follows:
W d i s = 1 / d i j
d i j = a r c o s s i n Φ i × s i n Φ j + c o s Φ i × c o s Φ j × c o s Δ τ × R
W d i s is the geographic distance matrix. d i j is geographical distance; Φ i and Φ j denote the latitude and longitude of the city, respectively; Δ τ is the difference in longitude between two cities; and R is the radius of the ball.
(2) Economic-distance matrix ( W e c o ). Since geographically adjacent areas are not economically interrelated, drawing on Hu Sen [28] we construct an economic-distance matrix with the GDP-per-capita indicator of each city in 2019, W e c o . The economic-distance matrix is set as follows:
W e c o = 1 / P G D P j P G D P i / P G D P j + P G D P i
W e c o is the economic-distance matrix, and P G D P i and P G D P j  denote the GDP per capita of cities i and j, respectively.
Using the Wald test, LR test, comparison of model goodness of fit and comparison of great likelihood log-likelihood, in this manuscript, we refer to Liyuan Shi et al. [29] model, based on the spatial Durbin model, to study the influence mechanism of industrial structure on the regional-economic-growth effect and choose the spatial Durbin model to estimate its spatial effect. The specific setting is to construct different spatial Durbin models based on Equation (1) and two spatial weight matrices, as follows:
h q e d i t = α 0 + α 1 j W i j h q e d i t + α 2 i n n o v a t i o n i t + α 3 j W i j i n n o v a t i o n i t   + α 4 Z i t + α 5 j W i j Z i t + v t + w i + u i t
α 1 is the spatial autoregressive coefficient, which represents the influence of neighboring cell variables on the explained variables on this spatial cell; α 2 represents the science and technology innovation coefficient; α 3 and α 5 represent the coefficients by which the regional observations are influenced by the independent variables from other regions; α 4 is the control variable coefficient; α 0 is the constant term; u i t is the perturbation term; i represents space; t represents time; v t and w i are the space-specific and time-specific effects, respectively; W i j is the weight matrix.

3.3. Variable Measures and Descriptions

3.3.1. Measuring the Level of Sustainable High-Quality Economic Development

Although there is consensus in the academic community that total factor productivity has become as an important factor for the high-quality growth of the economy, it is obviously not sufficient for research needs only as an evaluation indicator of high-quality economic development due to its volatility of measurement and single dimensionality. According to Marxism, the theoretical basis of systematic sustainable development includes the harmonious relationship between human and nature [30], and the sustainable development of the economy has something in common with the sustainable development of Marxism [31]; however, unlike the traditional target framework based on the growth of material wealth, the sustainable high-quality development of the economy is added to the new development concept [32,33], which includes economic, social, environmental [15] and many other aspects of high-quality development also imply that current development should not be at the expense of future and next-generation development, and that people’s welfare level should be continuously and steadily enhanced while meeting current development needs. Therefore, in this manuscript, we refer to Wang Wenju’s study on the high-quality development of the Beijing economy [34], Ren Haiwei’s study on the construction of an economic-quality-evaluation index system [35], and Chenhui Ding’s [15] study on the measurement of indicators for sustainable and high-quality development of environmental economy, and set a multidimensional evaluation system consisting of four secondary indicators, including economic growth, resource allocation efficiency, social security, and ecological protection, as shown in Table 1. In this manuscript, the entropy value method is used for the calculation of index weights, and the final index of the sustainable and high-quality economic development of Chinese cities from 2000 to 2019 is obtained.

3.3.2. Science and Technology Innovation Level Measurement

For the index system of the scientific and technological innovation level, scientific and technological innovation is not only measured from investment and patent achievements; more depends on the role of technological innovation achievements in reality and their practical significance. Li Lianshui [36], on the new manufacturing research, from the four levels of industrial-enterprises R & D, product development, patent and technology transformation built an index to comprehensively measure technology innovation level, driven by science and technology innovation, which creates a good innovation environment for enterprises, strengthens the industrial aggregation and scientific and technological innovation collaborative economic growth effect.
This manuscript argues that, to measure the impact of the science and technology innovation on economic growth, we should mainly analyze the science and technology innovation output, so that the resulting innovation evaluation is more objective and realistic. Thus, the manuscript uses the China Regional Innovation and Entrepreneurship Index, which is compiled by the Enterprise Big Data Research Center of Peking University, to measure the regional science and technology innovation capability, examines the actual output of enterprise innovation and entrepreneurship within the region, and provides a more objective and realistic evaluation of innovation and entrepreneurship.

3.3.3. Mediating Variables

Industrial structure upgrading i s u : industrial structure upgrading is divided into industrial structure rationalization i s u 1 and industrial structure advanced i s u 2 . Industrial structure rationalization refers to the degree of inter-industry structural transformation ability and effective use of resources. In this manuscript, the inverse of the Thayer index is used to measure the level of industrial structure rationalization, and the calculation formula is:
r i s = 1 T L = 1 i = 1 3 Y i Y l n Y i L i / Y L  
where T L denotes the Thiel index, Y denotes output value, L denotes employment, i denotes industry, and n denotes the number of industrial sectors. A smaller value of r i s means a higher level of industrial structure rationalization.
Advanced industrial structure: Referring to the method used by Guo Bingnan [37], the proportion of the output value of primary industry, secondary industry, and tertiary industry to GDP is applied as one component of the spatial vector, which constitutes the three-dimensional vector X 0 = x 1 , 0 , x 2 , 0 , x 3 , 0 . In addition, the angles θ 1 ,   θ 2 ,   θ 3 of X 0 are measured and the vectors X 1 = 1 , 0 , 0 , X 2 = 0 , 1 , 0 ,   X 3 = 0 , 0 , 1 arranged from low to high by industry, respectively.
θ j = a r c c o s i = 1 3 X i j , X i o i = 1 3 X i j 2 1 / 2 i = 1 3 X i 0 2 1 / 2  
W = K = 1 3 j = 1 K θ j  

3.3.4. Control Variables

In order to more comprehensively analyze the effect of science and technology innovation on the sustainable high-quality development of urban economy, it is also necessary to set control variables that may have an impact on the sustainable high-quality development of an urban economy, as follows: population density p n d , expressed as the ratio of total population to the area of the urban area at the end of the year; openness of foreign investment f d i , measured by the ratio of FDI to GDP of the city where it is located; degree of financial development f i n , measured by the amount of loans from financial institutions as a ratio of GDP; urbanization rate u r b a n , measured by the ratio of non-agricultural population to year-end resident population; and infrastructure completeness t r a n s , measured as road miles/total area of the region.

3.4. Data Sources and Descriptive Statistics

This manuscript uses the study sample of 283 prefecture-level cities in China from 2000–2019. To exclude the effect of heteroskedasticity on the model, logarithmic forms of all variables are used in this manuscript. In addition, to exclude the influence of extreme values on the study findings, the manuscript carries out a top and bottom 1% tailing process for each indicator. Meanwhile, the correlation test shows that the correlation coefficients between the main variables are relatively small, do not exhibit severe multicollinearity problems, and are suitable for inclusion in the regression equation. The relevant data in this manuscript are obtained from the China City Statistical Yearbook, Global Statistical Data/Analysis Platform, Guotaian Database, and Wind. The data of science and AI technology innovation level measurement are obtained from Center for Enterprise Research. Descriptive statistics of the data are shown in Table 2.

4. Empirical Analysis of the Impact of Science and Technology Innovation on Sustainable High-Quality Economic Development

4.1. Benchmark Regression Results

Table 3 reports the estimation results of technological innovation affecting sustainable high-quality economic development. In both model (1) and model (6), the estimated coefficients of the core explanatory variable technological innovation (innovation) are significantly positive, regardless of the inclusion of control variables, controlling for time and personal effects, and the coefficient of the model (6) is slightly more extensive compared to model (1). This shows that the impact of science and technology innovation on sustainable high-quality economic development is underestimated if control variables are not considered, which also verifies that science and technology innovation can significantly contribute to sustainable high-quality economic development. Therefore, the research hypothesis that science and technology innovation promotes sustainable high-quality economic development is corroborated.
In terms of the local effects of the control variables, there are significant positive effects of the degree of financial development (fin), urbanization rate (urban) and infrastructure improvement (trans) on the sustainable and high-quality development of a region’s economy. At the same time, the coefficients of population density (pnd) and openness to foreign investment (fdi) are significantly negative. The financial support provided by financial agglomeration for the technological progress of enterprises is a guarantee that enterprises will achieve innovation. Financial agglomeration promotes innovation through knowledge spillover and competitive mechanisms, thus contributing to scientific and technological progress and sustainable high-quality economic development. The agglomeration effect brought about by urbanization leads to the upgrading of production and consumption through an advanced industrial structure, which, in turn, improves the efficiency of economic operation and contributes to sustainable high-quality economic development. As a major component of infrastructure, transportation facilities make it possible for cities to be more closely connected to each other, and for industry clustering, factor flow, science and technology spillover and information resource sharing between cities to be more efficient, thus promoting sustainable high-quality economic development. Population agglomeration promotes economic agglomeration while increasing labor productivity, and economic agglomeration often corresponds to a larger share of secondary industries than tertiary industries, which implies a high share of highly polluting industries, and an increase in carbon emissions can have a dampening effect on sustainable high-quality economic development. Some enterprises in developed countries, in order to avoid stringent environmental regulations, will shift production processes with high carbon emissions to developing countries, which will eventually lead to the latter bearing the consequences of increased carbon emissions and, thus, inhibit sustainable high-quality economic development.

4.2. Spatial Spillover Effect

Before conducting the benchmark regression, a spatial autocorrelation test using the global Moran index is needed to examine the spatial aggregation of science and technology innovation and sustainable and high-quality economic development. Table 4 reports the spatial correlation of the variables. The Moran test values of science and technology innovation and sustainable high-quality economic development indices from 2000 to 2019 are both positive. They pass the 1% significance level test, indicating some spatial autocorrelation between science and technology innovation and sustainable high-quality economic development in China, specifically in the form of positive spatial aggregation.
Table 5 reports the results of the spatial regression model of science and technology innovation on sustainable high-quality economic development under the two different spatial weight matrices. Before that, in order to select the appropriate spatial econometric model, the SDM model with dual spatio-temporal fixed effects was identified as the optimal choice from the LM test, SDM model fixed effects, Hausman test, and SDM model simplified test, in turn. The results in Table 5 show that there is a core explanatory variable, i.e., a significant positive effect of science and technology innovation in the region on sustainable and high-quality economic development. The spatial autoregressive coefficient of science and technology innovation in the SDM model is significantly positive, indicating that science and technology innovation supports the sustainable and high-quality development of a region’s economy while also providing support for the development of other regions due to its external effects.
The SDM coefficient estimation results do not reflect the marginal effects of each variable, so it is necessary to use partial differential decomposition and analyze each variable’s direct and indirect effects. Since Table 6 indicates that science and technology innovation can significantly contribute to sustainable high-quality economic development in the regions, innovation, as the most important feature of sustainable high-quality economic development, forms new industrial competitiveness through the cumulative and embedded effects of science and technology innovation and ultimately achieves sustainable and high-quality economic development. As a result, H1 can be verified. The indirect effect of science and technology innovation is significantly positive, indicating a spatial spillover effect, and local science and technology innovation can lead to sustainable and high-quality economic development in neighboring regions. The successful practical experience of science and technology innovation in some regions can produce demonstration and imitation effects in other regions through inter-regional information exchange and science and technology spillover, thus encouraging technologically “backward” regions to accelerate their transformation and catch-up speed by learning from and studying these experiences. In addition, the technological transformation of regional economies implies a corresponding technological shift in their economic growth patterns. In addition, the optimal adjustment of economic growth patterns will be transmitted to economically connected regions through inter-regional industrial linkages under market mechanisms, thus facilitating the generation of new economic growth points in economically connected regions and driving the synergistic transformation of economic growth patterns in these regions. H2 is verified.

4.3. Robustness Tests

4.3.1. Robustness Analysis of Indicator Replacement

Considering the impact of differences in indicator measures on the findings, this manuscript performs robustness tests by replacing the core explanatory and explanatory variables. Due to the traditional economic growth measurement model, price distortion among different regions and the artificial promotion incentives of officials, nighttime satellite light data are relatively objective, have high geospatial resolution and can truly reflect the economic development of a country or region. As the nighttime light data from 2000–2019 is derived from different satellite extracts, with inconsistent measurement scales and errors, the original light data needs to be corrected. Regarding existing scholars’ studies, this manuscript selects Jixi City, Heilongjiang Province, as the base correction site, which satisfies the calibration criteria of stable development and small changes in light brightness, and the specific correction method is described in the notes. Ejermo Olof [38] argues that patent indicators are widely used in measuring regional innovation efficiency and are reliable indicators of the output level of regional innovation activities. Therefore, in this manuscript, the number of patents granted to prefecture-level cities is selected as a proxy variable for technological innovation and is subjected to a robustness test, denoted as a patent.

4.3.2. Excluding the Sample of Municipalities

As the frontier of reform and opening up and the regional economic center, municipalities are better than the general prefecture-level cities in terms of policy support and capital financing. Therefore, in this manuscript, the four municipalities directly under the Central Government of Beijing, Tianjin, Shanghai and Chongqing are excluded from the sample, and only the sample of general prefecture-level cities is retained for re-regression.
The results of tests (1) and (2) of the model in Table 7 illustrate the estimated coefficients of the core explanatory variable technological innovation (innovation) with or without the inclusion of control variables, controlling for time and personal effects, are significantly positive. This is consistent with the findings of the baseline regression, indicating that the conclusions of this manuscript remain robust after replacing the explanatory variables, after changing the measurement of sustainable and high-quality economic development. Models (3) and (4) use the number of patents granted in prefecture-level cities to measure the level of science and technology innovation, and the measurement results still indicate that science and technology innovation can significantly promote sustainable and high-quality economic development. Models (5) and (6) are tested again under the condition of using the number of patents granted in prefecture-level cities to measure science and technology innovation with the adoption of nighttime light data as a proxy variable for sustainable high-quality economic development and the validation finds that science and technology innovation continues to significantly contribute to sustainable high-quality urban economic development. Therefore, the measures of science and technology innovation and sustainable high-quality economic development do not affect the core conclusions of this manuscript, and the positive driving effect of science and technology innovation on sustainable high-quality urban economic development has some credibility, which again validates the study’s H1.
The results of test (7) of the model in Table 7 illustrate that science and technology innovation still significantly promotes sustainable and high-quality urban economic development, and the exclusion of the sample of municipalities does not have a substantial effect on the estimation results, indicating that the conclusion of this manuscript is robust.

4.3.3. Different Measurement Methods

This section proposes to use different measures for robustness testing. Table 8 models (1) to (3) are regressed using panel quartiles, and the study finds that the estimated coefficients of technological innovation are significantly positive at different quantile levels. Models (4) and (5) use mixed OLS regressions, and the test results illustrate that science and technology innovation significantly and positively contributes to sustainable and high-quality economic development at the 1% level. The magnitude and sign of the coefficients remain consistent with the baseline regression when control variables are included, again validating research H1.
To further test the stage-specific impact of science and technology innovation on sustainable and high-quality economic development, this manuscript utilizes a systematic GMM model. First, from the results of the system GMM test, the test accepts the original hypothesis, the AR (1) test rejects the original hypothesis, and the AR (2) test accepts the original hypothesis, indicating the validity of the estimation results of the systematic GMM. Second, the results from model (6) and model (7) show that, with or without the inclusion of control variables, the coefficients of sustainable high-quality economic development for the lagged period are all significantly positive at the 1% level; this shows that there is a significant “path dependence” phenomenon in the time level of sustainable and high-quality economic development, and the construction of sustainable and high-quality economic development can never be achieved overnight but requires the passage of time. After adding the control variables, each one-unit improvement in science and technology innovation will, on average, increase the level of sustainable high-quality economic development by 0.059%, which signifies that science and technology innovation can significantly and positively contribute to sustainable high-quality urban economic development and the research H1 is once again confirmed.

4.4. Mechanism Test

The previous elaboration corroborates research H1, and a series of robust results shows that science and technology innovation can enhance an urban economy’s sustainable and high-quality development. Based on research H3 and H4, this manuscript will further examine the path of science and technology innovation for sustainable and high-quality urban economic development. Combining theoretical analysis and data availability and referring to the mechanical test of Shuai-Long Wang [39], this manuscript mainly explores the influence mechanism of technological innovation on the sustainable and high-quality development of urban economies in terms of optimizing industrial structure.
In order to test H4, this manuscript adds the interaction terms of science and technology innovation and advanced industrial structure, on the basis of baseline model (1) to represent the interaction between science and technology innovation and industrial structure upgrading, forming model (9).
h q e d i t = α 0 + α 1 i n n o v a t i o n i t + β 1 i n n o v a t i o n i t × i s 1 + β 2 i n n o v a t i o n i t × i s 2 + α c Z i t   + μ i + δ t + ε i t
Table 9 represents the result of mechanism test. After considering the practical dilemma that mediating effects require effective control for the endogeneity of mechanism variables, drawing on existing studies, this manuscript uses interaction terms with median-based group regressions to conduct mechanism tests. In the interaction term analysis part, by cross-multiplying science and technology innovation with industrial structure rationalization and advanced industrial structure, models (1) and (2) show that science and technology innovation can promote sustainable and high-quality economic development through industrial structure upgrading, and research H4 is verified. In the grouped regression section, by comparing the regression coefficients of the top 50% and the bottom 50% of the sample, it is found that the coefficients of the bottom 50% of both industrial structure rationalization and advanced industrial structure are significantly more significant than those of the top 50%. The result fully indicates that science and technology innovation promotes high-quality urban economic development through industrial structure upgrading, and research H3 is verified.

4.5. Analysis of Heterogeneity

The impact effect and transmission mechanism of science and technology innovation on the sustainable high-quality development of the urban economy are demonstrated above. However, there may be some heterogeneity in the regional distribution of this impact effect because different cities have different dominant characteristics. Exploring the regional heterogeneity of the impact effect helps to gain insight into the asymmetric impact of promoting science and technology innovation on the sustainable high-quality development of an urban economy and provides valuable references for precisely proposing optimization strategies for science and technology innovation and promoting the sustainable high-quality development of urban economies. Therefore, it is necessary to analyze the heterogeneity of the previous findings based on the theoretical analysis and the mechanism analysis.
In 2012, the report of the 18th Party Congress pointed out that “we should promote science and science and technology innovation as the core of comprehensive innovation, enhance the contribution of scientific and technological progress to economic growth, and promote sustainable and healthy economic development”. Therefore, this manuscript sets 2012 as the time point to examine the heterogeneous impact of science and technology innovation on sustainable and high-quality economic development over time. At the same time, due to the different development stages and factor endowments, there are apparent heterogeneous characteristics in the regional distribution of both science and technology innovation and sustainable high-quality economic development. In this manuscript, the sample cities are divided into cities in the eastern, central and western regions to examine the effects of their regional heterogeneity
Based on the spatial-temporal heterogeneity test in Table 10, models (1) and (2) show that, with the release of the 18th National Congress report, the coefficient of science and technology innovation also increased from 0.066 to 0.278, and both were positively significant at the 1% level. It is shown that as the government continues to pay attention to science and technology innovation and the productivity of science and technology elements continues to spill over; the long-term effect of science and technology innovation on the sustainable high-quality development of the urban economy is gradually emerging. The more significant positive effect will indeed be manifested in the future. Models (3) to (5) show that science and technology innovation has a significant positive effect on sustainable high-quality economic development in the east and the central regions. Thus, the positive effect is more significant in the eastern region than in the central region, and the role is not apparent in the western cities. This indicates heterogeneity in the regional distribution of the impact effect of science and technology innovation on sustainable high-quality economic development. This conclusion is consistent with the existing literature, that the eastern region of China has a better supporting infrastructure and a relatively strong awareness of production transformation among enterprises, allowing science and technology innovation to leverage the science and technology dividend and promote sustainable and high-quality economic development. The central region will lead industrial development with science and technology innovation, further building on its achievements, and narrow the gap in cutting-edge science and technology with the eastern region. The western region is still relatively weak in innovation capacity in general, and the supporting role of science and technology innovation on the economy has not yet been fully reflected.
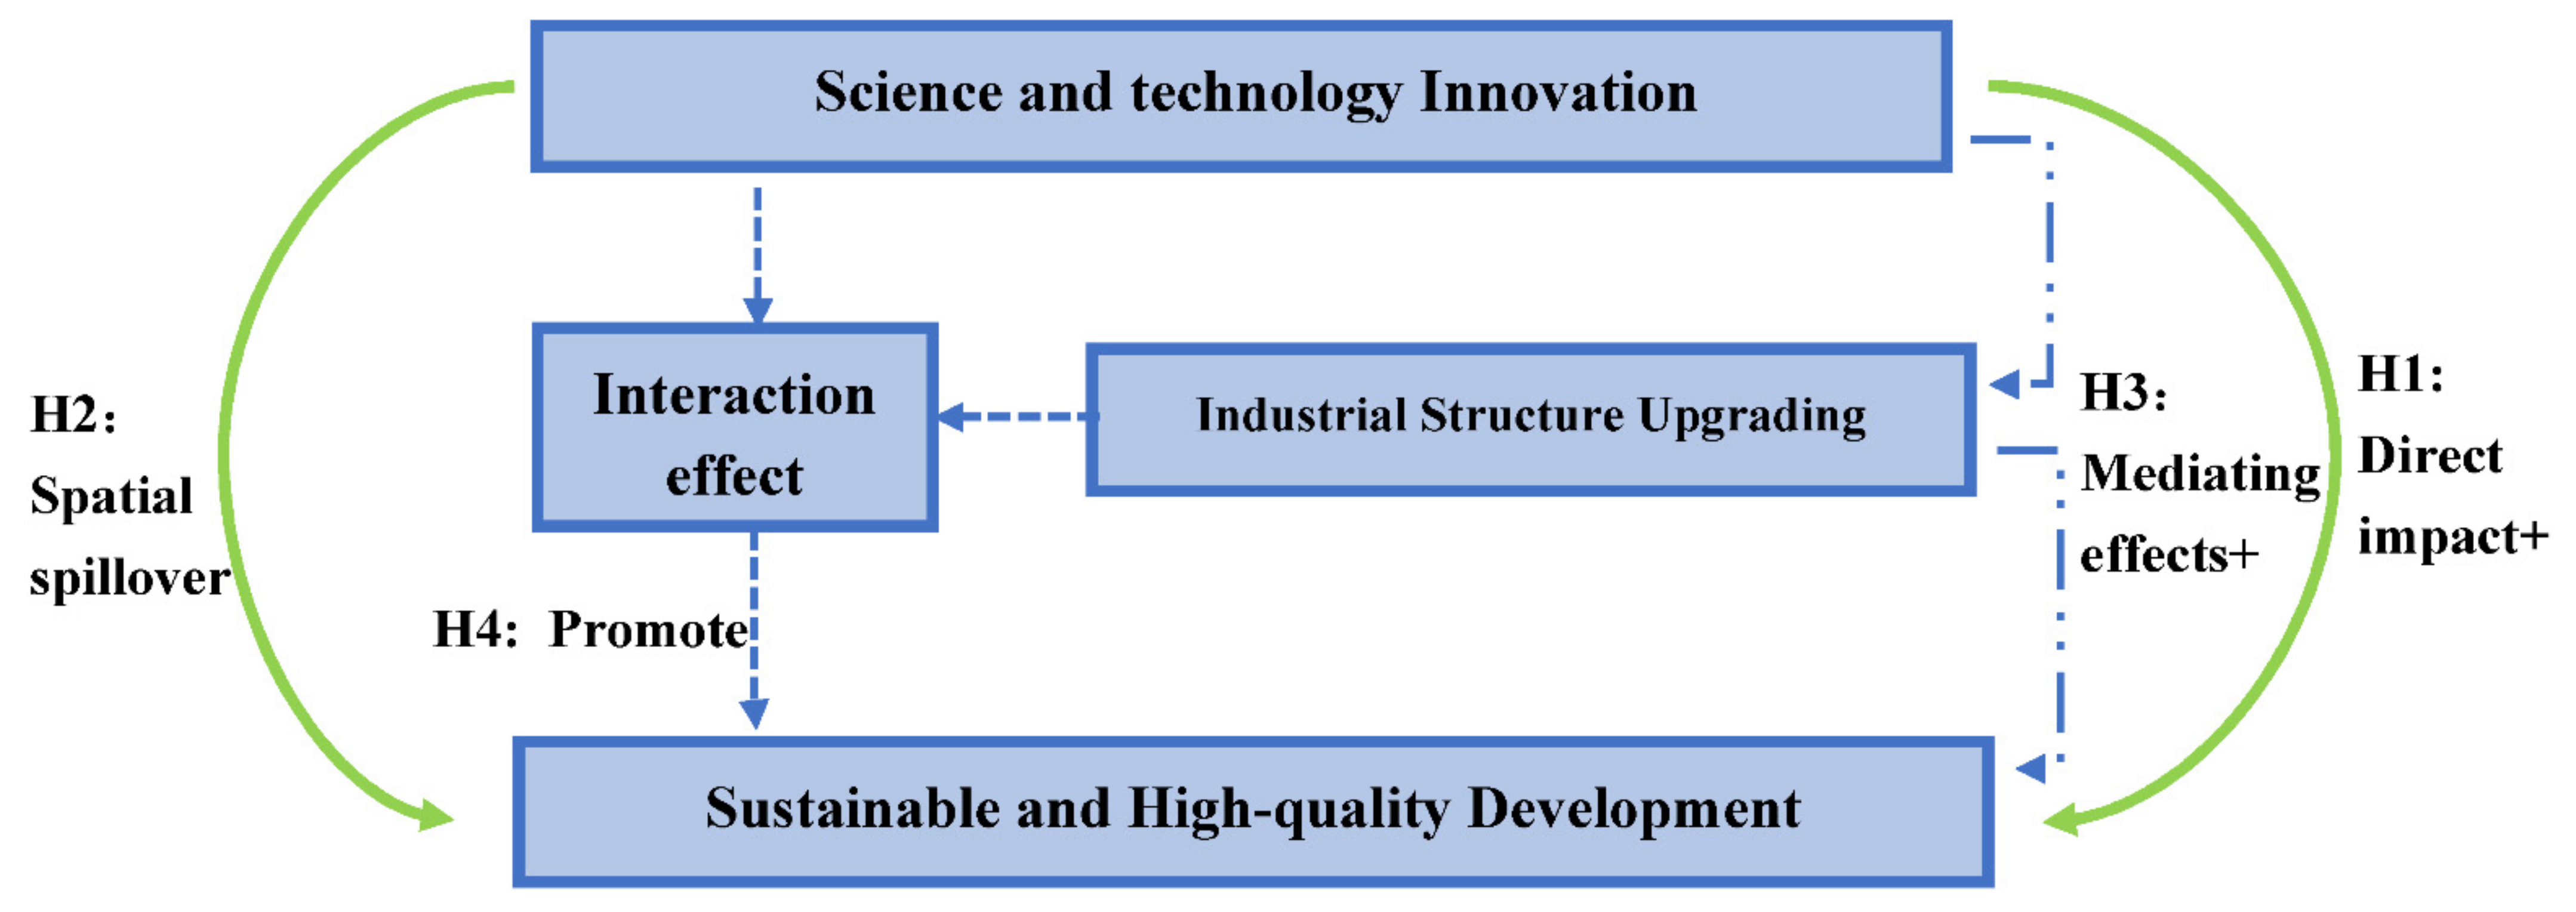
Combining the above empirical analysis and tests, the four hypotheses proposed in the second part are tested.

5. Conclusions and Policy Recommendations

5.1. Conclusions

Under the background of science and technology innovation becoming the core position of the overall national development and the increasingly widespread application of AI, focusing on how science and technology innovation can empower the sustainable and high-quality development of regional economies becomes an important practical issue, and this manuscript examines the relationship between sustainable and high-quality economic development, science and technology innovation and industrial structure upgrading, using a sample of 283 prefecture-level cities in China from 2000 to 2019.
  • Science and technology innovation can significantly enhance a region’s, and surrounding regions’, sustainable and high-quality economic development. This indicates a good interaction between science and technology innovation, industrial structure upgrading and economic development in China. Science and technology innovation promotes the transformation and upgrading of traditional industries; what is more, science and technology innovation and industrial structure upgrading provide the technical and industrial basis for economic development and stimulate the potential for the sustainable high-quality development of the regional economy.
  • The results of heterogeneity analysis show that science and technology innovation in the eastern and central regions can have a significant positive effect on the sustainable and high-quality development of the regional economy, while the science and technology innovation effect in the western region has not yet been highlighted; and the positive effect in the eastern region is more significant than that in the central region.

5.2. Policy Recommendations

  • Having confirmed the reality that science and technology innovation can boost the regional economy to achieve sustainable high-quality development, the digital power strategy should be implemented while continuously increasing investment in technologies such as machine learning, neural networks, big data and cloud computing. The government should first consider paying attention to the investment in science and technology innovation, improve expenditure on scientific research, encourage innovation, and take advantage of the dividends of science and technology innovation. At the same time, the influence mechanism of AI-technology innovation and industrial structure upgrading in science and technology innovation on enhancing the high-quality development of the economy should be further clarified, and the intermediary mechanism of industrial structure upgrading should also be fully utilized while carrying out science and technology innovation to steadily deepen the high-quality development of the economy, and jointly promote the high-quality growth of the economy by virtue of the interactive effect of science and technology innovation and industrial structure upgrading.
  • For the eastern and central regions, science and technology innovation should be used to improve regional economic development, and a modern urban science and technology network should be actively built through industrial structure upgrading and industrial agglomeration under the premise of existing supporting infrastructure; for the western regions, firstly, we should increase capital investment, seize policy opportunities, introduce relevant talents, and accelerate the establishment of supporting infrastructure equipment. The government should improve its independent innovation capability and take science and technology innovation as the main driving force of economic growth; secondly, it should further clarify the impact mechanism of science and technology and industrial structure upgrading on enhancing sustainable and high-quality economic development, and, while conducting science and technology innovation, it should also make full use of the intermediary mechanism of industrial structure upgrading to steadily deepen and promote sustainable and high-quality economic development by virtue of the interaction effect of science and technology innovation and industrial structure. Finally, while strengthening the benign interaction among science and technology innovation, industrial structure upgrading and sustainable high-quality economic growth, we should also focus on regional synergistic development, promote east–west science and technology cooperation, deep integration of east–west innovation chains and industrial chains, the exchange and interaction of talents and intelligence, and the cross-regional transfer and transformation of science and technology achievements, and deepening the reform of science and technology system mechanisms. We should explore new mechanisms, new models and new experiences of east–west science and technology cooperation, and create a cross-regional collaborative innovation style.

Author Contributions

Data curation, H.X.; Writing— original draft, B.L. and F.J.; Writing—review & editing, J.P. All authors have read and agreed to the published version of the manuscript.

Funding

This research received no external funding.

Institutional Review Board Statement

Not applicable.

Informed Consent Statement

Not applicable.

Data Availability Statement

Not applicable.

Conflicts of Interest

The authors declare no conflict of interest.

References

  1. Zhang, X.; Pei, Z. Self-reliance and self-improvement in science and technology as a strategic support for national development. Shanghai Econ. Res. 2022. [Google Scholar] [CrossRef]
  2. Huang, Z.H.; Zhang, Y.Z.; Li, Q.; Li, Z.T.; Zhang, T.X.; Sang, N.; Xiong, S.Q. Unidirectional variation and deep CNN denoiser priors for simultaneously destriping and denoising optical remote sensing images. Int. J. Remote Sens. 2019, 40, 5737–5748. [Google Scholar] [CrossRef]
  3. Ahmad, S.F.; Alam, M.M.; Rahmat, M.K.; Mubarik, M.S.; Hyder, S.I. Academic and Administrative Role of Artificial Intelligence in Education. Sustainability 2022, 14, 1101. [Google Scholar] [CrossRef]
  4. Mhlanga, D. Artificial Intelligence in the Industry 4.0, and Its Impact on Poverty, Innovation, Infrastructure Development, and the Sustainable Development Goals: Lessons from Emerging Economies? Sustainability 2021, 13, 5788. [Google Scholar] [CrossRef]
  5. Woschank, M.; Rauch, E.; Zsifkovits, H. A Review of Further Directions for Artificial Intelligence, Machine Learning, and Deep Learning in Smart Logistics. Sustainability 2020, 12, 3760. [Google Scholar] [CrossRef]
  6. Cioffi, R.; Travaglioni, M.; Piscitelli, G.; Petrillo, A.; De Felice, F. Artificial Intelligence and Machine Learning Applications in Smart Production: Progress, Trends, and Directions. Sustainability 2020, 12, 492. [Google Scholar] [CrossRef]
  7. Zhang, Y. Transformation and upgrading of China’s carbon reduction policy system. Tianjin Soc. Sci. 2022, 90–99. [Google Scholar] [CrossRef]
  8. Sun, Q.; Zhou, X. Science and technology innovation and high-quality economic development. J. Peking Univ. Philos. Soc. Sci. Ed. 2020, 57, 140–149. [Google Scholar]
  9. Li, F.; Li, M.C.; Zhang, Y.J. Empirical analysis of science and technology innovation, industrial structure upgrading on economic development. Technol. Econ. 2021, 40, 1–10. [Google Scholar]
  10. Li, X.; Deng, F. Science and technology innovation, industrial structure upgrading and economic growth. Sci. Res. Manag. 2019, 40, 84–93. [Google Scholar] [CrossRef]
  11. Ren, X.; Yang, S. Technological innovation, industrial structure upgrading and high-quality economic development—A measurement analysis based on independent and synergistic effects. East China Econ. Manag. 2020, 34, 72–80. [Google Scholar] [CrossRef]
  12. Li, Z.; Yang, S.Y. Scientific and technological innovation, industrial upgrading and economic growth:interaction mechanism and empirical test. J. Soc. Sci. Jilin Univ. 2017, 57, 41–52+204–205. [Google Scholar] [CrossRef]
  13. Shao, S.; Fan, M.; Yang, L. Economic restructuring, green technological progress and low-carbon transformational development in China-an empirical examination based on the perspective of overall technological frontier and spatial spillover effects. Manag. World 2022, 38, 46–69+4–10. [Google Scholar] [CrossRef]
  14. Shi, B.; He, L.; Zhang, W. Dynamic evolution and trend prediction of high-quality economic development of cities in the Yellow River Basin. Econ. Issues 2021, 1–8. [Google Scholar] [CrossRef]
  15. Ding, C.; Liu, C.; Zheng, C.; Li, F. Digital Economy, Technological Innovation and High-Quality Economic Development: Based on Spatial Effect and Mediation Effect. Sustainability 2022, 14, 216. [Google Scholar] [CrossRef]
  16. Xie, S.; Hu, W. Coupling and coordination of high-quality economic development and AI technology innovation: The case of Beijing-Tianjin-Hebei region. Stat. Decis. Mak. 2021, 37, 93–96. [Google Scholar] [CrossRef]
  17. Wei, W.; Fu, Y.; Yang, C. The Study of S&T Innovation and High-Quality Economic Development—Based on Coupling Degree Model. China Sci. Technol. Forum 2020, 76–83. [Google Scholar] [CrossRef]
  18. Yang, W.; Tan, J.; Liu, D.; Tang, F. Study on the coupling relationship between urban innovation efficiency and high-quality economic development and its spatio-temporal divergence characteristics. Stat. Inf. Forum 2021, 36, 104–119. [Google Scholar]
  19. Duan, R. Technological progress, technical efficiency and industrial structure upgrading—A spatial econometric test based on 285 cities in China. Res. Dev. Manag. 2018, 30, 106–116. [Google Scholar] [CrossRef]
  20. Li, H.; He, N.; Wang, C.; Yang, M. Research on the innovation-driven effect of industrial structure upgrading--an empirical analysis based on inter-provincial panel data in China. Sci. Technol. Prog. Countermeas. 2020, 37, 54–61. [Google Scholar]
  21. Chen, H. Industrial structure change and economic growth in China. Stat. Decis. Mak. 2005, 68–69. [Google Scholar] [CrossRef]
  22. Chang-Tai, H.; Klenow, P.J. Development Accounting. Am. Econ. J. Macroecon. 2010, 2, 207–223. [Google Scholar]
  23. Erumban, A.A.; Das, D.K.; Aggarwal, S.; Das, P.C. Structural Change and Economic Growth in India. Struct. Chang. Econ. Dyn. 2019, 51, 186–202. [Google Scholar] [CrossRef]
  24. Jia, H.W.; Zhang, W.T.; Pan, Y.Z. Scientific and Technological Innovation, Industrial Structure Upgrading and High-quality Economic Development. Shanghai Econ. Res. 2021, 50–60. [Google Scholar] [CrossRef]
  25. Guo, Z.; Li, Y.; Wang, Q. Innovation heterogeneity, industrial structure upgrading and economic growth. Stat. Decis. Mak. 2022, 38, 121–125. [Google Scholar] [CrossRef]
  26. Su, J.; Su, K.; Wang, S. Does the Digital Economy Promote Industrial Structural Upgrading—A Test of Mediating Effects Based on Heterogeneous Technological Innovation. Sustainability 2021, 13, 10105. [Google Scholar] [CrossRef]
  27. Waters, N. Tobler’s first law of geography. Int. Encycl. Geogr. 2017, 1–15. [Google Scholar]
  28. Hu, S.; Yang, H.L.; Cai, B.L.; Yang, C.X. Research on Spatial Economic Structure for Different Economic Sectors from a Perspective of a Complex Network. Phys. A Stat. Mech. Its Appl. 2013, 392, 3682–3697. [Google Scholar] [CrossRef]
  29. Liyuan, S. Industrial Structure Changes, Spatial Spillover and Economic Growth in the Yangtze River Delta. J. Coast. Res. 2020, 107 (Suppl. 1), 377–382. [Google Scholar]
  30. Li, X.H.; Yan, X.R. Marx’s thought of ecological people’s livelihood and its contemporary value. J. Soc. Theory Guide 2019, 58–63. [Google Scholar]
  31. Yang, P.P. An economic explanation of dual paradox and interpretation approach on the circular economy: A theoretical analysis based on Marx’s economics. Ecol. Econ. 2019, 35, 46–52. [Google Scholar]
  32. Lin, Z.M. Several Understanding about HighQuality Economy Development of Our Country. People’s Daily, 17 January 2018. [Google Scholar]
  33. Hong, Y.X.; Liu, W.; Gao, P.Y.; Jin, B.; Yan, K.; Gao, S.J.; Li, Z.J. The conversation in writing on“Xi Jinping’s economic thought on socialism with Chinese characteristics for a new era”. Soc. Sci. China 2018, 9, 4–73. [Google Scholar]
  34. Wang, G.Q. Evaluation and analysis of high-quality economic development indicators by the analytic hierarchy process model. Sci. Program. 2022, 2022, 1042587. [Google Scholar] [CrossRef]
  35. Zhou, T.; Ding, R.; Du, Y.; Zhang, Y.; Cheng, S.; Zhang, T. Study on the Coupling Coordination and Spatial Correlation Effect of Green Finance and High-Quality Economic Development—Evidence from China. Sustainability 2022, 14, 3137. [Google Scholar] [CrossRef]
  36. Li, L.; Zhang, Q.; Wang, C. Research on the driving factors of China’s manufacturing technology innovation capability. Sci. Res. Manag. 2015, 36, 169–176. [Google Scholar] [CrossRef]
  37. Guo, B.-N.; Wang, Y.; Zhang, H. Digital economy, green technology innovation and industrial structure upgrading-empirical evidence from 282 cities in China. Lanzhou J. 2022, 58–73. [Google Scholar]
  38. Ejermo, O. Regional Innovation Measured by Patent Data-Does Quality Matter? Ind. Innov. 2009, 16, 141–165. [Google Scholar] [CrossRef]
  39. Wang, S.-L.; Li, Y.-X. The impact of innovative human capital on high-quality economic development. Stat. Decis. Mak. 2022, 174–178. [Google Scholar] [CrossRef]
Figure 1. Mechanism diagram of science and technology innovation and industrial structure upgrading on sustainable and high-quality development of regional economy.
Sustainability 14 11331 g001
Table 1. Economic and sustainable quality development indicator system.
Level 1Level 2Level 3Measurement
Economic sustainable high-quality development indexEconomy—sustainable growthGDP per capitaGDP per capita
Urban–rural income ratioPer capita annual disposable income of urban households/per capita annual net income of rural households
Engel’s coefficientHousehold food expenditure/total household consumption expenditure
Average wage of employeesAverage wage of employees
Resource allocation efficiencyBinary comparison dactorValue added of primary industry as a proportion of GDP/(value added of secondary industry as a proportion of GDP + value added of tertiary industry as a proportion of GDP)
Agricultural productivityFood production/arable land area
Industrial productivityTotal industrial output value above the scale/total area of the region
Capital productivityGDP/social fixed-asset investment
Social protectionEducation input ratioEducation expenditure/GDP
Basic education perfectionNumber of students enrolled in general secondary schools/total population at the end of the year
Perfection of cultural facilitiesNumber of books per 100 people in public libraries
Prevalence of medical resourcesNumber of practicing or assistant physicians per 100 population
Medical facilities completenessNumber of hospital health center beds/year-end total population
Ecological protectionExhaust emissions per unit of GDPIndustrial sulfur dioxide emissions/GDP
Wastewater discharge per unit of GDPIndustrial wastewater emissions/GDP
Average concentration of respirable particulate matter PM2.5 Emissions
Table 2. Descriptive statistics (standardized).
VariableObsMeanStd. Dev.MinMax
hqed56607.9031.0396.03228.623
innovation56603.733 0.799 0.024 4.605
pnd56605.7180.9071.5487.968
fdi56600.0180.0220.0000.367
fin56601.5573.7620.017151.724
urban56600.3630.1970.0761.000
trans56601.0613.0390.01390.678
nlight56601.6481.102−2.3684.122
patent56606.025 1.902 0.000 12.020
is156603.118 0.223 2.460 3.895
is256604.6891.1241.0709.100
Table 3. Benchmark regression.
(1)(2)(3)(4)(5)(6)
innovation0.058 ***0.061 ***0.062 ***0.064 ***0.073 ***0.069 ***
(0.001)(0.001)(0.000)(0.000)(0.000)(0.000)
pnd −0.295 ***−0.297 ***−0.309 ***−0.321 ***−0.350 ***
(0.000)(0.000)(0.000)(0.000)(0.000)
fin 0.010 ***0.011 ***0.010 ***0.011 ***
(0.001)(0.000)(0.001)(0.000)
fdi −1.368 ***−1.145 ***0.133
(0.000)(0.003)(0.739)
urban 0.592 ***0.611 ***
(0.000)(0.000)
trans 0.033 ***
(0.000)
_cons7.688 ***9.363 ***9.356 ***9.437 ***9.254 ***9.369 ***
(0.000)(0.000)(0.000)(0.000)(0.000)(0.000)
Fixed urbanYESYESYESYESYESYES
Fixed timeYESYESYESYESYESYES
n566056605660566056605660
adj. R20.8210.8220.8220.8220.8230.828
*** indicates significance at 1% level.
Table 4. Science and technology innovation and economic sustainable quality development global Moran’ I Index 2000–2019 (taking the geographic matrix as an example).
Wdis
YearInnovationZ-ValuehqedZ-ValueYearInnovationZ-ValuehqedZ-Value
20000.214 ***8.4520.052 ***2.20920100.283 ***11.1330.049 ***2.071
20010.187 ***7.4000.054 ***2.27820110.288 ***11.3360.070 ***2.914
20020.209 ***8.2620.057 ***2.37720120.267 ***10.4990.058 ***2.447
20030.195 ***7.7020.069 ***2.87420130.285 ***11.1970.070 ***2.896
20040.244 ***9.6150.071 ***2.94520140.286 ***9.3070.044 ***1.853
20050.223 ***8.7910.059 ***2.45720150.295 ***11.5970.050 ***2.114
20060.245 ***9.6400.069 ***2.85320160.274 ***10.7720.033 ***1.477
20070.242 ***9.5380.068 ***2.78820170.282 ***11.0760.055 ***2.338
20080.271 ***10.6370.055 ***3.64820180.301 ***11.2820.066 ***2.757
20090.264 ***10.3970.085 ***3.98820190.390 ***15.2990.056 ***2.343
*** indicates significance at 1% level.
Table 5. Spatial spillover effects of the two matrices.
WdisWeco
(1)(2)(3)(4)
innovation0.0426 **0.0460 ***0.0423 **0.0493 ***
(0.0150)(0.0079)(0.0163)(0.0045)
pnd −0.4129 *** −0.3772 ***
(0.0000) (0.0000)
fin 0.0122 *** 0.0121 ***
(0.0000) (0.0000)
fdi −0.6595 −0.6637
(0.1218) (0.1181)
urban 0.7855 *** 0.7965 ***
(0.0000) (0.0000)
trans 0.0310 *** 0.0312 ***
(0.0000) (0.0000)
Wx
innovation0.1321 ***0.1350 ***0.4761 ***0.5295 ***
(0.0022)(0.0030)(0.0011)(0.0017)
pnd 0.7736 *** 0.5852
(0.0039) (0.5609)
fin −0.0071 −0.0472
(0.6225) (0.5137)
fdi 3.3705 *** 7.4022 ***
(0.0004) (0.0015)
urban −0.2859 −0.3041
(0.3870) (0.7355)
trans −0.0021 0.0095
(0.9012) (0.8807)
rho0.1153 ***0.1190 ***0.2390 **0.2218 **
(0.0000)(0.0000)(0.0108)(0.0200)
Fixed urbanYESYESYESYES
Fixed timeYESYESYESYES
n5660566056605660
***, ** indicate significance at 1%, 5% levels, respectively.
Table 6. Direct and indirect effects.
LR DirectLR IndirectLR Total
innovation0.0448 **0.0483 ***0.0444 **0.0513 ***0.1516 ***0.1574 ***0.6438 ***0.6940 ***0.1964 ***0.2056 ***0.6882 ***0.7453 ***
(0.0123)(0.0067)(0.0136)(0.0040)(0.0010)(0.0027)(0.0010)(0.0030)(0.0000)(0.0002)(0.0004)(0.0015)
pnd −0.4078 *** −0.3792 *** 0.8051 *** 0.6109 0.3973 0.2317
(0.0000) (0.0000) (0.0044) (0.6162) (0.1590) (0.8484)
fin 0.0124 *** 0.0123 *** −0.0049 −0.0488 0.0075 −0.0366
(0.0000) (0.0000) (0.7581) (0.5976) (0.6493) (0.6941)
fdi −0.6264 −0.6505 3.7485 *** 9.4770 *** 3.1221 *** 8.8265 ***
(0.1260) (0.1129) (0.0004) (0.0018) (0.0014) (0.0025)
urban 0.7843 *** 0.7973 *** −0.2310 −0.2154 0.5534 0.5819
(0.0000) (0.0000) (0.5132) (0.8511) (0.1113) (0.6060)
trans 0.0312 *** 0.0314 *** 0.0034 0.0284 0.0346 0.0597
(0.0000) (0.0000) (0.8663) (0.7421) (0.1003) (0.4915)
***, ** indicate significance at 1%, 5% levels, respectively.
Table 7. Robustness tests for indicator replacement.
NlightPatentNlight + PatentExcluding Municipalities
(1)(2)(3)(4)(5)(6)(7)
innovation0.110 ***0.096 *** 0.069 ***
(0.000)(0.000) (0.000)
patent 0.077 ***0.079 ***0.114 ***0.105 ***
(0.000)(0.000)(0.000)(0.000)
pnd −0.041 −0.323 *** 0.001−0.352 ***
(0.199) (0.000) (0.985)(0.000)
fin −0.000 0.011 *** −0.0010.011 ***
(0.783) (0.000) (0.275)(0.000)
fdi 0.887 *** 0.224 0.904 ***0.163
(0.000) (0.581) (0.000)(0.687)
urban −0.887 *** 0.605 *** −0.907 ***0.626 ***
(0.000) (0.000) (0.000)(0.000)
trans 0.000 0.033 *** 0.0000.033 ***
(0.654) (0.000) (0.715)(0.000)
_cons1.237 ***1.829 ***7.432 ***8.988 ***0.950***1.306 ***9.365 ***
(0.000)(0.000)(0.000)(0.000)(0.000)(0.000)(0.000)
Fixed urbanYESYESYESYESYESYESYES
Fixed timeYESYESYESYESYESYESYES
n5660566056605660566056605580
adj. R20.9730.9740.8180.8250.9730.9750.824
*** indicates significance at 1%.
Table 8. Robustness tests: different measures.
Q = 0.25Q = 0.5Q = 0.75Mixed OLSSystem GMM
(1)(2)(3)(4)(5)(6)(7)
innovation0.147 ***0.200 ***0.246 ***0.213 ***0.249 ***0.041 *0.059 *
(0.000)(0.000)(0.000)(0.000)(0.000)(0.087)(0.081)
L.hqed 0.856 ***0.635 ***
(0.000)(0.000)
pnd0.030−0.027−0.0280.016 0.488
(0.357)(0.516)(0.221)(0.411) (0.394)
fin0.062 ***0.108 ***0.154 ***0.085 *** 0.002
(0.000)(0.000)(0.000)(0.000) (0.871)
fdi0.487−1.171 **−2.126 ***−0.576 −0.528
(0.264)(0.013)(0.000)(0.271) (0.400)
urban1.846 ***1.766 ***1.742 ***1.899 *** 4.429 ***
(0.000)(0.000)(0.000)(0.000) (0.002)
trans0.157 ***0.218 ***0.148 ***0.078 *** 0.040
(0.004)(0.000)(0.000)(0.000) (0.189)
_cons5.711 ***6.278 ***6.609 ***6.122 ***6.973 ***1.078 ***−1.711
(0.000)(0.000)(0.000)(0.000)(0.000)(0.041)(0.576)
AR(1) 0.0620.062
AR(2) 0.6200.583
Sargan 0.5530.492
Fixed urbanYESYESYESYESYESYESYES
Fixed timeYESYESYESYESYESYESYES
n5660566056605660566050945094
adj. R20.6110.6710.5540.3250.0360.3210.324
***, **, and * indicate significance at 1%, 5%, and 10% levels, respectively.
Table 9. Mechanism test.
Interaction ItemsRationalization of Industrial StructureAdvanced Industrial Structure
Is1Is2<50%>50%<50%>50%
(1)(2)(3)(4)(5)(6)
innovation(isu1)0.022 ***
(0.000)
Innovation(isu2) 0.017 ***
(0.000)
innovation 0.045 ***0.118 ***0.072 ***0.076 **
(0.000)(0.006)(0.000)(0.034)
pnd−0.356 ***−0.341 ***−0.027−0.678 ***0.077−0.859 ***
(0.000)(0.000)(0.599)(0.000)(0.251)(0.000)
fin0.011 ***0.012 ***0.002 *0.035 **0.011 ***0.004
(0.000)(0.000)(0.077)(0.030)(0.000)(0.764)
fdi0.162−0.063−0.1370.352−0.4500.283
(0.684)(0.875)(0.641)(0.666)(0.267)(0.684)
urban0.603 ***0.702 ***0.199 *1.499 ***0.370 **0.470 **
(0.000)(0.000)(0.080)(0.000)(0.016)(0.050)
trans0.032 ***0.033 ***−0.0070.028 ***0.033 ***−0.004
(0.000)(0.000)(0.476)(0.000)(0.000)(0.750)
_cons9.406 ***9.240 ***7.275 ***11.191 ***6.872 ***12.599 ***
(0.000)(0.000)(0.000)(0.000)(0.000)(0.000)
Fixed timeYESYESYESYESYESYES
Fixed urbanYESYESYESYESYESYES
n566056602739290927262908
adj. R20.8280.8290.9520.6970.9370.690
***, **, and * indicate significance at 1%, 5%, and 10% levels, respectively.
Table 10. Heterogeneity.
Before the 18th CPC National Congress After the 18th CPC National Congress Eastern RegionCentral RegionWestern Region
(1)(2)(3)(4)(5)
innovation0.066 ***0.278 ***0.169 ***0.092 **−0.004
(0.007)(0.000)(0.000)(0.018)(0.855)
pnd0.162−0.041 **−0.444 ***−0.048−0.559 ***
(0.161)(0.019)(0.000)(0.807)(0.000)
fin−0.0020.137 ***0.026 ***0.009 **0.020 ***
(0.460)(0.000)(0.001)(0.030)(0.008)
fdi0.1331.574 *−0.384−0.7160.202
(0.803)(0.064)(0.218)(0.559)(0.887)
urban0.0711.336 ***0.219 *0.3682.335 ***
(0.709)(0.000)(0.070)(0.325)(0.000)
trans0.025 ***0.040 ***0.034 ***0.022−0.022
(0.000)(0.000)(0.000)(0.175)(0.431)
_cons6.247 ***6.932 ***10.036 ***7.539 ***9.919 ***
(0.000)(0.000)(0.000)(0.000)(0.000)
Fixed timeYESYESYESYESYES
Fixed urbanYESYESYESYESYES
n33962264199619751679
adj. R20.7630.4990.9380.7040.836
***, **, and * indicate significance at 1%, 5%, and 10% levels, respectively.
Publisher’s Note: MDPI stays neutral with regard to jurisdictional claims in published maps and institutional affiliations.

