Article

Does High-Speed Railway Promote High-Quality Development of Enterprises? Evidence from China’s Listed Companies

1
School of Economics and Management, Shanxi University, Taiyuan 030006, China
2
School of Business and Economics, Free University of Berlin, 14195 Berlin, Germany
3
School of Economics and Management, Beijing Jiaotong University, Beijing 100044, China
*
Authors to whom correspondence should be addressed.
Sustainability 2022, 14(18), 11330; https://doi.org/10.3390/su141811330
Submission received: 27 July 2022 / Revised: 29 August 2022 / Accepted: 6 September 2022 / Published: 9 September 2022
(This article belongs to the Section Economic and Business Aspects of Sustainability)

Abstract

:
The high-quality development of enterprises is the micro-foundation of China’s economic growth model from “speed and scale” to “quality and efficiency,” in which China’s transportation infrastructure, especially the high-speed railways (HSRs), plays an indispensable role. We select the propensity score matching and difference in difference (PSM-DID) model as the identification strategy and empirically analyze the impact of the HSR on the high-quality development of enterprises based on empirical data of 1331 A-share listed companies in China. The results show that the HSR has a significant positive impact on the high-quality development of enterprises. This effect is more substantial for enterprises in the Pearl River Delta, the Triangle of Central China, and small and medium-sized cities. The HSR inhibited the high-quality development of enterprises in the mining, culture, sports, and entertainment industries in eastern and central China. The reason is the restriction of the ability to create social and environmental value and the influence of monopolistic competition. The HSR improves labor mobility, capital expansion, and knowledge spillovers, thereby promoting the high-quality development of enterprises. However, new infrastructure mainly improves the high-quality development of enterprises by promoting knowledge spillovers and technological innovation. This paper contributes to the modernization of China’s HSR network and provides essential insights for the HSR to achieve sustainable development goals.

1. Introduction

As an essential part of transportation infrastructure [1], the HSR plays an instrumental role in global economic, social, and environmental development [2,3,4], as well as the changes in the regional development pattern [5,6]. Ahlfeldt and Feddersen empirically found that the HSR connecting Cologne and Frankfurt (Germany) increased the GDP of the passing county by 8.5% [7]. Fosu draws similar empirical conclusions based on annual data from 1980 to 2016 in the United States [8]. Hayakawa et al. provide evidence that the extension of the Shinkansen network in Japan led to employment growth of up to 30% in surrounding cities [9]. Jiang and Liu used the PSM-DID model to find that HSR operations significantly reduce ecological and environmental stress in Chinese cities, especially in resource-based cities in the eastern and central regions [3]. Likewise, Miwa et al. documented that the introduction of the HSR in Japan increased average income per capita (IN) and the number of patent applications per employee (PA) in the peripheral regions, thereby alleviating regional inequalities [4]. Therefore, HSR investments are one of the main instruments for government and international institutions to reduce regional disparities and achieve regional sustainable development by improving intercity accessibility [10].
Since China’s reform and opening up, transportation infrastructure investment, especially HSR investment, assumed a vital role in China’s investment-driven economic growth model [11]. In 2008, China’s Beijing–Tianjin intercity high-speed railway was completed and opened to traffic, and the story of “China Speed” began to be written. Subsequently, China’s Medium and Long-Term Railway Network Planning (2008) and the National Comprehensive Three-dimensional Transportation Network Planning Outline (2021) were successively issued. The plan points out that the main channel of the HSR will span from “Four-vertical and Four-horizontal” to “Eight-vertical and Eight-horizontal” and eventually form a comprehensive three-dimensional transportation network with the HSR as the necessary support. As of 31 December 2021, the length of China’s HSR business line is nearly 41,000 km, which is second to none in the world. Furthermore, China’s “14th Five-year” Development Plan for Modern Comprehensive Transportation System pointed out that: By 2025, 95% of cities with a population of 500,000 or more will be covered by HSR networks; and looking ahead to 2035, China will basically form 123 transportation circles, with a one-hour commute in metropolitan areas, a two-hour commute in urban agglomerations, and a three-hour coverage of major cities across the country, and gradually realize the goal of becoming a transportation powerhouse.
The construction of China’s HSR network is of great significance to China’s economic growth [11], especially in the “high-quality development” stage of recent years in which China strives to achieve steady economic growth and global value chain upgrading at the same time. In 2017, China first proposed an overview of “high-quality development,” indicating that China’s economy shifted from a speed–scale type to a quality–efficiency type. That is to say, China’s high-quality development is not a one-sided pursuit of the scale and speed of GDP growth, but a coordinated development among economic, political, cultural, social, and ecological civilization construction. China stresses the importance of “increasing the share of the output of the service industry, emphasizing the role of investment and consumption, encouraging R&D and innovation, and enhancing China’s position in the global value chain and green development.” Likewise, it addresses various issues, such as cultural impoverishment, widening income disparities, sharp social tensions, and environmental degradation.
Although “high-quality development” is proposed based on high-quality economic development at the macro level, high-quality economic development ultimately needs to be achieved through the high-quality development of enterprises [12]. From the perspective of the main body, high-quality development covers three levels: macro, meso, and micro. The high-quality development of enterprises is an essential micro-foundation for China to achieve high-quality development. Whether it is to promote the transformation of the economic development model, the optimization and upgrading of the industrial structure, or the conversion of the power of enterprise growth, the subjectivity role of the enterprise is inseparable. The critical point to the success of China’s high-quality development and whether they can achieve high-quality development lies in enterprises. Accordingly, this paper poses the following research question: Does the HSR promote the high-quality development of enterprises? If so, what are the mechanisms behind it? All these questions need to be answered from the perspectives of theory and empirical evidence, combined with China’s realities.
Few scholars focused on the relationship between the HSR and the high-quality development of enterprises. Additionally, related studies have limitations in defining and measuring the high-quality development of enterprises. Since the concept of high-quality development was proposed, scholars conducted systematic and in-depth studies on different areas, such as conceptual discussions, realization paths, metrics, and economic linkages [12]. At the same time, studies on the economic effects of the HSR mainly explored the effects of the HSR on different macro-levels, such as economic growth [7,8,13,14,15], economic geography [16,17,18], industrial structure [19], innovation development [20,21], environmental pollution [3,22,23], employment [14], and so on [13,14]. The studies mainly focus on the micro perspective of the dilemma, connotation, and realization path of the high-quality development of enterprise; or, they attach importance to the “one-sided” effect of the HSR on enterprise investment, import, export, innovation, etc. [12]. However, there are only a few studies linking the HSR and the high-quality development of enterprises [24,25]. Similarly, some scholars examined the impact of the HSR on the total factor productivity of enterprises [26,27,28]. However, most of them ignore or underestimate the consideration of environmental responsibility or environmental protection [29] and lack a systematic and comprehensive understanding of the connotation of the high-quality development of enterprises.
This paper empirically analyzes the impact of HSRs on the high-quality development of enterprises by using 1331 A-share listed companies in China from 2007 to 2019 to solve the above research gap. The research objectives of this paper are: (1) to clarify the mechanism of the HSR’s impact on the high-quality development of enterprises based on the inclusion of environmental factors into the conceptual framework of the high-quality development of enterprises; (2) to empirically examine the impact of the HSR on the high-quality development of enterprises and identify the sources that lead to heterogeneous manifestations of the impact effect; and (3) to verify the main mechanisms of the HSR’s impact on the high-quality development of enterprises based on secondary data.
The contributions of this paper are as follows:
  • Enterprises’ environmental responsibility is ignored or included in social responsibility (its independence is not recognized) in existing literature, and systematic research on the exploration of the concept of the high-quality development of enterprises is still lacking. This paper combed the related study of the concept of the high-quality development of enterprises, which will be “sustainable environmental value creation ability of independent conceptual framework into high quality for the business enterprise development, defining the high-quality development of enterprises is the enterprise to create economic value, social value and environmental value as the goal orientation, emphasized with the sustainable development of an enterprise development paradigm of ability or potential.”
  • Few pieces of literature discuss the connection between the HSR and the high-quality development of enterprises. This paper studies the impact of the HSR on the high-quality development of enterprises from a micro perspective. We explored the heterogeneous effect of the HSR on the high-quality development of enterprises based on different aspects of urban agglomerations, city, industry, and enterprise. Furthermore, it provides new empirical evidence for the HSR enabling the high-quality development of enterprises.
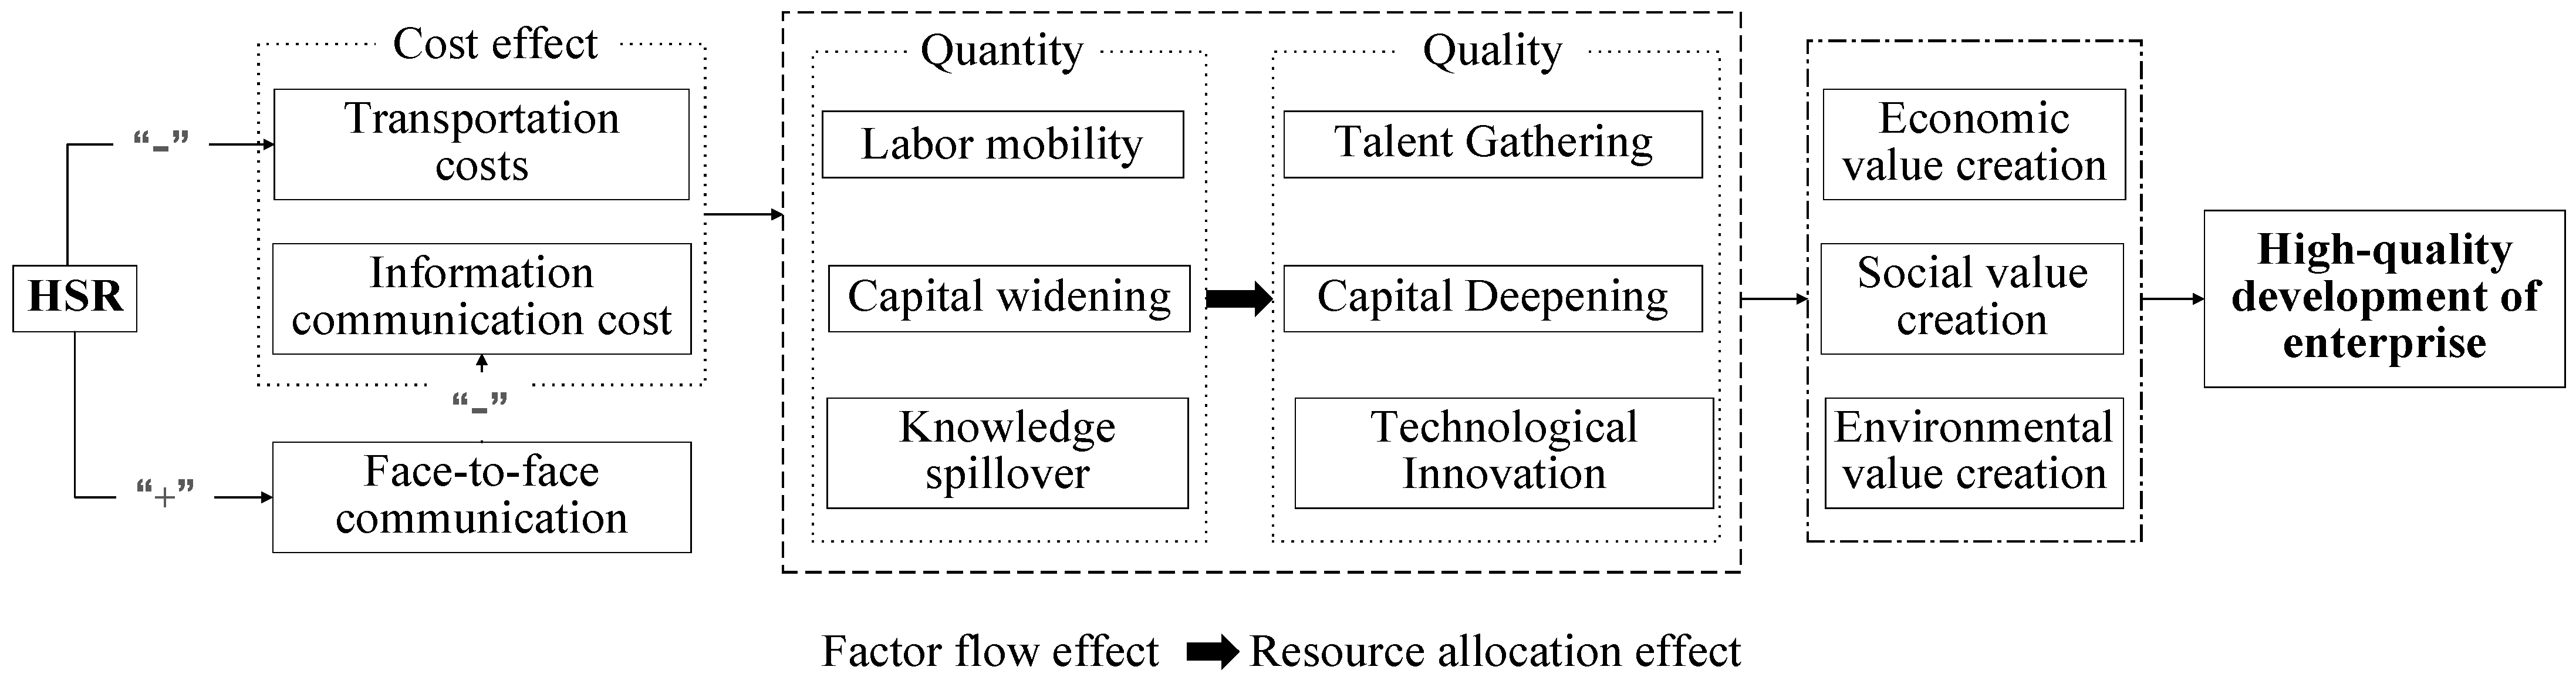
  • The mechanism of the HSR on the high-quality development of enterprises needs to be further explored. From the perspective of production factors, this paper focuses on two aspects of “quantitative change” and “qualitative change.” We discussed HSR’s effect on the high-quality development of enterprises from six mechanisms: labor flow, talent agglomeration, capital popularization, capital deepening, knowledge spillover, and technological innovation. This paper compares and analyzes the similarities and differences between smart city construction and HSR mechanisms for the high-quality development of enterprises. It enriches the impact path of the HSR on the high-quality development of enterprises. It provides a detailed policy basis for improving the quality and efficiency of HSR construction in the new era and promoting enterprise quality development.
The remainder of the paper is structured as follows. Section 2 presents the literature review and the mechanism of the impact of the HSR on the high-quality development of enterprises. Section 3 introduces the selection and measurement of high-quality development indicators of enterprises, empirical models, and sample data on the impact of HSRs on the high-quality development of enterprises. Section 4 and Section 5 are the empirical result analysis, robustness test, mechanism analysis, and further expansion analysis. Section 6 introduces the research conclusions and discussion, further points out the research contributions and policy implications, and concludes with this paper’s limitations and directions for further research.

2. Theoretical Analysis

2.1. Literature Review

Previous literature on the high-quality development of enterprises focused on “how to achieve it?” and “how to measure it?”. Scholars conducted a series of rich discussions on these issues. Dai and Wang found that high-quality development of enterprises can be achieved by establishing an excellent corporate culture and encouraging technological innovation. In addition, improving the ability of resource coordination and integration and enhancing the efficiency of enterprise management can also achieve the same purpose [30]. Luo and Liu pointed out that the high-quality development of enterprises cannot be separated from the ability to develop sustainably in the market competition and, more importantly, from pursuing innovation and quality [31]. Liu et al. argue that the high-quality development of enterprises also depends on dynamic variables, such as high competitiveness and optimization of governance structure [32]. Some scholars also point out that platform-based organizational embedding and technological innovation [33,34], government-subsidized financial support efforts, and establishing an efficient and fair financial, and ecological environment [35] are the critical paths to the high-quality development of enterprises in the new era. Then, as for the selection of indicators, some scholars use innovation behavior and quality behavior, value-added economic rate, i.e., EVA return [36], and labor productivity [33] as intermediate variables to measure enterprises’ high-quality development level. Luo and Liu construct comprehensive measures to quantify enterprises’ high-quality development level in terms of sustainable growth, development quality, and patent results [32]. Chen and Liu combined the characteristics of indicators and information feedback advantage and finally selected total factor productivity (TFP) to measure enterprises’ high-quality development level [36]. Most scholars draw on Lu and Lian [37] to measure TFP with labor, capital, intermediate inputs, and undesired outputs as the input and desired outputs as the output side.
However, the studies mentioned above did not explore the intrinsic meaning and specific connotation of the high-quality development of enterprises. Huang first defined the high-quality development of enterprises around the two economic and social value creation aspects, and some thought that the high-quality development of enterprises was a target state or development paradigm for the sustainable growth of outstanding enterprises [12]. Later, Zhou et al. defined high-quality development of enterprises from the perspective of strategic supply chain synergy as a state of development in which enterprises achieve production goals, such as quality management and process control, by utilizing technology under the conditions of safety and legality while meeting social needs and win-win cooperation [38]. However, most of them ignore or underestimate the considerations of enterprises to protect the environment and assume environmental responsibility.
Meanwhile, since academic discussions on the impact of the HSR on the macroeconomic, social, and environmental sectors are fruitful [22], scholars gradually began to pay attention to supplementing the micro-level empirical evidence on the economic effects of the HSR. The “policy shock” of the HSR not only has a significant positive impact on the cost of enterprises’ investment in the process of exploring innovations [39] but also effectively promotes the number of off-site investments by parent companies to create subsidiaries by alleviating the “principal-agent” problem [40]. Meanwhile, it will help increase venture capital and reduce the “underinvestment” of enterprises. Additionally, it significantly improves the investment efficiency of enterprises in eastern developed regions and industries with low innovation capacity [41]. The opening of HSRs can effectively alleviate the problem of “the level of transportation infrastructure limits the export value of enterprises” and improve the level of market access, in addition to promoting fixed trade costs, thus promoting the export value scale of enterprises in cities along the HSR [42]. Still, effects on the scale of export trade of service-sector firms, small and medium-sized enterprises, and productive services are more sensitive to the impact of the HSR [43]. Most scholars found that the HSR promotes firm innovation through cohort effects [44], facilitated factor mobility [45], human capital effects [46], competitive escape effects, spatial spillover effects, and economies of scale [47]. In addition, inter-city commuting frequency [48], the mobility of scientific and technological talents with master’s and doctoral degrees [49], and the reverse concentration of senior labor [50] are the main paths through which the HSR acts on firms’ innovation capacity and firms’ patent quality. Few studies creatively focus on the effects of infrastructure on firm resource allocation [51], entrepreneurship growth [11], enterprises’ governance [52], bank credit decisions [53], and firm “deleveraging” [54].
Although many studies discuss the impact of the HSR on the TFP of enterprises, they only discuss it based on one aspect of enterprise development. Meanwhile, they ignore the relationship between the HSR’s opening and the high-quality development of enterprises. The opening of a HSR significantly boosts the TFP of industrial, manufacturing, and service firms in China [26]. Among them, the agglomeration effect and the technological progress of enterprises are the mechanisms through which a HSR enhances the TFP of service enterprises. In contrast, the market competition effect (reflected by consumer market access) and the scale expansion effect (reflected by enterprise market access) are the main paths through which HSRs act on the productivity of industrial enterprises.
In contrast, Xu et al. conclude from the perspective of population mobility that the opening of a HSR leads to a decrease in the TFP level of firms in the peripheral cities along the route [27] because the core cities absorb the impact effect of the increase in TFP of firms due to the increased urbanization rate and industry optimization. The result is consistent with the conclusion of Yang et al. that the HSR positively affects firm productivity in core cities and negatively impacts productivity in peripheral cities [28]. Hu and Sun investigated the relationship between the HSR and the high-quality development of enterprises using the DID model [24]. Likewise, Zhao et al. found that the quality of information disclosure played a mediating role in this relationship [25].
In conclusion, there are some limitations in the existing literature in terms of the research scope, the definition of the connotation of enterprise high-quality development, and the analysis of the mechanism of HSRs affecting the high-quality development of enterprises. Based on this, this paper discusses the relationship between the HSR and the high-quality development of enterprises from a micro perspective. Meanwhile, based on Zhao’s research [25], environmental value creation is incorporated into the conceptual framework of the high-quality development of enterprises. In response to the expansion of the connotation of enterprise quality development, a system of enterprise quality development indicators covering “economic, social, and environmental” is constructed to reflect the level of enterprise quality development more comprehensively. Moreover, this paper summarizes six paths of HSRs that influence the high-quality development of enterprises, starting from labor, capital, and innovation factors, and with the two main intermediate mechanisms of promoting factor flow and resource allocation.

2.2. Concept Carding

The theoretical source of the high-quality development of enterprises can be traced back to the physics of “quality” (see Table 1). Newton defined mass as the quantity of matter, the natural attribute concept that describes the inertia of an object. In the long history of the development of human social sciences, scholars gradually excavated the social attribute characteristics of mass, saying quality. Quality measures the degree to which a substance satisfies the user [12]. That is, it is used to judge the quality of the substance itself. Based on the basic theoretical knowledge of economics, Jin believes that the so-called quality is the use value characteristic of products that satisfy the needs of the social market [55].
As the primary subject of economic activities and an essential expression of organizational structure, the quality of enterprise development must also focus on the perspective of social attributes of quality. With the development and enrichment of enterprise-related theories, it experienced a process of continuous updating and dynamic evolution from small to large, from absolute to relative, and from static to dynamic. In particular, we concluded: (1) The quality of enterprise development is mainly based on externality theory [56] and stakeholder theory. It evolved from focusing only on economic value of the enterprise’s ability to create utility for social agents, such as the environment, employees, suppliers, and customers. (2) In taking competitive advantage, especially dynamic competitive advantage and sustainable competitive advantage [57,58] as essential evaluation dimensions, the quality of enterprise development changed from focusing on absolute value to emphasizing the relative quantity change concept. (3) Under the influence of the latest enterprise growth theory and sustainable development theory [59], scholars began to pay attention to the sustainability of enterprise growth rate, value creation growth, and innovation ability.
However, different from the quality of enterprise development, the high-quality development of enterprises is more inclined to the concept of goal than process. Huang first defined the high-quality development of enterprises around the two economic and social value creation aspects. They also think that the high-quality development of enterprises is a vital target state for outstanding enterprises [12]. Later, Zhou et al. defined high-quality development of enterprises, from the perspective of strategic supply chain synergy, as a state of development in which enterprises achieve production goals, such as quality management and process control by utilizing technology under the conditions of safety and legality while meeting social needs and win-win cooperation [38]. Nevertheless, under the realistic background of deteriorating global climate change, environmental factors became an essential consideration for enterprise development. The global COVID-19 pandemic at the end of 2019 also made the high-quality development of enterprises face more significant challenges and higher requirements. Therefore, this paper expands the definition of high-quality development of enterprises by Huang et al. [12]. Finally, we defined the high-quality development of enterprises as an enterprise development paradigm in which the enterprise is oriented toward the creation of economic value, social value, and environmental value. It emphasizes the ability or potential of sustainable development.
Table 1. Enterprise high-quality development index system.
NounsContentLiterature
Quality
(social property)
It measures the extent to which a substance satisfies the subject of use and is thus used to determine the degree of merit of the substance itself.Huang (2018) [12]
Refers to the use-value characteristics based on the products that meet the needs of the social marketRen (2018) [60]
The degree to which a substance satisfies the subject of use to judge the substance’s pros and cons.Jin (2018) [55]
Quality of enterprise developmentThe process of change of connotation:
  • Based mainly on externality theory and stakeholder theory, the quality of enterprise development evolved from focusing only on economic value to focusing on the enterprise’s ability to create utility for social agents, such as the environment, employees, suppliers, and customers.
Marshall (2004) [56]
2.
In taking competitive advantage, especially dynamic competitive advantage and sustained competitive advantage as important evaluation dimensions, the quality of enterprise development shifts from focusing on the absolute magnitude to emphasizing the concept of relative quantitative change.
Teece et al. (1997) [57]
Hofer (1978) [58]
3.
Under the influence of the latest view of business growth and sustainable development theory, scholars began to focus on the sustainability of business growth rate, value creation growth, and innovation capability.
Brundtland (1987) [59]
Degree of excellence in enterprise development.Huang (2018) [12]
High-quality development of the enterpriseThe target state or development paradigm for enterprises to pursue excellent, leading, efficient economic and social value creation, as well as to shape excellent quality capabilities for continuous growth and value creation.Huang (2018) [12]
High-quality development of enterprises refers to the pursuit of a high level and high efficiency of economic value and social value creation, with innovation serving as the first impetus.Zhao et al. (2021) [25]
An enterprise development paradigm that focuses on the creation of economic value, social value, and environmental value, as well as emphasizes the ability or potential of sustainable development.This paper

2.3. Mechanisms

Starting from the three major factors of labor, capital, and innovation, and taking “quantity” and “quality” as the entry point, this paper concludes six influencing mechanisms of the HSR on the high-quality development of enterprises, including labor mobility, talent gathering, capital widening, capital deepening, knowledge spillover, and technological innovation (see Figure 1).

2.3.1. HSR, Labor, and High-Quality Development of Enterprises

New economic geography believes that a HSR breaks the geographical distance barrier between regions, improves the accessibility between cities, and has a significant space-time compression effect. By reducing “space-time distance” and transportation costs, the HSR dramatically promoted the labor flow between cities. The traditional labor migration theory also suggests that whether labor is transferred depends on income utility and migration cost [61]. From the perspective of supply and demand, a HSR shortens the time and cost of commuting between cities, increases the labor supply of central cities or developed cities, and improves the matching degree of supply and demand in their labor market to promote labor mobility [62]; the labor wage difference between central cities, developed cities, and surrounding cities further attracts labor transfer, the size of the labor market in central cities or developed cities continues to expand, and the dynamic trend of labor mobility is enhanced [63,64].
On the other hand, a HSR promotes the cross-regional flow or transfer of high-quality talents. Compared with traditional railways, a HSR mainly serves users with higher requirements for space-time distance and has a particular ability to pay, which significantly promotes the cross-regional flow of high-income or high-quality talents with considerable time and distance elasticity and small price elasticity. However, hindered by traffic efficiency and commuting time, some high-quality labor forces have to choose to work near their hometown to balance their families and careers, so they give up the employment behavior of central cities that can better realize their lofty aspirations and social values [65]. The “space-time compression” caused by the HSR effectively solved the dilemma of high-quality labor, promoted the accumulation of talents, and promoted enterprises’ high-quality development

2.3.2. HSR, Capital, and High-Quality Development of Enterprises

The cities’ accessibility, caused by the HSR, can effectively reduce the cost of cross-regional information exchange, avoid the risk of a certain degree of information asymmetry between enterprises, improve the efficiency of information communication, and thus promote the number of non-local investments. With the improvement of the convenience of business travel, business negotiations between enterprises are more convenient and efficient, resulting in the continuous increase in the contract amount and the increased flow rate of capital elements nationwide [66]. Especially for financial investment institutions, it is evident that HSRs improved their business capacity and efficiency [42].
In addition to promoting the flow of capital factors, another important mechanism for the HSR to promote the high-quality development of enterprises is to improve the efficiency of capital allocation. Li et al. found that the opening of a HSR effectively alleviated the problem of information asymmetry in the capital market and greatly improved the matching degree of capital supply and demand [53], as well as increased the scope and efficiency of capital allocation and increased the ability and potential of enterprise value creation [67]. Shen et al. believe that the opening of HSRs not only accelerates the flow of information but also reduces the cost of investors’ information searches, improving the capital market’s efficiency [68]. Chen and Fang found that after the opening of a HSR, the speed of capital structure adjustment of companies in their cities significantly increased [46].

2.3.3. HSR, Innovation, and High-Quality Development of Enterprises

While affecting the flow of labor, the HSR promotes the spatial overflow of tacit knowledge, such as knowledge, technology, and information, which takes labor as the carrier, increases the opportunities for knowledge communication, and then promotes the high-quality development of enterprises. The primary way of knowledge spillover among enterprises is based on investment, R&D activities, and patent achievement creation, in which scientific and technological R&D personnel play an essential role as a medium [69]. However, the spillover distance also limited the strength of the knowledge spillover effect [62] of the HSR on enterprises. In addition, the HSR increased the opportunities for direct communication between enterprises and customers, as well as eased the spatial obstacles of industry–university research cooperation to a certain extent, which not only promotes enterprises’ innovation activities and independent research and development capabilities, but also indirectly promotes the realization of enterprises’ high-quality development goals. Guo and Bai believe that while the HSR promotes a heterogeneous technology spillover effect, it is also conducive to enhancing the intensity of technology spillover, which will undoubtedly encourage enterprise technological innovation [70]. The technological innovation of enterprises will significantly facilitate the ability of enterprises to create social value, economic value, and environmental value, and ultimately help enterprises develop with high quality.

3. Data and Methodology

In the existing literature, the high-quality development of enterprises is mainly carried out through constructing a comprehensive evaluation system or the index measurement method based on intermediate variables. The former takes the subjective analysis of researchers as the primary basis, and it is easy to form a situation where “Both parties claim to be in the right.” Intermediate variables, such as innovation input, quality of imported intermediate products, and quality of enterprise management can only reflect the efforts made by enterprises. They cannot prove the potential of enterprises to achieve sustainable development. TFP is widely used because it has the advantages of rich information and strong comprehensiveness. The changes in enterprises’ intermediate input, technology, products, and even their position in the industrial value chain will be reflected in the changes in TFP. In recent years, TFP became the most famous indicator for evaluating the quality of development in academia.
With the continuous improvement of TFP measurement methods and the increasingly stringent assumptions, referring to the research of scholars [71], this paper adopts the Färe–Primont index method. It simultaneously meets the product completeness and transmissibility to measure the enterprise TFP, which covers the three dimensions of enterprise performance, social responsibility, and environmental protection.

3.1. Measurement of the High-Quality Development of Enterprises

3.1.1. Construction of High-Quality Development of Enterprise Index System

The construction of the input-output index system is the prerequisite for measuring the TFP of enterprises. Additionally, in the studies of input-output indicators to calculate the total factor productivity of enterprises, scholars more often use the combination of multiple inputs and single outputs. For example, most of the studies use the LP method to measure the total factor productivity of enterprises based on the research of Levinsohn and Petrin [72] and Lu and Lian [37]. Capital input, labor input, and intermediate input are selected as input indicators, and economic output is taken as the only desired output. However, the total factor productivity measured in this way reflects more the economic production efficiency of enterprise development and has a limited representation of social and environmental benefits.
Based on this, the input-output indicator system in this paper wants to summarize more comprehensive information as much as possible. Therefore, based on the reference to existing literature, a primary indicator system, covering four inputs and three types of outputs, is constructed. The specific process is as follows:
  • Input indicators: in this paper, based on labor input, capital input, and intermediate input, R&D input is included in the input indicators regarding the studies of Yu and Feng [73] and Ren [74]. Some scholars also innovatively added energy inputs to the input side variables in constructing green total factor production efficiency [75,76,77]. However, due to the serious problem of missing data, energy inputs and intermediate inputs are not considered in this paper. In addition, besides the above-mentioned input indicators, such as labor, capital, and R&D, government subsidies are also one of the critical variables on the input side of enterprises [78,79]. Therefore, it is added as the fourth input indicator in this paper.
  • Output indicators: To more comprehensively measure the high-quality development of enterprises, more and more studies started to explore a multi-output green total factor productivity indicator system. Not only do they include “bad outputs” (also called environmental outputs), such as CO2, SO2 emissions, forestry soot emissions, and environmental management as non-desired outputs in the output index system [80,81,82], but they also add social-type outputs as the second type of desired output based on economic outputs as desired outputs [83]. This is consistent with the internal logic of this paper that economic value, social value, and environmental value creation are the three major goal orientations of enterprise quality development.
In addition, regarding the selection of secondary and tertiary indicators in the high-quality development of enterprises index system, this paper draws on stakeholder theory and the study of Tang and Yang [84] to divide social responsibility into employee responsibility, stakeholder responsibility (suppliers, customers, and consumers), and social responsibility. However, the secondary indicator of stakeholder responsibility was excluded due to the limitation of data availability. In addition, regarding Hexun’s social responsibility score for listed companies, economic responsibility is divided into profitability and solvency [85]. Meanwhile, environmental responsibility is subdivided into three components: environmental awareness, environmental disclosure, and environmental governance considering the data quality issues.
Based on this, we finally constructed a high-quality development of enterprises index system covering three dimensions of “economic-social-environmental”, as shown in Table 2.

3.1.2. Färe–Primont Index

The Färe–Primont index proposed by O’Donnell [86] has the advantages of measuring a wide range of time and space and meeting strict assumptions. The specific identification is as follows:
h q d e i t = Q i t X i t
where h q d e i t refers to multi-enterprise and multi-period TFP, indicating the output Q i t produced by unit input X i t . t and i represent year and firm, respectively.
h q d e i t , j s = h q d e i t h q d e j s = Q i t / X i t Q j s / X j s = Q i t , j s X i t , j s
The “comparability” characteristic of the Färe–Primont index method makes the expression have another expression form, as seen in Formula (2). The meaning of this formula is that the ratio between h q d e of different enterprises, from which we can find h q d e i t , j s will eventually become the “input-output ratio” of two phases and two enterprises. This shows that the change in h q d e can be transformed into the ratio of the total output set to the total input set.
To include more abundant information, we decomposed h q d e in more detail:
T F P E i t = T F P i t T F P t * = Q i t / X i t Q * / X *
O T E i t = Q i t Q i t ¯
O S E i t = Q i t ¯ / X i t Q i t ¯ / X i t ¯
R M E i t = Q i t ¯ / X i t ¯ Q t * / X t *
T F P E i t = T F P i t T F P t * = O T E i t × O S E i t × R M E i t
h q d e i t = T F P * × O T E i t × O S E i t × R M E i t
From Equation (8), it can be seen that the h q d e calculated by the Färe–Primont index can finally be divided into four parts, reflecting the information of different aspects of the enterprise. See Table 3 for the meaning of specific decomposition indicators.

3.2. Empirical Analysis Model Construction

Policy effect evaluation is a hot research topic in recent years, and is crucial for developing economics as a social discipline and maximizing the welfare effects of public policies. The PSM-DID model is the most commonly used method for policy effect evaluation because it combines the PSM method “eliminating the bias caused by confounding factors” and the DID model “effectively dealing with endogeneity problems”.

3.2.1. PSM-DID

This paper adopts the PSM-DID method to conduct an empirical study. In the first step, the PSM method is used to find the most “suitable” control group sample for the experimental group based on a specific matching method to form a “counterfactual.” The typical process is as follows:
First, the probability of each enterprise becoming an experimental group is calculated based on the binary selection model. The explained variables 0 and 1 correspond to the control and experimental groups, and the explanatory variables are observable covariates.
Next, for the enterprises with the explained variable of 1, the “closest” enterprises are matched from the samples with the explained variable of 0 based on the above probability value (this paper uses the ratio of 1:1 for matching).
P i X = P r T i t = 1 | X i = f h X i
where P i X refers to the probability of i entering the treatment group, T is the virtual variable of the experimental group, X i represents the characteristic variable set of enterprise i . f is a logistic function, and h (·) is a linear one. The essence of PSM is to fit multidimensional characteristic variables to P i X , and P i X is used to complete the reconstruction of the sample box of the corresponding control group of the experimental group according to the matching criteria.
Second, based on the matched sample information, the did model is used as the identification strategy to obtain the effect of policy evaluation. This paper selects the year 2011 as the policy implementation year of the HSR and regards the opening of the HSR as a quasi-natural experiment. Based on whether or not to open a HSR after the year of policy implementation, the treatment group and control group are divided, and the following model is constructed:
h q d e i t = α 0 + α 1 d i d i t + α 2 X i t + μ i + δ t + ε i t
where i refers to the enterprise and t refers to the year; h q d e i t is the enterprise TFP calculated based on the Färe–Primont index method, which measures the high-quality development of the enterprises. The core explanatory variable is the interaction term d i d i t of the enterprise dummy variable h s r i t and the year dummy variable y e a r i t for whether the prefecture-level city where enterprise i is located opens a HSR in year t . α 1 measures the processing effect of the HSR on the high-quality development of enterprises and whether the influence coefficient’s size, symbol, and significance are the focus of this paper. If α 1 is significantly positive, which means that the opening of a HSR promoted the high-quality development level of enterprises. Covariate X i t control may interfere with the enterprise and city-level characteristic variables of the empirical analysis results, that is, control variables; μ i and δ t strictly control the impact of enterprise individual differences and time trend information on the processing effect results, that is, eliminate the interference of information factors that are not easy to directly observe at the relevant level; ε i t represents the random error term.

3.2.2. Mediated Effect Model

Based on the research of Wen et al. [87], this paper further explores the mechanism of HSRs affecting the high-quality development of enterprises, and the test model is as follows:
m e d i t = β 0 + β 1 d i d i t + β 2 X i t + μ i + δ t + ε i t
h q d e i t = γ 0 + γ 1 d i d i t + γ 2 X i t + γ 3 m e d i t + μ i + δ t + ε i t
Among them, m e d i t represents the mechanism variable, β 1 measures the impact of HSRs on m e d i t , and γ 1 represents the processing effect of HSRs on the high-quality development of enterprises after the introduction of m e d i t . In the two-step regression, first test Equation (11). If β 1 is significant, go to the next step; otherwise, stop the test if β 1 is not significant; then test Equation (12). If γ 1 and γ 3 are significant, it indicates that the mediating effect plays a partial intermediary role in the process of the HSR, affecting the high-quality development of enterprises. If γ 3 is significant but γ 1 is not significant, it indicates that the mechanism variable m e d i t plays a complete intermediary role in the process of the HSR affecting the high-quality development of enterprises.

3.3. Data

This article sets the sample range from 2007 to 2019, and the initial sample includes all listed companies in China. Based on the initial samples, the following screening is carried out according to the relevant data of the prefecture-level cities where the registered address of the listed company is located: (1) the samples of prefecture-level cities with a large number of missing values of key variables (such as Shigatse, Changdu, Linzhi, etc.) are excluded; (2) relevant samples of prefecture-level cities whose administrative divisions were adjusted during the sample period were excluded. Based on this, referring to the processing methods of existing literature, the following screening process is carried out: (1) eliminate the samples with uneven distribution in the sample period; (2) eliminate samples with profound data loss of core variables; (3) delete the samples in which the registered address of the listed company changed during the sample period; (4) exclude samples, such as B shares, ST shares, and *ST shares (see Table 4 for the distribution of stock types of listed companies after screening). Finally, 1331 listed companies covering 213 prefecture-level cities in China are selected as the sample box of this paper.
The data foundation of this paper consists of three parts: HSR (operating speed ≥ 250 km/h) data, enterprise data, and prefecture-level cities data. Among them, the data of the HSR comes from the China Railway Yearbook, the national railway train timetable, the official website of the China Railway Corporation, and the relevant data published by China’s Ministry of Transport; the primary source of microdata in this paper is the relevant data of the research section of listed companies in the China Stock Market & Accounting Research Database (CSMAR database), the annual report of listed companies and its enterprises’ social responsibility report; the data of prefecture-level cities are mainly based on the China City Statistical Yearbook over the years, regarding the China Statistical Yearbook and the annual statistical report of prefecture-level cities. In addition, the data to measure regional innovation and entrepreneurship capabilities draw on existing literature [88] and rely on the Index of Regional Innovation and Entrepreneurship in China (IRIEC) developed by the research team led by Peking University.
In this paper, all nominal variables are selected from the base year of 2000, and the corresponding real variables are obtained through the GDP deflator method. Among them, the actual amount of foreign investment is deflated after being converted through the CNY annual average exchange rate published in the China Statistical Yearbook to eliminate the interference of inflation and monetary factors. On this basis, to prevent the interference of extreme value and abnormal value fluctuation on the evaluation and processing effect, eliminate the heteroscedasticity problem, and facilitate calculation, the tail reduction of ±1% of continuous variables and the logarithm processing of some variables are completed by Stata software.

3.4. Descriptions Analysis

Referring to the existing research [11,67,68,69,70], this paper selects variables including the enterprise’s total assets, the enterprise, the age of the enterprise, the shareholding ratio of the first shareholder, the amount of foreign investment, and net profit as covariates at the enterprise level. On the other hand, environmental pollution, opening up, fixed assets, economic development, industrial structure, scientific and technological expenditure, industrial structure, infrastructure level, financing environment, and employed population are selected as covariates at the urban level. In this way, we can control as many other factors that affect the high-quality development of enterprises as possible in addition to the core explanatory variables.
The average of a HSR is 0.322, which means that nearly 1/3 of the cities where the prefecture-level city-level research sample is located opened a HSR in 2007–2019. Since the opening of the Beijing–Tianjin intercity railway, China invested heavily in the construction of a HSR. Until 2019, nearly 79% of prefecture-level cities in China opened a HSR, not including cities in the construction stage of a HSR. From 2007 to 2019, the changes in the number of enterprises in the experimental group and the number of enterprises in the control group in the research sample are shown in Table 5. Furthermore, the average of h d q e is far less than 1, indicating that the TFP level of Chinese enterprises is generally low. In addition, the descriptive statistical analysis results of the main variables in this paper are shown in the following table (Table 6).

4. Empirical Analysis Results

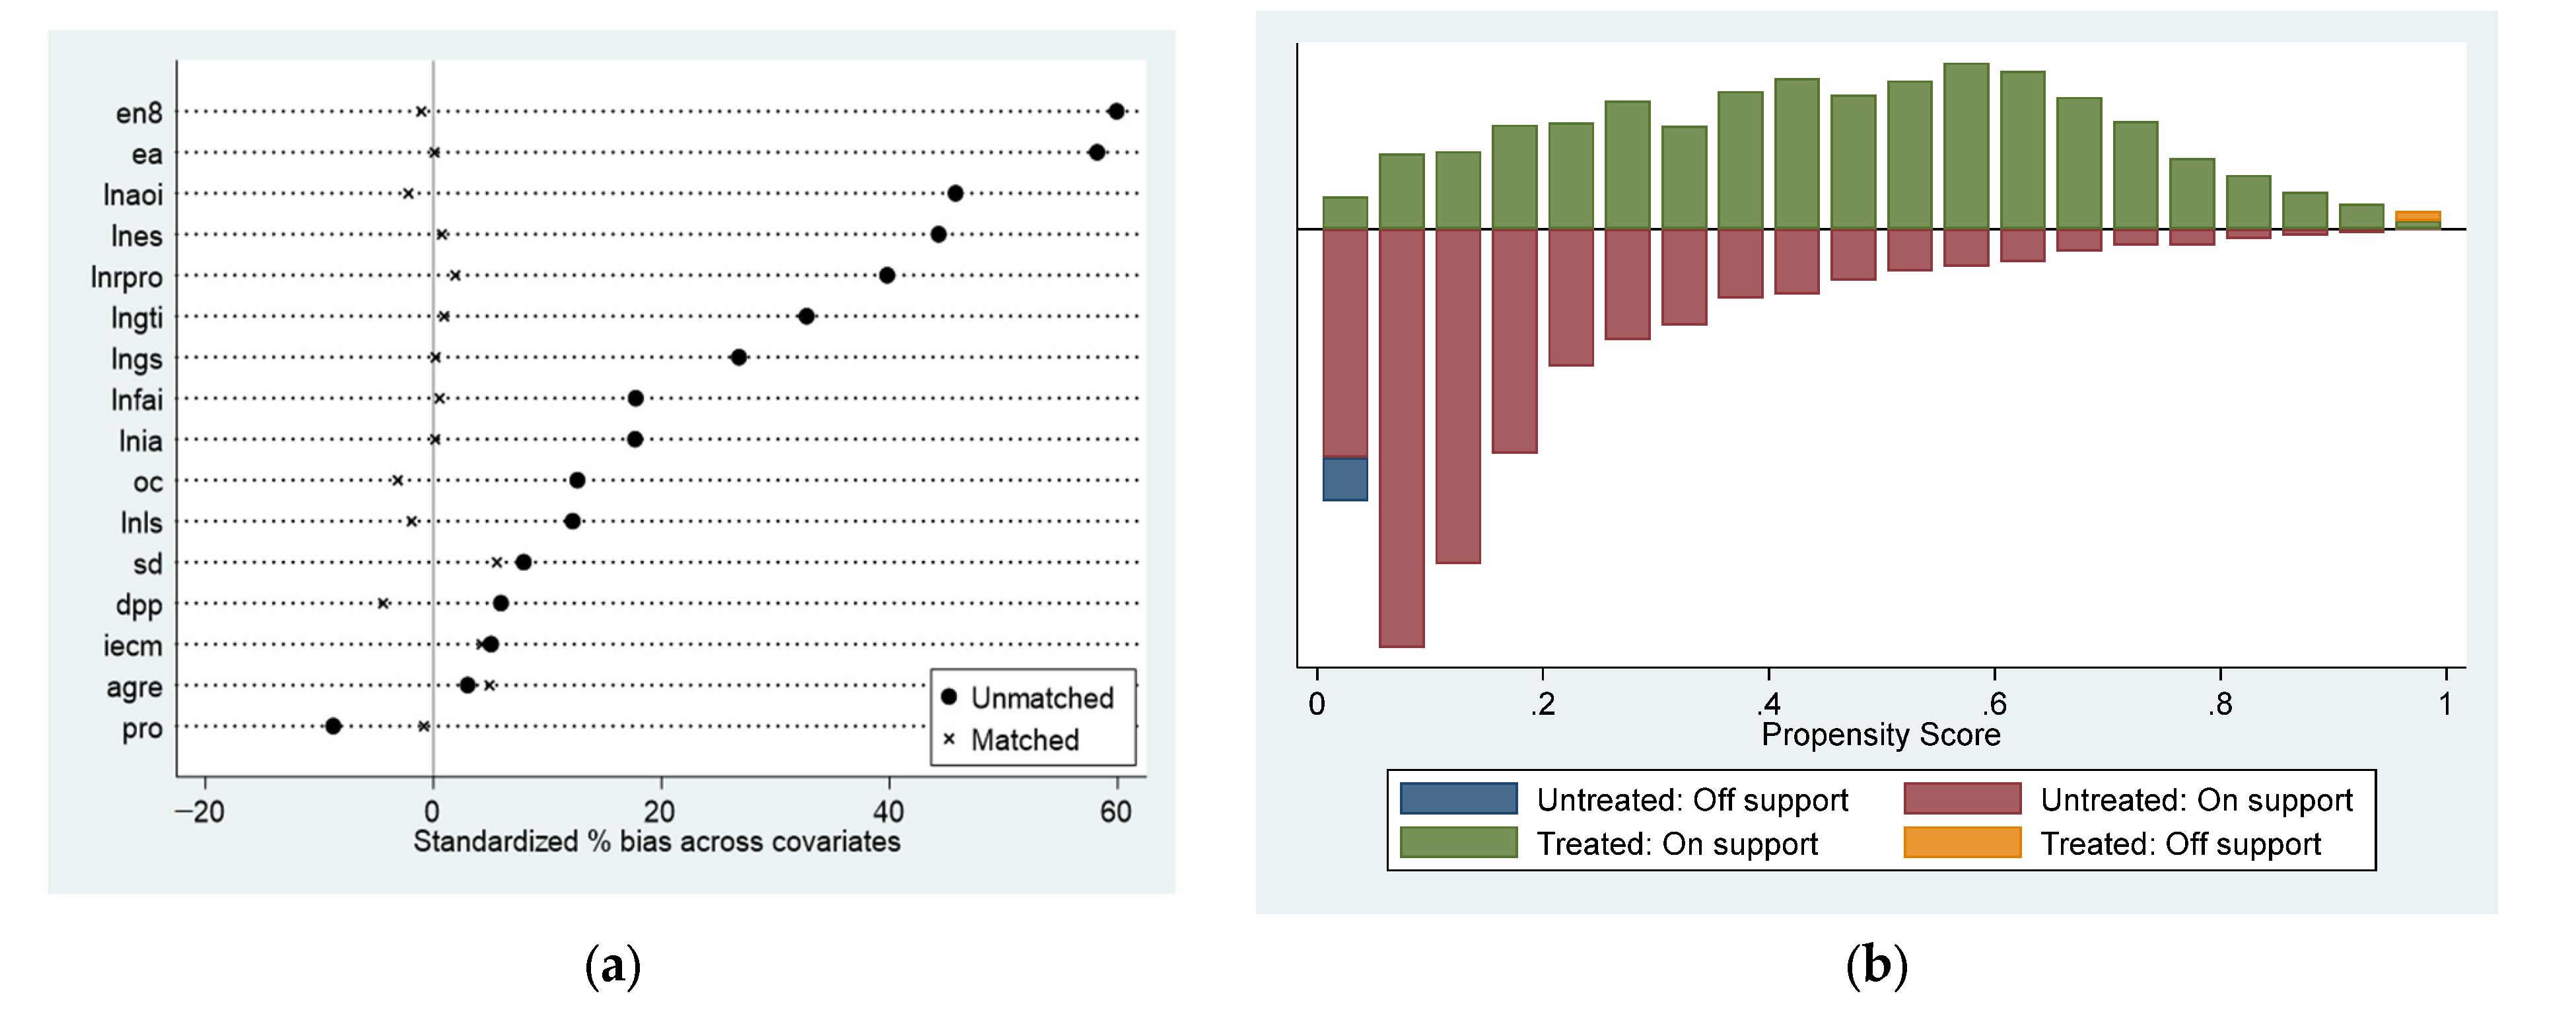
4.1. Model Feasibility Test

A vital prerequisite assumption for the PSM-DID identification strategy is that the control variables do not differ significantly between groups. Figure 2a shows the results of the equilibrium panel test and presents that the standardized deviations of most of the variables after matching (matched) are reduced compared to before matching (unmatched), and the final values fall within the range of ±10%. The result indicates that the means of the matched variables in the treatment and control groups do not differ significantly after matching, so the equilibrium test is satisfied. At the same time, the results of the common support test (shown in Figure 2b) indicate that most of the sample observations were within the common range of values, satisfying the common support hypothesis condition, another prerequisite assumption for the effective identification of PSM-DID.

4.2. Benchmark Regression Analysis

As shown in Table 7, models (2)–(4) measure the empirical results of adding control variables and controlling for various fixed effects. Model (5) and Model (6) measure the regression results after controlling the clustering standards at the city and the enterprise levels. Model (7) measures the treatment effect of HSRs on the high-quality development of enterprises after propensity score matching. The results show that the finding that the HSR has a significant positive impact on the high-quality development of enterprises remains robust with fixed year effects, fixed firm effects, and controlling for the most stringent clustering robustness criteria errors. From Table 7, we found the coefficient of the HSR is 0.269, which means the level of the high-quality development of enterprises in the city with a HSR is 26.9% higher than in the city not connected with a HSR. To improve the accuracy of policy evaluation effects, all regression models below control the strictest fixed effects and the highest standard error clustering hierarchy level, which is the same as the model (7).

4.3. Heterogeneity Analysis

4.3.1. Heterogeneity Analysis Based on Urban Agglomerations

Different city groups’ strategic positioning and spatial patterns vary, and there are differences in transportation development planning. Exploring the differentiated impact of HSRs on the high-quality development of enterprises in different urban agglomerations is beneficial in providing policy support for countries to implement regional synergistic development strategies.
Table 8, we found that the results are heterogeneous in different urban agglomeration levels. The HSR significantly positively affects the enterprise quality development of the Pearl River Delta and the Triangle of Central China. However, it has no significant effect on the enterprise quality development of the Beijing–Tianjin–Hebei, Yangtze River Delta, Chengdu–Chongqing, and Central Plains city groups.
The reason is that the Pearl River Delta benefits from its super talent absorbing ability, the huge innovation ability contained in the independent innovation demonstration zone, and the national leading comprehensive strength. The improvement of transportation infrastructure conditions, such as the construction of the HSR, dramatically improved the economic value creation capacity and potential of enterprises in urban agglomerations. Additionally, it significantly promotes the high-quality development of their enterprises. The geographical location and good ecological foundation of the city cluster in the Triangle of Central China, which is “east-supporting and west-supporting,” determine the vital position of the high-quality development of enterprises in the comprehensive deepening of reform and promotion of new urbanization. The topographic features of the Chengdu–Chongqing have a relatively low demand for HSR construction, and the upgrading and optimization of the industrial structure of the Central Plains are challenging, which makes the HSR limited in the flow of production factors and the improvement of configuration efficiency. Hence, the positive effect on the high-quality development of enterprises is not significant. On the one hand, the Beijing–Tianjin–Hebei and Yangtze River Delta are affected by the “siphon effect” of the central cities, and the transfer of production factors of non-central towns to central cities is a serious problem. On the other hand, due to the developed economy and relatively complete infrastructure, the HSR has a weak role in promoting the high-quality development of its enterprises.

4.3.2. Heterogeneity Analysis Based on City Location and City Size

Different city locations and sizes imply systematic differences in the level of urban economic development, transportation infrastructure, and the relationship between supply and demand. Specifically, the overall level of China’s economic development and transportation infrastructure shows the “East-Central-West” decreasing characteristics, which largely determine the supply side of urban transportation infrastructure. The city size depends on the urban resident population as the statistical caliber, essentially the size of the urban resident population, which determines the relative size of the urban transportation infrastructure demand. Therefore, the interaction of the two is a crucial factor in the supply relationship of urban transportation infrastructure.
This paper refers to the practice of existing literature [24,25]. It divides the research samples into three regions: the eastern region, the central region, and the western region, according to economic development and geographical conditions. Table 9 shows the PSM-DID empirical analysis results. A HSR significantly positively impacts the high-quality development of enterprises in the central region. The influence of the coefficient on the high-quality development of enterprises in other areas does not reject the “significantly different from 0” hypothesis. Due to the historical accumulation of the eastern region, its economic and social foundation is superior, and the transportation infrastructure tends to improve. The marginal role of a HSR in promoting the high-quality development of enterprises is tiny. The western region is vast and sparsely populated, the level of economic development is relatively low, and the supply and demand of a HSR are relatively low. Therefore, the HSR never realized its role of promoting the high-quality development of enterprises. Most cities in the central region are in a period of rapid development. The supply of transportation infrastructure is in short supply. The opening of a HSR stimulates the flow of capital and labor, which will help improve enterprises’ ability to create sustainable value. Then, it will significantly promote the high-quality development level of enterprises.
This article further integrates the cities into small and medium-sized cities, large cities, supercities, and megacities based on the city classification standards in the Notice on Adjusting the Standards for the Classification of City Sizes. The empirical results (see Table 9) show that the HSR significantly positively affects the high-quality development of enterprises in small and medium-sized cities. At the same time, its impact on the high-quality development of enterprises in large cities, supercities, and megacities is not significant. The reason is that the size of the city is highly consistent with the level of economic and social development of the city. The larger the population, the more saturated the labor market, the larger the capital stock in the city, and the relatively higher level of enterprise development. The urban HSR has little room for promoting the high-quality development of enterprises. The smaller the city scale, the smaller the market scale and labor force scale, the lower the level of transportation infrastructure, the greater the potential for sustainable value creation of enterprises, and the more significant the impact of factor flow and resource allocation effects caused by the HSR on the high-quality development of enterprises. It is worth noting that the heterogeneity analysis results of different city locations and city sizes all reflect the law of the “diminishing marginal effect” of the role of the HSR in promoting the high-quality development of enterprises to a certain extent.

4.3.3. Heterogeneity Analysis Based on Different Industries

The differences between industries are not only reflected in the proportion of their main economic production activities on the input ratio of different factors and data and the degree of dependence on transportation conditions, but also in the relative level of enterprises’ economic, social, and environmental value creation ability and potential. Considering the differential impact of the HSR on the high-quality development of enterprises in different industries will help comprehensively promote various industries’ sustainable development. In this paper, combined with the CSMAR database classification standard and the 2017 National Economic Industry Classification (GB/T 4754-2017), we divided all the research samples into 18 different industry sample frames.
As shown in Table 10, we found that the HSR has heterogeneous effects on the quality development of enterprises in various industries. The impact is significant in manufacturing, wholesale and retail trade, scientific research, technical services and geological exploration (SGE), and culture, sports, and entertainment (CSE) industries. However, it has no significant effect on the quality development of enterprises in other industries. Among them, the HSR shows a significant incremental impact on the high-quality development of the SGE, wholesale and retail trade, and manufacturing enterprises, and the impact effect decreases in that order. The reason is that the HSR has dramatically promoted the flow of high-quality talents, and the efficiency of the resource allocation of innovation elements improved, thereby enabling the high-quality development of SGE enterprises. In the wholesale and retail industry, which has a great demand for and dependence on transportation, the HSR significantly promotes product circulation by reducing transportation and information communication costs and stimulates the economies of scale in the wholesale and retail industry. Manufacturing is an industry that relies on production factor resources and the action of invisible hands to provide product supply to meet the needs of economic, social, and environmental development. By promoting the flow of various production resources, the HSR dramatically improves the production scale and production efficiency of manufacturing and significantly promotes the high-quality development of manufacturing enterprises. The difference is that the HSR has a significant inhibiting effect on the CSE, probably because the development of the HSR inhibits the localized development of the CSE, and the overly competitive market inhibits the quality development of its enterprises.
Meanwhile, the effect of HSRs on the high-quality development of different industries is heterogeneous among different regions. In eastern regions, the HSR has significantly negatively impacted the high-quality development of mining, wholesale and retail, water conservancy, environment, and public facilities management industries and CSE. The main reason is probably excessive competition and insufficient social responsibility, including environmental responsibility (see Table 11). It has a significant effect on the high-quality development of SGE enterprises. In the central region, the HSR significantly inhibits the high-quality development of enterprises in the mining, transportation, storage, postal (TSP), and recreation industries.
In contrast, they significantly positively impact the high-quality development of enterprises in the manufacturing and SGE industries. The HSR significantly positively affects the high-quality development of enterprises in the manufacturing and SGE industries and the general category. Compared with manufacturing enterprises, mining enterprises will exert negative externalities. It leads to negative social and environmental value creation. The HSR accelerates the reduction in high-quality development capabilities and the potential of such enterprises. Except for the positive impact of the HSR on the high-quality development of enterprises in the CSE in the western region, the effects on the high-quality development of enterprises in other industries are not significant. This is mainly attributable to the fact that the HSR improves the imbalance between supply and demand in the CSE in the western region and promotes the high-quality development of enterprises by stimulating the flow of factors and expanding the industry’s market size.

4.3.4. Heterogeneity Analysis Based on Different Enterprises

We further examine the HSR’s effect on the high quality of enterprises of different ages and sizes. The results are shown in Table 12. We could find that the HSR has a significant impact on the high-quality development of enterprises with an age of “less than seven years,” but the effect on the high-quality development of enterprises of “7–12 years” and “more than 12 years” is not significant. However, the impact of the HSR on the high-quality development of enterprises aged “7–12 years” and “more than 12 years” is not substantial. For enterprises in the “growth stage,” the HSR has relatively high factor flow and resource allocation effects, and has a significant role in promoting the high-quality development of enterprises. The main reason for the impact is that the enterprise is too old to create significant economic, social, and environmental value. It is gradually becoming saturated, production efficiency and technical capabilities reached an advanced level, and there is little room for the HSR to promote the high-quality development of their enterprises.
In addition, under the premise that there is heterogeneity in the scale of enterprises, the effect of HSRs on the high-quality development of enterprises is quite different. For firms smaller than 6 million RMB, the HSR has a significant inhibitory effect on the high-quality development of enterprises that encompasses economic performance, social responsibility, and environmental protection, perhaps due to the crowding out of foreign firms, substitution effects, or other market risk factors. The HSR significantly contributes to the high-quality development of enterprises, which scales between 600 and 20 million RMB. The result means that the benefits from the economic effects of the HSR are due to its relatively large size, ability to resist external risks, and ability to create its own economic, social, and environmental values compared to small-scale enterprises. When the enterprise’s scale is massive and exceeds a threshold, the enterprise’s ability and potential to create value will not be affected by the time-space compression effect of the HSR.
The HSR’s effect on different enterprise ownership structures is also different. We found it positively impacts the high-quality development of private enterprises (see Table 13). The HSR has a significant role in promoting the high-quality development of private enterprises, and the treatment effect is greater than the national average treatment effect. The reason is that a HSR fosters the improvement of resource allocation efficiency and the enhancement of operation and management capabilities of private enterprises through the flow of factors and the effect of resource allocation. Optimized resource allocation promotes the high-quality development of private enterprises. It provides new micro-evidence for the HSR to promote the high-quality development of enterprises and shows the vital position of private enterprises in the HSR to promote the high-quality development of enterprises.

4.4. Robustness Tests

The above model design solved the problem of heteroskedasticity, autocorrelation, and selection bias. However, endogeneity problems caused by factors such as omitted variable bias and measurement error still do not eliminate the interference of the impact coefficients. Thus, this paper conducts a series of robustness tests by changing the time point of policy implementation, replacing explanatory variables, replacing explanatory variables, endogeneity tests, and random sample regression.

4.4.1. Change the Time of Policy Implementation

Table 14 shows the results of the impact of HSRs on the high-quality development of enterprises after changing the year of policy implementation. Unlike some existing literature, which only takes 2011 as the year of HSR policy implementation for policy evaluation. This paper assumes the time of policy implementation as any year between 2009 and 2018, respectively. On the one hand, it tests the rationality and applicability of the policy implementation year and, on the other hand, excludes the influence of other policy factors or unobservable factors related to the year on the treatment effect.
As seen in Table 14, before 2014, the HSR had a significant positive impact on the high-quality development of enterprises, and the effect size showed an “up and down” change. In 2015 and after, the HSR had a nominal positive value on the high-quality development of enterprises. It shows that the positive impact of HSRs on the high-quality development of enterprises has a certain degree of continuity. In other words, the effect of the HSR is not just in the particular year in which the policy shock of the HSR took place. The period in our paper is from 2009 to 2014. Since the large-scale construction of the HSR in 2009, the railway network started to construct massively. Now that the “Four-vertical and Four-horizontal” railway network is fully completed, the “Incremental Effect” of the opening of the HSR on the high-quality development level of the enterprise is significant and continuous.

4.4.2. Replace the Explained Variable

This paper selects h q d e , the first-order lag term of h q d e , and industry-specific h q d e calculated based on the CSMAR database as the substituted explained variables for regression analysis to prevent the endogenous problems caused by measurement errors from affecting the research results.
As shown in Table 15, the stock effect of the opening of the HSR on the high-quality development of enterprises is insignificant. When the explained variable is replaced by h q d e with a lag period of one, the results show that the introduction of the HSR does not significantly promote the high-quality development level of enterprises in the following year. The sub-industry h q d e value obtained by dividing the whole sample into different industries is used to measure the relative TFP of various enterprises in the same industry. After replacing the explained variable with the industry-specific h q d e calculated based on the CSMAR database, a HSR has a significant positive impact on the high-quality development of enterprises. At the same time, the effects of HSRs on the high-quality development of enterprises became more prominent, which shows that, compared with the high-quality development of enterprises in the whole industry, the overall impact of the HSR on the high-quality development of enterprises in different industries is relatively more significant. The reason is that compared with treating the entire industry as the “black box,” it is fairer to put companies with similar characteristics into a small “black box” for h q d e comparison, and the calculation results may be more accurate. The influence coefficient is still significantly positive, which further proves the robustness of the benchmark regression conclusion.

4.4.3. Replace Explanatory Variables

The HSR lines are selected that represent the spatial distribution density of the HSR and the frequency of HSR operations that represent the service intensity of the HSR as alternative explanatory variables. This paper uses the double fixed effect model as the second identification strategy to explore the influence of variable selection factors on the robustness of research results (see Table 16). It can be found that the distribution density of the HSR has a significant negative impact on the high-quality development of enterprises. In contrast, HSR service intensity’s effects on the high-quality development of enterprises are insignificant. The result indicates that there is a possibility of little planning of the HSR distribution density. It also provides a basis for effectively using the HSR service station in the inner city for the promotion of high-quality development of enterprises. In improving the quality and efficiency of HSR construction in the new era, it is equally important to optimize the spatial layout of the HSR and strengthen the service intensity of the HSR.

4.4.4. Endogenous Analysis

This paper examines the impact of a HSR on the high-quality development level of enterprises at the micro-level. China’s infrastructure construction and planning, including the HSR, follow the “top-down” design concept and are not affected by the high-quality development level of micro-level enterprises; that is, there is no apparent reverse causality between the two logically caused by the interference of factors. To further solve the endogeneity problem, the two-stage least squares regression was carried out using urban elevation geographic data as instrumental variables for reference [27]. The elevation range of the city where the enterprise is located positively correlates with the difficulty of HSR construction. Meanwhile, the elevation range, as an exogenous geographical variable, is not related to h q d e and other economic, social, and environmental development indicators. This paper refers to the practice of Angrist and Krueger [89], using the interaction term between the logarithm of the elevation range and y e a r i t as an instrumental variable, and the results are shown in Table 16. The KP-Wald F and CD-Wald F statistics reject “weak instrumental variables” and prove that instrumental variables are influential. The first-stage regression results show that the instrumental variables are negatively correlated with the probability of opening a HSR in the city where the company is located, which is consistent with expectations. The second-stage regression results show that the elevation range, as an instrumental variable for the opening of the HSR, has a significant inhibitory effect on the high-quality development of enterprises. The result means that the smaller the height range, the higher the probability of the HSR opening, thus significantly promoting the high-quality development of enterprises. It proves that the benchmark regression results in this paper are relatively robust.

4.4.5. Random Sample Regression

In addition, referring to the studies of Coronado et al. [90] and Lu et al. [91] (2021), utilizing random sample regression, the results show that the design of the PSM-DID identification strategy in this paper did not suffer from the problem of omitting important variables, and the findings remain robust. This also indicates that the impact effect in the baseline regression analysis is indeed a result of the occurrence of the HSR opening policy.

5. Mechanism Inspection and Further Expansion Analysis

5.1. Mechanism Test

The above empirical analysis results prove that the conclusion that the HSR has a significant positive impact on the high-quality development of enterprises is robust. So how does the HSR affect the high-quality development of enterprises? What is the transmission mechanism of the effects of the HSR on the high-quality development of enterprises? According to the six main paths of labor, capital, and innovation factors proposed in the theoretical analysis, this paper conducts a mechanism test.

5.1.1. Analysis of Mediating Effect Based on Labor Mobility and Talent Gathering

We measure the enterprise’s and the prefecture-level cities’ labor mobility and talent agglomeration effects. As for labor mobility, we choose the scale of the labor force of enterprises and the employed population of prefecture-level cities to measure. Additionally, we select the following two indicators to measure talent agglomeration: the labor productivity of enterprises and the number of students in ordinary colleges and universities. As shown in Table 17, the “labor mobility” effect at the city level partially mediated the HSR promoting the high-quality development of enterprises. In other words, from the perspective of labor factors, the HSR mainly affects the scale of urban labor and thus affects the high-quality development of enterprises. However, the HSR did not reveal a significant effect on enterprises’ labor mobility and talent agglomeration. The possible reason is, on the one hand, as a macro-strategic layout plan, the primary function of the HSR is to change the spatial distribution of the economy and reshape the regional economic pattern rather than perform a microeconomic adjustment. On the other hand, under the influence of market mechanisms, the flow of enterprise labor, especially senior talents, is not only limited by factors such as performance-based wages, working environment, etc., but is also affected by social factors, such as the “distance” between the workplace and the family and the introduction of government talents. Therefore, the theoretical hypothesis that the HSR affects the high-quality development of enterprises through labor mobility is established, but it is mainly due to the “labor mobility” effect at the city level.

5.1.2. Analysis of Mediating Effect Based on Capital Widening and Capital Deepening

Based on the perspective of capital factors, this paper believes that the HSR affects the high-quality development of enterprises by affecting both capital widening and capital deepening. This paper uses the fixed assets of enterprises, the total investment in fixed assets of prefecture-level cities, the capital-labor rate, and the number of VCPE investments (the number of venture capital includes venture capital and private equity investment, referred to as VCPE.) in prefecture-level cities as the mechanism variables to test in order to verify the validity of this theoretical hypothesis. The results are shown in Table 18. The result indicates that the HSR has a significant positive impact on the “capital widening” from the perspective of cities and the “capital deepening” from the perspective of enterprises. Still, the effect of the capital-labor rate of enterprises on the high-quality development of enterprises is insignificant. The HSR promotes the high-quality development of enterprises by expanding the total urban fixed capital investment. This result shows that the HSR increases the total amount of urban capital but does not further promote the efficiency of urban capital allocation, which is expected to be realized through the government’s reasonable investment strategy and more targeted financing plans.
In addition, the HSR significantly promotes enterprise capital-labor rate but not enterprise fixed asset investment. On the one hand, the enterprise prefers intangible asset investment, as it is much easier to achieve than changing enterprise size and adjusting asset structure. On the other hand, the impact of the HSR on enterprise capital deepening is mainly reflected in two items of off-site investment and foreign investment, rather than improving capital allocation rate perspective.

5.1.3. Analysis of Mediating Effect Based on Knowledge Spillover and Technological Innovation

The content of this part is used to test whether HSRs can affect the high-quality development of enterprises through the effects of “knowledge spillover” and “technological innovation.” The HSR can improve the high-quality development of enterprises by reducing traffic costs, enhancing opportunities for cross-regional face-to-face communication, and promoting knowledge spillover and technological innovation based on innovative elements. Specifically, as shown in Table 19, the HSR significantly promotes knowledge spillovers and technological innovation at the city level. In contrast, the impact on innovation input and output at the enterprise level is insignificant. The analysis of the mediating effect model shows that the HSR promotes the high-quality development of enterprises by increasing the number of students in higher education rather than increasing the number of utility model patent disclosures. For instance, the city-level knowledge spillover effect partially mediates the process of the HSR influencing the high-quality development of enterprises. However, the technology innovation effect does not play any mediating role. In addition, HSR has no significant impact on enterprises’ innovation investment. What is worse, it even inhibits the growth of intangible enterprises’ assets. Therefore, the effect of HSR construction on promoting the high-quality development of enterprises by promoting enterprise knowledge spillover and technological innovation effect is yet to appear.

5.2. Further Analysis

Since smart city construction and the HSR are both characterized by incremental expansion, they become quasi-natural experiments to observe how new infrastructure affects the high-quality development of enterprises [11]. China officially issued the Notice on the Launch of Smart City Pilot Work and the first batch of smart city pilot lists in 2012, followed by the second and third batches of pilot lists in 2013 and 2014. We set this smart city construction as another exogenous policy shock. We examined a mediating effect model for the smart city construction mechanism affecting enterprises’ quality development (as shown in Table 20).
The results show that smart city construction significantly inhibits city-level knowledge spillover and technological innovation, while city-level knowledge spillover and technological innovation significantly promote the high-quality development of enterprises. The city-level innovation factor flow and resource allocation effects fully mediate the process of smart city construction, affecting the high-quality development of enterprises. Unlike the HSR, which mainly promotes the high-quality development of enterprises through the agglomeration effect of city-level elements, knowledge spillover and technological innovation at the city level are the main paths for smart city construction to affect the high-quality development of enterprises and the impact effect is greater than that of the HSR on the high-quality development of enterprises.

6. Discussion

6.1. Does HSR Promote the High-Quality Development of Enterprises?

The findings of this paper are consistent with the existing studies, and there is a significant contribution of the HSR to the high-quality development of enterprises [24,25]. In addition, this paper discusses the heterogeneous manifestations of the HSR affecting the high-quality development of enterprises from a richer perspective. The results of the heterogeneity analysis of regional and different ownership structure enterprises are also consistent with the results of Hu and Sun, Zhao et al. Furthermore, the results of the heterogeneity analysis of different urban agglomeration show that there is a significant positive effect of the HSR on the high-quality development of enterprises in the Pearl River Delta and Triangle of Central China, while the effect on other urban agglomerations is insignificant. The result is not only related to the strategic positioning, geographical location, and economic development of different city agglomerations but is also influenced by the “siphoning effect” of the central cities. In terms of city size and enterprise size, when their size is small, their market size and the transportation infrastructure level will be smaller. Meanwhile, the growth of enterprise quality under the factor flow and resource allocation effect of the HSR is higher. The regression results show heterogeneous results for different industry groups. The HSR negatively affects the high-quality development of culture, sports, and entertainment enterprises due to market localization and oligopoly control (undesirable competition). In addition, there is a significant inhibitory effect of the HSR on the high-quality development of the mining industry in the east and central regions due to the limitation of environmental and social value creation capacity.

6.2. What Is Primary Mechanism by Which the HSR Impacts Enterprises’ High-Quality Development?

The results of the mechanism test show that the factor mobility effect in the city dimension, but not in the firm scope, is the main path of action of the HSR to influence the high-quality development of firms. The reason is that the economic effects of the HSR are mainly reflected in the macro and meso dimensions. At the same time, the impact on the micro economy is mainly indirect through influencing factor mobility at the city dimension. However, unlike the impact of the urban factor mobility effect (quantity), the improvement of the urban factor allocation efficiency (quality) by the HSR is insignificant. In addition, further comparison reveals that innovative factor mobility and resource allocation at the city level are the main mechanisms of new infrastructure for high-quality business development. In summary, we argue that promoting the integrated development of the HSR and new infrastructure, i.e., improving the intelligence of HSR, may be beneficial to the mediating effect of factor allocation between the HSR and the high-quality development of enterprises. In other words, if we want the resource allocation effect to play a major role in the process of the HSR to promote high-quality development of enterprises instead of the factor flow effect, that is, to achieve the “quantitative” to “qualitative” transformation, the new infrastructure represented by the digital economy will bring a significant opportunity.

7. Conclusions Implications and Future Research

7.1. Conclusions

This paper treats the opening of the HSR in China as a quasi-natural experiment and intends to analyze the effect of the HSR on the high-quality development of enterprises. Firstly, we take 1331 A-share listed companies from 2007 to 2019 as the research object and match the data related to the prefecture-level cities where the companies are located to identify the impact effects effectively. Then, we do the heterogeneity analysis and mechanical tests of the HSR on the high-quality development of enterprises. The main research conclusions are as follows: (1) The HSR has a significant positive impact on the high-quality development of enterprises, and this finding is still robust after a series of robustness tests. (2) When sub-samples were investigated according to different regions and city scales, it was found that the HSR significantly promoted the high-quality development of enterprises in the central region, the Pearl River Delta, the Tringle of Central China, and small cities. From the group regression results, we find that the positive impact of the HSR on the high-quality development of enterprises is mainly in the following industries: scientific research, technical services and geological exploration, wholesale and retail, and manufacturing. Moreover, the HSR positively affects the high-quality development of enterprises mainly significant in enterprises, such as “growth” enterprises, private enterprises, western foreign enterprises, etc. In contrast, the negative impact appeared in the culture, sports, and entertainment industries, the mining industry, and small-scale enterprises in the eastern and central regions. (3) The mechanism test results show that the HSR mainly affects the high-quality development of enterprises through the urban “labor mobility effect”, capital expansion, and “knowledge spillover effect”. However, the “talent agglomeration” effect, “capital deepening” effect, and “technical innovation” effect are significant. The mediating role of the HSR in affecting the high-quality development of enterprises needs to be further explored. The difference is that knowledge spillover and technological innovation at the city level are the main paths for smart city construction to affect the high-quality development of enterprises. The impact effect is greater than that of the HSR on the high-quality development of enterprises.

7.2. Implications

7.2.1. Theoretical Contributions

This study enriches the theory of new economic geography with empirical evidence for peripatetic. According to the literature review section, there is a lack of systematic research on enterprise quality development in the existing literature, relatively few studies examine the economic effects of the HSR at the micro level, and even fewer studies discussed the HSR with enterprise quality development. In this paper, we use PSM-DID to identify the impact effects of the HSR on the high-quality development of enterprises and explore its heterogeneous performance in different dimensions. From a microscopic perspective, it complements the empirical evidence of transportation infrastructure contributing to high-quality sustainable economic, social, and environmental development.
This study also enriches the mechanism of the impact of the HSR on the high-quality development of enterprises. Taking labor, capital, and innovation as the three factors of production as the entry point, focusing on “quantity” and “quality” from two perspectives of factor flow and allocation efficiency, and based on the existing literature and research, the six impact mechanisms of the HSR on the high-quality development of enterprises are sorted out. In this study, the impact mechanism of the HSR on the high-quality development of enterprises is examined, and the linkage between the HSR and enterprise quality development is realized richer and more understandable way.
This study builds a more comprehensive index system for the high-quality development of enterprises. Drawing on the concept of sustainable development and the theory of corporate social responsibility, this paper expands the connotation of the high-quality development of enterprises in the existing research. Social and environmental factors are incorporated into the theoretical framework of the high-quality development of enterprises. Based on this, we construct a comprehensive high-quality development of enterprises index system with a multi-dimensional output of “economy-society-environment” to reflect as much different aspects of the high-quality development of enterprises as possible.

7.2.2. Management Enlightenment

The HSR is increasingly important in improving the country’s position in the global value chain and promoting high-quality sustainable economic, social, and environmental development. At the same time, HSRs, as an important material basis for people’s daily outings, work commuting, and tourism travel, became an essential link in human production and life. Exploring the impact effect and mechanism of the HSR on the high-quality development of enterprises provides a significant reference value for the construction of HSRs in the world and for countries to achieve high-quality sustainable development.
On the one hand, this study helps explore the drawbacks and shortcomings of the HSR in terms of spatial distribution, service intensity, and regional planning to build an efficient, safe, and reasonable modern HSR network and promote the construction of a strong transportation strategy. At the same time, it combines the important technical support of modern technology tools to finally reach the goal of building a sustainable national comprehensive three-dimensional transportation network construction [11]. On the other hand, identifying the driving factors behind the heterogeneous performance of the HSR on the high-quality development of enterprises is conducive to the development of targeted and differentiated programs to help achieve synergistic regional development, narrow the development gap between cities, and sustainable development of industries and enterprises. Finally, based on the results of the analysis of the mechanism of the HSR on the high-quality development of enterprises, the effective mechanism and weak links of the HSR to empower the high-quality development of enterprises are identified, and the market forces and government means are combined to promote the high-quality development of HSRs to empower enterprises.

7.2.3. Policy Implications

Firstly, it is necessary to concentrate on critical areas and weaknesses to help HSRs enable the high-quality development of enterprises. The government must focus on areas that undertake meaningful connection or transition functions in geographical locations. They also need to attach importance to the regions with crucial strategic development positions and the places in short supply for HSR transportation services to achieve a comprehensive connection from geographical proximity to transportation networks and break space barriers in an all-around way. At the same time, the government needs to pay more attention to the extension of lines connecting small cities beyond the central passage of the HSR. In particular, we should focus on small cities with characteristic industries and important eco-tourism values to prioritize opening the HSR and expand nationwide coverage. Combined with the significant traffic support brought by the opening of the HSR and the role of the “invisible hand,” we intend to alleviate market segmentation and regional development imbalance, maximize the economic welfare effect of the HSR, and achieve a nationwide coordinated enterprise quality development situation.
Secondly, it is necessary to implement specific policies according to the characteristics of the industry and jointly advance the high-quality development track of the enterprise. By the factor flow effect of the HSR, efficiency reform and agglomeration economies will continue as the leading roles in boosting the high-quality development of the manufacturing industry. Meanwhile, independent research and development, as well as innovative application of green production technology are essential starting points to break through the mining and other energy-intensive industries of the social and environmental value creation threshold. In addition, financial institutions are encouraged to take “improving the global industrial value chain and shaping the sustainable development ability of enterprises and themselves” as the value orientation. Additionally, actively guide capital factors to invest in long-distance enterprises with high-value creation ability and potential by relying on the accessibility brought by the HSR. Furthermore, continue to deepen cross-sectoral cooperation between knowledge-intensive industries and other industries, realize the further deepening of technological change and the role of economies of scope, and ultimately increase the role of the HSR in helping enterprises to develop high quality.
Thirdly, it is necessary to promote the rapid development of private enterprises and play a leading role in the entrepreneurial spirit of small and micro-enterprises. Constructing a HSR to open investment and financing channels for financial and investment institutions to private enterprises in different places is also essential. The government must also establish a more convenient cross-regional long-term cooperation mechanism between private enterprises and scientific research institutions. It could provide soil conducive to the rapid growth of private enterprises. Entrepreneurial talent and entrepreneurial spirit are essential for developing small, medium, and micro enterprises in the real economy. Focus on promoting entrepreneurs’ information communication and mutual learning through the HSR to guide entrepreneurs to pay attention to fulfilling social and environmental responsibilities. Encourage private enterprises to regularly publish high-quality development reports to achieve high-quality, sustainable development.
Lastly, promoting the digital economy will facilitate the construction of the HSR, stimulating the resource allocation effect. The process of the HSR affects the high-quality development of enterprises in the change from the leading role of the factor flow effect to the vital part of the resource allocation effect, that is, the transformation or transition of the mechanism of action from “quantity” to “quality.” Based on the blueprint for establishing a modern comprehensive transportation system by coordinating various transportation infrastructures, such as railways, highways, water transportation, and aviation, it is necessary to actively use modern information technologies such as 5G, the Internet of Things, big data, and artificial intelligence. In this way, it is vigorously improving the informatization and intelligence level of the HSR and the service quality. It is essential to give full play to the resource allocation effect of the HSR for energetically cultivating new kinetic energy for economic growth and ultimately accelerating the realization of the high-quality development goals of enterprises.

7.3. Future Research

The shortcomings of this paper are: (1) we did not try to explore the paths of the HSR influencing the high-quality development of enterprises from the perspective of service industry agglomeration, which may lead to the disadvantage of insufficient analysis of the mechanism; (2) the system of indicators of high-quality development of enterprises still omits some variables due to the problem of data availability and missing samples; (3) we did not further assess the benefits and costs of policy effects from the general equilibrium perspective based on the PSM-DID model [92,93].
In the future, we could explore the following questions to enrich the research: (1) Optimize the impact mechanism of the HSR on the high-quality development of enterprises. Explore the link between the HSR and the high-quality development of enterprises from more abundant or unique perspectives. (2) Conceptual update and index measurement of the high-quality development of enterprises. We will construct a more scientific and comprehensive theoretical framework based on interdisciplinary theoretical knowledge for the high-quality development of enterprises. At the same time, we will explore the latest frontier methods of total factor productivity measurement and build an index system for the high-quality development of enterprises that include comprehensive development information on enterprises. (3) Ensure the timeliness of policy evaluation models and methods. With the development of machine learning methods, the models and methods of policy evaluation are constantly updated, and it is expected that more effective and accurate policy evaluation models and methods will be established in the future. (4) Enrich the metrics of the HSR. We can use indicators from different perspectives, such as service intensity, service density, and system performance of the HSR [94], to measure the level and situation of HSR construction. (5) Further compare and analyze the magnitude of the impact of the HSR and new infrastructure on the high-quality development of enterprises, and try to answer the question “Can new infrastructure take over the traditional infrastructure represented by the HSR in the future and play an important role in the economic geography and the achievement of sustainable development goals?”

Author Contributions

Conceptualization, J.Y., J.C., W.Z. and Y.L.; methodology, Y.L.; software, Y.L.; validation, Y.L.; formal analysis, Y.L. and Z.Z.; investigation, Y.L.; resources, Y.L.; data curation, Y.L.; writing—original draft preparation, Y.L.; writing—review and editing, Y.L., W.Z., Z.Z., J.Y. and J.C.; visualization, Y.L.; supervision, J.Y. and J.C.; project administration, J.C.; funding acquisition, Y.L. and J.C. All authors have read and agreed to the published version of the manuscript.

Funding

This research was funded by the “1331 Project” Quality and Efficiency Improvement Construction Project in Shanxi Province, China (grant number: 012003010021).

Institutional Review Board Statement

Not applicable.

Informed Consent Statement

Not applicable.

Data Availability Statement

The data supporting this study’s findings are three-fold: HSR data mainly comes from the China Railway Yearbook; Enterprises’ data is available in the CSMAR database; The data of prefecture-level cities are primarily based on the China City Statistical Yearbook. In addition, the regional innovation and entrepreneurship capabilities derived from the IRIEC (URL: https://opendata.pku.edu.cn/dataset.xhtml?persistentId=doi:10.18170/DVN/PEFDAS accessed on 13 March 2020).

Conflicts of Interest

The authors declare no conflict of interest.

References

  1. Wen, Y.B.; Zhang, M.; Yu, F. A study on the resource reallocation effect of China’s transportation infrastructure. Econ. Res. J. 2022, 57, 155–171. Available online: https://kns.cnki.net/kcms/detail/detail.aspx?FileName=JJYJ202201013&DbName=CJFQ2022 (accessed on 13 March 2021).
  2. Vickerman, R.W. Can high-speed rail have a transformative effect on the economy? Transp. Policy 2017, 62, 31–37. [Google Scholar] [CrossRef]
  3. Jiang, C.; Liu, X. Does high-speed rail operation reduce ecological environment pressure? —Empirical evidence from China. Sustainability 2022, 14, 3152. [Google Scholar] [CrossRef]
  4. Miwa, N.; Bhatt, A.; Kato, H. High-speed rail development and regional inequalities: Evidence from Japan. Transp. Res. Rec. 2022, 2676, 363–378. [Google Scholar] [CrossRef]
  5. Liu, L.; Zhang, M. The impacts of high-speed rail on regional accessibility and spatial development—Updated evidence from China’s Mid-Yangtze River city-cluster region. Sustainability 2021, 13, 4227. [Google Scholar] [CrossRef]
  6. Liu, S.; Wan, Y.; Zhang, A. Does China’s high-speed rail development lead to regional disparities? A network perspective. Transp. Res. Part A Policy Pract. 2020, 138, 299–321. [Google Scholar] [CrossRef]
  7. Ahlfeldt, G.M.; Feddersen, A. From periphery to core: Measuring agglomeration effects using high-speed rail. J. Econ. Geogr. 2018, 18, 355–390. [Google Scholar] [CrossRef]
  8. Fosu, P. Does Railway Lines Investments Matter for Economic Growth? Econ.-Innov. Econ. Res. J. 2021, 9, 11–24. [Google Scholar] [CrossRef]
  9. Hayakawa, K.; Koster, H.; Tabuchi, T.; Thisse, J.F. High-Speed Rail and the Spatial Distribution of Economic Activity: Evidence from Japan’s Shinkansen. 1 February 2021. CEPR Discussion Paper No. DP15771. 1–67. Available online: https://ssrn.com/abstract=3783997 (accessed on 5 June 2022).
  10. Koster, H.; Tabuchi, T.; Thisse, J.F. To be connected or not to be connected? the role of long-haul economies. J. Econ. Geogr. 2022, 22, 711–753. [Google Scholar] [CrossRef]
  11. Kong, L.; Zhang, Z. Does infrastructure upgrading make cities more entrepreneurial? Evidence from high-speed railway and smart city construction. Foreign Econ. Manag. 2020, 42, 139–152. [Google Scholar] [CrossRef]
  12. Huang, S.; Xiao, H.; Wang, X. Study on high-quality development of the state-owed enterprises. China Ind. Econ. 2018, 10, 19–41. [Google Scholar] [CrossRef]
  13. Wu, B.; Li, W.; Chen, J. Networked Transport and Economic Growth: Does High-Speed Rail Narrow the Gap between Cities in China? Sustainability 2022, 14, 5937. [Google Scholar] [CrossRef]
  14. Lin, S.; Dhakal, P.R.; Wu, Z. The Impact of High-Speed Railway on China’s Regional Economic Growth Based on the Perspective of Regional Heterogeneity of Quality of Place. Sustainability 2021, 13, 4820. [Google Scholar] [CrossRef]
  15. Baum-Snow, N.; Henderson, J.V.; Turner, M.A.; Zhang, Q.; Brandt, L. Does investment in national highways help or hurt hinterland city growth? J. Urban Econ. 2020, 115, 103124. [Google Scholar] [CrossRef]
  16. Baum-Snow, N.; Brandt, L.; Henderson, J.V.; Turner, M.A.; Zhang, Q. Roads, railroads, and decentralization of Chinese cities. Rev. Econ. Stat. 2020, 99, 435–448. [Google Scholar] [CrossRef]
  17. Baum-Snow, N. Did highways cause suburbanization? Q. J. Econ. 2007, 122, 775–805. [Google Scholar] [CrossRef]
  18. Lv, Y.; Wu, Y. The effect of high-speed rail and the reconstruction of economic geography in the Yangtze River Delta: Based on the perspective of new industrial revolution. Mod. Econ. Res. 2019, 9, 74–77. [Google Scholar] [CrossRef]
  19. Sun, W.; Niu, D.; Wan, G. Transportation infrastructure and industrial structure upgrading: Evidence from China’s high-speed railway. J. Manag. World 2022, 38, 19–34+58+35–41. [Google Scholar] [CrossRef]
  20. Lu, Y.; Yang, S.; Li, J. The influence of high-speed rails on urban innovation and the underlying mechanism. PLoS ONE 2022, 17, e0264779. [Google Scholar] [CrossRef]
  21. Bian, Y.; Wu, L.; Bai, J. Does high-speed rail improve regional innovation in China? J. Financ. Res. 2019, 6, 132–149. [Google Scholar]
  22. Jia, R.; Shao, S.; Yang, L. High-speed rail and CO2 emissions in urban China: A spatial difference-in-differences approach. Energy Econ. 2022, 99, 105271. [Google Scholar] [CrossRef]
  23. Li, Q.; Dong, A.; Zhang, B. Impact of the opening of high-speed rail on environmental pollution in the Yangtze River Economic Belt: Promoting or inhibiting? Int. J. Environ. Sci. Technol. 2022, 1–16. [Google Scholar] [CrossRef]
  24. Hu, H.; Sun, L. Has the opening of high-speed rail promoted the high-quality development of enterprises in non-hub city? Res. Financ. Econ. Issues 2021, 12, 123–132. [Google Scholar] [CrossRef]
  25. Zhao, T.; Xiao, X.; Dai, Q. Transportation infrastructure construction and high-quality development of enterprises: Evidence from the quasi-natural experiment of high-speed railway opening in China. Sustainability 2021, 13, 13316. [Google Scholar] [CrossRef]
  26. Xian, J.; Wang, W. High-speed railway and productivity of servicing enterprises: Evidence from Chinese listed companies. J. Bus. Econ. 2020, 10, 73–85. [Google Scholar]
  27. Xu, Y.; Li, Y.; Li, S. Does high-speed rail help or hurt total factor productivity of enterprises in marginal cities. Res. Transp. Bus. Manag. 2022, 43, 100837. [Google Scholar] [CrossRef]
  28. Yang, X.; Lin, S.; Zhang, J. Does high-speed rail promote enterprises productivity? Evidence from China. J. Adv. Transp. 2019, 2019, 1279489. [Google Scholar] [CrossRef]
  29. Wang, Z.; Wang, H. Low-carbon city pilot policy and high quality development of enterprises: From the perspective of economic effiency and social benefit. Bus. Manag. J. 2022, 44, 43–62. [Google Scholar] [CrossRef]
  30. Dai, G.; Wang, Y. High quality development of private small, medium and micro enterprises: Connotation, dilemma and path. Econ. Probl. 2019, 8, 54–61. [Google Scholar] [CrossRef]
  31. Luo, B.; Liu, Y. Tax incentives, innovation input and high quality development of businesses. Tax Econ. Res. 2020, 25, 13–21. [Google Scholar] [CrossRef]
  32. Liu, H.; Liu, C.; Zheng, S. The effect of new ambient air quality standards on the high-quality development of Chinese enterprises. China Soft Sci. 2020, 10, 45–55. Available online: https://kns.cnki.net/kcms/detail/detail.aspx?FileName=ZGRK202010005&DbName=CJFQ2020 (accessed on 15 April 2021).
  33. Li, Q. The dynamic mechanism and realization paths of high-quality development of the manufacturing enterprises in the new era. Financ. Econ. 2019, 6, 57–69. Available online: https://css.researchcommons.org/journal/vol2020/iss3/4 (accessed on 15 April 2021).
  34. Gladwin, T.N.; Kennelly, J.J.; Krause, T.-S. Shifting paradigms for sustainable development: Implications for management theory and research. Acad. Manag. Rev. 1995, 20, 874–907. [Google Scholar] [CrossRef]
  35. Chen, L.; Fu, Y. The dynamic characteristics of technological innovation affecting the high-quality development of enterprises under the constraints of financing. China Soft Sci. 2019, 12, 108–128. Available online: https://kns.cnki.net/kcms/detail/detail.aspx?FileName=ZGRK201912010&DbName=CJFQ2019 (accessed on 21 October 2021).
  36. Chen, Z.; Liu, Y. Government subsidies, enterprise innovation and high-quality development of manufacturing enterprises. Reform 2019, 8, 140–151. Available online: https://kns.cnki.net/kcms/detail/detail.aspx?FileName=REFO201908012&DbName=CJFQ2019 (accessed on 11 July 2021).
  37. Lu, X.; Lian, Y. Estimation of total factor productivity of industrial enterprises in China: 1999-2007. China Econ. Q. 2012, 11, 541–558. [Google Scholar] [CrossRef]
  38. Zhou, J.; Fan, X.; Yu, A. The impact of high-speed railway accession on agricultural exports: Evidence from Chinese agriculture-related enterprises. Complexity 2021, 2021, 4225671. [Google Scholar] [CrossRef]
  39. Liu, X.; Wen, S. Should financial institutions be environmentally responsible in China? Facts, theory and evidence. Econ. Res. J. 2019, 54, 38–54. Available online: https://kns.cnki.net/kcms/detail/detail.aspx?FileName=JJYJ201903004&DbName=CJFQ2019 (accessed on 20 April 2021).
  40. Zhai, S.; Bi, X.; Li, S. The Enterprise dualistic innovation investment under time and space compression: The Evidence of high-speed railway opening. South China J. Econ. 2020, 9, 54–68. [Google Scholar] [CrossRef]
  41. Ma, G.; Cheng, X.; Yang, E. How does transportation infrastructure affect capital flows—A study from high-speed rail and cross-region investment of listed companies. China Ind. Econ. 2020, 6, 5–23. [Google Scholar] [CrossRef]
  42. Wen, W.; Huang, Y.; Song, J. Does the construction of transportation infrastructure improve the efficiency of corporate investment?—Quasi-natural experiment based on the opening of High-speed railway in China. J. Zhongnan Univ. Econ. Law 2019, 2, 42–52. [Google Scholar] [CrossRef]
  43. Tang, Y.; Yu, F.; Lin, F.; Zhang, M. China’s high-speed railway, trade cost and firm export. Econ. Res. J. 2019, 54, 158–173. Available online: https://kns.cnki.net/kcms/detail/detail.aspx?FileName=JJYJ201907012&DbName=CJFQ2019 (accessed on 13 March 2021).
  44. Zhu, S.; Li, S. How does opening high speed railway affect the export products quality of firms. J. Macro-Qual. Res. 2020, 8, 14–30. Available online: https://kns.cnki.net/kcms/detail/detail.aspx?FileName=HGLY202003003&DbName=CJFQ2020 (accessed on 13 March 2021). [CrossRef]
  45. Xiao, L.; Dai, W. High-speed rail hub and enterprise innovation: An interpretation from the perspective of peer effect. J. Technol. Econ. 2021, 40, 11–24. Available online: https://kns.cnki.net/kcms/detail/detail.aspx?FileName=JSJI202112003&DbName=CJFQ2021 (accessed on 13 May 2021).
  46. Chen, J.; Fang, J. Transportation infrastructure improvement and dynamic adjustment of firm capital structure: Empirical evidence based on high-speed railway coverage. Foreign Econ. Manag. 2022, 44, 138–152. [Google Scholar] [CrossRef]
  47. Tan, J.; Ding, H.; Tan, Z. High speed rail opening and corporate innovation—Based on the Quasi-natural experiment on high-speed railway opening. J. Shanxi Univ. Financ. Econ. 2019, 41, 60–70. [Google Scholar] [CrossRef]
  48. Ji, Y.; Yang, Q. Can the high-speed rail service promote enterprise innovation? A study based on Quasi-natural experiments. J. World Econ. 2020, 43, 147–166. Available online: https://kns.cnki.net/kcms/detail/detail.aspx?FileName=SJJJ202002008&DbName=CJFQ2020 (accessed on 21 October 2021).
  49. Zhu, Z.; Huang, X.; Wang, H. Does traffic infrastructure promote innovation? A quasi-natural experiment based on the expansion of the high-speed railway network in China. J. Financ. Res. 2019, 11, 153–169. Available online: https://kns.cnki.net/kcms/detail/detail.aspx?FileName=JRYJ201911009&DbName=CJFQ2019 (accessed on 13 March 2021).
  50. Wang, Y.; Ni, P.; Zhao, J.; Wang, Y. Travel distance, commuting frequency and corporate innovation from the perspective of high-speed rail and spatial relationship with central cities. Financ. Trade Econ. 2021, 42, 150–165. [Google Scholar] [CrossRef]
  51. Sun, W.; Zhang, J. Can the high-speed rail network promote high-quality innovation in Manufacturing enterprises? J. World Econ. 2020, 43, 151–175. Available online: https://kns.cnki.net/kcms/detail/detail.aspx?FileName=SJJJ202012008&DbName=CJFQ2020 (accessed on 13 March 2021).
  52. Sun, W.; Zhang, J. High-speed rail network, factor reverse agglomeration and manufacturing corporate innovation. J. Xi’an Jiaotong Univ. (Soc. Sci.) 2022, 42, 85–95. [Google Scholar] [CrossRef]
  53. Li, X.; Ji, X.; Zhou, L. Can high-speed railway improve enterprises’ resource allocation? Micro-evidence from the annual survey of industrial firms in china and high-speed railway geographic data. Econ. Rev. 2017, 6, 3–21. [Google Scholar] [CrossRef]
  54. Wang, Y.; Pan, P.; Tang, C. Opening of HSR, geographical location and the governance effect of PE. Economic Geography (accepted). Available online: http://kns.cnki.net/kcms/detail/43.1126.K.20200710.1411.002.html (accessed on 13 March 2021).
  55. Jin, B. Study on the “high-quality development” economics. China Ind. Econ. 2018, 4, 5–18. [Google Scholar] [CrossRef]
  56. Marshall, A. The principles of economics. Political Sci. Q. 2004, 77, 519–524. Available online: http://socserv.mcmaster.ca/econ/ugcm/3ll3/marshall/prin/index.html (accessed on 13 March 2021).
  57. Teece, D.J.; Pisano, G.; Shuen, A. Dynamic capabilities and strategic management. Strateg. Manag. J. 1997, 18, 509–533. [Google Scholar] [CrossRef]
  58. Hofer, C.W.; Schendel, D. Strategy formulation: Analytical concepts. West Pub. 1978, 51, 6989–6992. [Google Scholar] [CrossRef]
  59. Brundtland, G.H. Our common future—call for action. Environ. Conserv. 1987, 14, 291–294. [Google Scholar] [CrossRef]
  60. Ren. The theoretical logic of political economy of high-quality development in the new era and its relevance. J. Humanit. 2018, 2, 26–34. [Google Scholar] [CrossRef]
  61. Chu, J.; Fang, J. Improvement of transport infrastructure and bank loan decision: Based on a quasi-natural experiment of high-speed railway in China. Account. Econ. Res. 2019, 33, 38–60. [Google Scholar] [CrossRef]
  62. Wang, W.; Ma, H. High-speed railway network, labor transfer and industrial space agglomeration. Contemp. Econ. Manag. 2019, 41, 38–48. [Google Scholar] [CrossRef]
  63. Li, S.A.; Gong, L.; Pan, S.; Luo, F. Wage and price differences, technology gap and labor flow dynamics. Econ. Model. 2020, 88, 211–222. [Google Scholar] [CrossRef]
  64. Dong, X.; Zheng, S.; Kahn, M.E. The role of transportation speed in facilitating high skilled teamwork across cities. J. Urban Econ. 2019, 115, 103212. [Google Scholar] [CrossRef]
  65. Yang, X.; Zhang, H.; Li, Y. High-speed railway, factor flow and enterprise innovation efficiency: An empirical analysis on micro data. Socio-Econ. Plan. Sci. 2022, 82, 101305. [Google Scholar] [CrossRef]
  66. Liang, L.; Lu, Y. Research on the influence of multidimensional proximity on the performance of school-enterprise innovation cooperation. J. Technol. Econ. 2022, 41, 62–74. Available online: https://kns.cnki.net/kcms/detail/detail.aspx?FileName=JSJI202202006&DbName=CJFQ2022 (accessed on 21 October 2021).
  67. Yu, Y.; Pan, Y. Does high-speed rail reduce the rural-urban income disparity? An interpretation based on the perspective of heterogeneous labor mobility. Chin. Rural. Econ. 2019, 1, 79–95. Available online: https://kns.cnki.net/kcms/detail/detail.aspx?FileName=ZNJJ201901006&DbName=CJFQ2019 (accessed on 13 March 2021).
  68. Shen, H.; Cheng, X.; Yang, M. Does the opening of the high-speed rail increase the efficiency of the capital market?—A study based on stock price synchronicity. Chin. Rev. Financ. Stud. 2020, 12, 48–68+124–125. Available online: https://kns.cnki.net/kcms/detail/detail.aspx?FileName=JRPL202001006&DbName=CJFQ2020 (accessed on 9 March 2022).
  69. Wei, S.; Gu, J.; Jiang, Y. A review of knowledge spillover, absorptive capacity and economic Performance. Mod. Econ. Res. 2017, 9, 123–132. [Google Scholar] [CrossRef]
  70. Guo, J.; Bai, J. How CHSR construction drives the innovation of enterprises. Econ. Theory Bus. Manag. 2019, 5, 60–74. Available online: https://kns.cnki.net/kcms/detail/detail.aspx?FileName=JJLL201905006&DbName=CJFQ2019 (accessed on 13 March 2021).
  71. Zong, G.; Zhang, X. High-speed railway, technological innovation and high-quality economic development—Empirical test and mechanism research. J. Shanxi Univ. Financ. Econ. 2020, 42, 1–14. [Google Scholar] [CrossRef]
  72. Levinsohn, J.; Petrin, A. Estimating production functions using inputs to control for unobservables. Rev. Econ. Stud. 2003, 70, 317–341. [Google Scholar] [CrossRef]
  73. Yu, X.; Feng, X.; Kang, Z.; Yu, W. COVID-119, social security reduction and total factor productivity of enterprises. Econ. Sci. 2022, 4, 108–123. [Google Scholar]
  74. Ren, Y.; Zhang, X.; Wu, J.; Chu, Z. Government subsides, R&D investment and total factor productivity: An empirical study of Chinese manufacturing enterprises. Sci. Decis. Mak. 2022, 7, 44–62. [Google Scholar]
  75. Yang, W.; Wang, Q. Can resolving overcapacity improve green total factor productivity? A Quasi-natural experiment based on China’s industrial de-capcity. Econ. Probl. 2022, 7, 1–12. [Google Scholar] [CrossRef]
  76. He, L.; Qi, X. Environmental regulation and green total factor productivity—Evidence from Chinese industrial enterprises. Econ. Perspect. 2022, 6, 97–114. [Google Scholar]
  77. Cai, L.; Wang, P. Digital economy and urban green total factor productivity: Influencing mechanism and empirical evidence. Stat. Decis. 2022, 38, 11–16. [Google Scholar] [CrossRef]
  78. Ren, S.; Lv, Z. The financial constraints, the government subsides and the factor productivity: A case study on the equipment-manufacturing enterprises in China. J. Manag. World 2014, 11, 10–23+187. [Google Scholar] [CrossRef]
  79. Zhang, Z.; Liu, Z. Do government innovation subsidies improve firm’s total factor productivity? A comparative study on the impacts of innovation and non-innovation subsidies. Ind. Econ. Res. 2022, 3, 113–127. [Google Scholar] [CrossRef]
  80. Pang, R.; Wang, L. Is the development of Chinese service industry definitely green?—Based on Analysis of environmental total factor efficiency of service industry. Ind. Econ. Res. 2016, 4, 18–28. [Google Scholar]
  81. Yin, X.; Ouyang, F. The re-estimation of total factor productivity and the economic growth sustainability comparison among different economic growth model in China. J. Quant. Tech. Econ. 2019, 36, 72–91. [Google Scholar] [CrossRef]
  82. Zhan, Y.; Li, S. Smart city construction, entrepreneurial vitality and high-quality economic development: Analysis based on the GTFP perspective. J. Financ. Econ. 2022, 48, 4–18. [Google Scholar] [CrossRef]
  83. Gao, Y.; Yang, G.; Xie, Q. Impact of environmental regulation on green total factor productivity from the perspective of public participation theory: Testing based on spatial econometric model and threshold effect. Sci. Technol. Manag. Res. 2020, 40, 232–240. [Google Scholar]
  84. Tang, P.; Yang, S. Research on corporate social responsibility investment pattern: Based on value criterion. China Ind. Econ. 2016, 7, 109–126. [Google Scholar] [CrossRef]
  85. Yang, H.; Shi, X.; Wang, S. The Impact of Heterogeneous Corporate Social Responsibility on Green Technology Innovation. Shandong Soc. Sci. 2022, 2, 165–175. [Google Scholar] [CrossRef]
  86. O’Donnell, C.J. The Sources of Productivity Change in the Manufacturing Sectors of the U.S. Economy. CEPA Working Papers Series 2011, 1–56. Available online: http://www.uq.edu.au/economics/cepa/docs/WP/WP072011.pdf (accessed on 9 March 2022).
  87. Wen, Z.; Zhang, L.; Hou, J.; Liu, H. Testing and application of the mediating effects. Acta Psychol. Sin. 2004, 5, 614–620. Available online: https://kns.cnki.net/kcms/detail/detail.aspx?FileName=XLXB200405016&DbName=CJFQ2004 (accessed on 9 March 2021).
  88. Shi, D.; Hu, K.; Chen, J. Does urban civilization promote the high-quality development of enterprises? A research based on the perspectives of environmental regulation and transaction cost. Ind. Econ. Res. 2019, 6, 27–38. [Google Scholar] [CrossRef]
  89. Angrist, J.D.; Keueger, A.B. Does compulsory school attendance affect schooling and earnings? Q. J. Econ. 1991, 106, 979–1014. [Google Scholar] [CrossRef]
  90. Coronado, J.M.; Ureña, J.M.D.; Miralles, J.L. Short-and long-term population and project implications of high-speed rail for served cities: Analysis of all served Spanish cities and re-evaluation of Ciudad Real and Puertollano. Eur. Plan. Stud. 2019, 27, 434–460. [Google Scholar] [CrossRef]
  91. Lu, G.; Dong, R.; Ye, C. Does “the Belt and Road Initiative” promote high-quality exports—Evidence from firms in China. China Ind. Econ. 2021, 3, 80–98. [Google Scholar] [CrossRef]
  92. Duflo, E. Schooling and labor market consequences of school construction in Indonesia: Evidence from an unusual policy experiment. Am. Econ. Rev. 2001, 91, 795–813. [Google Scholar] [CrossRef]
  93. Lu, Y.; Wang, J.; Zhu, L. Place-based policies, creation, and agglomeration economies: Evidence from China’s economic zone program. Am. Econ. J. Econ. Policy 2019, 11, 325–360. [Google Scholar] [CrossRef]
  94. Bouraima, M.B.; Stević, Ž.; Tanackov, I.; Qiu, Y. Assessing the performance of Sub-Saharan African (SSA) railways based on an integrated Entropy-MARCOS approach. Oper. Res. Eng. Sci. Theory Appl. 2021, 4, 13–35. [Google Scholar] [CrossRef]
Figure 1. Mechanism analysis.
Sustainability 14 11330 g001
Figure 2. Model feasibility test results. (a) Represents equilibrium test results; (b) shows common support area bar chart.
Sustainability 14 11330 g002
Table 2. Enterprise high-quality development index system.
IndexPrimary IndicatorSecondary IndicatorTertiary Indicator
InputLaborLabor scaleLabor scale
CapitalFixed assets investmentFixed assets investment
Government subsidiesThe number of government subsidiesGovernment subsidies
InnovationR&D investmentR&D investment
OutputEconomic performanceProfitabilityReturn on equity
SolvencyAsset liability ratio
Social responsibilityEmployee responsibilityAnnual employment growth rate, employee compensation payable growth rate
Social responsibilityTotal tax payment, social donations
Environmental responsibilityEnvironmental awarenessEnvironmental awareness
Environmental disclosureDisclosure of sudden environmental accidents, environmental supervision, and certification
Environmental governanceEnvironmental protection investment amount
Table 3. Index meaning.
IndexesSymbolMeaning
Technical progressTFP*Technological progress beyond production technology
Technical efficiencyOTEProduction technology progress
Scale efficiencyOSEEfficiency value increase caused by the enterprise-scale change
Residual mixing efficiencyRMEProductivity growth is promoted by resource allocation efficiency
Table 4. Distribution of stock types of listed companies after screening.
TypesA ShareB ShareST, *ST Share
Number of listed companies133114156
Proportion (%)88.670.9310.39
Note: ST shares are stocks of listed companies in China that are subject to special treatment. *ST stock is an upgraded version of ST stock, which is a special treatment for Chinese listed companies that are subject to a warning of the risk of termination of listing.
Table 5. The number of samples in the treatment group and the control group from 2007 to 2019.
Year2007200820092010201120122013201420152016201720182019
Treatment0102135195361408426519630672687716719
Control1331122911961136970923905812701659644615612
Table 6. Descriptive statistics of the main variables.
VariablesSymbolMeasurementObs.MeanStd. Err.Min.Max.
Explained variable
High-quality development of enterpriseshqdeThe logarithm of TFP17,3030.03430.1159−1.50894.0160
Explanatory variable
Treatment effectdidHSR opening or not17,3030.29690.456901
Firm control variables
Firm sizelnesThe logarithm of the total assets of the enterprise17,30320.78381.620817.839626.4485
Firm ageeaFirm age17,30317.25405.55905.000031.0000
Ownership concentrationocShareholding ratio of the first shareholder17,30335.080015.33008.480074.9600
Annual foreign investment amountlnaoiThe logarithm of the annual foreign investment amount17,30317.05742.59783.810121.9926
Net profitrproNet profit17,30320,10079,900−37,100656,000
City control variables
Environmental pollutionlniwThe logarithm of industrial wastewater discharge17,3039.08311.00765.834811.2013
OpeninglnfdiFDI in logarithm17,30312.14441.89912.322715.0094
Fixed investmentlntfaiThe logarithm of total fixed asset investment17,3037.44411.13534.66439.4764
Economic developmentlngdpGDP in logarithm17,30315.29252.67405.510618.8262
Industrial structuredtidWeight of tertiary sector in GNP17,30349.450512.712325.130080.9800
Technology expenditurelnsreTechnology expenditure logarithm17,30310.36521.84295.963514.3461
InfrastructurelnraThe actual urban road area at the end of the year17,3038.29320.97925.69379.6998
Financial developmentlndfdnLoan balance as a percentage of GDP17,30315.61212.85433.947921.6705
EmploymentlnreCitywide employed population17,3035.42581.06132.97397.3680
Table 7. Benchmark regression results.
Variables(1)(2)(3)(4)(5)(6)(7)
Basic RegressionAdd X_ItDifferent Fixed EffectsDifferent Clustering Robustness Criteria ErrorsPSM-DID
did0.388 ***0.0710.0520.314 **0.314 **0.314 **0.269 **
(0.054)(0.084)(0.091)(0.123)(0.126)(0.126)(0.126)
_cons−13.821 ***−12.907 ***−12.571 ***−18.257 ***−18.257 ***−18.257 ***−14.619 ***
(0.033)(0.959)(1.356)(3.907)(5.544)(5.686)(5.338)
Year fixedNoNoYesYesYesYesYes
Firm fixedNoNoNoYesYesYesYes
Clustering robust standard errorNoNoNoNoYesYesYes
N17,30317,30317,30317,30317,30317,30317,303
Adj. R20.1490.1490.1490.144
Note: (i) Robust standard errors for clustering are in parentheses; (ii) ***, ** indicate that the coefficients are significant at the 1% and 5% statistical levels, respectively; (iii) due to space limitations, only the core explanatory variables are presented, as well as year fixed effects and firm-fixed effects. The information about clustering robustness criteria error will also not be repeated in the notes of the following tables.
Table 8. Heterogeneity analysis results of HSRs in different urban agglomerations on the high-quality development of enterprises.
VariablesBeijing–Tianjin–Hebei Yangtze River DeltaPearl River DeltaThe Triangle of Central ChinaChengdu and ChongqingCentral Plains
did0.2410.4100.733 **0.855 **0.5840.430
(0.538)(0.241)(0.242)(0.395)(0.482)(0.678)
_cons−62.975 **4.371−19.287−16.195−38.620 ***−20.988
(24.392)(9.027)(60.277)(17.499)(8.335)(25.178)
N5811921645498318154
Adj. R20.0310.0810.0970.0650.1460.142
Note: (i) Robust standard errors for clustering are in parentheses; (ii) ***, ** indicate that the coefficients are significant at the 1% and 5%statistical levels, respectively.
Table 9. Heterogeneity analysis results of HSRs in different cities on the high-quality development of enterprises.
VariablesDifferent City LocationsDifferent City Scales
Eastern
Region
Central
Region
Western
Region
Small and Medium-Sized CitiesLarge CitiesSupercities and Megacities
did0.1390.583 **0.4904.615 ***0.5060.190
(0.167)(0.267)(0.331)(0.000)(0.332)(0.166)
_cons−14.638 **−13.085−11.9446.059 ***−15.392−13.990 **
(6.786)(11.612)(28.403)(0.004)(16.141)(6.165)
N394911217854511293808
Adj. R20.1450.1420.1651.0000.1190.143
Note: (i) Robust standard errors for clustering are in parentheses; (ii) ***, ** indicates that the coefficients are significant at the 1% and 5% statistical levels, respectively.
Table 10. Heterogeneity analysis results of the HSR on the high-quality development of enterprises in different industries.
VariablesManufacturingWholesale and Retail TradeScientific Research, Technical Services, and Geological Exploration IndustryCulture, Sports, and Entertainment
did0.475 ***102.722 ***132.247 ***−2.758 ***
(0.170)(0.313)(0.461)(0.000)
_cons−10.908 **394.379 ***2899.217 ***−101.106 ***
(5.341)(2.363)(9.806)(0.027)
N312438931
Adj. R20.1411.0001.0001.000
Note: (i) Robust standard errors for clustering are in parentheses; (ii) ***, ** indicates that the coefficients are significant at the 1% and 5%statistical levels.
Table 11. Heterogeneity analysis results of the HSR on the high-quality development of enterprises in different industries by region.
Region NameIndustry NameInfluence CoefficientCluster Robust Standard Error
Eastern RegionMining−1.863 *−1.01
Wholesale and retail trade−7.352 ***−0.059
Scientific research, technical services, and geological exploration industry132.247 ***−0.461
Water, environment, and public facilities management industry−28.202 ***−0.161
Culture, sports, and entertainment−153.590 ***−0.714
Central RegionMining−13.523 ***−0.009
Manufacturing0.675 *−0.383
Transportation, storage, and postal industry−2.422 **−1.013
Scientific research, technical services, and geological exploration industry49.555 ***−0.027
Culture, sports, and entertainment−6.312 ***−0.008
Comprehensive industry116.600 ***−0.222
Western RegionCulture, sports, and entertainment0.453 ***−0.003
Note: (i) Robust standard errors for clustering are in parentheses; (ii) ***, **, and * indicate that the coefficients are significant at the 1%, 5%, and 10% statistical levels, respectively.
Table 12. Heterogeneity analysis results of HSRs on high-quality development of enterprises of different ages.
VariablesEnterprise Age (Years)Enterprise Size (Million Yuan)
<77–12≥12>66~200>200
did8.891 ***0.2520.176−8.489 ***0.228 *0.200
(1.517)(0.428)(0.150)(0.000)(0.125)(0.129)
_cons547.427 **−9.337−8.536209.408 ***−14.760 ***−15.356 ***
(231.785)(21.418)(5.641)(0.011)(4.871)(5.282)
N11692544233057545263
Adj. R20.7270.2370.1281.0000.1340.128
Note: (i) Robust standard errors for clustering are in parentheses; (ii) ***, **, and * indicate that the coefficients are significant at the 1%, 5%, and 10% statistical levels, respectively.
Table 13. Heterogeneity analysis results of HSRs on the high-quality development of enterprises with different ownership structures.
VariablesState-Owned EnterprisesPrivate EnterpriseForeign-Invested EnterprisesOther Enterprises
did0.2180.490 *−0.8300.477
(0.156)(0.256)(0.977)(0.854)
_cons−18.762 ***−8.798−54.04853.281
(6.502)(8.412)(39.632)(56.859)
N37401777168149
Adj. R20.1220.1720.2340.242
Note: (i) Robust standard errors for clustering are in parentheses; (ii) *** and * indicate that the coefficients are significant at the 1% and 10% statistical levels, respectively.
Table 14. Regression results from changing policy implementation time points.
Year200920102012201320142015201620172018
did0.269 **0.269 **0.277 **0.222 *0.241 *0.2000.1200.1500.174
(0.126)(0.126)(0.130)(0.134)(0.140)(0.162)(0.196)(0.298)(0.437)
_cons−14.619 ***−14.619 ***−14.921 ***−14.815 ***−14.748 ***−14.676 ***−14.600 ***−14.321 ***−14.134 ***
(5.338)(5.338)(5.343)(5.342)(5.340)(5.351)(5.382)(5.344)(5.282)
N546454645464546454645464546454645464
Adj. R20.1380.1380.1380.1380.1380.1380.1370.1370.137
Note: (i) Robust standard errors for clustering are in parentheses; (ii) ***, **, and * indicate that the coefficients are significant at the 1%, 5%, and 10% statistical levels, respectively.
Table 15. Regression results from replacing explained variables and explanatory variables.
VariablesReplace the Explained VariableReplace Explanatory Variables
hqdeL1. hqdehqde.industry l_hsrf_hsr
core explanatory variables−0.0010.0130.321 **−0.084 *0.017
(0.003)(0.026)(0.133)(0.049)(0.131)
_cons−0.041−0.446−6.035−14.823 ***−14.660 ***
(0.207)(0.530)(4.162)(3.497)(3.373)
N54645059644369526952
Adj. R20.0220.0150.1610.0530.053
Note: (i) Robust standard errors for clustering are in parentheses; (ii) ***, **, and * indicate that the coefficients are significant at the 1%, 5%, and 10% statistical levels, respectively.
Table 16. Regression results of the instrumental variable method.
IV
Panel A: Second Stage Regression
did−3.055 ***
(1.053)
_consYes
Year fixedYes
Firm fixedYes
Panel B: First Stage Regression
did−0.013 ***
(0.003)
KP-Wald F-statistic16.364
CD-Wald F-statistic65.720
N5340
Adj. R20.371
Note: (i) Robust standard errors for clustering are in parentheses; (ii) *** indicates that the coefficients are significant at the 1% statistical level.
Table 17. Mechanism analysis results based on the labor mobility effect and talent agglomeration effect.
VariablesLabor flowTalent Gathering
lnlshqdelnrehqdemed1hqdelnsrehqde
did−0.0330.266 ***−0.069 ***0.276 **3.8 × 1060.257 **−0.0280.250 **
(0.036)(0.125)(0.013)(0.125)(3.3 × 10⁶)(0.122)(0.021)(0.123)
med −0.189 *** −0.327 * 5.2 × 10−9 *** −0.067
(0.094) (0.197) (1.4 × 10⁻⁹) (0.100)
_cons8.7 × 10−5 ***−18.629 ***1.727 ***−20.435 ***−3.9 × 10⁸ ***−19.211 ***−8.261 ***−18.264 ***
(1.397)(5.186)(0.566)(5.291)(1.4 × 10⁸)(5.267)(0.698)(4.643)
N68855855688558556885585568715844
Adj. R20.5820.1440.81450.1380.2120.1440.8730.138
Note: (i) Robust standard errors for clustering are in parentheses; (ii) ***, **, and * indicate that the coefficients are significant at the 1%, 5%, and 10% statistical levels, respectively.
Table 18. Mechanism analysis results are based on the capital widening and deepening effects.
VariablesCapital WideningCapital Deepening
lnfaihqdetfaihqdemed2hqdeo3hqde
did0.0450.267 **0.057 ***0.267 **5.6 × 105 *0.264 **0.9180.318 **
(0.036)(0.125)(0.014)(0.125)(3.3 × 10⁵)(0.125)(0.733)(0.150)
med −0.258 *** −6.9 × 10⁻⁶ *** 3.7 × 10⁻⁹ 0.004
(0.077) (3.85 × 10⁻⁵) (4.3 × 10⁻⁹) (0.004)
_cons4.238 ***−18.629 ***4339.660−18.629 ***−3.2 × 10⁷−18.525 ***18.347−13.489 **
(1.374)(5.186)(3420.582)(5.186)(4.8 × 10⁷)(5.198)(20.494)(6.173)
N68855855688558556885585551854374
Adj. R20.5320.1380.5490.1380.1680.1380.0150.129
Note: (i) Robust standard errors for clustering are in parentheses; (ii) ***, **, and * indicate that the coefficients are significant at the 1%, 5%, and 10% statistical levels, respectively.
Table 19. Mechanism analysis results based on the knowledge spillover effect and technological innovation effect.
Knowledge SpilloversTechnological Innovation
lnrdilnhqdelntein_3lnhqdelnialnhqdeo5lnhqde
did0.0470.0940.052 ***0.240 **−0.095 *0.250 **1.186 ***0.314 **
(0.083)(0.215)(0.018)(0.124)(0.050)(0.123)(0.437)(0.150)
med −0.149 ** 0.160 *** −0.045 0.004
(0.073) (0.090) (0.042) (0.009)
_cons0.041−14.222 **8.893 ***−19.442 ***49.397 ***−13.692 **−8.211 ***−18.629
(2.198)(6.347)(0.499)(4.620)(16.932)(6.223)(0.740)(5.186)
N33962376687058465160437468855855
Adj. R20.4170.0560.2680.1400.0250.1290.8750.144
Note: (i) Robust standard errors for clustering are in parentheses; (ii) ***, **, and * indicate that the coefficients are significant at the 1%, 5%, and 10% statistical levels, respectively.
Table 20. Mechanism analysis results based on smart city construction.
Knowledge SpilloversTechnological Innovation
lnrdilnhqdelntein_3lnhqdelnialnhqdeo5lnhqde
DID−0.0300.155−0.180 ***0.065−0.0200.019−1.034 **0.018
(0.085)(0.256)(0.032)(0.155)(0.063)(0.153)(0.433)(0.165)
med −0.181 ** 0.207 ** −0.053 0.024 **
(0.085) (0.096) (0.053) (0.011)
_cons0.041−14.222 **8.893 ***−19.442 ***−0.579−18.022 ***63.326 ***−12.581 *
(2.198)(6.347)(0.499)(4.620)(1.862)(6.054)(16.388)(6.818)
N32012239624952866273530246443913
Adj. R20.4450.0570.2170.1370.3200.1350.0290.124
Note: (i) Robust standard errors for clustering are in parentheses; (ii) ***, **, and * indicate that the coefficients are significant at the 1%, 5%, and 10% statistical levels, respectively.
Publisher’s Note: MDPI stays neutral with regard to jurisdictional claims in published maps and institutional affiliations.

