

Urban Resilience and Residential Greenery—The Evidence from Poland

Abstract
:1. Introduction
1.1. The Concept of Resilience
1.2. Urban Green Spaces (UGS)
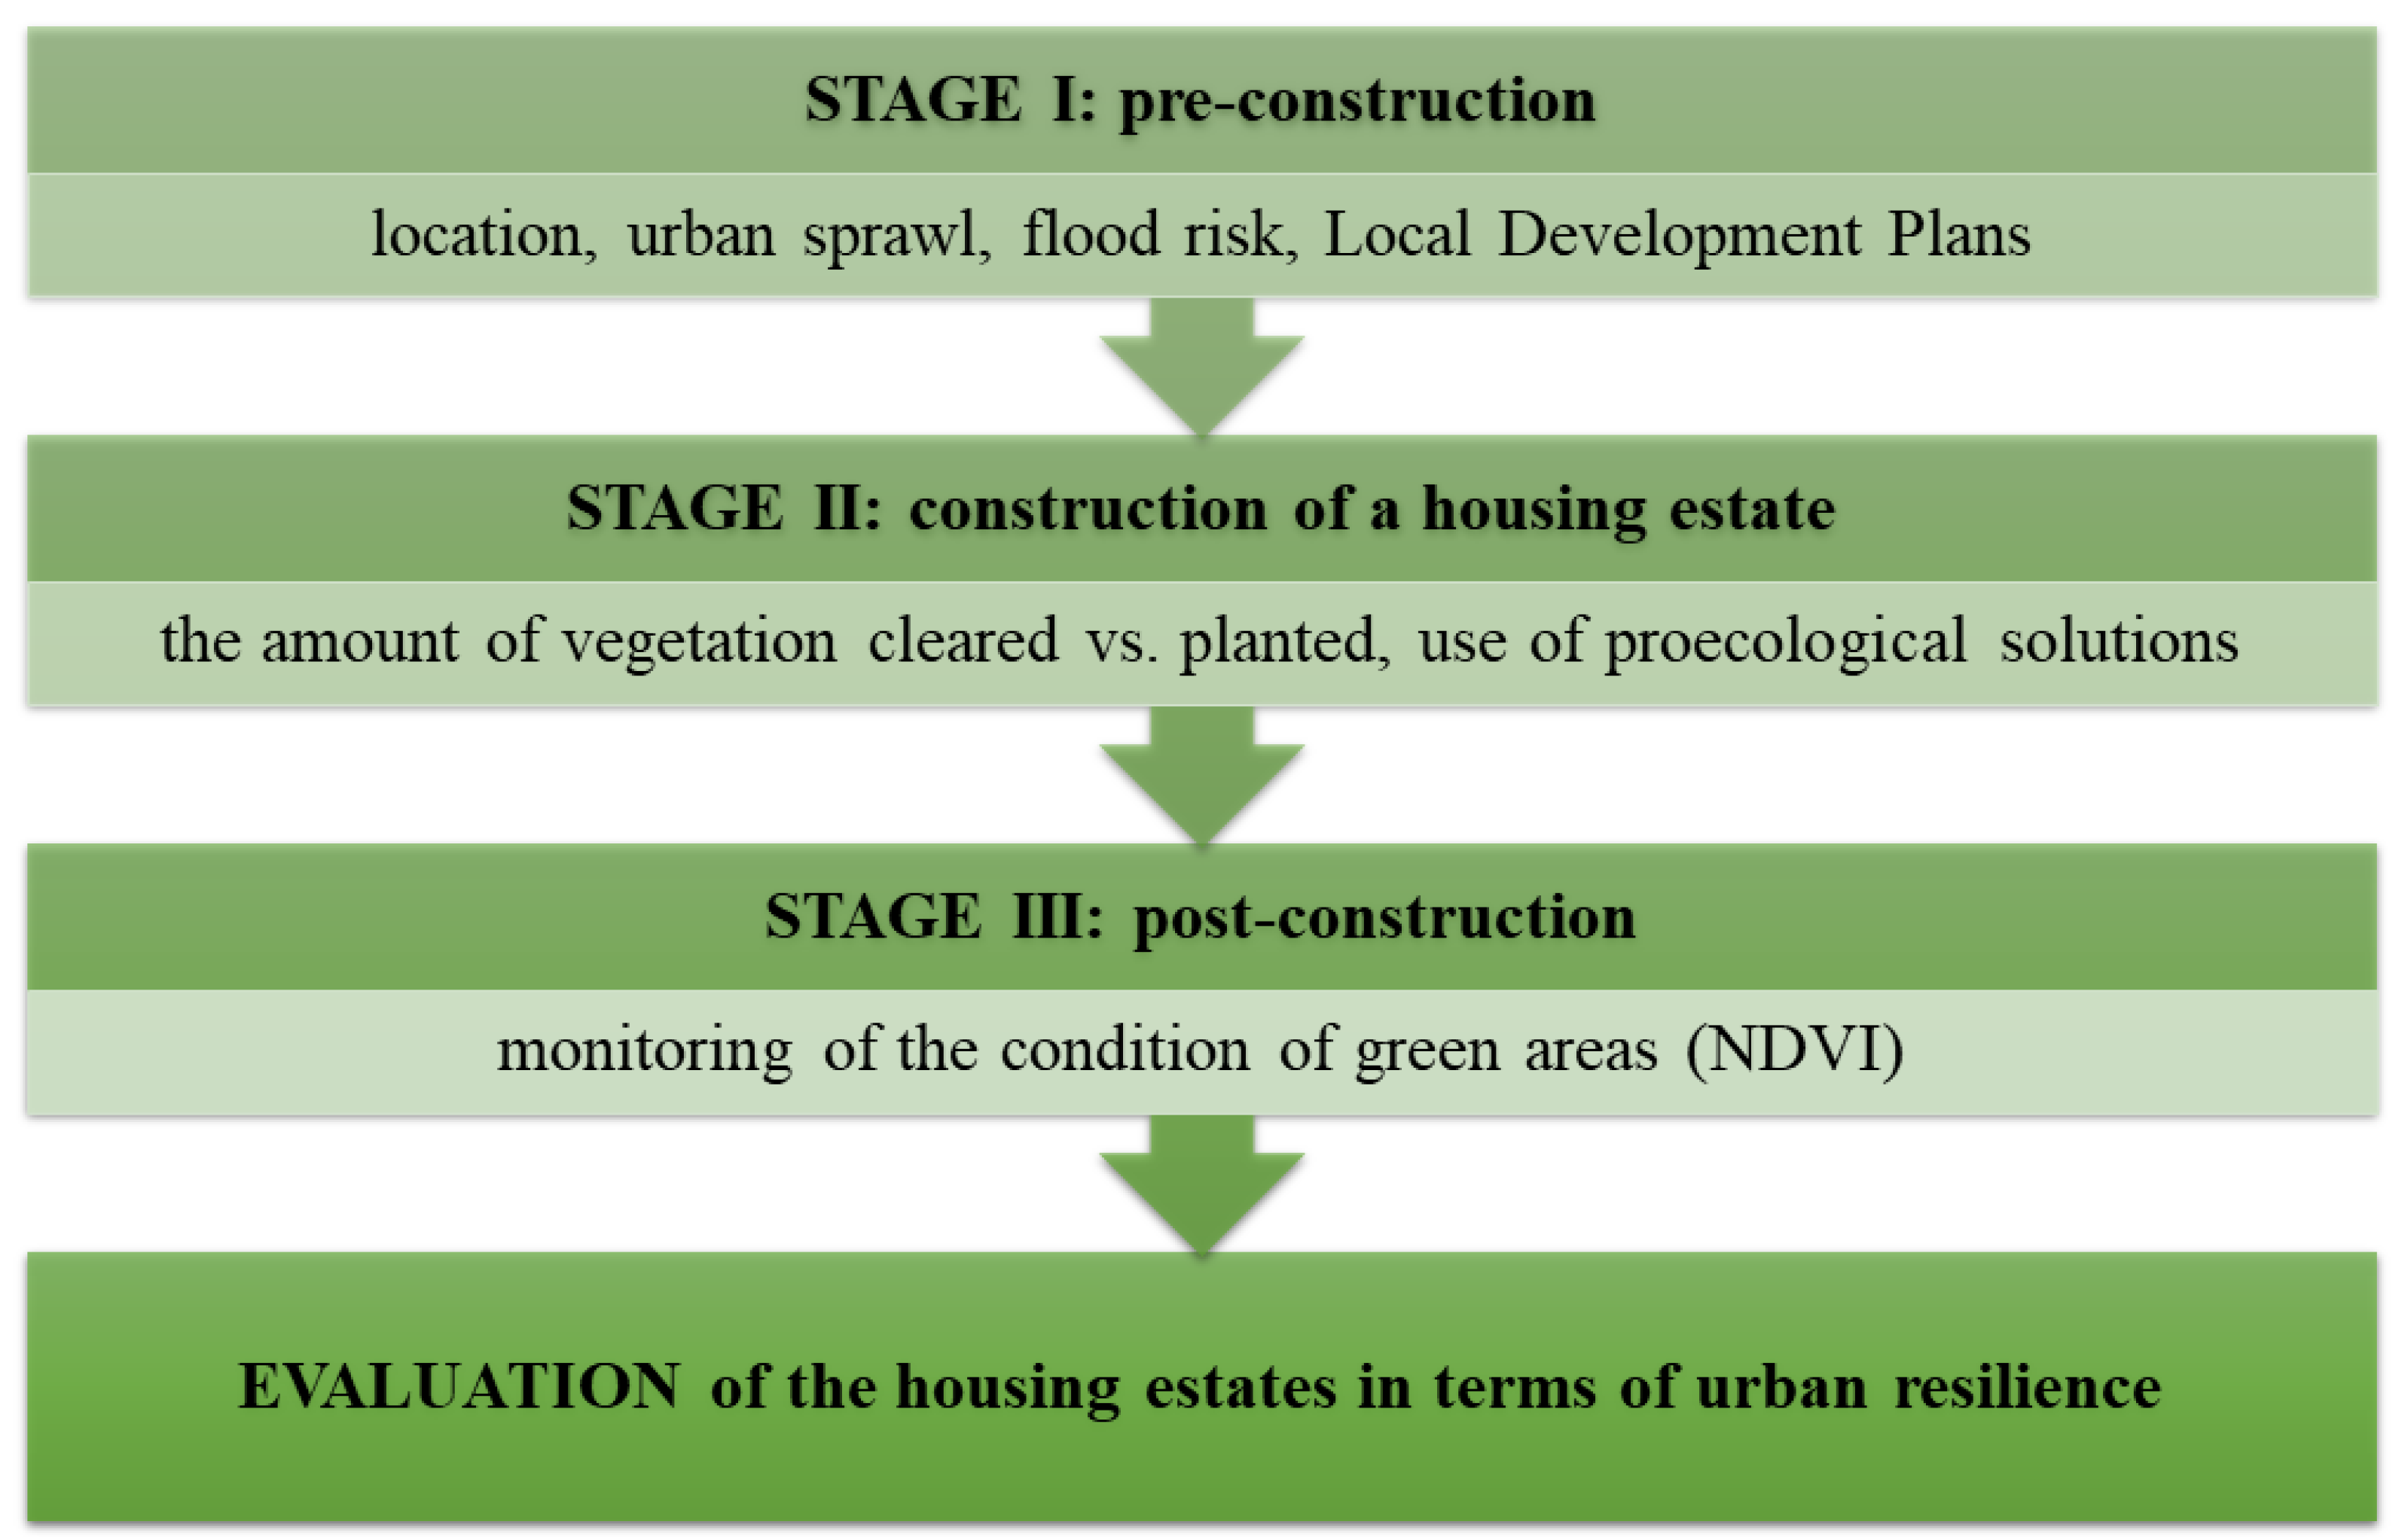
2. Materials and Methods
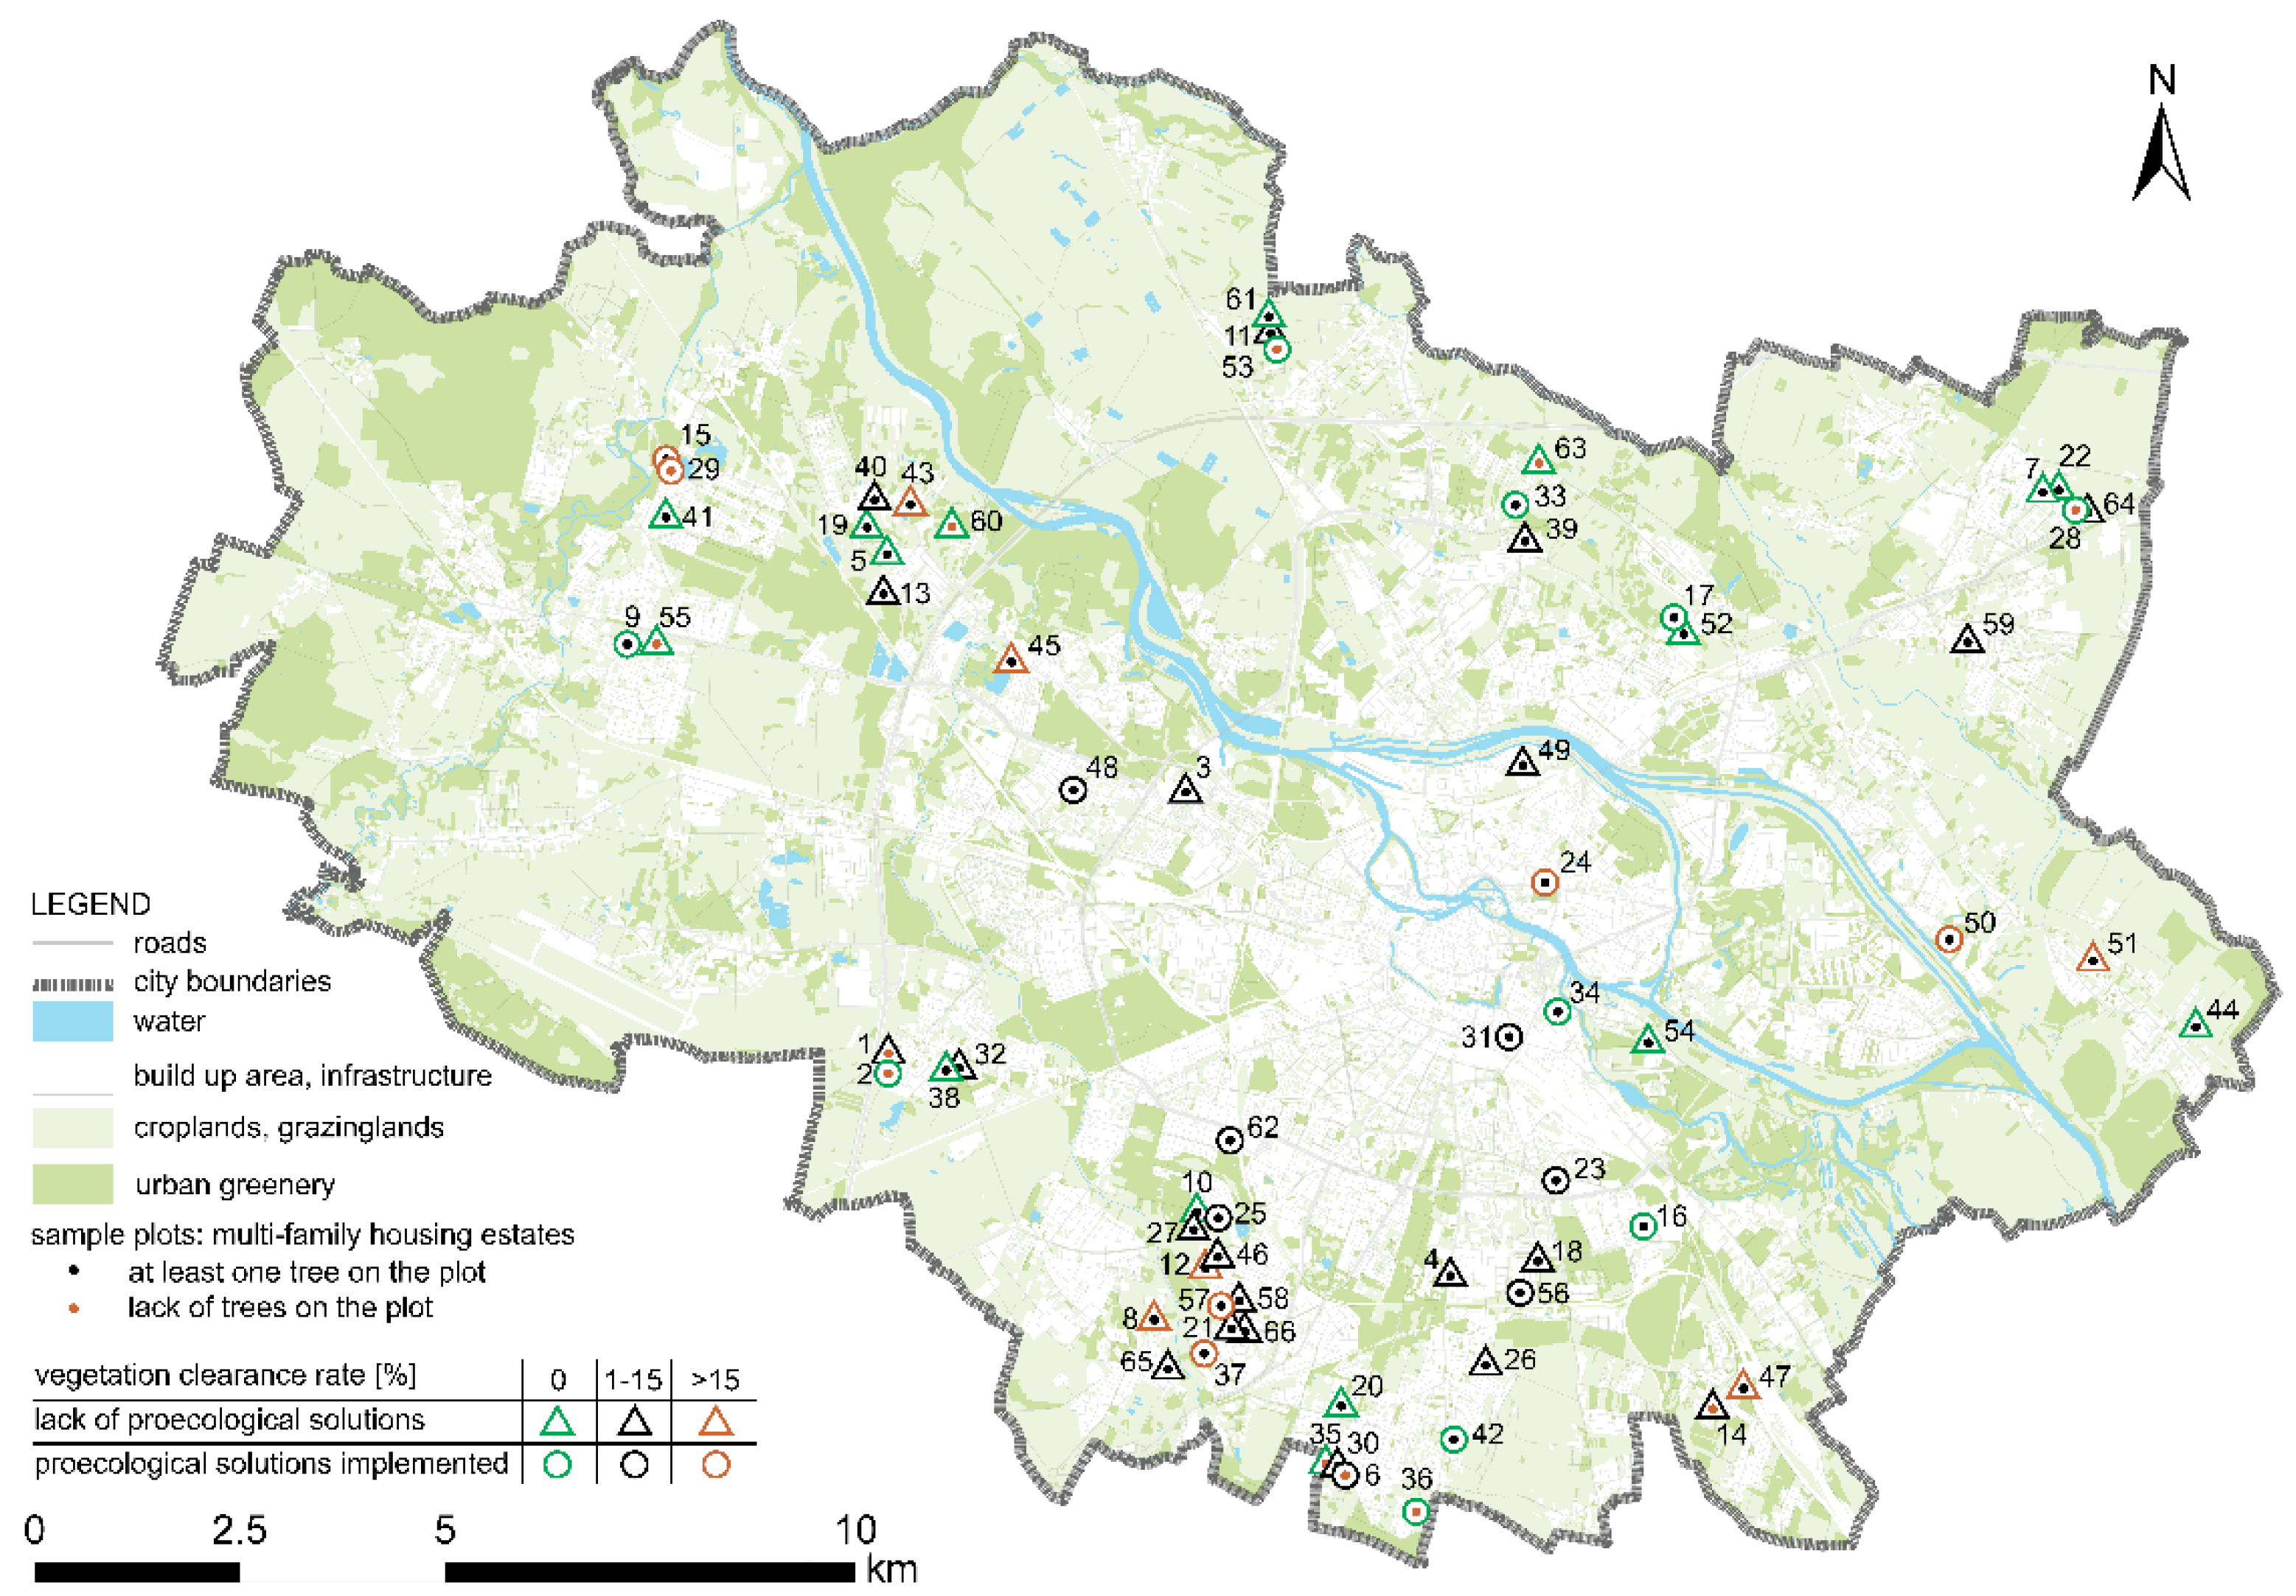
2.1. Study Area
- Urban sprawl;
- Intensification of extreme weather phenomena;
- Decrease in UGS areas;
- Air pollution (one of the worst affected areas in Poland);
- UHI intensification.
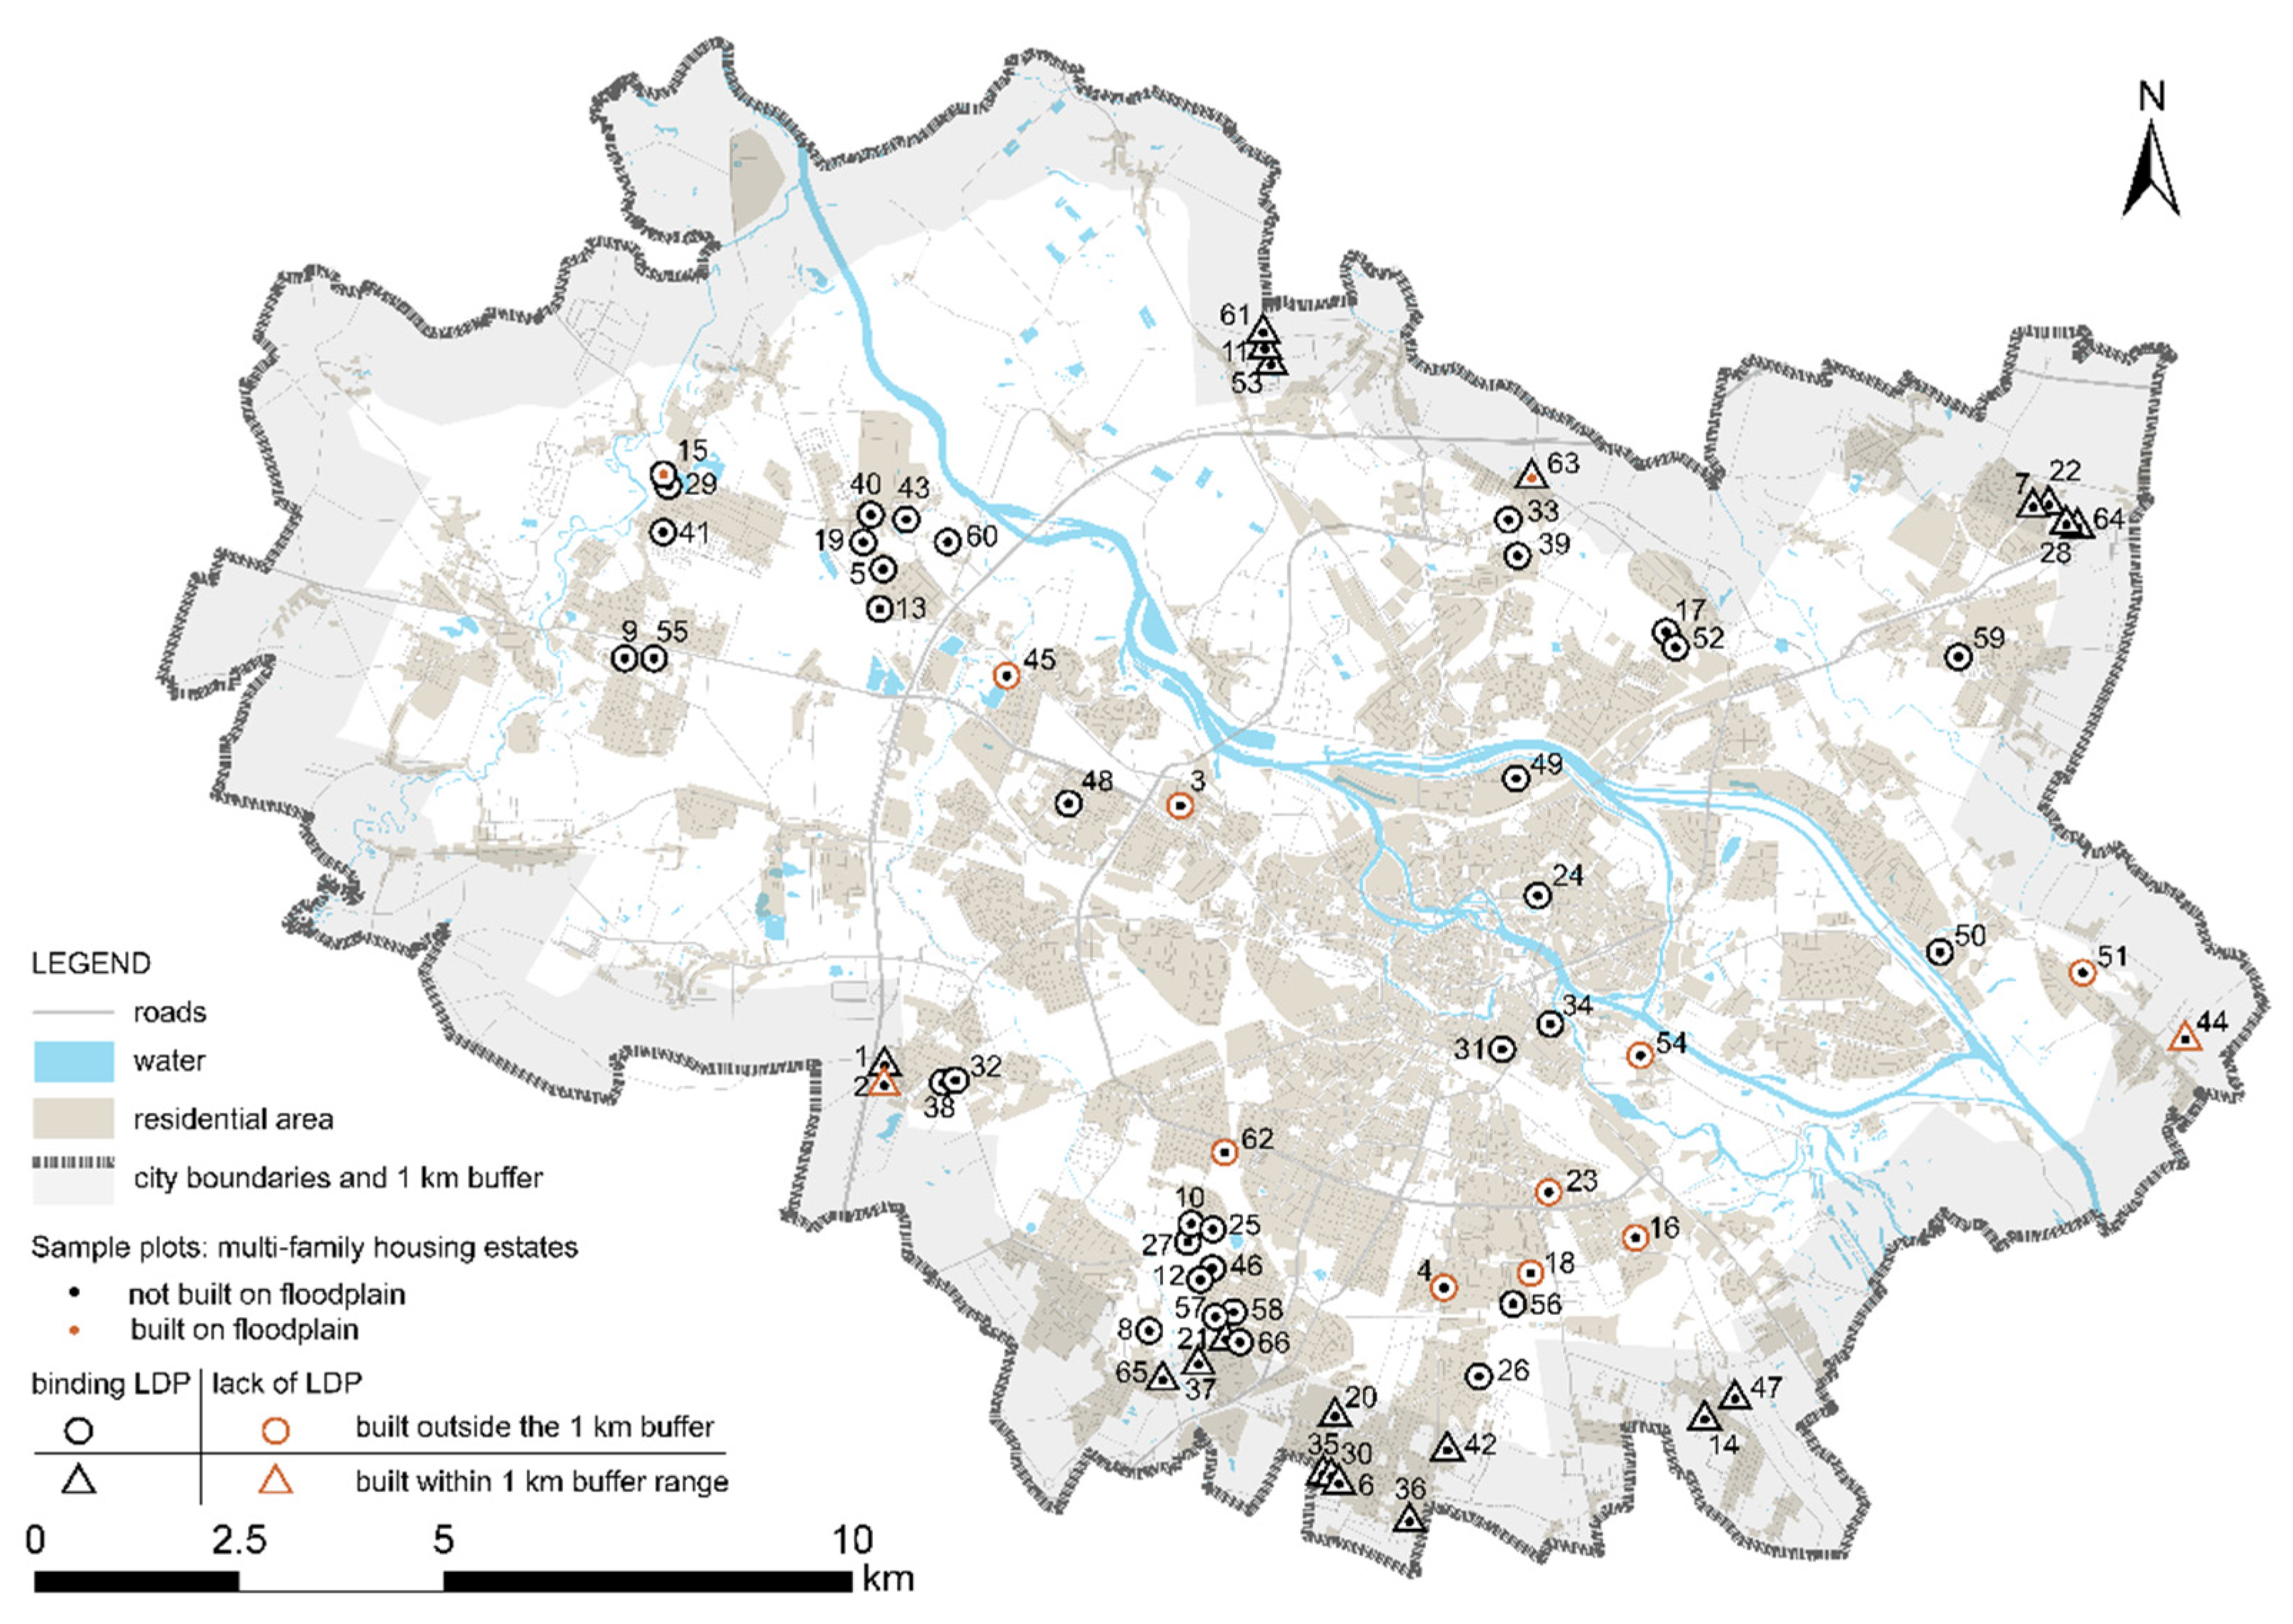
2.2. Selection of Multi-Family Housing Estates
2.3. Analyses—Stage I
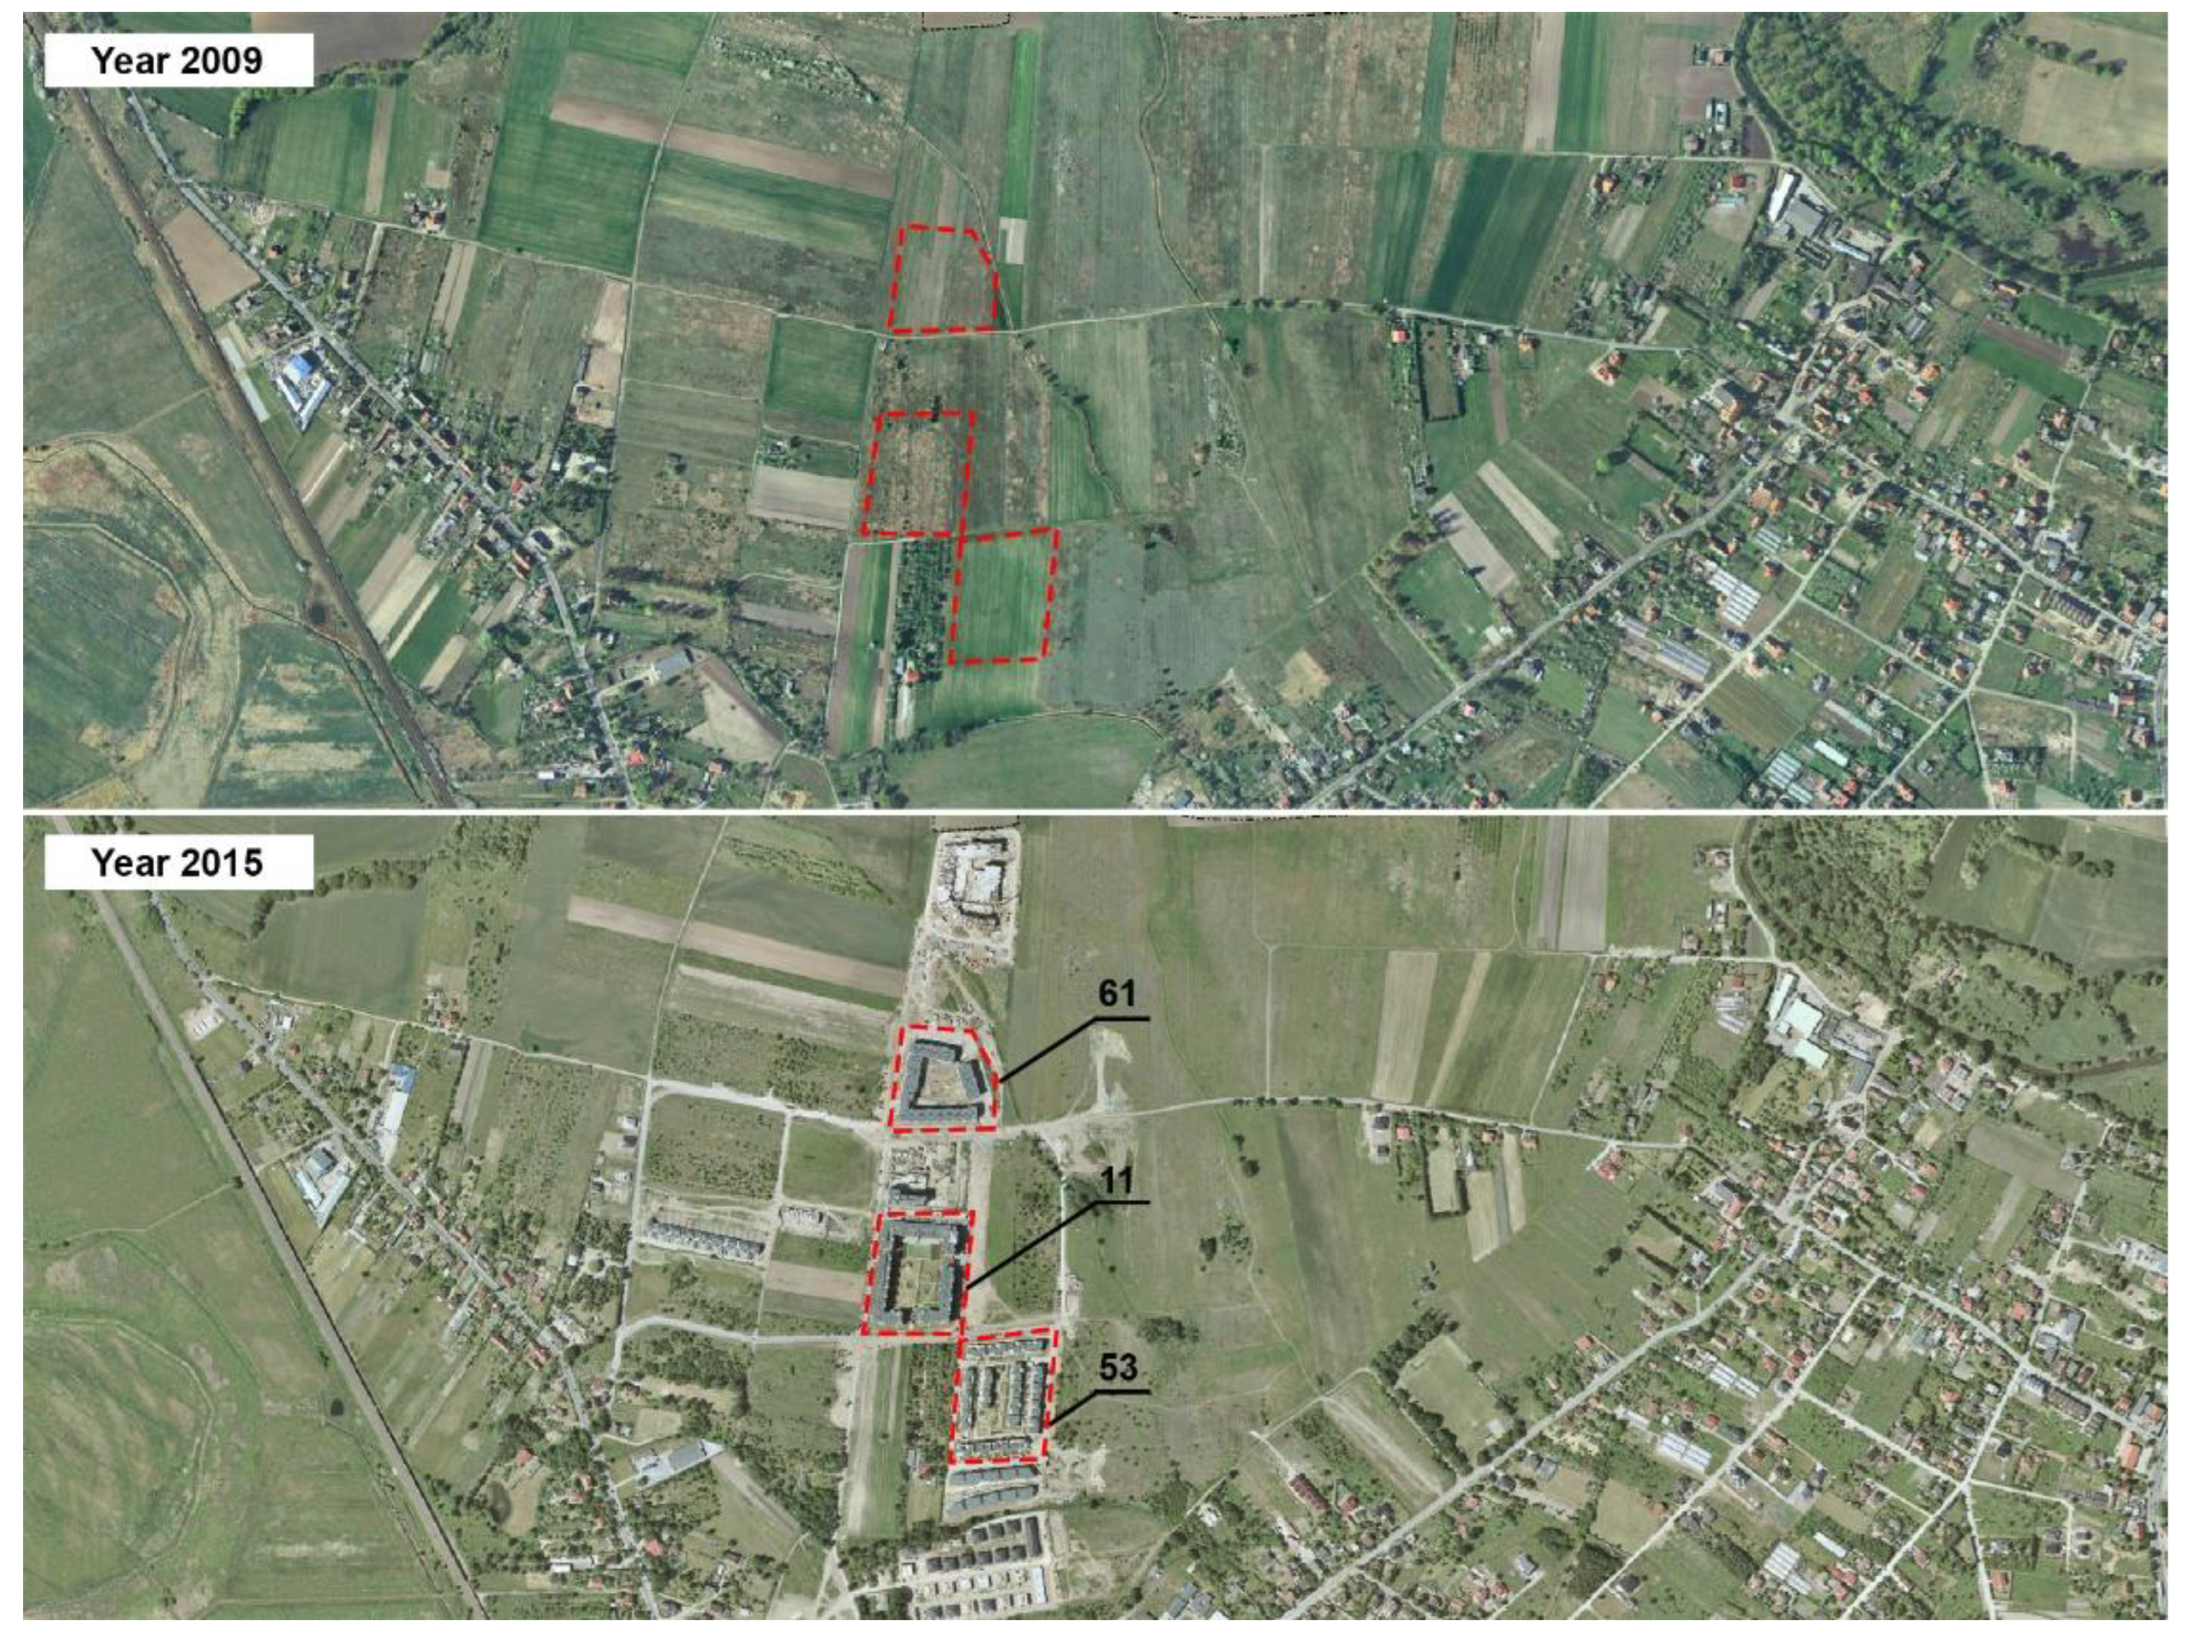
2.4. Analyses—Stage II
2.5. Analyses—Stage III
- B8—channel 8
- B4—channel 4
3. Results
3.1. Stage I
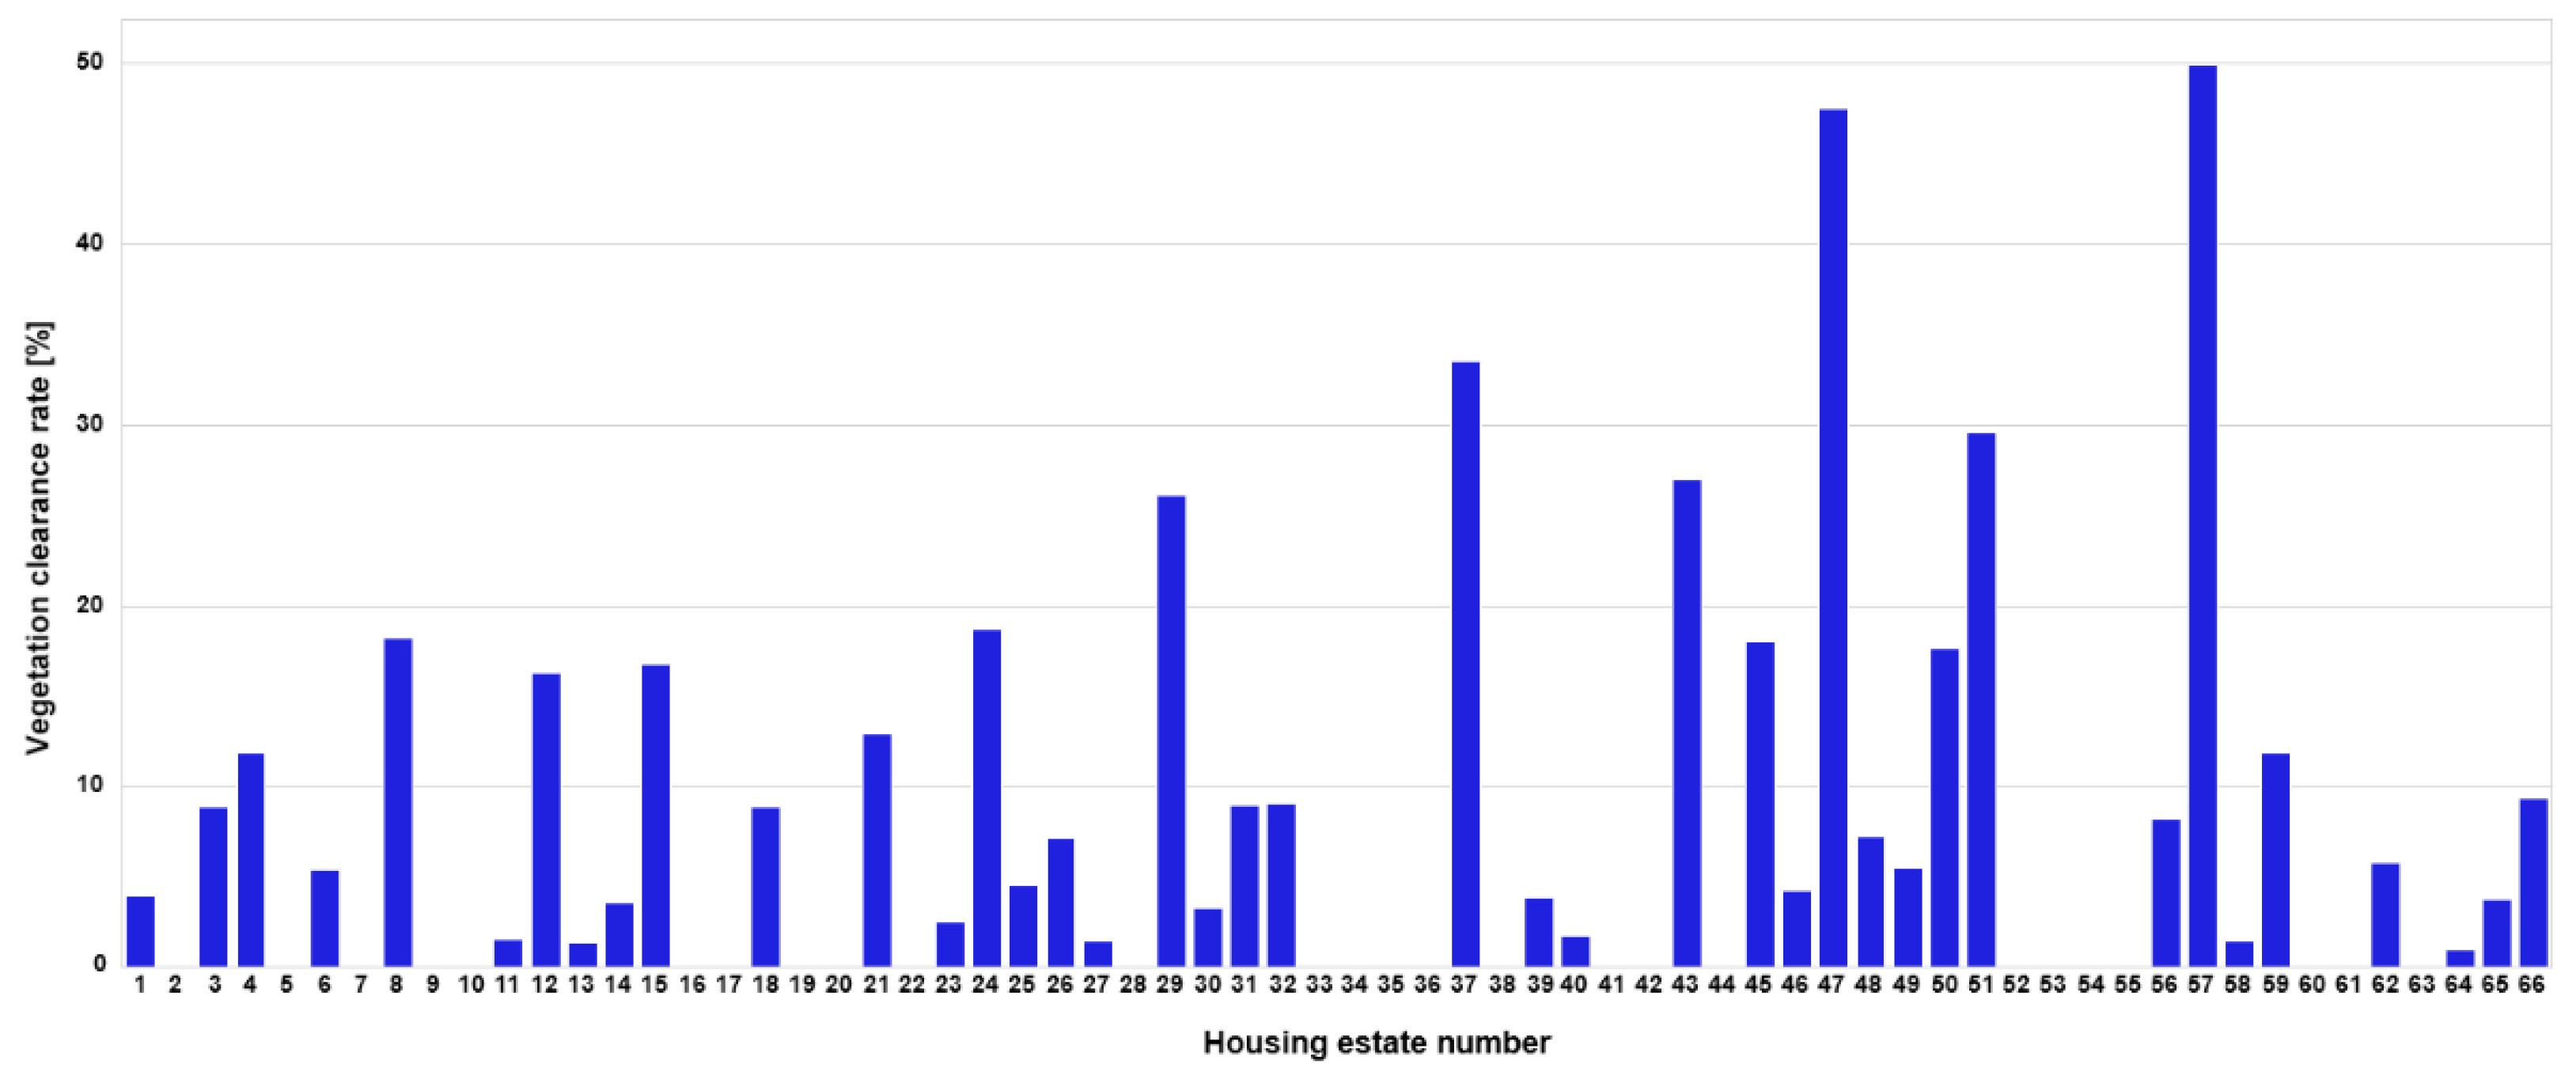
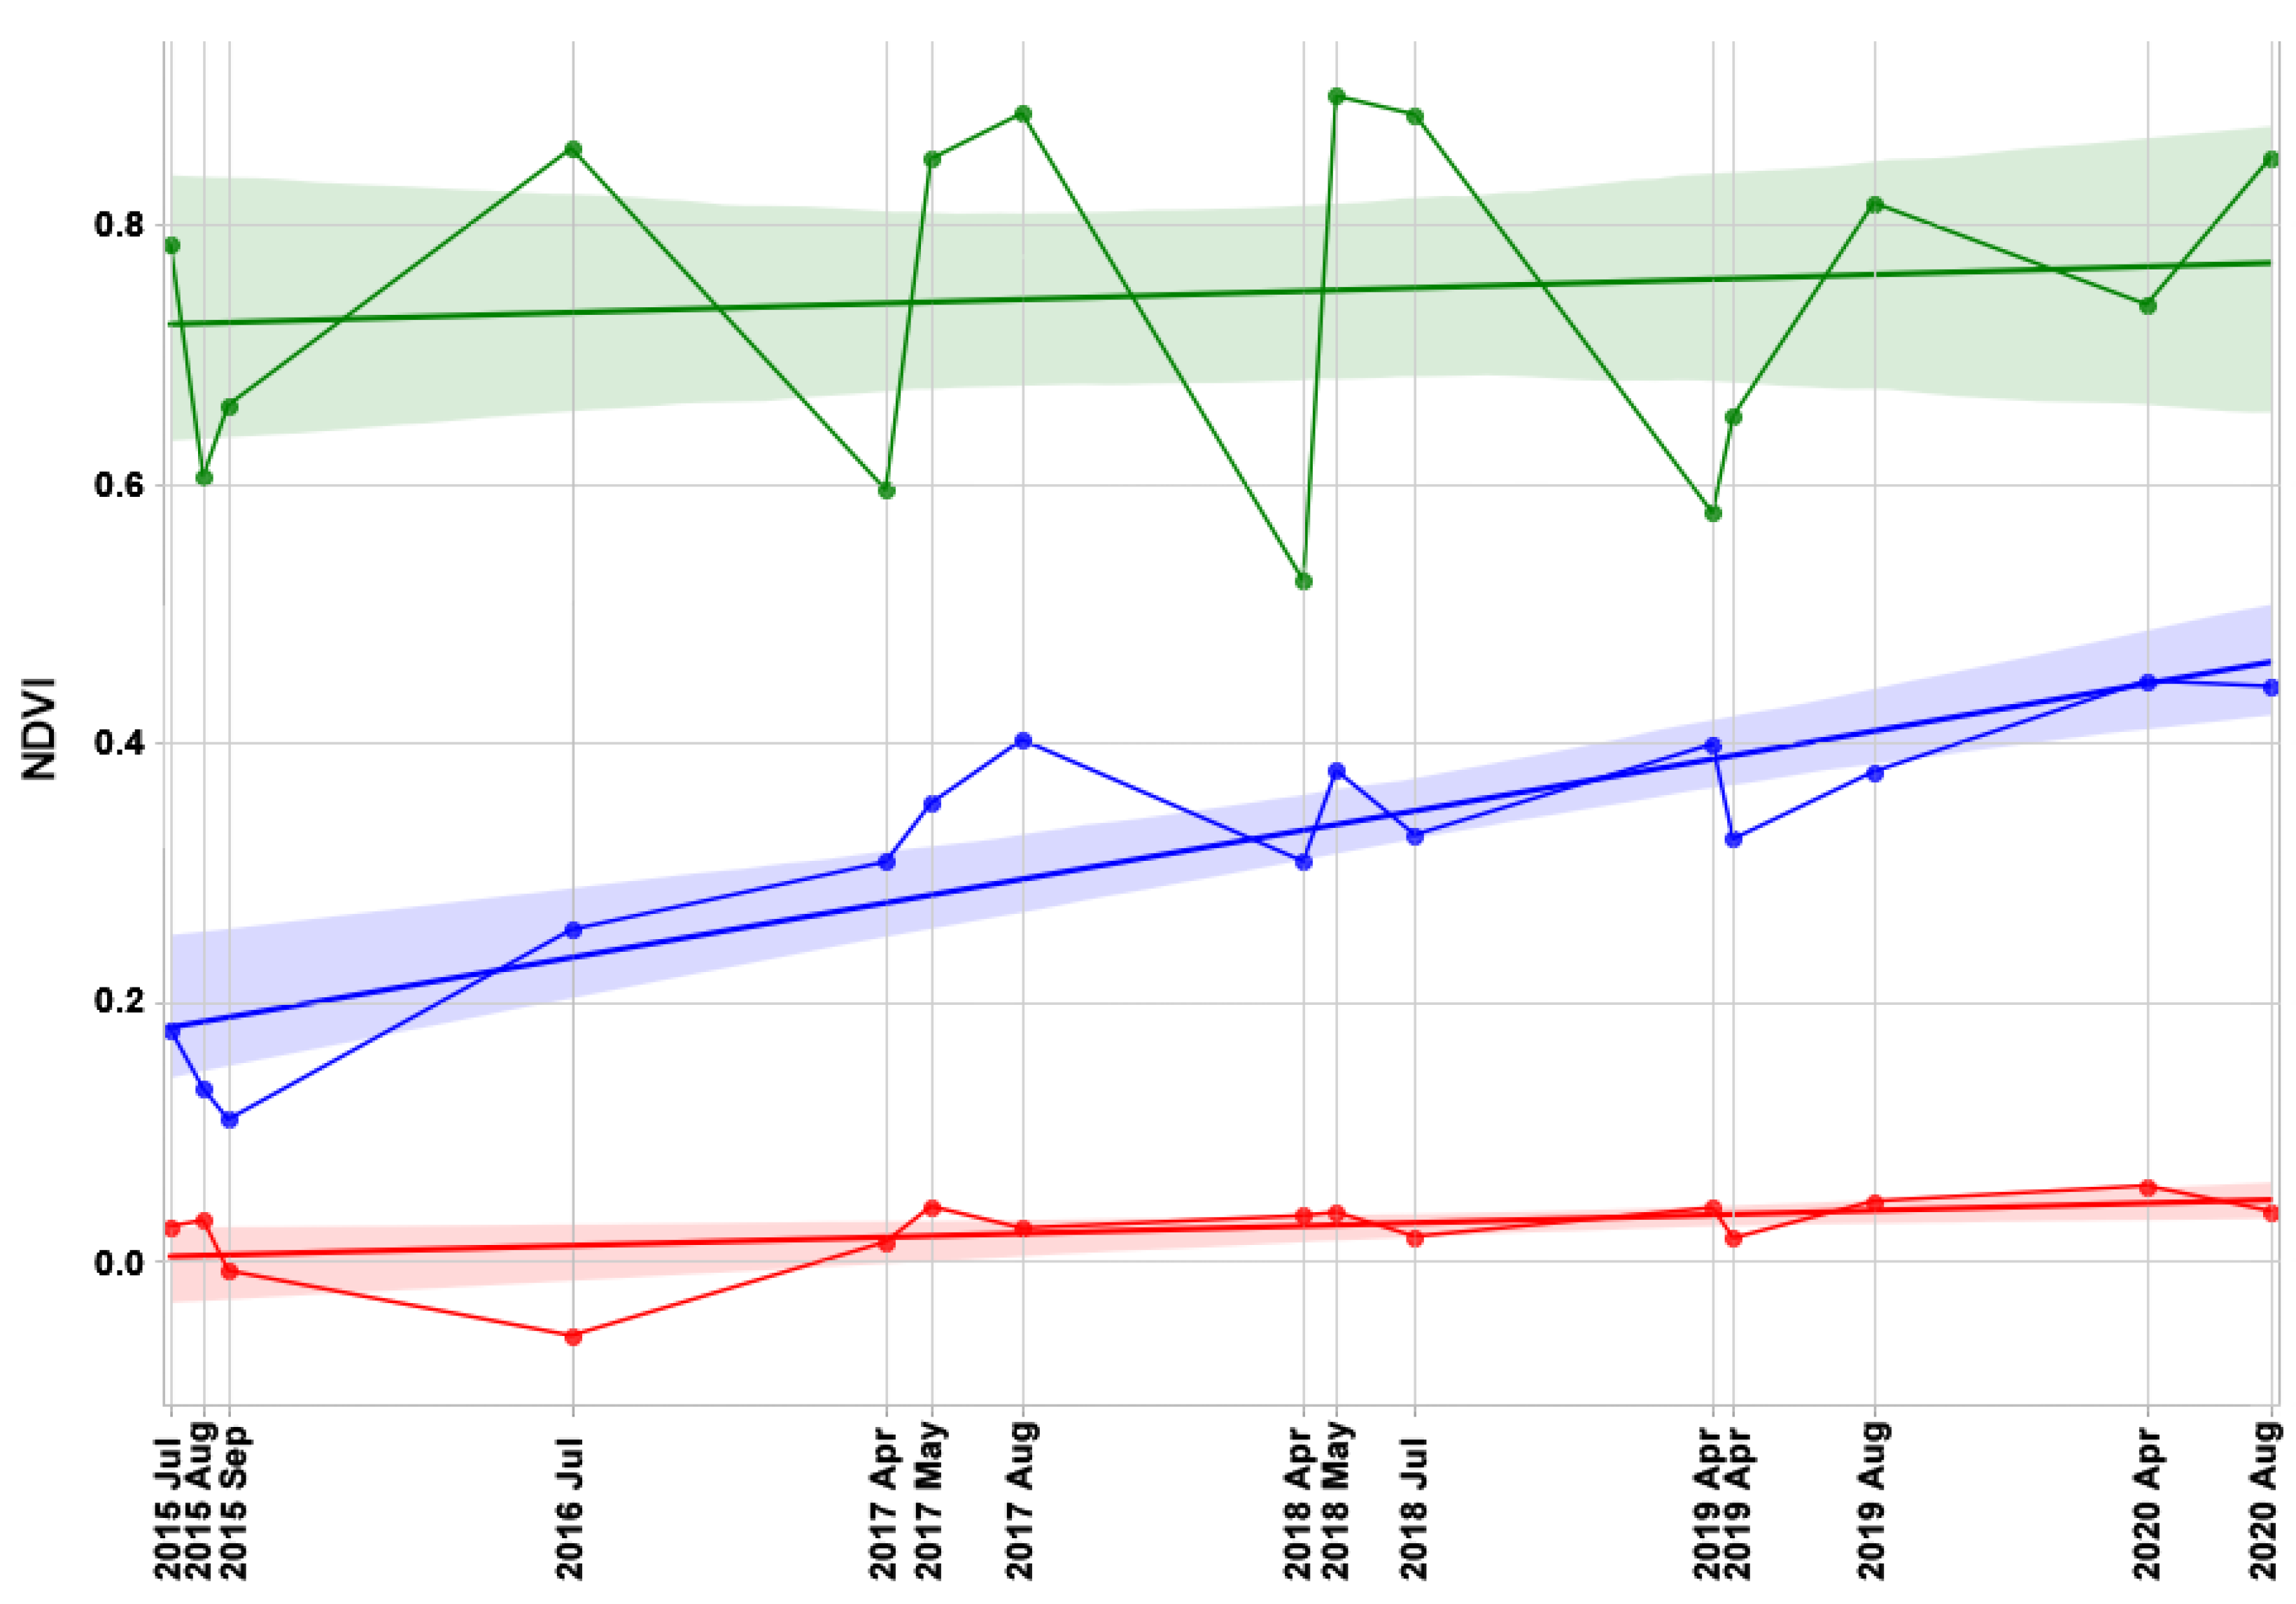
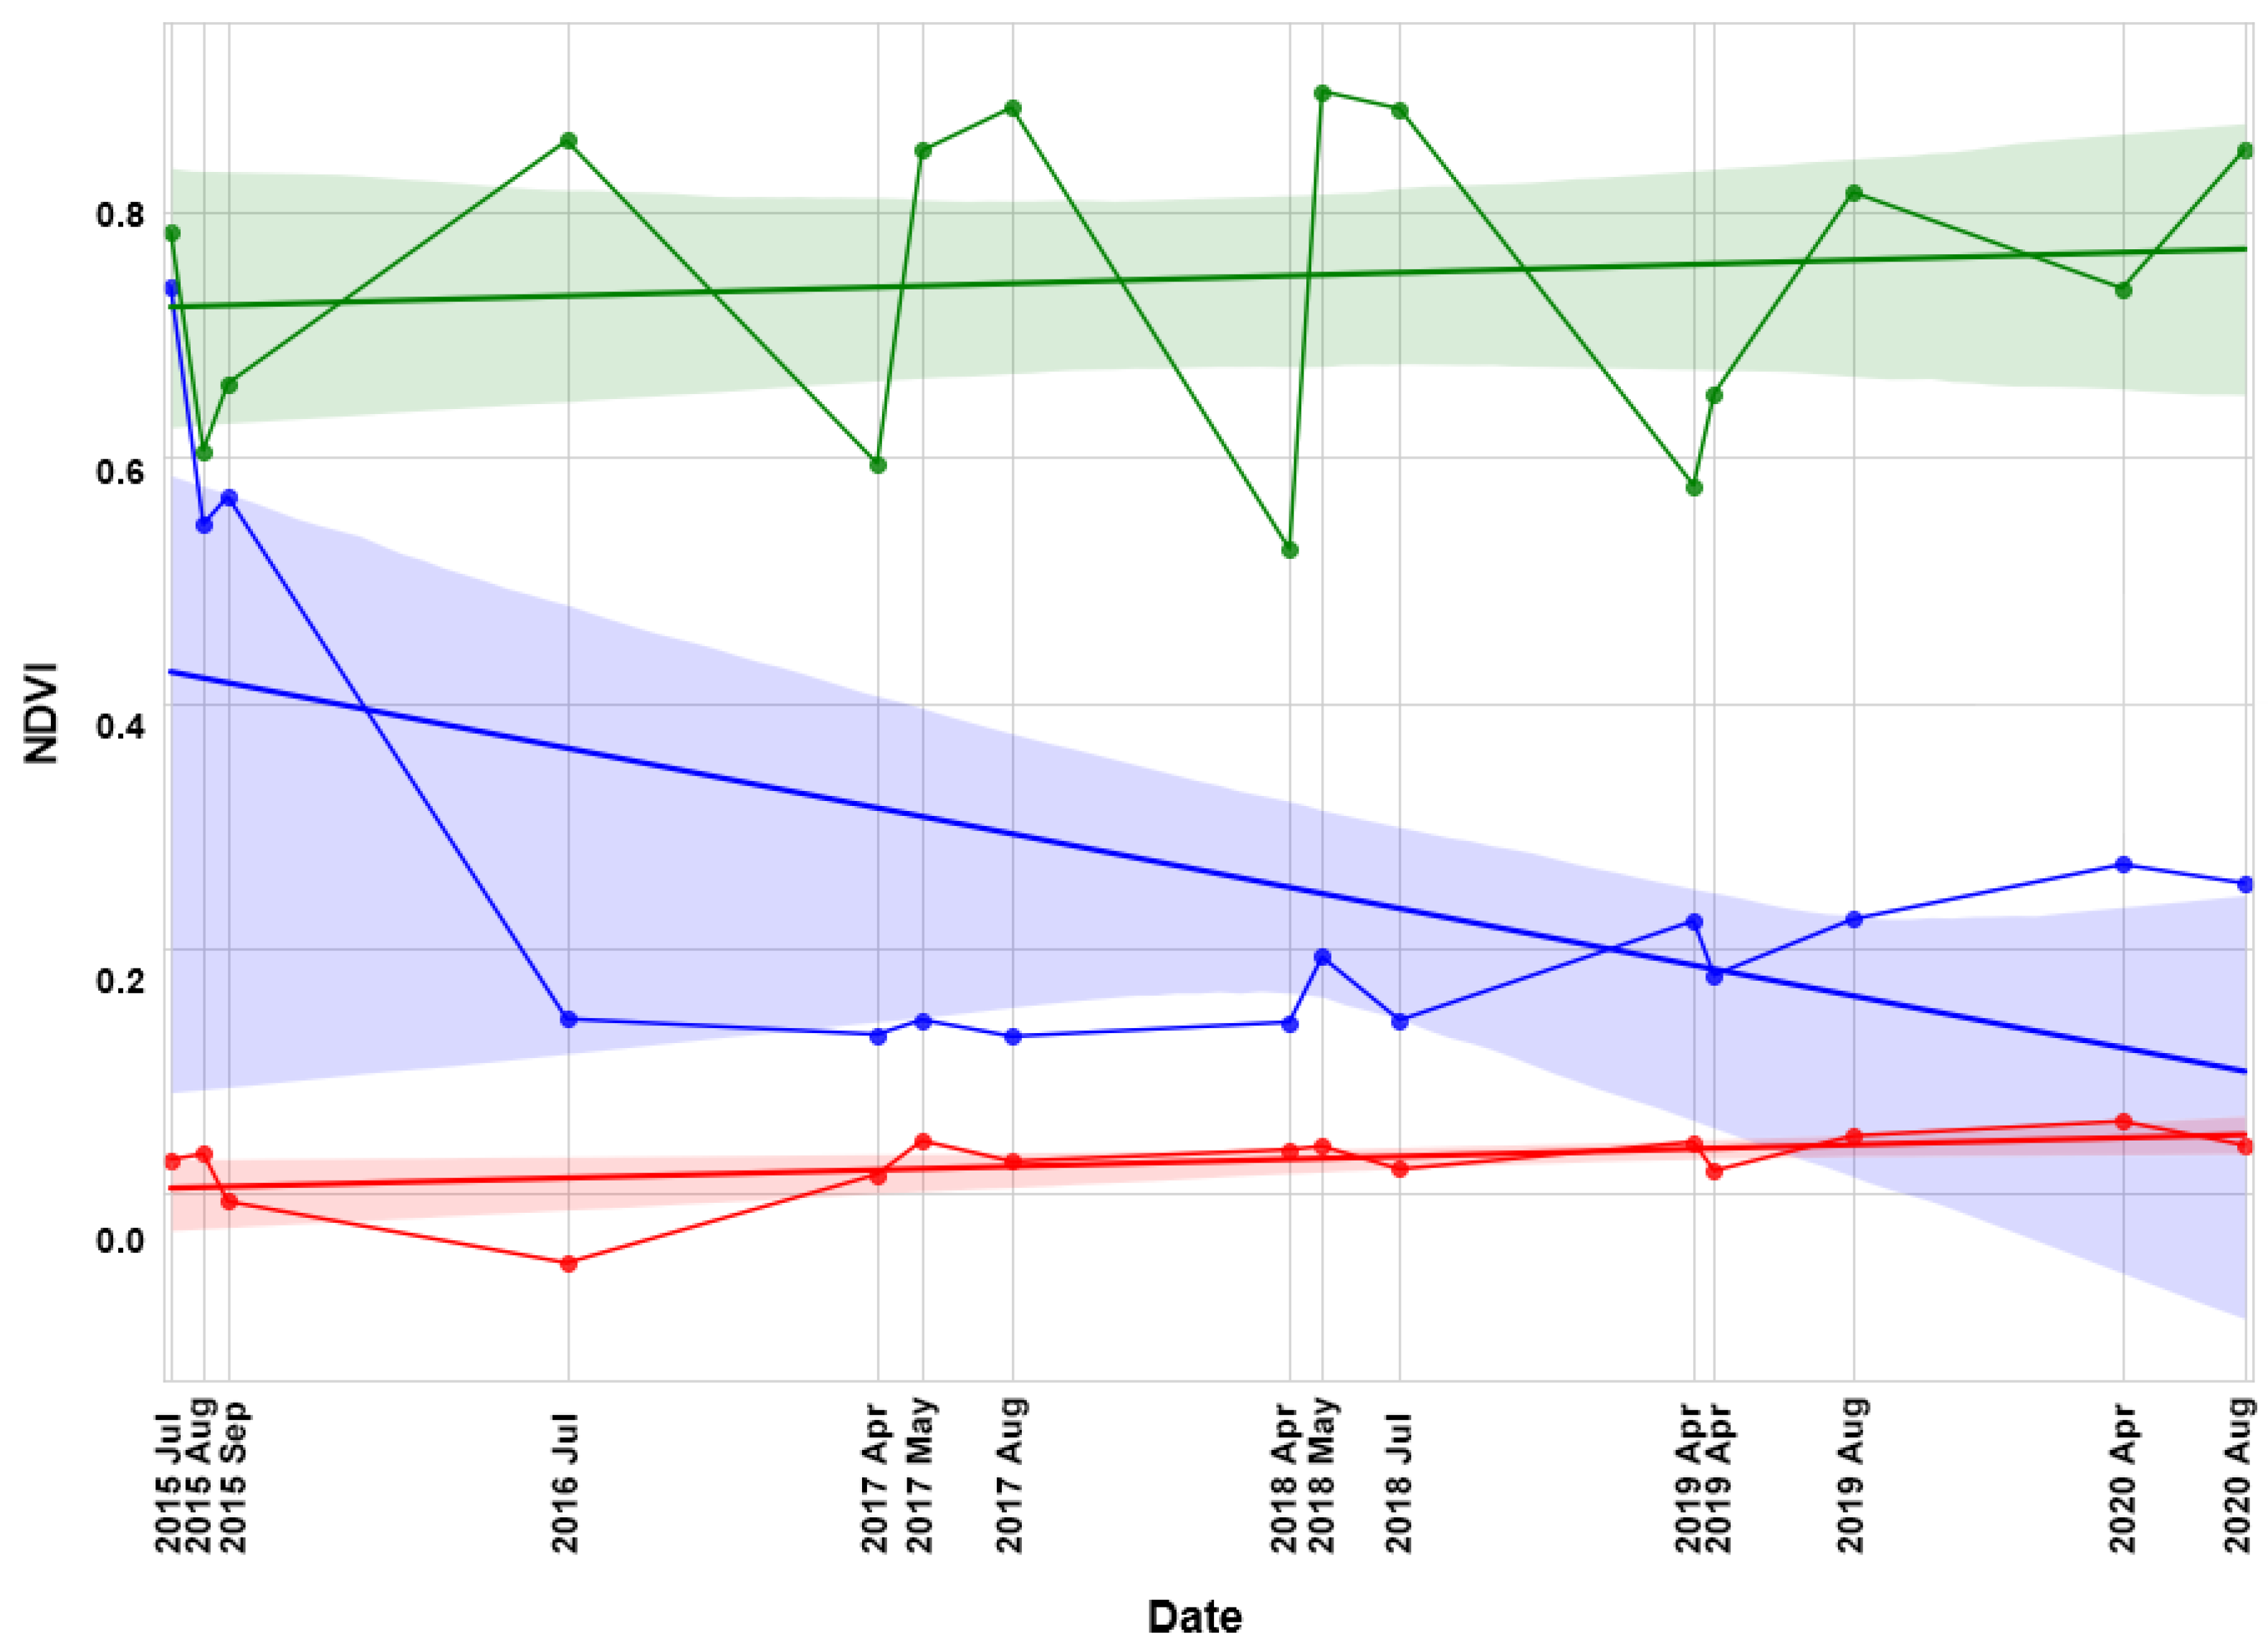
3.2. Stage II
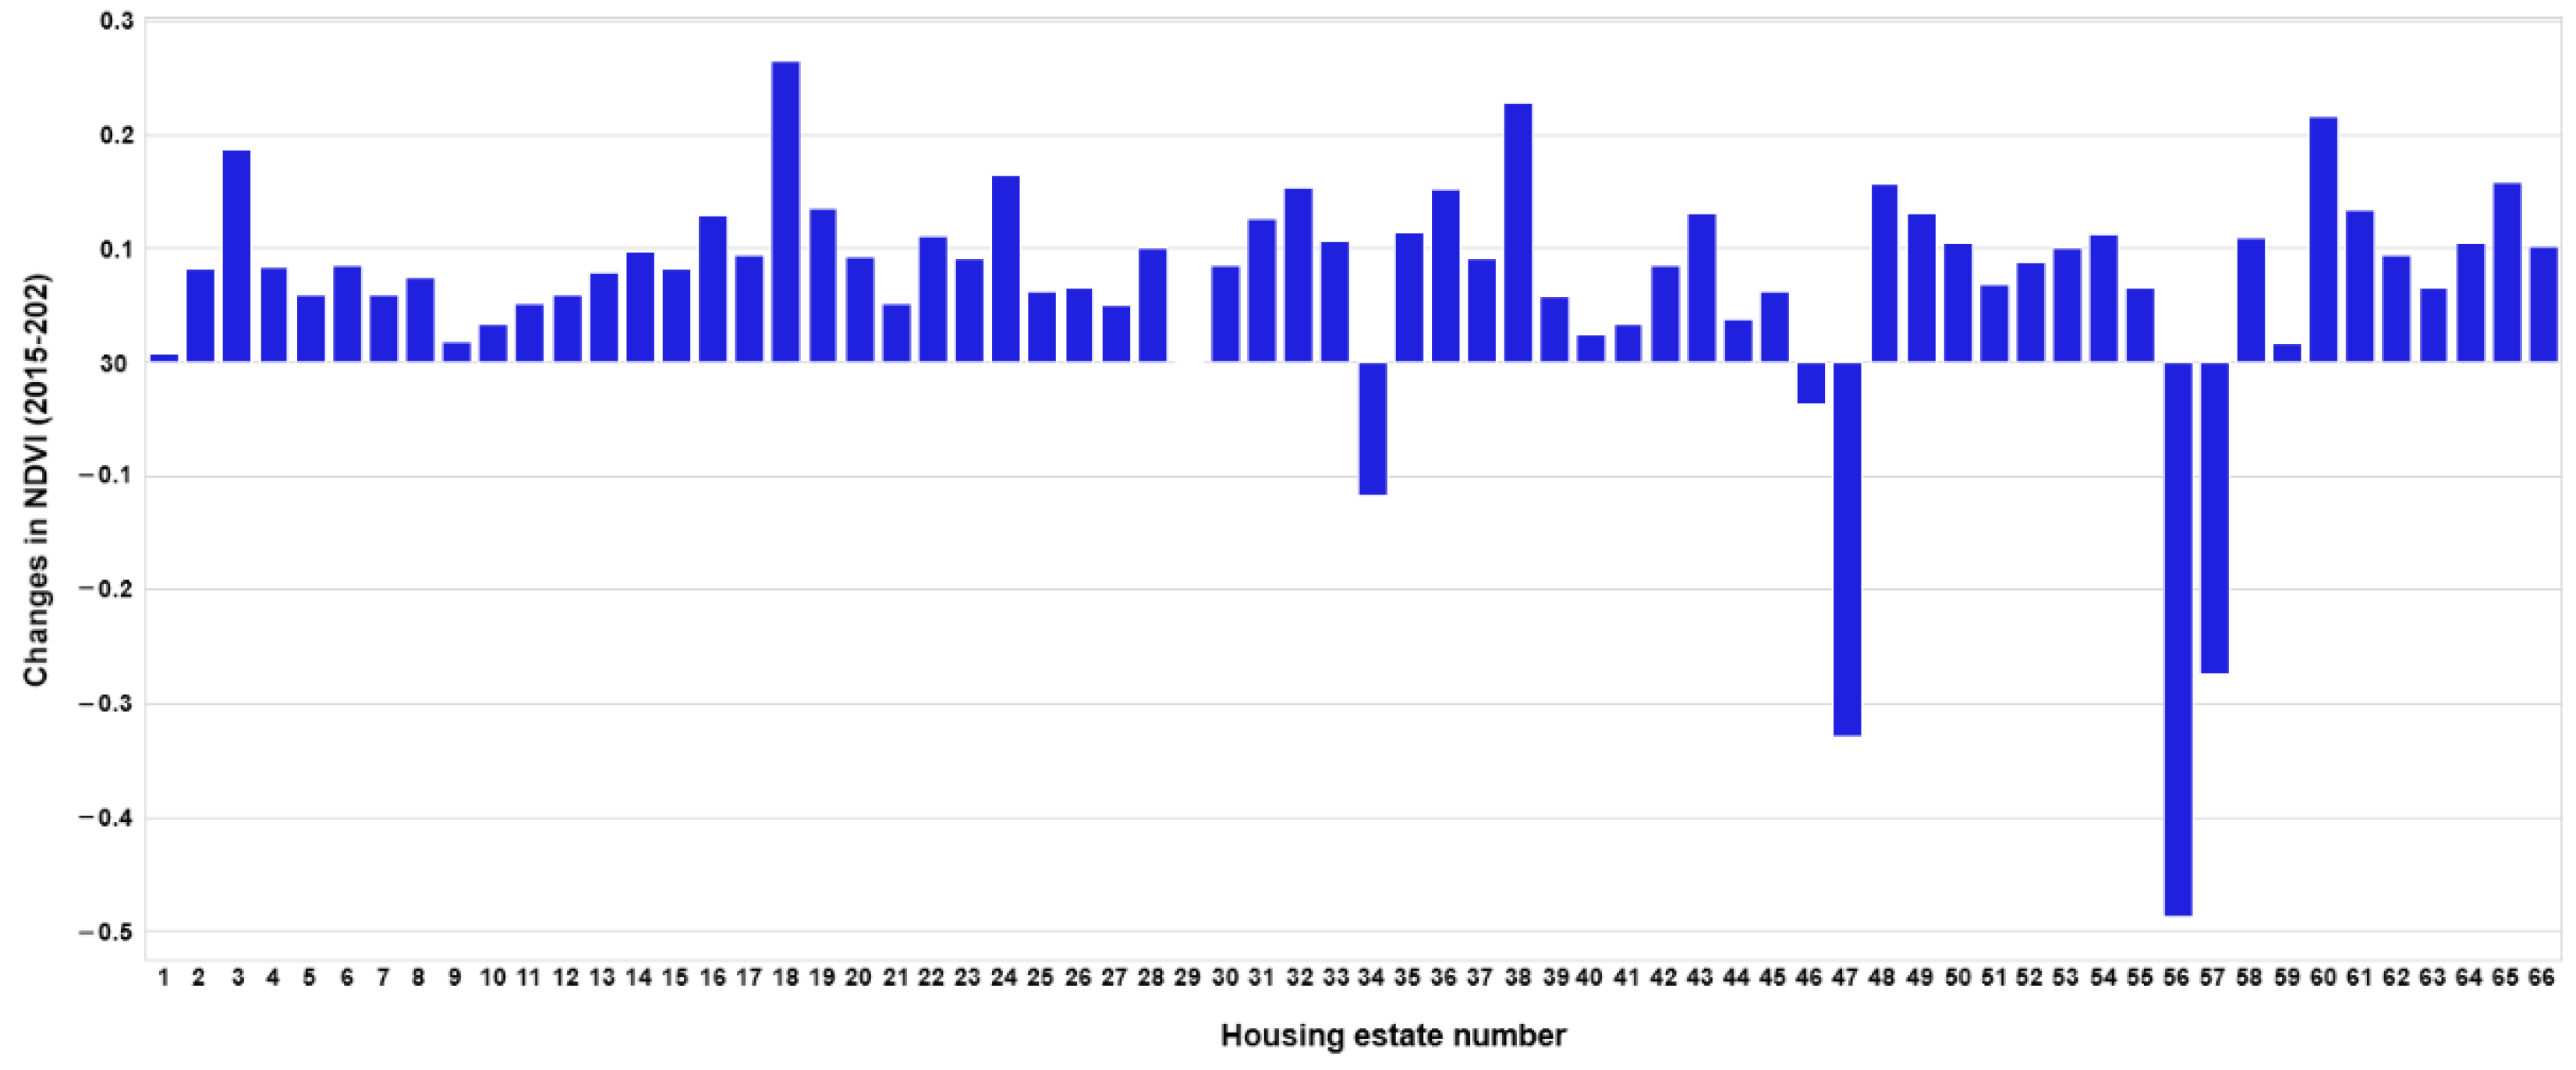
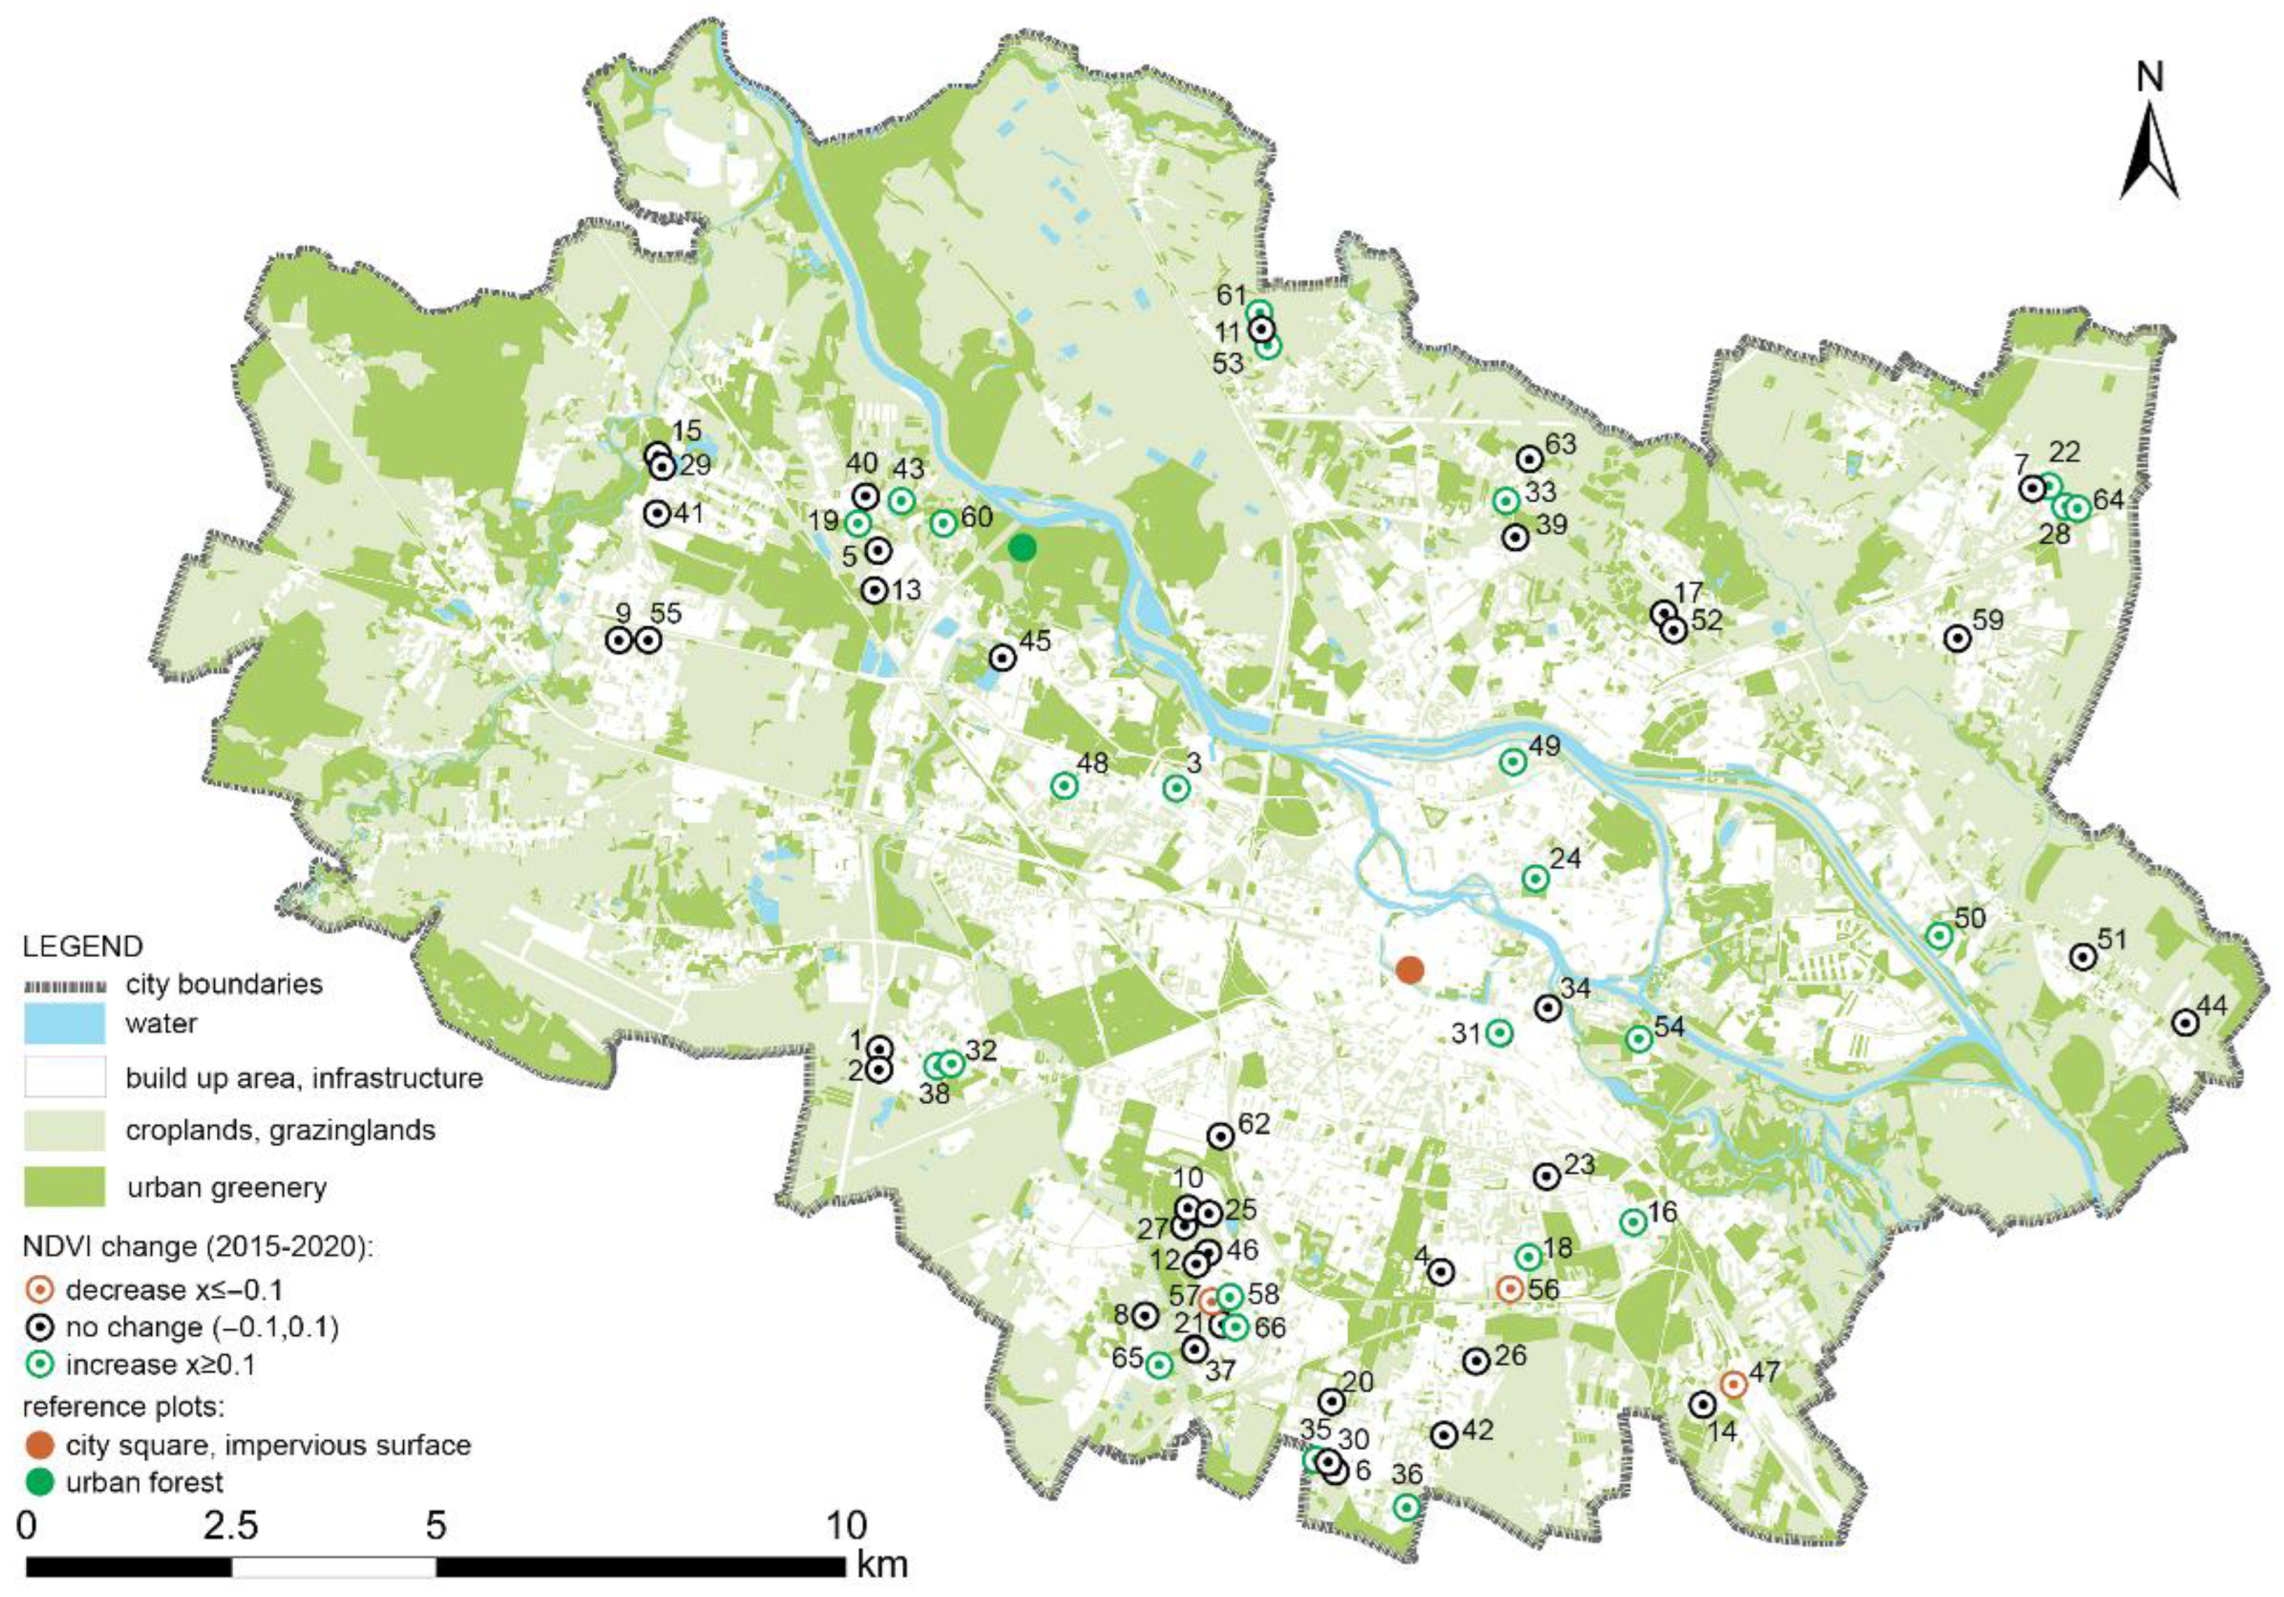
3.3. Stage III
- x ≤ −0.1 = drop in the city’s resilience;
- (−0.1, 0.1) = neutral, no change;
- x ≥ 0.1 = increase in the city’s resilience.
4. Discussion
5. Conclusions
- Deliberate wide-ranging use of pro-ecological solutions by practitioners, with encouragement from local authorities;
- Protecting (in the legal records of LDPs) existing vegetation (maintaining a balance between cleared vs. planted greenery during construction);
- Ensuring that city dwellers have equal and easy access to high-quality greenery at their place of residence;
- Implementing continuous monitoring of the condition of Wrocław’s green areas using NDVI by local authorities;
- Granting discounts and bonuses for high-quality, appropriate greenery at housing estates.
Supplementary Materials
Author Contributions
Funding
Institutional Review Board Statement
Informed Consent Statement
Data Availability Statement
Conflicts of Interest
References
- Corbusier, L.; Giraudoux, J.; Villeneuve, J.D. La Charte d’Athènes; Plon: Paris, France, 1943. [Google Scholar]
- Barton, H.; Mitchum, C.; Tsourou, C. Healthy Urban Planning in Practice: Experience of European Cities: Report of the World Health Organization; City Action Group on Healthy Urban Planning; WHO Regional Office for Europe: Copenhagen, Denmark, 2003; Available online: https://www.euro.who.int/__data/assets/pdf_file/0003/98400/E82657.pdf (accessed on 6 July 2021).
- Kim, H.W.; Kim, J.-H.; Li, W.; Yang, P.; Cao, Y. Exploring the impact of green space health on runoff reduction using NDVI. Urban For. Urban Green. 2017, 28, 81–87. [Google Scholar] [CrossRef]
- European Environment Agency (EEA). Urban Adaptation in Europe: How Cities and Towns Respond to Climate Change; Publications Office of the European Union: Luxembourg, 2020; Available online: https://www.eea.europa.eu/publications/urban-adaptation-in-europe (accessed on 6 July 2021).
- United Nations. Adoption of the Paris Agreement (Decision 1/CP.21), United Nations Framework Convention on Climate Change. 2015. Available online: https://unfccc.int/resource/docs/2015/cop21/eng/10a01.pdf#page=2 (accessed on 6 July 2021).
- United Nations. Transforming Our World: The 2030 Agenda for Sustainable Development; United Nations: New York, NY, USA, 2015. Available online: https://www.un.org/ga/search/view_doc.asp?symbol=A/RES/70/1&Lang=E (accessed on 6 July 2021).
- World Health Organization Regional Office for Europe. Urban Green Spaces and Health. A Review of Evidence: Copenhagen Denmark. 2016. Available online: https://www.euro.who.int/__data/assets/pdf_file/0005/321971/Urban-green-spaces-and-health-review-evidence.pdf (accessed on 6 July 2021).
- World Health Organization and UN Habitat. Global Report on Urban Health: Equitable Healthier Cities for Sustainable Development; WHO Press: Geneva, Switzerland, 2016; Available online: https://apps.who.int/iris/handle/10665/204715 (accessed on 6 July 2021).
- European Commission. Adaptation to Climate Change Blueprint for a New, More Ambitious EU Strategy; European Commission: Brussels, Belgium, 2020. Available online: http://www.euroconsulting.be/wp-content/uploads/2020/05/blueprint_en1.pdf (accessed on 6 July 2021).
- Holling, C.S. Resilience and stability of ecological systems. Annu. Rev. Ecol. Evol. Syst. 1973, 4, 1–23. [Google Scholar] [CrossRef]
- Bosher, L.; Coaffee, J. Editorial: International perspectives on urban resilience. Proc. Inst. Civ. Eng.—Urban Des. Plan. 2008, 161, 145–146. [Google Scholar] [CrossRef]
- United Nations Office for Disaster Risk Reduction. United Nations International Strategy for Disaster Reduction, Terminology on Disaster Risk Reduction; United Nations International Strategy for Disaster Reduction (UNISDR): Geneva, Switzerland, 2009; Available online: https://www.preventionweb.net/files/7817_UNISDRTerminologyEnglish.pdf (accessed on 3 July 2021).
- Smith, M.; Welling, R. Nature based Solutions to specific societal challenges. In Nature-Based Solutions to Address Global Societal Challenges; Cohen-Shacham, E., Walters, G., Janzen, C., Maginnis, S., Eds.; IUCN International Union for Conservation of Nature: Gland, Switzerland, 2016; pp. 12–16. [Google Scholar] [CrossRef]
- Breitinger, D.; Farnworth, E.; Pickens, A.; Swanborough, J. A Decade Left. In The Global Risks Report; Franco, E.G., Ed.; World Economic Forum: Geneva, Switzerland, 2020; Available online: http://www3.weforum.org/docs/WEF_Global_Risk_Report_2020.pdf (accessed on 6 July 2021).
- Włodarczyk-Marciniak, R.; Sikorska, D.; Krauze, K. Residents’ awareness of the role of informal green spaces in a post-industrial city, with a focus on regulating services and urban adaptation potential. Sustain. Cities Soc. 2020, 59, 102236. [Google Scholar] [CrossRef] [PubMed]
- Teimouri, R.; Karuppannan, S.; Sivam, A.; Gu, N. Social sustainability with Urban Green Space (UGS) planning. J. Adv. Soc. Sci. Humanit. 2019, 5, 236–247. [Google Scholar] [CrossRef]
- Peschardt, K.K.; Schipperijn, J.; Stigsdotter, U.K. Use of Small Public Urban Green Spaces (SPUGS). Urban For. Urban Green. 2012, 11, 235–244. [Google Scholar] [CrossRef]
- Stessens, P.; Khan, A.Z.; Huysmans, M.; Canters, F. Analysing urban green space accessibility and quality: A GIS-based model as spatial decision support for urban ecosystem services in Brussels. Ecosyst. Serv. 2017, 28, 328–340. [Google Scholar] [CrossRef]
- Shi, L.; Halik, Ü.; Abliz, A.; Mamat, Z.; Welp, M. Urban Green Space Accessibility and Distribution Equity in an Arid Oasis City: Urumqi, China. Forests 2020, 11, 690. [Google Scholar] [CrossRef]
- Battisti, L.; Pille, L.; Wachtel, T.; Larcher, F.; Säumel, I. Residential Greenery: State of the Art and Health-Related Ecosystem Services and Disservices in the City of Berlin. Sustainability 2019, 11, 1815. [Google Scholar] [CrossRef] [Green Version]
- Säumel, I.; Hogrefe, J.; Battisti, L.; Wachtel, T.; Larcher, F. The healthy green living room at one’s doorstep? Use and perception of residential greenery in Berlin, Germany. Urban For. Urban Green. 2021, 58, 126949. [Google Scholar] [CrossRef]
- Liu, W.; Chen, W.; Peng, C. Assessing the effectiveness of green infrastructures on urban flooding reduction: A community scale study. Ecol. Modell. 2014, 291, 6–14. [Google Scholar] [CrossRef]
- Li, W.; Saphores, J.-D.M.; Gillespie, T.W. A comparison of the economic benefits of urban green spaces estimated with NDVI and with high-resolution land cover data. Landsc. Urban Plan. 2015, 133, 105–117. [Google Scholar] [CrossRef]
- Kumar, P.; Druckman, A.; Gallagher, J.; Gatersleben, B.; Allison, S.; Eisenman, T.S.; Hoang, U.; Hama, S.; Tiwari, A.; Sharma, A.; et al. The nexus between air pollution, green infrastructure and human health. Environ. Int. 2019, 133, 105181. [Google Scholar] [CrossRef] [PubMed]
- Kaplan, R.; Kaplan, S. The Experience of Nature: A Psychological Perspective; Cambridge University Press: New York, NY, USA, 1989. [Google Scholar]
- Cummins, S.; Curtis, S.; Diez-Roux, A.V.; Macintyre, S. Understanding and representing ‘place’ in health research: A relational approach. Soc. Sci. Med. 2007, 65, 1825–1838. [Google Scholar] [CrossRef] [PubMed]
- Wang, R.; Helbich, M.; Yao, Y.; Zhang, J.; Liu, P.; Yuan, Y.; Liu, Y. Urban greenery and mental wellbeing in adults: Cross-sectional mediation analyses on multiple pathways across different greenery measures. Environ. Res. 2019, 176, 108535. [Google Scholar] [CrossRef]
- Kaplan, R. The nature of the view from home: Psychological benefits. Environ. Behav. 2001, 33, 507–542. [Google Scholar] [CrossRef]
- Masoudinejad, S.; Hartig, T. Window View to the Sky as a Restorative Resource for Residents in Densely Populated Cities. Environ. Behav. 2020, 52, 401–436. [Google Scholar] [CrossRef]
- Czeisler, M.É.; Lane, R.I.; Petrosky, E.; Wiley, J.F.; Christensen, A.; Njai, R.; Weaver, M.D.; Robbins, R.; Facer-Childs, E.R.; Barger, L.K.; et al. Mental Health, Substance Use, and Suicidal Ideation During the COVID-19 Pandemic—United States. Morb. Mortal. Wkly. Rep. 2020, 69, 1049–1057. [Google Scholar] [CrossRef]
- De Clercq, E.M.; De Wulf, R.; Van Herzele, A. Relating spatial pattern of forest cover to accessibility. Landsc. Urban Plan. 2007, 80, 14–22. [Google Scholar] [CrossRef] [Green Version]
- Hegetschweiler, K.T.; de Vries, S.; Arnberger, A.; Bell, S.; Brennan, M.; Siter, N.; Olafsson, A.S.; Voigt, A.; Hunziker, M. Linking demand and supply factors in identifying cultural ecosystem services of urban green infrastructures: A review of European studies. Urban For. Urban Green. 2017, 21, 48–59. [Google Scholar] [CrossRef]
- Xiao, Y.; Wang, Z.; Li, Z.; Tang, Z. An assessment of urban park access in Shanghai—Implications for the social equity in urban China. Landsc. Urban Plan. 2017, 157, 383–393. [Google Scholar] [CrossRef]
- Sikorska, D.; Łaszkiewicz, E.; Krauze, K.; Sikorski, P. The role of informal green spaces in reducing inequalities in urban green space availability to children and seniors. Environ. Sci. Policy. 2020, 108, 144–154. [Google Scholar] [CrossRef]
- Szumacher, I.; Pabjanek, P. Temporal Changes in Ecosystem Services in European Cities in the Continental Biogeographical Region in the Period from 1990–2012. Sustainability 2017, 9, 665. [Google Scholar] [CrossRef]
- Szopińska, E.; Kazak, J.; Kempa, O.; Rubaszek, J. Spatial Form of Greenery in Strategic Environmental Management in the Contextof Urban Adaptation to Climate Change. Pol. J. Environ. Stud. 2019, 28, 2845–2856. [Google Scholar] [CrossRef]
- Niedźwiecka-Filipiak, I.; Rubaszek, J.; Podolska, A.; Pyszczek, J. Sectoral Analysis of Landscape Interiors (SALI) as One of the Tools for Monitoring Changes in Green Infrastructure Systems. Sustainability 2020, 12, 3192. [Google Scholar] [CrossRef]
- Jaworek-Jakubska, J.; Filipiak, M.; Michalski, A.; Napierała-Filipiak, A. Spatio-Temporal Changes of Urban Forests and Planning Evolution in a Highly Dynamical Urban Area: The Case Study of Wrocław, Poland. Forests 2019, 11, 17. [Google Scholar] [CrossRef]
- Świąder, M.; Szewrański, S.; Kazak, J.K. Environmental Carrying Capacity Assessment—The Policy Instrument and Tool for Sustainable Spatial Management. Front. Environ. Sci. 2020, 8, 579838. [Google Scholar] [CrossRef]
- Szulczewska, B.; Giedych, R.; Borowski, J.; Kuchcik, M.; Sikorski, P.; Mazurkiewicz, A.; Stańczyk, T. How much green is needed for a vital neighbourhood? In search for empirical evidence. Land Use Policy 2014, 38, 330–345. [Google Scholar] [CrossRef]
- Bradecki, T.; Twardoch, A. Quantitative and Qualitative Research in Housing Areas: Contemporary Housing Developments in Silesian Metropolitan Area, Poland. Archit. Civ. Eng. Environ. 2016, 9, 5–12. [Google Scholar] [CrossRef] [Green Version]
- Szulczewska, B.; Giedych, R.; Maksymiuk, G. Can we face the challenge: How to implement a theoretical concept of green infrastructure into planning practice? Warsaw case study. Landsc. Res. 2017, 42, 176–194. [Google Scholar] [CrossRef]
- Wrocław Municipality. The Climate Change Adaptation Plan for the City of Wrocław by 2030 [Org. Plan Adaptacji Miasta Wrocławia do Zmian Klimatu do Roku 2030]. 2019. Available online: https://bip.um.wroc.pl/artykuly/882/miejski-plan-adaptacji-do-zmian-klimatu-mpa (accessed on 6 July 2021).
- Wrocław Municipality. The List of Decisions of the Department of Architecture and Construction of the Municipality of Wrocław. 2017. Available online: http://bip.um.wroc.pl/artykul/100/9193/wykazy-wydanych-decyzji-przez-wydzial-architektury-i-budownictwa (accessed on 17 August 2021).
- Wrocław’s Geographical Information System [Org. System Informacji Przestrzennej Wrocławia]. Available online: https://gis.um.wroc.pl/imap/?gpmap=gp11 (accessed on 6 July 2021).
- GEO-INFO Portal Wrocław. Available online: https://wms.zgkikm.wroc.pl/#/giportal (accessed on 6 July 2021).
- Hydroportal, the Polish Water Management Office. Available online: https://wody.isok.gov.pl/imap_kzgw/?gpmap=gpPDF (accessed on 22 September 2017).
- BDOT10k, the Database of Topographic Facilities. Available online: https://geoportal.dolnyslask.pl/imap/#gpmap=gp103 (accessed on 22 September 2017).
- Myneni, R.B.; Hall, F.G.; Sellers, P.J.; Marshak, A.L. The interpretation of spectral vegetation indexes. The Interpretation of Spectral Vegetation Indexes. IEEE Trans. Geosci. Remote Sens. 1995, 33, 481–486. [Google Scholar] [CrossRef]
- Pettorelli, N.; Vik, J.O.; Mysterud, A.; Gaillard, J.-M.; Tucker, C.J.; Stenseth, N.C. Using the satellite-derived NDVI to assess ecological responses to environmental change. Trends Ecol. Evol. 2005, 20, 503–510. [Google Scholar] [CrossRef] [PubMed]
- Jenerette, G.D.; Harlan, S.L.; Stefanov, W.L.; Martin, C.A. Ecosystem services and urban heat riskscape moderation: Water, green spaces, and social inequality in Phoenix, USA. Ecol. Appl. 2011, 21, 2637–2651. [Google Scholar] [CrossRef] [PubMed]
- Odindi, J.; Mhangara, P. Green Spaces Trends in the City of Port Elizabeth from 1990 to 2000 using Remote Sensing. Int. J. Environ. Res. 2012, 6, 653–662. [Google Scholar]
- Moreno, R.; Ojeda, N.; Azócar, J.; Venegas, C.; Inostroza, L. Application of NDVI for identify potentiality of the urban forest for the design of a green corridors system in intermediary cities of Latin America: Case study, Temuco, Chile. Urban For. Urban Green. 2020, 55, 126821. [Google Scholar] [CrossRef]
- Dagnachew, M.; Kebede, A.; Moges, A.; Abebe, A. Effects of Climate Variability on Normalized Difference Vegetation Index (NDVI) in the Gojeb River Catchment, Omo-Gibe Basin, Ethiopia. Adv. Meteorol. 2020, 2020, 8263246. [Google Scholar] [CrossRef]
- Zheng, Y.; Han, J.; Huang, Y.; Fassnacht, S.R.; Xie, S.; Lv, E.; Chen, M. Vegetation response to climate conditions based on NDVI simulations using stepwise cluster analysis for the Three-River Headwaters region of China. Ecol. Indic. 2018, 92, 18–29. [Google Scholar] [CrossRef]
- Spruce, J.P.; Hicke, J.A.; Hargrove, W.W.; Grulke, N.E.; Meddens, A.J.H. Use of MODIS NDVI Products to Map Tree Mortality Levels in Forests Affected by Mountain Pine Beetle Outbreaks. Forests 2019, 10, 811. [Google Scholar] [CrossRef]
- Gascon, M.; Cirach, M.; Martínez, D.; Dadvand, P.; Valentín, A.; Plasència, A.; Nieuwenhuijsen, M.J. Normalized difference vegetation index (NDVI) as a marker of surrounding greenness in epidemiological studies: The case of Barcelona city. Urban For. Urban Green. 2016, 19, 88–94. [Google Scholar] [CrossRef]
- Yokoya, N.; Chan, J.C.W.; Segl, K. Potential of Resolution-Enhanced Hyperspectral Data for Mineral Mapping Using Simulated EnMAP and Sentinel-2 Images. Remote Sens. 2016, 8, 172. [Google Scholar] [CrossRef] [Green Version]
- Strashok, O.; Ziemiańska, M.; Strashok, V. Evaluation and Correlation of Sentinel-2 NDVI and NDMI in Kyiv (2017–2021). J. Ecol. Eng. 2022, 23, 212–218. [Google Scholar] [CrossRef]
- Martin-Breen, P.; Anderies, J.M. Resilience: A Literature Review; Bellagio Initiative, Institute of Development Studies (IDS): Brighton, UK, 2011. [Google Scholar]
- Abusaada, H.; Elshater, A. COVID-19 and “the trinity of boredom” in public spaces: Urban form, social distancing and digital transformation. Archnet-IJAR 2022, 16, 172–183. [Google Scholar] [CrossRef]
- Honey-Rosés, J.; Anguelovski, I.; Chireh, V.K.; Daher, C.; van den Bosch, C.K.; Litt, J.S.; Mawani, V.; McCall, M.K.; Orellana, A.; Oscilowicz, E.; et al. The impact of COVID-19 on public space: An early review of the emerging questions—Design, perceptions and inequities. Cities Health 2021, 5, S263–S279. [Google Scholar] [CrossRef]
- Rokicki, T.; Bórawski, P.; Bełdycka-Bórawska, A.; Szeberényi, A.; Perkowska, A. Changes in Logistics Activities in Poland as a Result of the COVID-19 Pandemic. Sustainability 2022, 14, 10303. [Google Scholar] [CrossRef]
- C40 Cities (C40) Mayors Agenda for a Green and Just Recovery. 2020. Available online: https://c40.org/wp-content/uploads/2021/07/2093_C40_Cities_2020_Mayors_Agenda_for_a_Green_and_Just_Recovery.original.pdf (accessed on 26 August 2022).
- Pinto, F.; Akhavan, M. Scenarios for a Post-Pandemic City: Urban planning strategies and challenges of making “Milan 15-minutes city”. Transp. Res. Procedia 2022, 60, 370–377. [Google Scholar] [CrossRef]
- Vatseva, R.; Kopecka, M.; Novacek, J. Mapping Forest Fragmentation Based on Morphological Image Analysis of Mountain Regions in Bulgaria and Slovakia. In Sustainable Development in Mountain Regions; Zhelezov, G., Ed.; Springer International Publishing: Cham, Switzerland, 2016; pp. 167–181. [Google Scholar] [CrossRef]


Publisher’s Note: MDPI stays neutral with regard to jurisdictional claims in published maps and institutional affiliations. |
© 2022 by the authors. Licensee MDPI, Basel, Switzerland. This article is an open access article distributed under the terms and conditions of the Creative Commons Attribution (CC BY) license (https://creativecommons.org/licenses/by/4.0/).
Share and Cite
Dobrzańska, J.; Nadolny, A.; Kalbarczyk, R.; Ziemiańska, M. Urban Resilience and Residential Greenery—The Evidence from Poland. Sustainability 2022, 14, 11317. https://doi.org/10.3390/su141811317
Dobrzańska J, Nadolny A, Kalbarczyk R, Ziemiańska M. Urban Resilience and Residential Greenery—The Evidence from Poland. Sustainability. 2022; 14(18):11317. https://doi.org/10.3390/su141811317
Chicago/Turabian StyleDobrzańska, Joanna, Adam Nadolny, Robert Kalbarczyk, and Monika Ziemiańska. 2022. "Urban Resilience and Residential Greenery—The Evidence from Poland" Sustainability 14, no. 18: 11317. https://doi.org/10.3390/su141811317
APA StyleDobrzańska, J., Nadolny, A., Kalbarczyk, R., & Ziemiańska, M. (2022). Urban Resilience and Residential Greenery—The Evidence from Poland. Sustainability, 14(18), 11317. https://doi.org/10.3390/su141811317