Article

Titania Thin Film Coated Glass for Simultaneous Ammonia Degradation and UV Light Blocking Layer in Photovoltaics

1
Ruđer Bošković Institute, Bijenička cesta 54, 10000 Zagreb, Croatia
2
Elettra-Sincrotrone Trieste, SS 14, km 163.5, 34149 Basovizza, Italy
3
Central European Research Infrastructure Consortium (CERIC-ERIC), SS 14, km 163.5, 34149 Basovizza, Italy
4
NanoEntum, Rueckerlbergguertel 10, 8010 Graz, Austria
5
Faculty of Geotechnical Engineering, University of Zagreb, Hallerova aleja 7, 42000 Varaždin, Croatia
*
Author to whom correspondence should be addressed.
Sustainability 2022, 14(17), 10970; https://doi.org/10.3390/su141710970
Submission received: 27 June 2022 / Revised: 2 August 2022 / Accepted: 20 August 2022 / Published: 2 September 2022
(This article belongs to the Special Issue Sustainable Photocatalytic Water Treatment and Energy Production)

Abstract

:
In this work, we have investigated the potential dual application of TiO2 thin films as a photocatalyst for ammonia degradation, and as a UV light blocking layer in c-Si photovoltaics. For this purpose, we deposited a series of TiO2 thin films on a glass substrate by reactive magnetron sputtering and analysed the influence of the deposition parameters (O2/Ar working gas content and pressure) on the structural, optical and photocatalytic properties. All samples are nanocrystalline anatase TiO2 and have a uniform surface (RMS roughness < 5 nm) in a wide range of magnetron sputtering deposition parameters. They are transparent in the Vis/NIR spectral range and strongly absorb light in the UV range above the optical bandgap energy (3.3 eV), which makes them suitable for the use as UV blocking layers and photocatalysts. The photocatalytic properties were studied in a mini-photocatalytic wind tunnel reactor by examining ammonia degradation. A kinetic study was performed to estimate the reaction rate constants for all samples. The intrinsic reaction rate constant confirmed the crucial role of surface morphology in ammonia decomposition efficiency.

1. Introduction

Titanium dioxide (TiO2) is one of the most intensively studied compounds in materials science due to its advantageous optical, electrical, mechanical and chemical properties [1,2,3,4]. It can be found in nature as a mineral in three polymorphic forms: rutile, anatase and brookite. Most of the research and application is focused on the polymorphs anatase and rutile, as pure brookite is difficult to obtain [5]. TiO2 is a wide bandgap semiconductor (Eg ≈ 3 eV) whose band edge positions are suitable for solar cell application as an electron transport layer [6] and for a wide range of uses: hydrogen production by water splitting, photocatalysis, degradation of air pollutants, self-cleaning, etc. [7]. It is also known as a non-toxic, environmentally friendly and corrosion resistant material. The properties of TiO2 depend largely on its microstructure and crystallographic phase.
Another benefit is that TiO2 can be tailored in terms of size and shape. Nanostructured TiO2 has a higher surface-to-volume ratio and distinct physical and chemical characteristics in comparison to bulk TiO2, as well as longer diffusion lengths and lifetimes of photogenerated charge carriers, all of which contribute to increased photocatalytic efficiency [8]. Furthermore, the crystal shape determines the number of atoms at the surface, which means nanostructured TiO2 contains more atoms on its surface, resulting in a greater number of active sites [9].
In the form of thin films, TiO2 can be synthesised by various chemical and physical methods: sol-gel syntheses followed by spin and deep coating, chemical vapour deposition (CVD), plasma-enhanced CVD (PECVD), magnetron sputtering, electron beam evaporation, electrochemical deposition, pulsed laser deposition, atomic layer deposition etc. [10]. Magnetron sputtering and PECVD techniques generally allow deposition at a low substrate temperature, but usually, postdeposition annealing is required to obtain crystalline TiO2 at temperatures above 450 °C [11]. In this work, for TiO2 thin films deposition, we have used reactive magnetron sputtering [12]. Reactive magnetron sputtering of thin films is intensively investigated because the sputtering of metallic targets in the presence of reactive gas makes it possible to easily form compound films, such as nitrides, oxides, carbides or their combinations [13]. For oxide thin films, such as TiO2 and ZnO, an argon + oxygen gas mixture could be used during deposition.
Due to its very high transparency in the visible range of the solar spectrum, TiO2 finds an important application in photovoltaics. The new generation of solar cells, dye-sensitised solar cells and perovskite solar cells, are based on a porous TiO2 layer, using TiO2 as an electron transport layer. For this purpose, different morphological forms of TiO2 are being tested: nanocrystals, nanowires, nanotubes, nanorods [14].
It can also be used as a UV blocker and self-cleaning layer in second generation solar cells based on mono- and polycrystalline silicon [15]. It is well-known that the performance of silicon solar cells degrades under UV light. This is mostly related to the degradation of ethylene vinyl acetate copolymer (EVA) foil encapsulant under UV light. TiO2 has a wide optical band gap and efficiently absorbs light in the UV spectral range above the band gap energy and can be potentially used as UV light blocking layer in c-Si photovoltaics. TiO2 is also transparent in the visible region of the spectrum, where the spectral sensitivity of silicon solar cells is highest.
On the other hand, the high absorption in the UV range of the solar spectrum makes TiO2 very attractive for use as a photocatalyst for the degradation of air and water pollutants [16,17].
The NH3 degradation over TiO2-based photocatalysts has been thoroughly investigated [18,19,20,21,22]. Complimentary to the generally accepted oxidation pathway initialised by OH radicals, Yuzawa et al. [21] proposed a tentative reaction pathway for NH3 degradation over TiO2 loaded with metal co-catalysts. The reaction pathway included oxidation of NH3 to hydrazine via amide radicals. Hydrazine was eventually degraded to N2 and H2, with ammonium ions as by-products. Several studies confirmed the role of humidity in ammonia oxidation [21,22] and references therein, since it ensures the continuous progress of the reaction driven by the OH radical formed on the TiO2 surface, while the presence of water (vapour) restricts the accumulation of the undesirable ammonium ions on the TiO2 surface. Disregarding the dominant degradation pathway, the role of incident irradiation and photocatalyst optical properties play a crucial role in terms of NH3 degradation efficiency. Therefore, any intervention into photocatalysts surface morphology that will change the absorption and scattering coefficients should be thoroughly studied [20].
Most of the recent publications are related to photocatalytic reactions in liquid mediums such as low concentration water pollutants. There are few publications mentioning photocatalytic degradation of air pollutants, especially NH3 [22]. Furthermore, a theoretical model of zero-order kinetics is very rarely used to analyse the results of photocatalytic experiments, which we have applied in our manuscript instead of the commonly used first-order kinetics.
The aim of this work is to investigate the influence of reactive magnetron sputtering deposition parameters (working gas O2/Ar ration and pressure) on the structural and optical properties of the TiO2 thin films, and to discuss their potential simultaneous use as UV blocking layer in solar cells and photocatalyst for air pollutant degradation. For structural analysis Raman spectroscopy (RS), grazing-incidence X-ray spectroscopy (GIXRD) and atomic force microscopy (AFM) were used. For characterisation of optical properties, we used UV-Vis transmittance/reflectance technique. All prepared samples were tested for ammonia photocatalytic degradation.

2. Materials and Methods

The TiO2 thin film samples were prepared by DC reactive magnetron sputtering using a gas mixture of argon and oxygen as the working gas. The O2/Ar flow rate ratio was varied in the range of 0.05 to 0.50. The Ar and O2 gas flows were regulated and controlled by two mass flow controllers. The base pressure in the magnetron vacuum chamber was 7.0 × 10⁻⁷ mbar. Two values were used for the working gas pressure: 0.67 × 10⁻³ and 1.33 × 10⁻² mbar. The Ar/O2 mixture was introduced into the magnetron vacuum chamber near the titanium target. The magnetron source Thorus 2 HV (Kurt J. Lesker Company, Jefferson Hills, PA, USA) was used for the TiO2 deposition. The deposition was done at room temperature, but during the deposition the substrate temperature had increased up to 60 °C due to the interaction between plasma and the glass substrate. A target made of pure Ti (99.999%) with a diameter of 50.8 mm was used, and the distance between target and substrate was 140 mm. The deposition rate (Figure 1) for TiO2 with the O2/Ar mixture as the working gas is slightly lower than for Ti deposition with pure Ar working gas. It also decreases with the increase in the working gas O2/Ar flow rate ratio because the lighter oxygen ions are less efficient in the sputtering process.
The TiO2 thin films were deposited on a 1 mm thick glass substrate. Before deposition, they were cleaned according to the standard cleaning protocol: ultrasound sonication for 8 min in acetone; then 8 min in isopropyl alcohol, after which they were washed with mili-Q water and dried in a nitrogen flow, and finally treated for 15 min in an UV ozone cleaner to remove any residual organic solvents. After deposition, the TiO2 thin film samples were annealed in a tube furnace (air atmosphere) at 450 °C for 1 h (heating rate 5 °C/min) to obtain nanocrystalline anatase TiO2 thin films.
The content of the working gas plasma during deposition by magnetron sputtering was monitored by optical emission spectroscopy (OES). OES spectra were recorded using the HR4000 spectrometer (Ocean Optics Inc., Dunedin, FL, USA), which was connected to a quartz window (viewing window) of the magnetron sputtering chamber via optical fibre. A focusing lens was used for efficient light collection. A total of 100 single exposures (200 ms exposure time) were averaged for one scan, and the collection rate was 1 image (scan) per minute. The spectral resolution was 0.27 nm. The OES spectrum of gas plasma close to the substrate was recorded because the space close to the target is shielded by the dark space shield of the magnetron source.
The morphology and structure of the obtained TiO2 thin films were analysed using AFM, GIXRD and RS.
N’tegra Prima SPM Atomic Force Microscope (NT-MDT, Moscow, Russia) was used for the TiO2 thin film samples surface mapping in contact scanning mode. Dimensions of the scanned area were 2.5 μm × 2.5 μm. Before quantitative analysis, raw AFM images were corrected by mean plane and polynomial background subtraction. Moreover, larges voids or spikes at the sample surface were masked for surface roughness analysis (root mean square roughness).
GIXRD measurement were obtained using synchrotron X-ray radiation at the MCX beamline at synchrotron Elettra (Trieste, Italy) in grazing angle geometry with the a wavelength of 0.155 nm (8 keV) [23]. The diffraction patterns were obtained at several values of the angle of incidence slightly above the critical angle for total external reflection for TiO2 in order to probe at different depths below the surface. The scattered intensity was collected in a 2θ angular range of 20°–75° with a step-size of 0.05°.
RS measurements were done using Horiba Jobin Yvon’s T64000 confocal micro-Raman spectrometer (Horiba, Kyoto, Japan) equipped with a solid-state laser operated at 532 nm for excitation, an 50× magnification objective. The measurements were conducted with a large working distance. The power of the laser was 20 mW and the confocal slit hole was 200 μm.
Optical properties (absorption coefficient, optical gap) were obtained by UV-Vis transmittance and reflectance measurements. Halogen and tungsten light source in combination with Ocean Optics HR4000 UV-Vis spectrometer (Ocean Optics Inc., Dunedin, FL, USA) was used for UV-Vis transmission detection in a wavelength range of 250–1000 nm. From obtained transmission data, the layer thickness and dielectric constants (index of refraction and extinction) were calculated using a point-wise unconstrained optimisation approach and approximating sample geometry with one thin film layer with plan-parallel boundaries on thick low-absorbing substrate, as described previously [24]. The optical gap was calculated using standard Tauc formula [25,26].
All photocatalytic experiments were conducted in a mini-photocatalytic wind tunnel (MPWT) reactor. The reactor was made of laboratory glass (DURAN®) that transmits UV radiation larger than 305 nm. The shape of the reactor is cylindrical, 45 mm in diameter and 155 mm long, and it is assembled from two halves for easier insertion of the photocatalyst. More details about experimental setup for photocatalytic degradation of ammonia in air can be found in [22]. The MPWT reactor is placed under the lamps, so its entire surface is illuminated. The photocatalyst was placed in the middle of the photoreactor, at 7 cm distance from the lamps. The source of irradiation were linear full spectrum lamps (Terra Exotica-Sunray UVB 6.0) with an enhanced UVB effect simulating solar radiation. The lamps are 120 cm long and 36 W and are coated with a high-efficiency reflective surface in the shape of a parabolic mirror to direct radiation on the photoreactor surface. Average UVA intensities measured on the photocatalyst surface were 0.571 mW/cm2, and UVB intensities 0.678 mW/cm2. The air pump (Fluval Q2, Rolf C. Hagen Ltd., Castleford, UK) was used to volatilise ammonia from an evaporation chamber filled with ammonia solution (25% p.a., Kemika), C(NH3,aq)(0) = 100 ppm. The maximum flow rate of 240 L/min was used with a resulting air flow velocity of 3.4 cm/s. Ammonia in the air stream enters the reactor in which the photocatalyst is located. Mean residence time in MPWT was τ = 4.41 s. Two outlets lead from the reactor: one that drains the excess gas into the Rettberg flusher filled with distilled water, and the other that is connected to the Geotech GA5000 (QED Environmental Systems Ltd., Coventry, UK) gas sensor for NH3 concentration in outlet air stream monitoring at desired time intervals. Additional blank experiments were made to monitor the ammonia concentration at the entrance of the reactor and to estimate the trendline during desired time interval; the T-valve was used at the entrance to bypass the reactor and measure ammonia directly.

3. Results and Discussion

3.1. Optical Emission Spectroscopy (OES)

Figure 2 compares the OES spectra as a function of the working gas mixture O2/Ar flow rate ratio. The most intense OES lines characteristic for Ar, Ti and O are assigned by comparison with data from the NIST Atomic Spectra Database [27]. All OES spectra presented in Figure 2 are dominated by Ar emission lines in the 600–900 nm range. The most intensive emission lines characteristic for Ti are clearly observed in the 350–550 nm range only when pure argon is used as the working gas. When O2 is added to the working gas mixture, the surface of the Ti target is immediately oxidised and the bare Ti emission lines are attenuated. Emission lines of possible impurities present in the working gas, such as hydrogen, nitrogen, carbon or OH, were not observed in the OES spectra.
According to NIST Atomic Spectra Database, several emission lines characteristic for oxygen ions can be observed (777 nm, 844 nm, 926 nm) as shown in Figure 2. The most intensive one, around 777 nm (Figure 3), was used to check the O2/Ar flow rate ratio in the working gas mixture. The ratio of the integrated intensity of the oxygen line (777 nm) and the closest Ar emission line (772 nm) are presented in Figure 4. The OES line intensity ratio is linear dependent on the O2/Ar flow rate ratio in the whole measured range and is not dependent on the total working gas mixture pressure in the magnetron sputtering chamber.

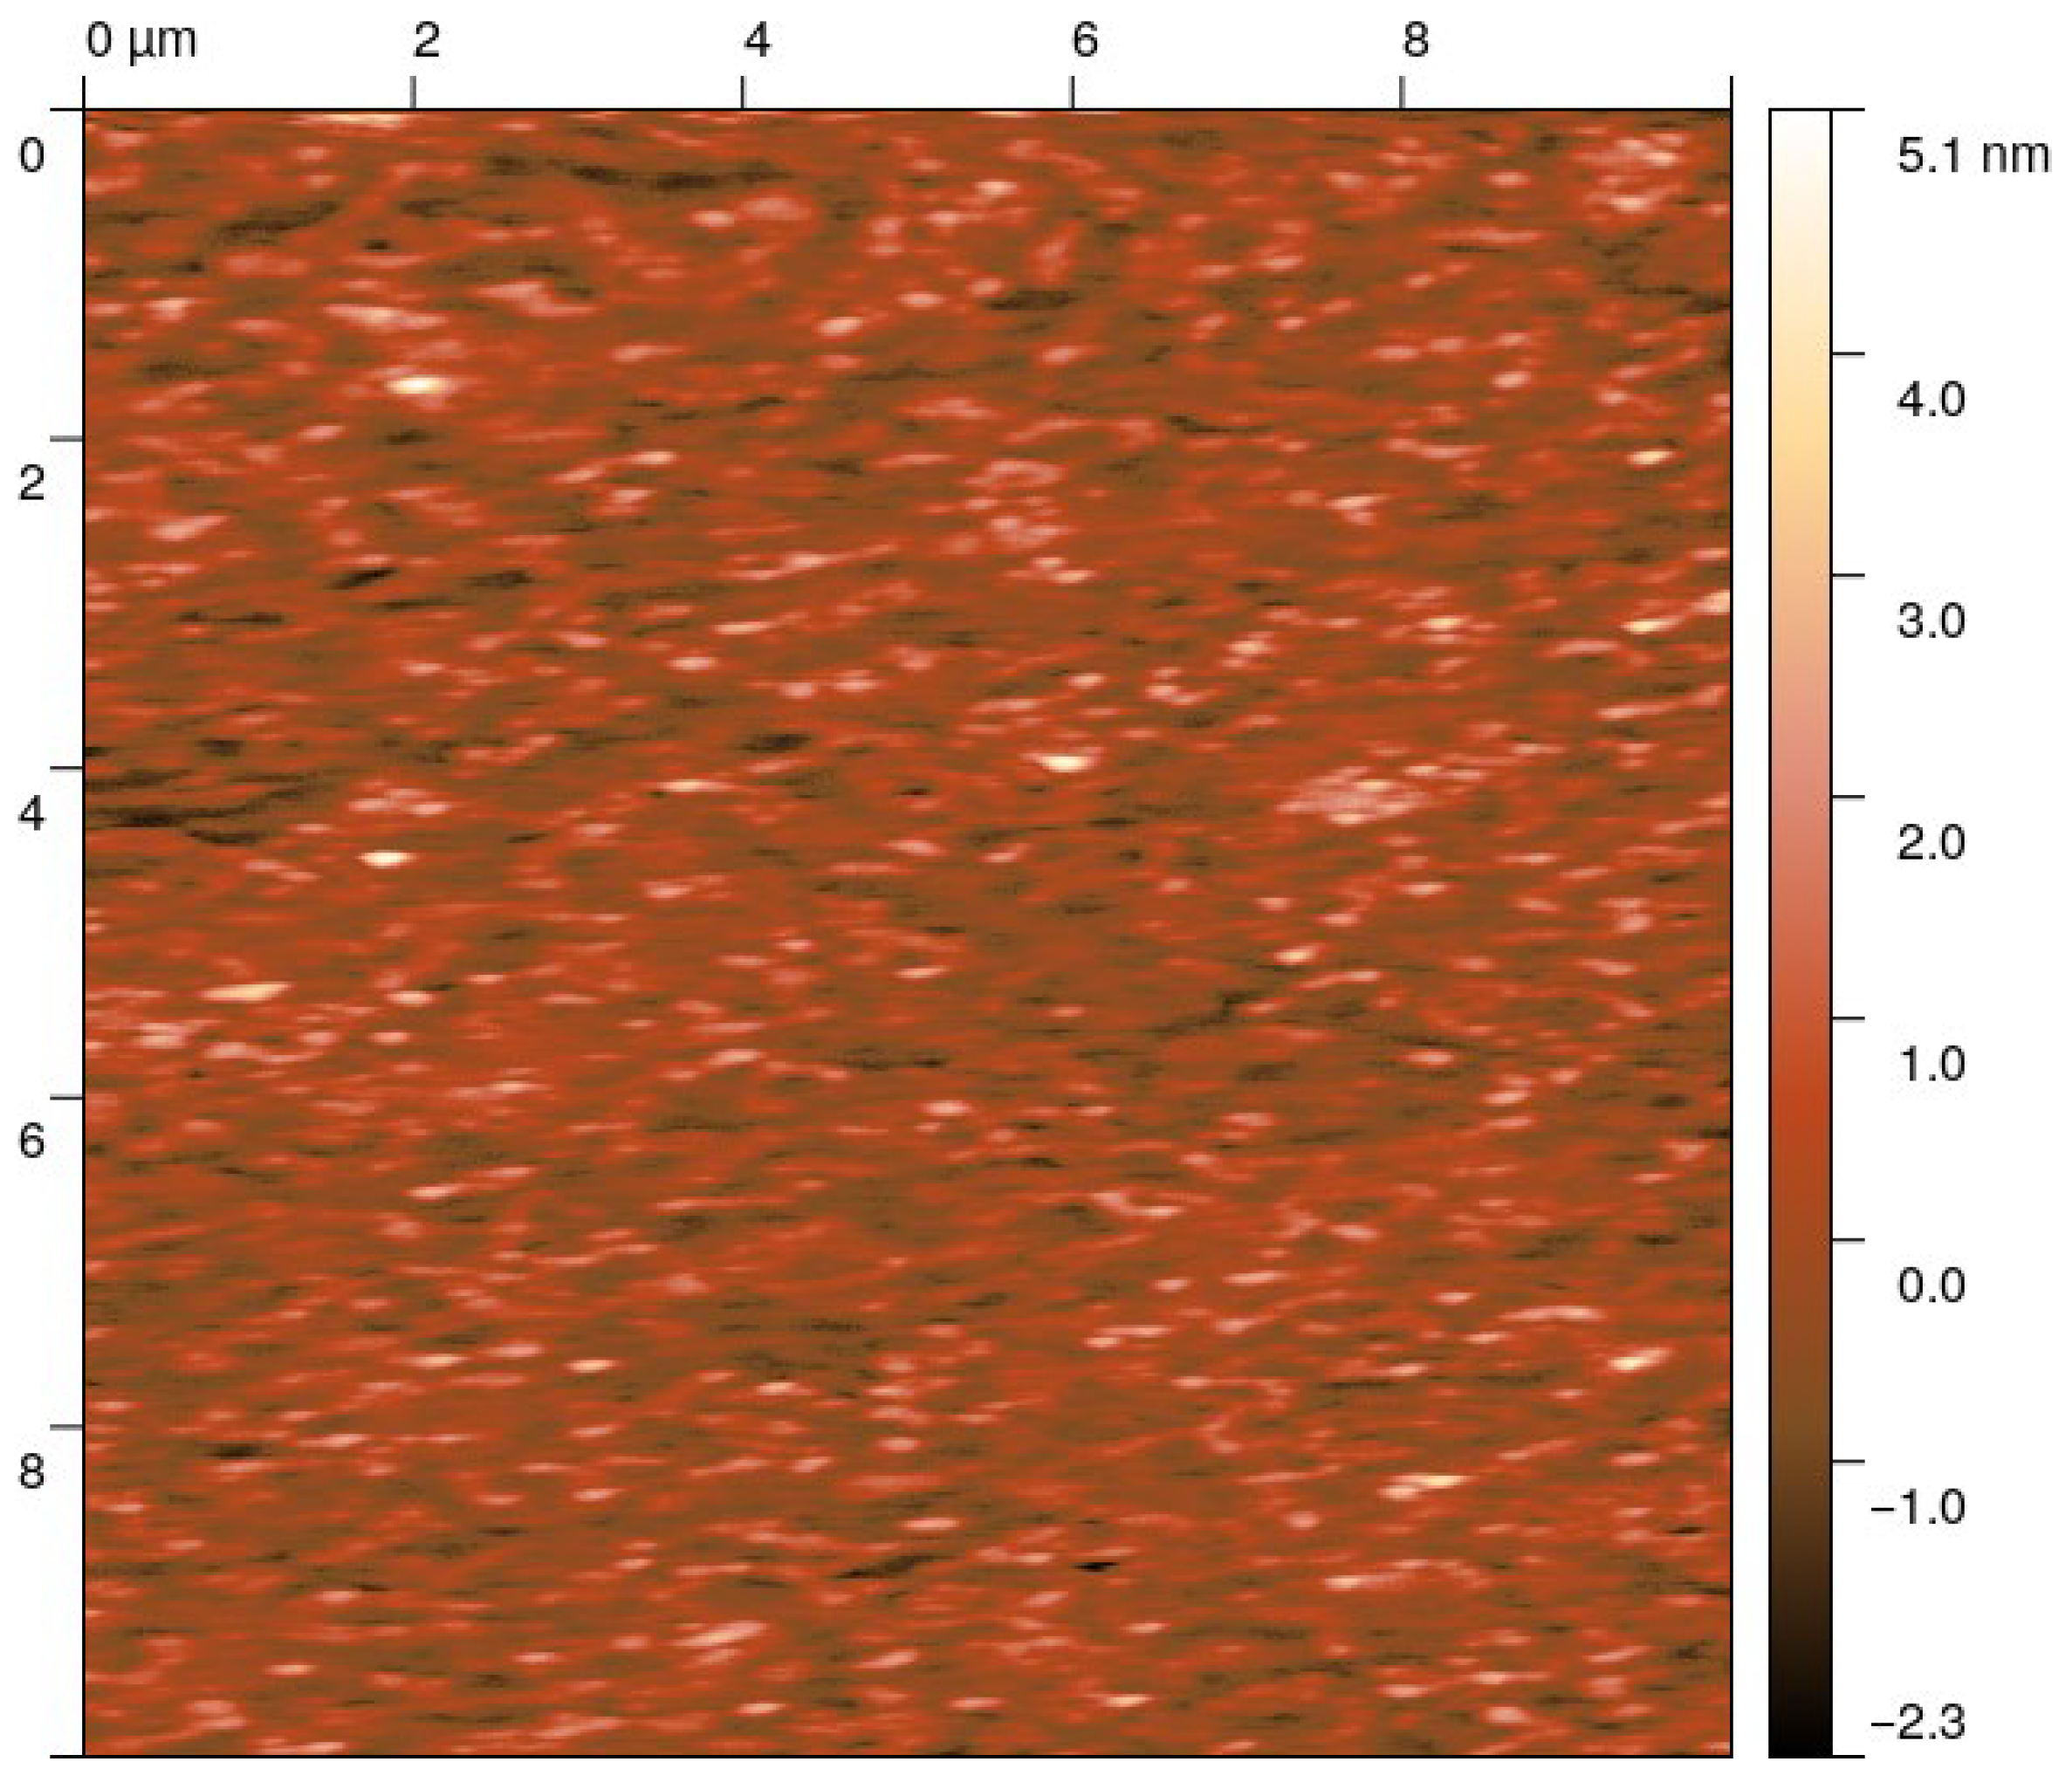
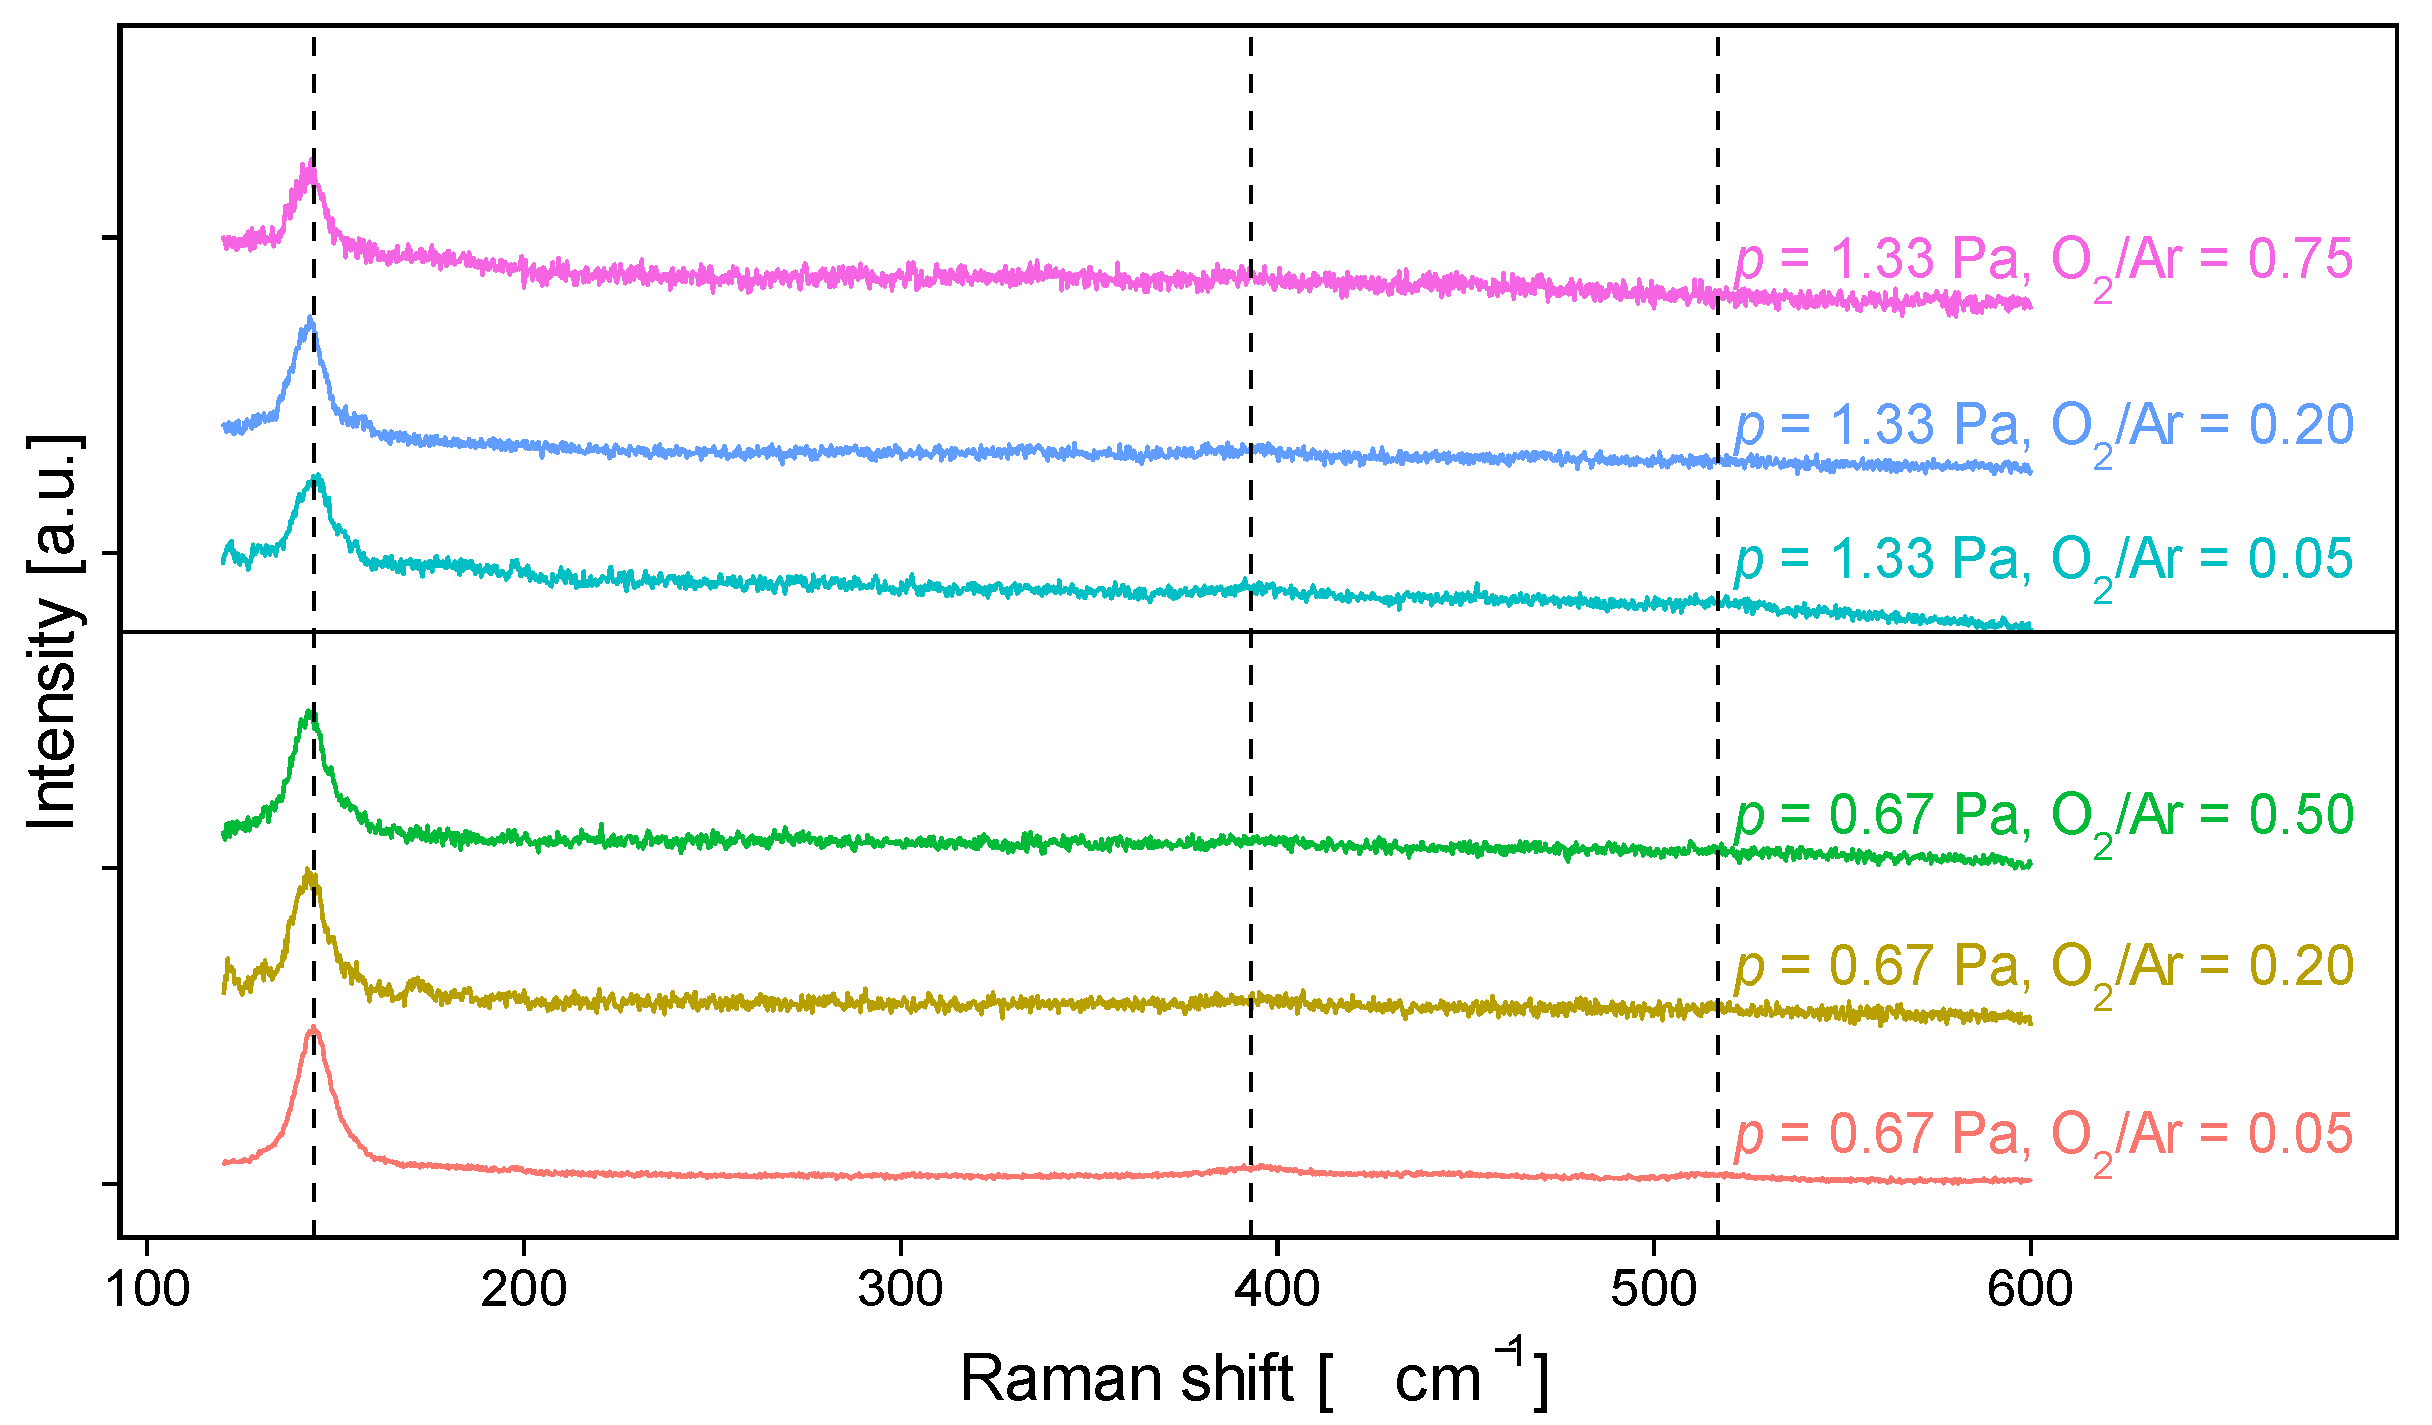
3.2. Structural Properties and Surface Morphology

The Raman spectra of all samples (Figure 5) confirmed that, by annealing at 450 °C for 1 h, we have obtained the anatase crystalline phase. In the sample prepared with the lowest O2/Ar flow rate ratio, only the bands characteristic for anatase (at 144, 197, 399 and 519 cm−1) can be observed [28], while in the other samples only the most prominent band around 144 cm−1 was visible. The absence of other characteristic bands, as well as the broadness of this band, indicates the poor crystallinity of the samples.
Quantitative analysis of the Eg band around 144 cm−1 shows a peak-shift to lower frequencies (Table 1) compared to the value of bulk material taken from the literature [28]. The shift is more pronounced for samples deposited with a higher O2/Ar flow rate ratio. This could be due to the presence of tensile strain in the TiO2 thin film layers [29].
GIXRD diffractograms of the as deposited and the annealed TiO2 thin film samples, deposited with the various O2/Ar flow rate ratios and the working gas pressure Pa, are presented in Figure 6. It can be seen that the as deposited TiO2 thin films are amorphous. Diffraction maxima characteristic for the anatase polymorph were observed. In comparison to other samples, the sample deposited with the highest contribution of oxygen in the working gas mixture (O2/Ar = 0.50) and the higher working gas pressure (1.33 Pa) had the rutile phase as dominant (Figure 6). A very weak and wide background peak below 2θ = 30° is correlated to the glass substrate.
The average size of the nanocrystals is estimated from the width (FWHM) of the anatase (101) diffraction maximum by using the simple Scherrer formula [30], and it is between 3.5 and 5.0 nm for all samples (Table 1). The TiO2 layers deposited with higher working gas pressure consist of somewhat larger nanocrystals. Moreover, nanocrystal size slightly decreases for the higher values of the working gas O2/Ar flow rate ratio.
The surface morphology was analysed by atomic force microscopy (Figure 7). For all prepared samples, the surface is very flat with only a few very large spikes or grains. If these very large grains are excluded from the analysis, the RMS roughness is around or below 5 nm for all analysed samples (Table 1). RMS roughness is highest for the sample deposited with the lowest O2/Ar working gas flow ratio. Samples with a higher average roughness are also deposited at a higher working gas pressure.
As expected, the RMS roughness values are comparable to average nanocrystal sizes estimated from GIXRD by using the Scherrer formula (Table 1). This indicates that the surface of the samples is dominated by the upper surfaces (endings) of the nanocrystals. A higher RMS roughness also means a larger effective surface area, which could improve the efficiency of the photocatalytic process and diffuse light scattering.

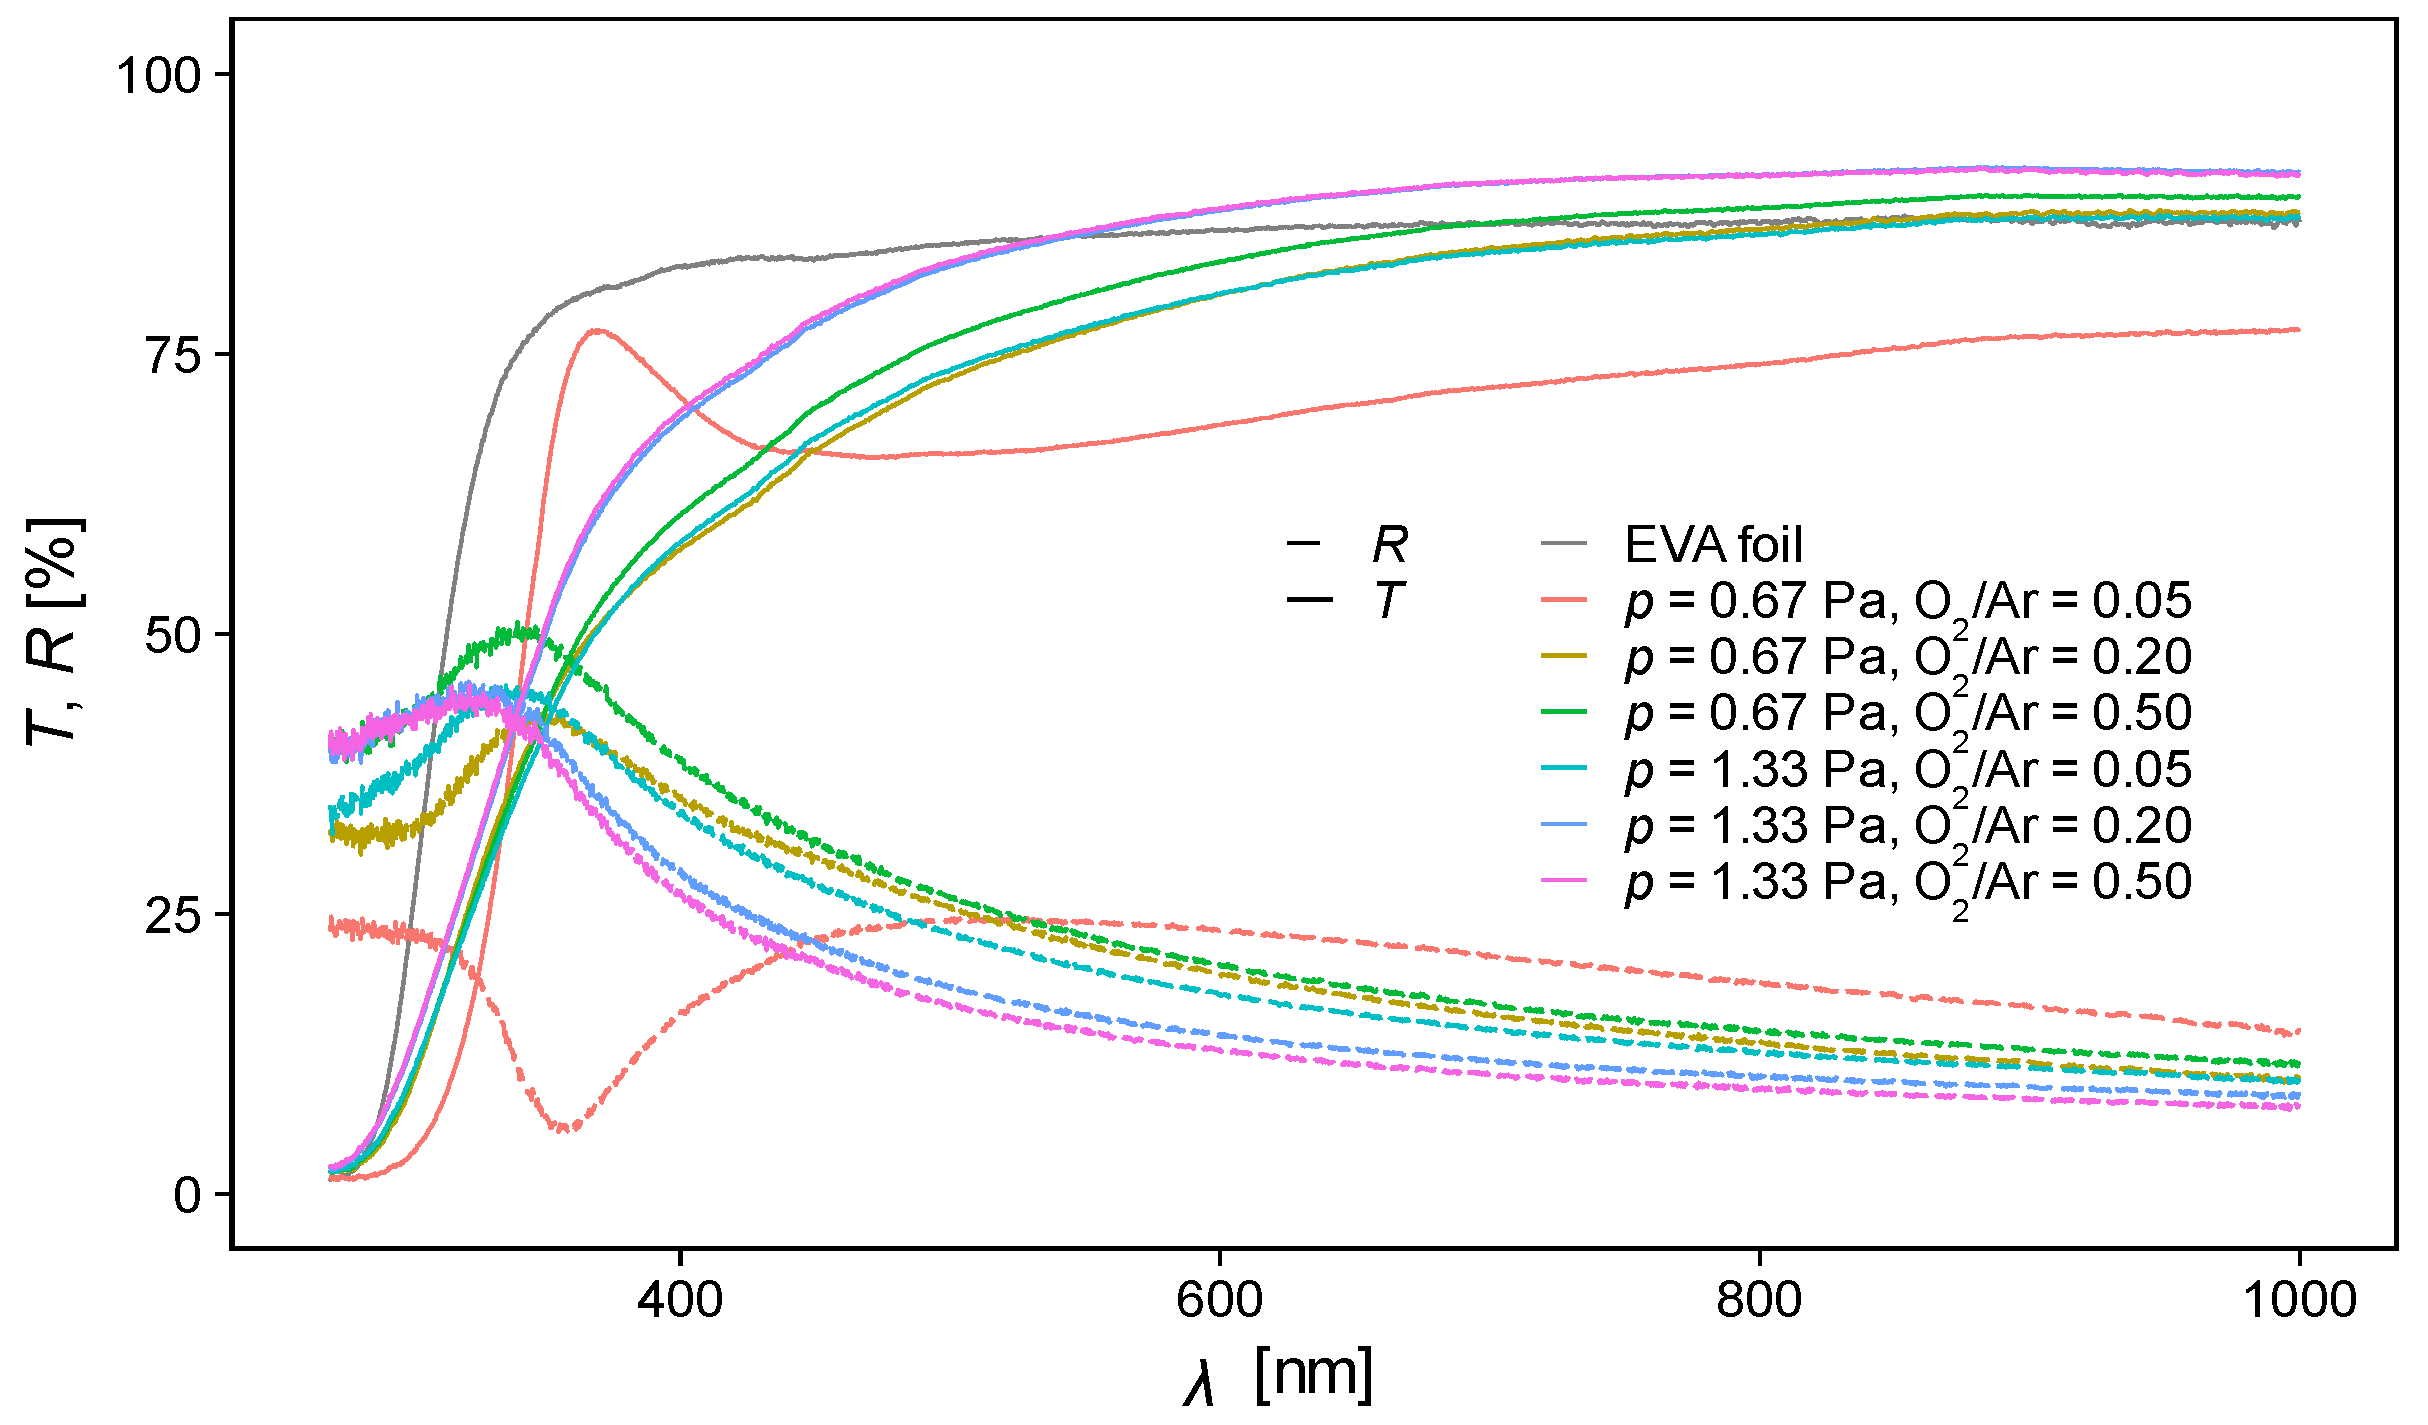
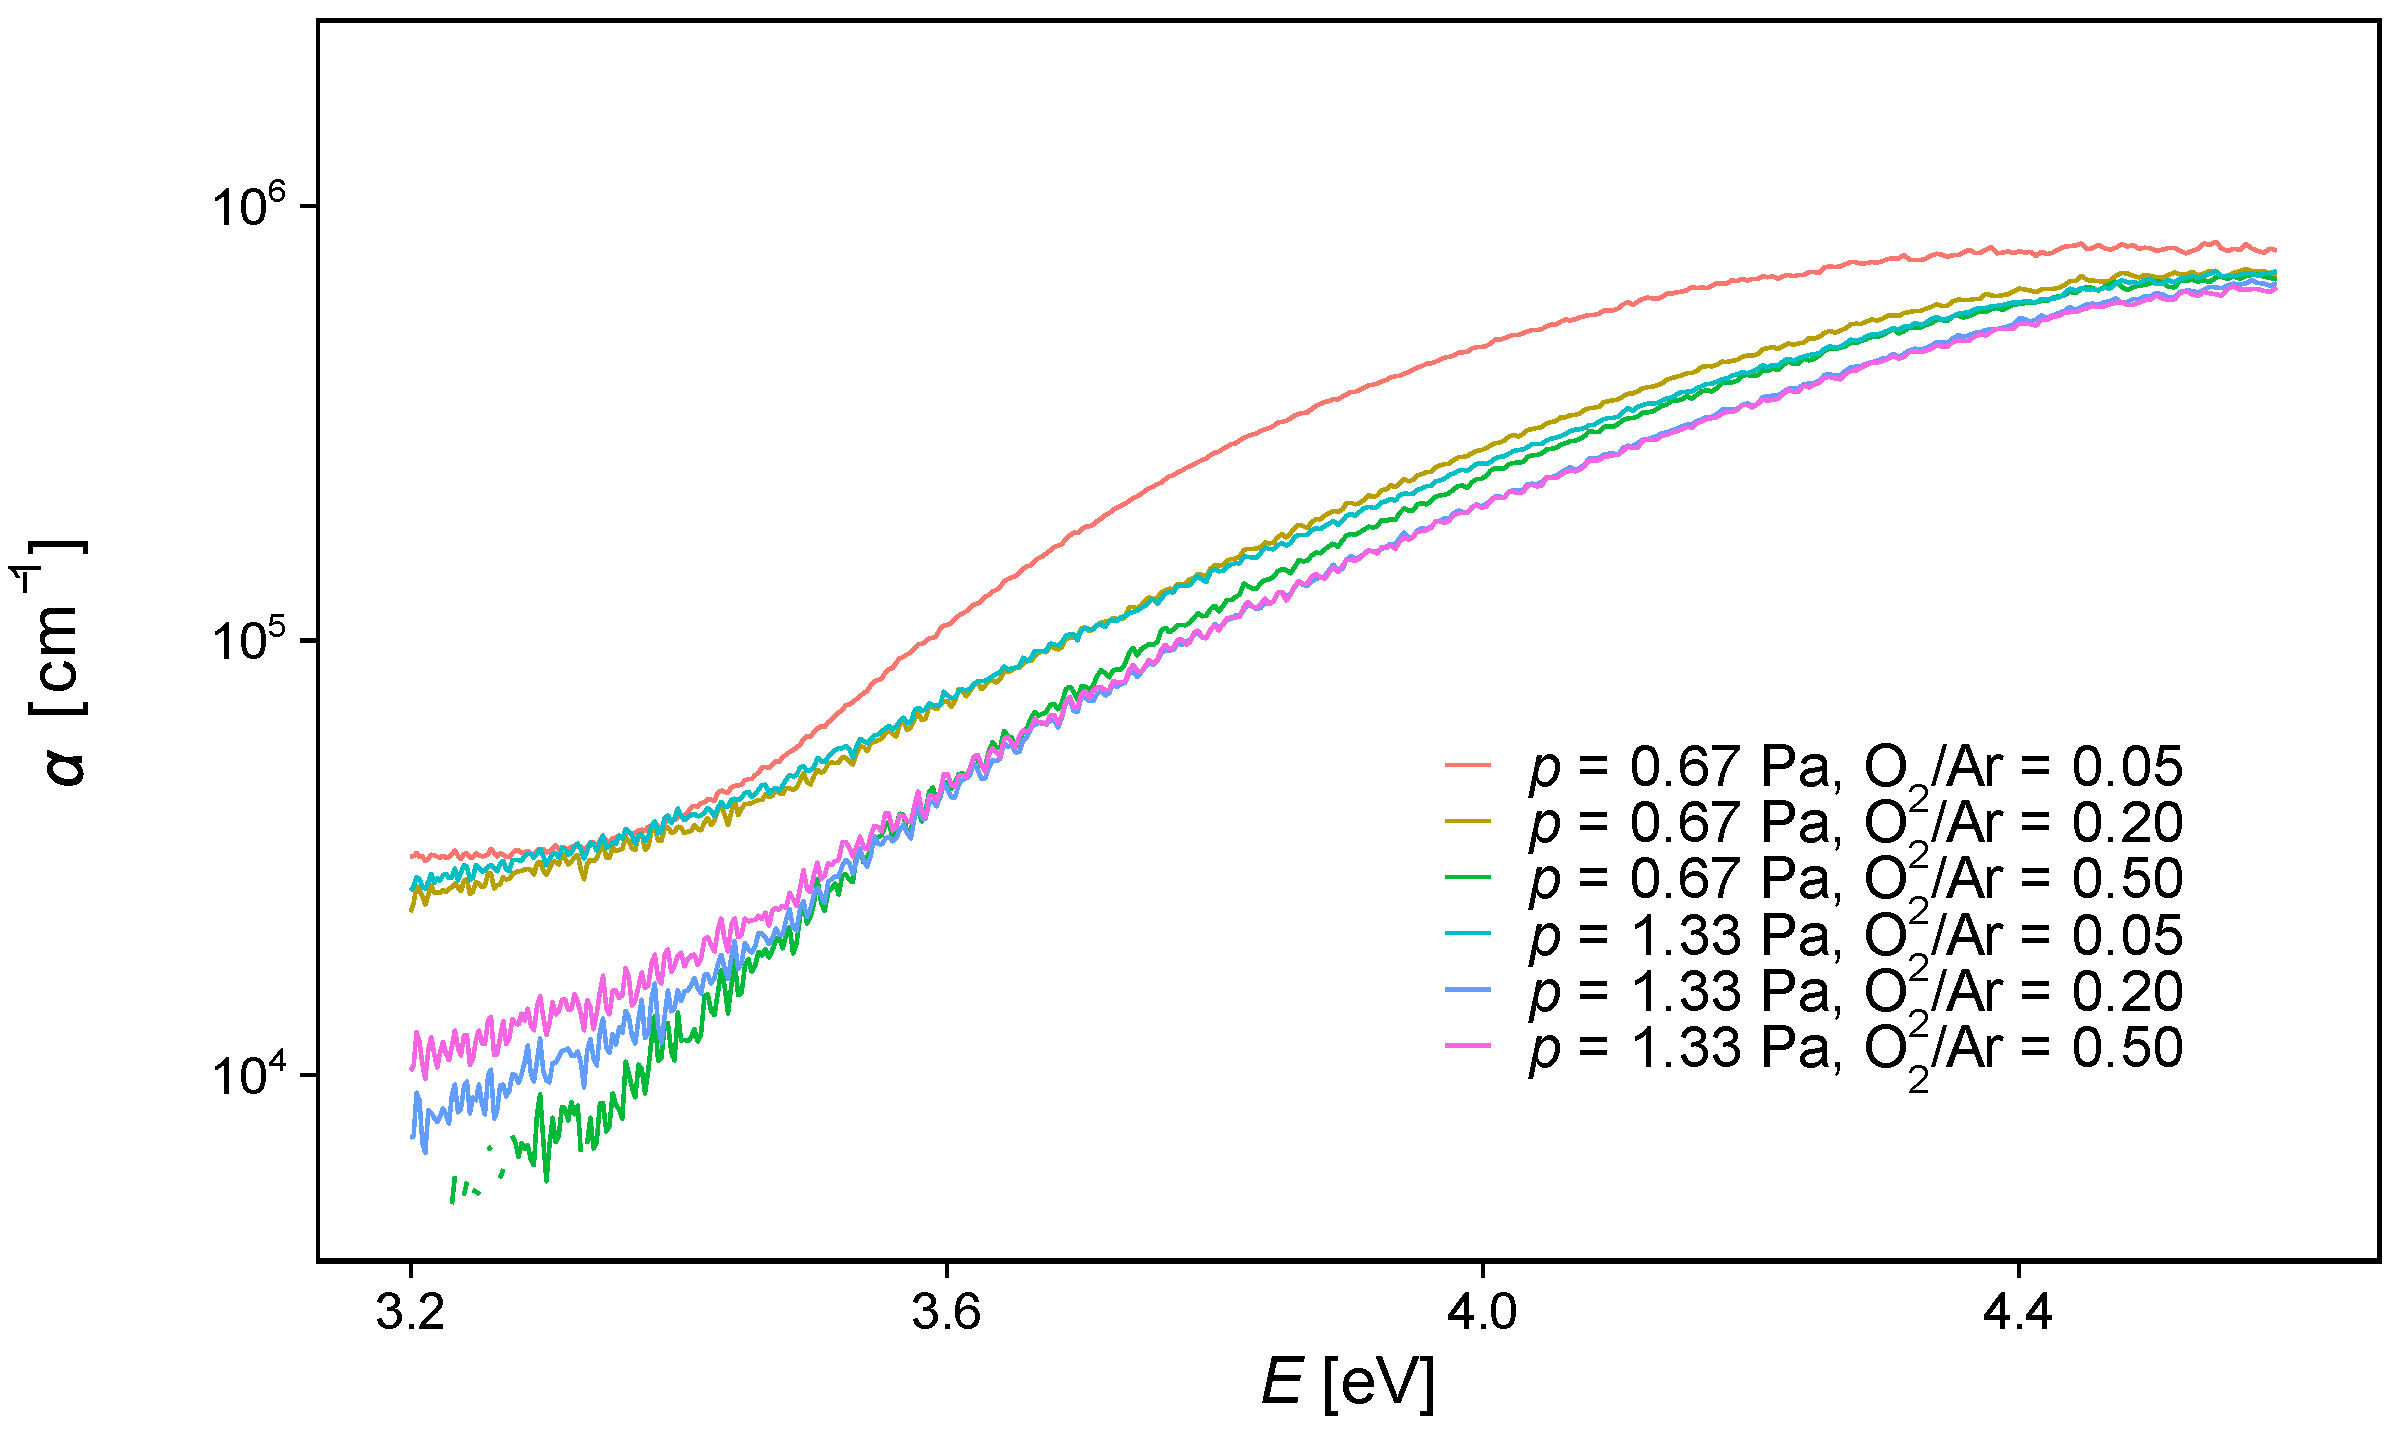
3.3. Optical Properties
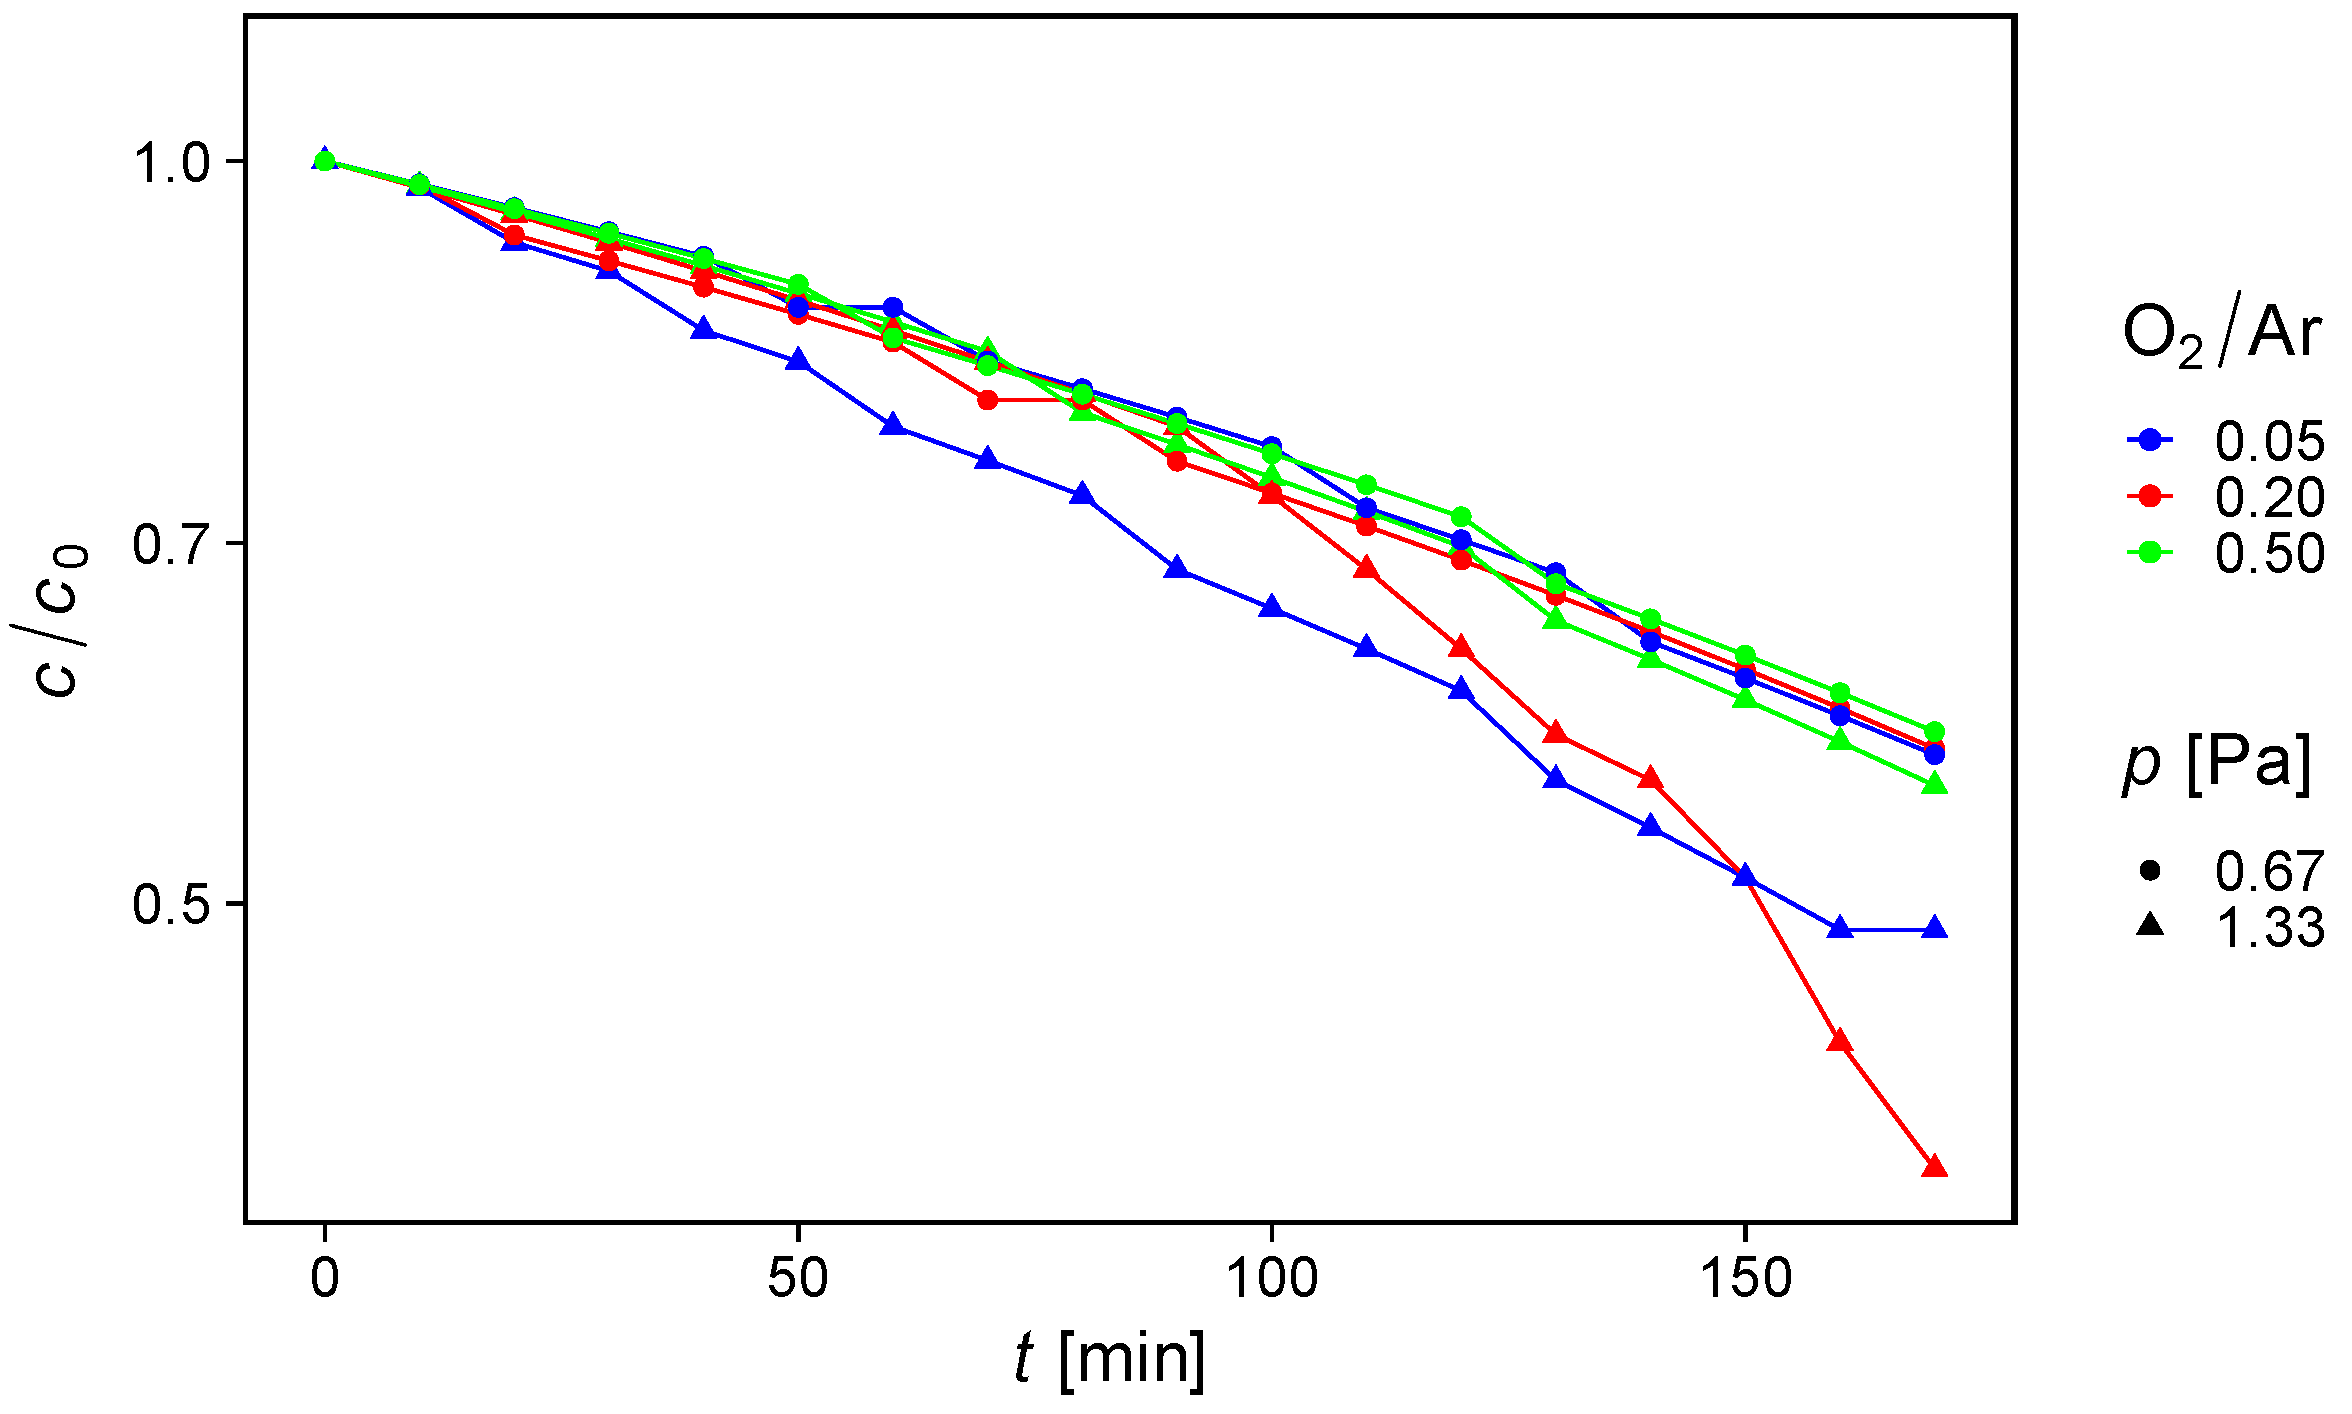
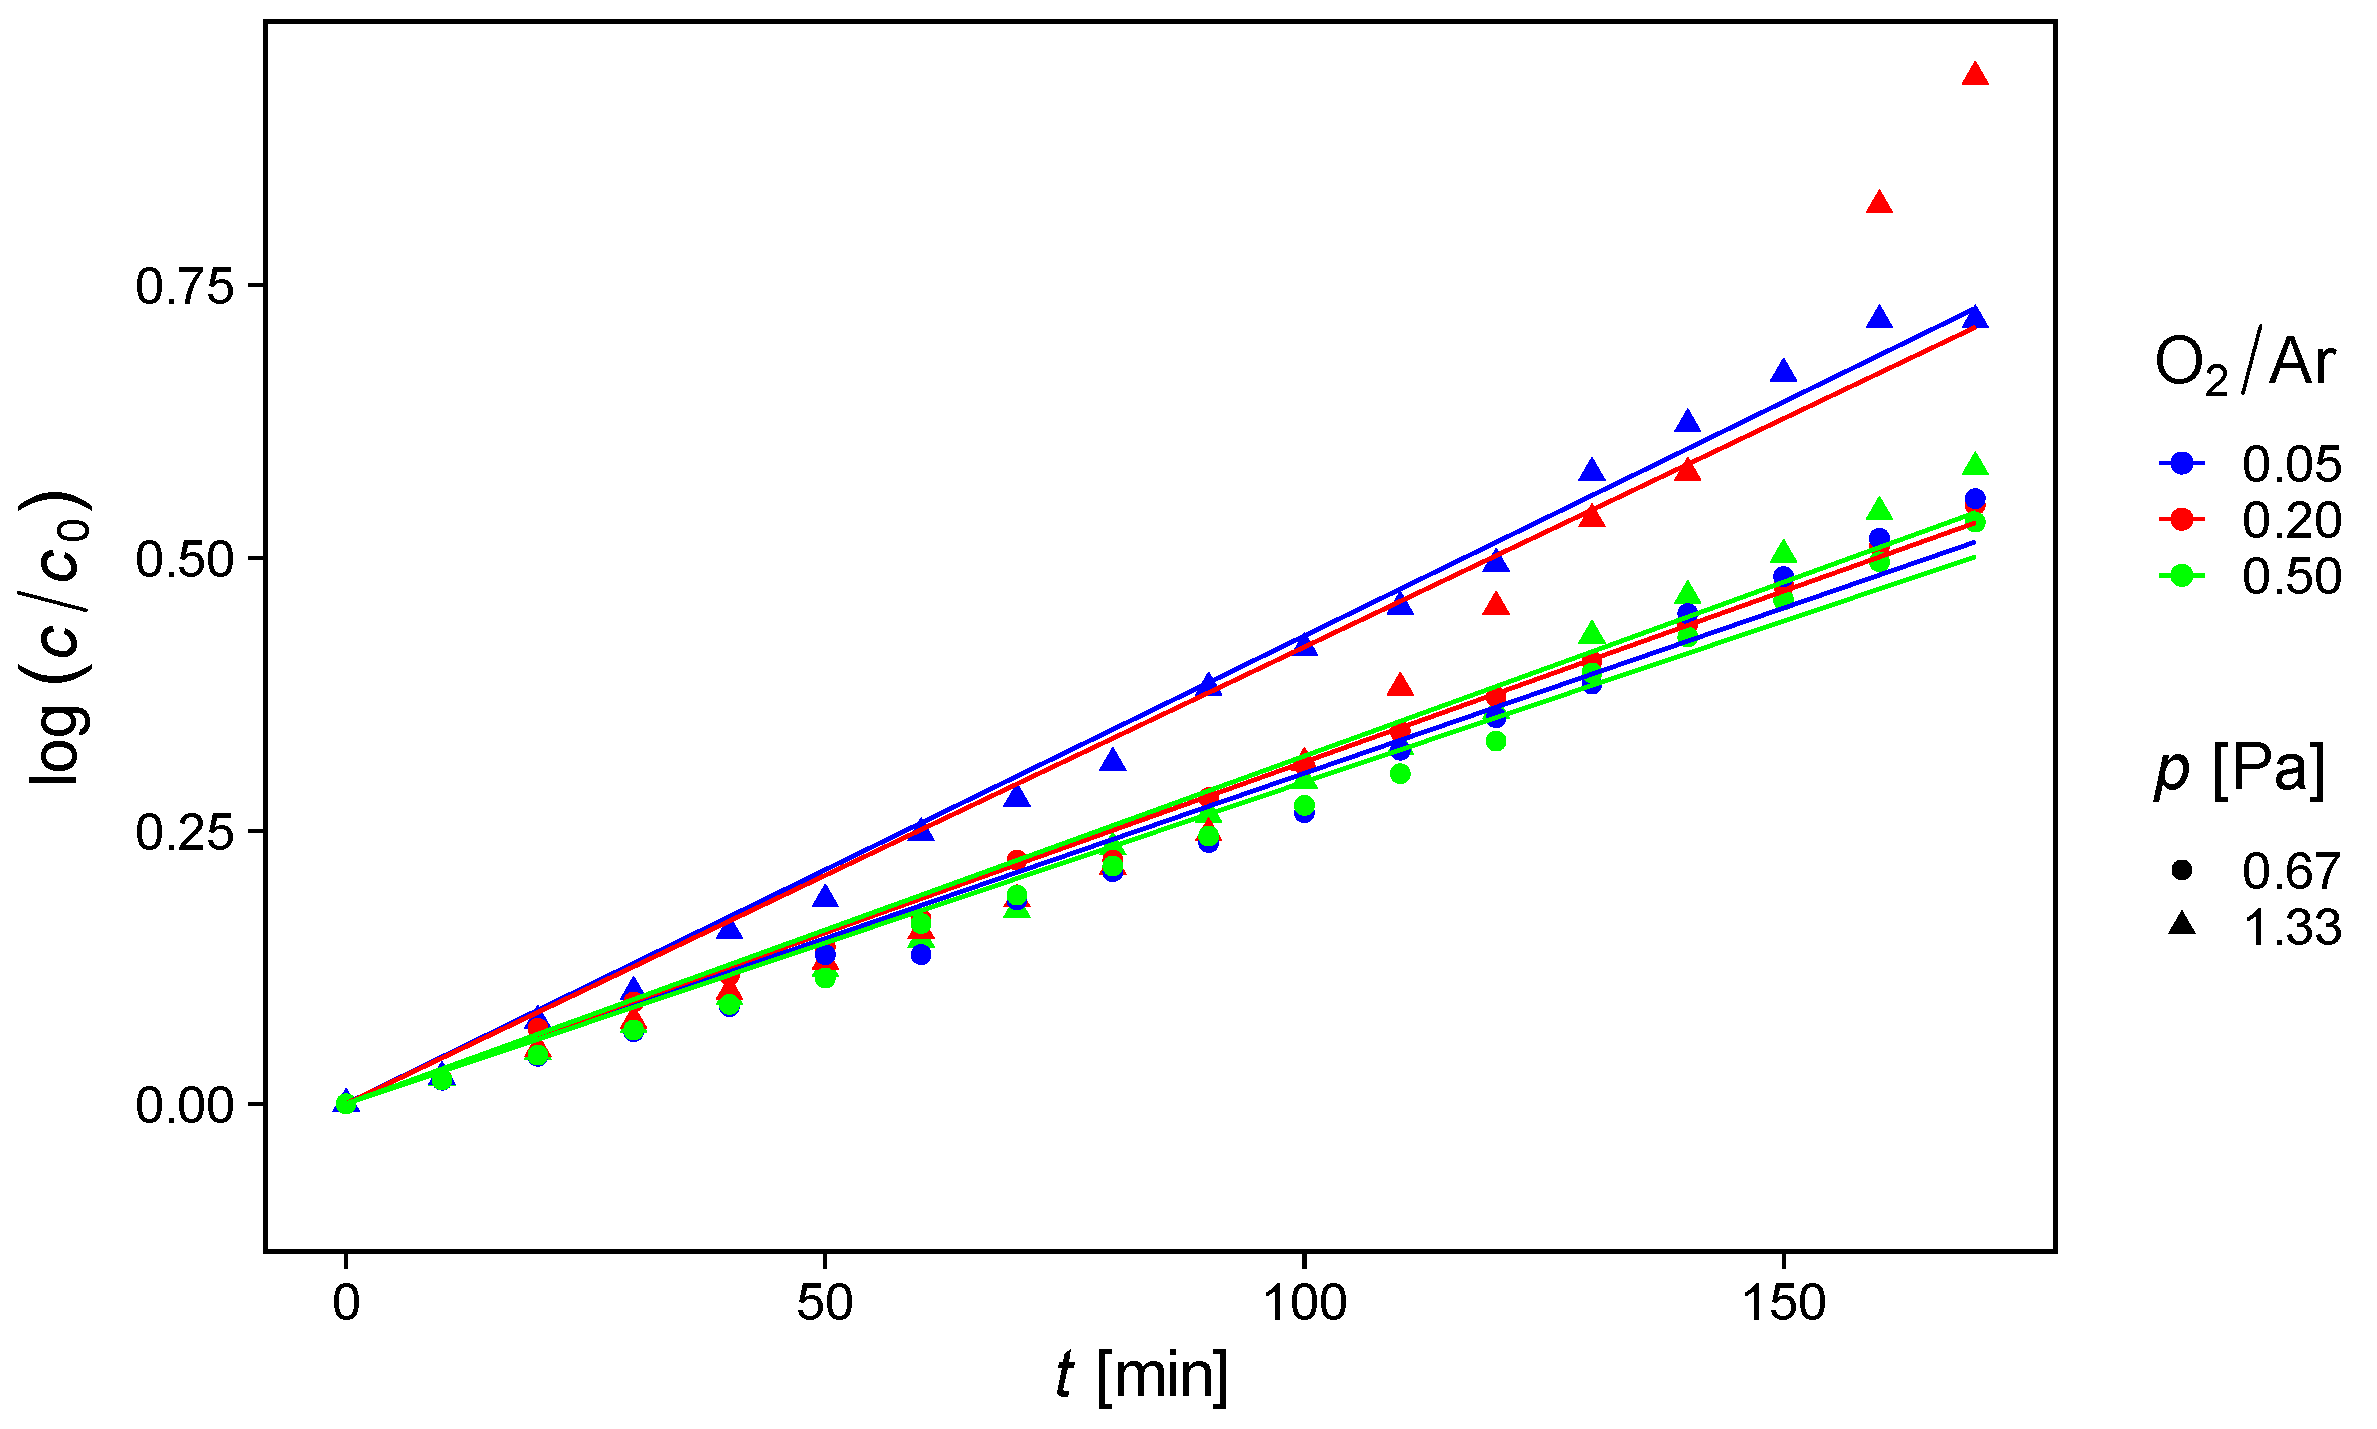
The optical properties of the deposited TiO2 samples were investigated by measuring the optical transmittance and reflectance in the UV, visible and NIR parts of the spectrum (Figure 8).
In the visible part of the spectrum, the TiO2 samples are mostly transparent with a transmittance greater than 80%. In the NIR range, the transmittance of samples deposited with a higher working gas pressure and lower oxygen content almost reaches the transparency of glass substrates (92%). A significantly lower transmittance within the Vis/NIR range is only observed for the sample with O2/Ar = 0.05 and p = 0.67 Pa. This may be due to deposition conditions (low working gas pressure and oxygen content) that are very close to the so-called metallic regime of reactive magnetron sputtering process [12]. In the UV range, below 350 nm, the transmittance of all samples decreases rapidly and approaches zero, indicating the existence of an optical bandgap in this wavelength range. The samples deposited at the higher values of working gas pressure have a higher transmittance compared to the samples deposited at the same O2/Ar ratio and a lower working gas pressure. Interference fringes in the transmittance and reflectance data are not observed because the TiO2 layers are very thin (about 50 nm). The interference fringes are only visible in the sample deposited with the smallest O2/Ar ratio (0.05) and lowest pressure (0.67 Pa).
The transmittance of the EVA foil (Lushan EV1050G2), which is commonly used as an encapsulation material in c-Si photovoltaic (PV) modules between glass and solar cells, is added in Figure 8 for comparison. For the transmittance experiment, the EVA foil sample was laminated between two glass slides (the same as the substrate used for the TiO2 thin film deposition). In the Vis/NIR range, the transmittance of all TiO2 samples is comparable to the transmittance of the EVA foil while in the UV range, the TiO2 samples start to absorb (block) light at higher wavelengths than the EVA foil. In this way, using the TiO2-coated glass instead of the bare glass substrate in front of the EVA foil encapsulant will prevent UV light from reaching the EVA foil, being absorbed there and causing the EVA foil degradation problems mentioned in the Introduction. However, this also reduces the incidence of light into the c-Si solar cells and lowers the initial efficiency of the solar cells. The reflectance is very low in the Vis/NIR range and is slightly higher than the reflectance of the glass substrate (8%) for all prepared samples. The variations of the reflectance in the Vis/NIR range are comparable to the variations of the Vis/NIR transmittance. Samples with higher transmittance have lower reflectance in the Vis/NIR range. In the UV range, an increase in reflectance of up to 50% can be observed for samples deposited with a lower working gas pressure and a higher oxygen content in the working gas mixture.
The spectral distribution of the absorption coefficient calculated from the transmitance/reflectance data is shown in Figure 9. The sharp decrease in the transmittance below 400 nm is associated with the decrease in the absorption coefficient below the energy of the optical bandgap. In accordance with the variation of transmittance and reflectance, the samples deposited with a higher working gas pressure and a smaller O2/Ar ratio have a higher absorption coefficient.
The width of the optical bandgap is calculated using the Tauc relation [31] and the absorption coefficient data is presented in Figure 9. The calculated values for all analysed samples are in a range of 3.27 to 3.36 eV (Table 1). These values are very close to the value for the EVA encapsulant, which is optimal for application in c-Si solar cells. In Ref. [32] Singh showed that c-Si solar cells encapsulated with the EVA foil with a cut-off wavelength of 360 nm (3.44 eV) have the best performance. For two samples deposited at a higher working gas pressure (1.33 Pa) and a lowest O2/Ar flow rate ratio (0.05), the absorption edge is slightly shifted towards lower energies (Table 1). The energy of the bandgap can be varied by the deposition parameters in a limited range close to the values characteristic for bulk TiO2.
For the application as a UV blocking layer, it is mandatory that the sample absorbs and reflects the UV radiation as much as possible (maximal attenuation of UV radiation), in order to minimise the influence on solar cells efficiency (degradation of EVA foil encapsulation layer and active part of solar cell). At the same time in the Vis/NIR range, the transmittance of the UV blocking layer should be maximal without interference fringes.
Because the variations in the optical bandgap are not significant, the transmittance in the Vis/NIR range has the greatest impact on solar cell efficiency. As a result, using a TiO2 layer deposited at a higher working gas pressure and oxygen concentration as a UV blocking layer is ideal.

3.4. Photocatalysis

The results of the photocatalytic degradation of ammonia are shown in Figure 10.
The rate of ammonia degradation was given as:
d C d τ = r
The MPWT was considered as an ideal steady state plug flow reactor (PFR), while the reaction rate was fitted to zero-order kinetics. Per single pass in MPWT, a decrease in ammonia concentration was simplified to
Δ C = k z τ
where kz (ppm s−1) represents the apparent zero-order reaction rate constant and τ is the mean residence time. The zero-order kinetics is common to heterogeneous catalysis in the gas phase when only a small fraction of pollutant molecules is in a favourable position to react, i.e., NH3 adsorbed to the surface near oxidising radicals. The reacting fraction of pollutants molecules at the photocatalyst surface continuously replenished from the “saturated” gas phase making the reaction rate independent on the pollutant concentration. Having in mind experimentally calculated absorption coefficients, α (cm−1), an equation was modified to:
Δ C = k intrinsic α UVA I 0 , UVA 0.5 + α UVB I 0 , UVB 0.5 τ
where kintrinsic (ppm cm2.5 mW−0.5 s1) represents the intrinsic zero-order reaction rate constant for degradation of ammonia over thin films of photocatalysts, α are average absorption coefficients in UVA and UVB region and I0 is the incident irradiation at the photocatalyst surface (mW cm−2).
The ammonia degradation follows the established zero-order kinetics in all experiments. The apparent zero-order reaction rate constant kz is similar for most samples (Figure 11 and Table 2). Only the samples deposited with a higher pressure (p = 1.33 Pa) and a lower O2/Ar flow rate ratio of the working gas (O2/Ar = 0.05 and 0.20) show a slightly higher kz constant.
On the other hand, the variations are significantly greater in the intrinsic reaction rate constant kintrinsic, which is calculated from kz by normalising to the mean absorption coefficient in the UVA and UVB spectral range for each sample. This variation of kz can be correlated with the surface morphology of the prepared TiO2 thin films. A comparison with the results presented in Table 1 shows the large influence of the RMS surface roughness on the kintrinsic constant. The greatest intrinsic reaction rate is obtained for the samples with the greatest RMS surface roughness, i.e., effective surface area. According to Coto et al. [33], this can be explained by the reduction of the thickness of the hydrodynamic boundary layer and a more efficient interaction between pollutant and rough catalytic surface.
As expected, our TiO2 thin films deposited by DC reactive magnetron sputtering are less efficient in ammonia degradation compared to the results of the TiO2 P25 nanopowder samples tested in the same type of photocatalytic reactor [22].

4. Conclusions

We have successfully prepared a series of anatase TiO2 thin films by DC reactive magnetron sputtering using Ar + O2 mixture as the working gas, and a pure Ti target. The prepared samples have a homogeneous surface with a surface roughness in the nanometre range (<6 nm). We have shown that the structural and optical properties of the obtained thin films can be varied in a limited range by deposition conditions, such as Ar/O2 ratio in the gas mixture. The prepared TiO2 thin films are transparent in the visible region of the spectrum and absorb light in the UV region below the energy of the optical band gap (3.3 eV), making them suitable for the use in UV light blocking layers in c-Si photovoltaics. In addition, the very high absorption coefficient in the UV range enables the use of TiO2 thin films for photocatalytic degradation of ammonia. We showed that the surface morphology of the TiO2 layer has a great influence on the kinetics of the photocatalytic process. The optimal candidates for the dual application, UV blocking layer and photocatalytic degradation of ammonia are the samples with the highest surface roughness deposited with a higher working gas pressure and lower O2/Ar ratios.

Author Contributions

Conceptualisation, K.J.; methodology, K.J.; samples preparation, K.J.; formal analysis, K.J.; writing—original draft preparation, K.J., I.G. and T.Č.; writing—review and editing, K.J., T.Č., I.G. and A.G.; visualisation, K.J.; funding acquisition, A.G., D.G. and I.G.; GIXRD experiment and analysis, K.J., J.R.P. and A.H.; AFM experiment and analysis, P.D.; Raman spectroscopy experiment and analysis, A.G. and K.J.; UV-Vis experiment and data analysis, D.G., M.B. and K.J.; photocatalytic degradation experiment and analysis, I.G., J.M. and T.Č. All authors have read and agreed to the published version of the manuscript.

Funding

This research was supported by European Regional Development Fund (ERDF) under the (IRI) project “Improvement of solar cells and modules through research and development” (grant no. KK.01.2.1.01.0115) and Croatian Science Foundation project “Nanocomposites comprising perovskites for photovoltaics, photo-catalysis and sensing” (grant nos. IP-2018-01-5246 and DOK-2018-09-7558). Photocatalytic studies were done in the frame of the project “Recycled rubber & Solar photocatalysis: an ecological innovation for passive air and health protection” (RGSF), supported by European Regional Development Fund (ERDF) (grant no. KK.01.1.1.07.0058).

Conflicts of Interest

The authors declare no conflict of interest.

References

  1. Ghazaryan, L.; Handa, S.; Schmitt, P.; Beladiya, V.; Roddatis, V.; Tünnermann, A.; Szeghalmi, A. Structural, Optical, and Mechanical Properties of TiO2 Nanolaminates. Nanotechnology 2021, 32, 095709. [Google Scholar] [CrossRef]
  2. Fujishima, A.; Rao, T.N.; Tryk, D.A. Titanium Dioxide Photocatalysis. J. Photochem. Photobiol. C Photochem. Rev. 2000, 1, 1–21. [Google Scholar] [CrossRef]
  3. Henderson, M.A. A Surface Science Perspective on TiO2 Photocatalysis. Surf. Sci. Rep. 2011, 66, 185–297. [Google Scholar] [CrossRef]
  4. Hashimoto, K.; Irie, H.; Fujishima, A. TiO2 Photocatalysis: A Historical Overview and Future Prospects. Jpn. J. Appl. Phys. 2005, 44, 8269–8285. [Google Scholar] [CrossRef]
  5. Di Paola, A.; Bellardita, M.; Palmisano, L. Brookite, the Least Known TiO2 Photocatalyst. Catalysts 2013, 3, 36–73. [Google Scholar] [CrossRef]
  6. Kim, T.; Lim, J.; Song, S. Recent Progress and Challenges of Electron Transport Layers in Organic–Inorganic Perovskite Solar Cells. Energies 2020, 13, 5572. [Google Scholar] [CrossRef]
  7. Tang, J.; Durrant, J.R.; Klug, D.R. Mechanism of Photocatalytic Water Splitting in TiO2. Reaction of Water with Photoholes, Importance of Charge Carrier Dynamics, and Evidence for Four-Hole Chemistry. J. Am. Chem. Soc. 2008, 130, 13885–13891. [Google Scholar] [CrossRef] [PubMed]
  8. Lee, K.; Mazare, A.; Schmuki, P. One-Dimensional Titanium Dioxide Nanomaterials: Nanotubes. Chem. Rev. 2014, 114, 9385–9454. [Google Scholar] [CrossRef]
  9. Smith, A.M.; Nie, S. Semiconductor Nanocrystals: Structure, Properties, and Band Gap Engineering. Acc. Chem. Res. 2010, 43, 190–200. [Google Scholar] [CrossRef]
  10. Selmi, W.; Hosni, N.; Ben Naceur, J.; Maghraoui-Meherzi, H.; Chtourou, R. Titanium Dioxide Thin Films for Environmental Applications. In Titanium Dioxide-Advances and Applications; Muhammad Ali, H., Ed.; IntechOpen: London, UK, 2022; ISBN 978-1-83969-475-2. [Google Scholar]
  11. Hadjoub, I.; Touam, T.; Chelouche, A.; Atoui, M.; Solard, J.; Chakaroun, M.; Fischer, A.; Boudrioua, A.; Peng, L.-H. Post-Deposition Annealing Effect on RF-Sputtered TiO2 Thin-Film Properties for Photonic Applications. Appl. Phys. A 2016, 122, 78. [Google Scholar] [CrossRef]
  12. Musil, J.; Baroch, P.; Vlček, J.; Nam, K.H.; Han, J.G. Reactive Magnetron Sputtering of Thin Films: Present Status and Trends. Thin Solid Films 2005, 475, 208–218. [Google Scholar] [CrossRef]
  13. Depla, D.; Mahieu, S.; Depla, D. Reactive Sputter Deposition; Springer Series in Materials Science; Springer: Berlin/Heidelberg, Germany, 2008; ISBN 978-3-540-76664-3. [Google Scholar]
  14. Liao, J.-Y.; He, J.-W.; Xu, H.; Kuang, D.-B.; Su, C.-Y. Effect of TiO2 Morphology on Photovoltaic Performance of Dye-Sensitized Solar Cells: Nanoparticles, Nanofibers, Hierarchical Spheres and Ellipsoid Spheres. J. Mater. Chem. 2012, 22, 7910. [Google Scholar] [CrossRef]
  15. Johansson, W.; Peralta, A.; Jonson, B.; Anand, S.; Österlund, L.; Karlsson, S. Transparent TiO2 and ZnO Thin Films on Glass for UV Protection of PV Modules. Front. Mater. 2019, 6, 259. [Google Scholar] [CrossRef]
  16. Verbruggen, S.W. TiO2 Photocatalysis for the Degradation of Pollutants in Gas Phase: From Morphological Design to Plasmonic Enhancement. J. Photochem. Photobiol. C Photochem. Rev. 2015, 24, 64–82. [Google Scholar] [CrossRef]
  17. Gu, B.; Zhang, L.; Van Dingenen, R.; Vieno, M.; Van Grinsven, H.J.; Zhang, X.; Zhang, S.; Chen, Y.; Wang, S.; Ren, C.; et al. Abating Ammonia Is More Cost-Effective than Nitrogen Oxides for Mitigating PM2.5 Air Pollution. Science 2021, 374, 758–762. [Google Scholar] [CrossRef]
  18. Wu, H.; Ma, J.; Li, Y.; Zhang, C.; He, H. Photocatalytic Oxidation of Gaseous Ammonia over Fluorinated TiO2 with Exposed (001) Facets. Appl. Catal. B Environ. 2014, 152–153, 82–87. [Google Scholar] [CrossRef]
  19. Sopyan, I. Kinetic Analysis on Photocatalytic Degradation of Gaseous Acetaldehyde, Ammonia and Hydrogen Sulfide on Nanosized Porous TiO2 Films. Sci. Technol. Adv. Mater. 2007, 8, 33–39. [Google Scholar] [CrossRef]
  20. Čižmar, T.; Grčić, I.; Bohač, M.; Razum, M.; Pavić, L.; Gajović, A. Dual Use of Copper-Modified TiO2 Nanotube Arrays as Material for Photocatalytic NH3 Degradation and Relative Humidity Sensing. Coatings 2021, 11, 1500. [Google Scholar] [CrossRef]
  21. Yuzawa, H.; Mori, T.; Itoh, H.; Yoshida, H. Reaction Mechanism of Ammonia Decomposition to Nitrogen and Hydrogen over Metal Loaded Titanium Oxide Photocatalyst. J. Phys. Chem. C 2012, 116, 4126–4136. [Google Scholar] [CrossRef]
  22. Grčić, I.; Marčec, J.; Radetić, L.; Radovan, A.-M.; Melnjak, I.; Jajčinović, I.; Brnardić, I. Ammonia and Methane Oxidation on TiO2 Supported on Glass Fiber Mesh under Artificial Solar Irradiation. Environ. Sci. Pollut. Res. 2021, 28, 18354–18367. [Google Scholar] [CrossRef]
  23. Rebuffi, L.; Plaisier, J.R.; Abdellatief, M.; Lausi, A.; Scardi, P. MCX: A Synchrotron Radiation Beamline for X-Ray Diffraction Line Profile Analysis: MCX: A Synchrotron Radiation Beamline. Z. Anorg. Allg. Chem. 2014, 640, 3100–3106. [Google Scholar] [CrossRef]
  24. Gracin, D.; Sancho-Paramon, J.; Juraić, K.; Gajović, A.; Čeh, M. Analysis of Amorphous-Nano-Crystalline Multilayer Structures by Optical, Photo-Deflection and Photo-Current Spectroscopy. Micron 2009, 40, 56–60. [Google Scholar] [CrossRef] [PubMed]
  25. Yu, P.Y.; Cardona, M. Fundamentals of Semiconductors: Physics and Materials Properties, 2nd ed.; Springer: Berlin/Heidelberg, Germany; New York, NY, USA, 1999; ISBN 978-3-540-65352-3. [Google Scholar]
  26. Tauc, J.; Grigorovici, R.; Vancu, A. Optical Properties and Electronic Structure of Amorphous Germanium. Phys. Status Solidi B 1966, 15, 627–637. [Google Scholar] [CrossRef]
  27. Kramida, A.; Ralchenko, Y. NIST Standard Reference Database 78; NIST Atomic Spectra Database: Gaithersburg, MD, USA, 1999.
  28. Ohsaka, T.; Izumi, F.; Fujiki, Y. Raman Spectrum of Anatase, TiO2. J. Raman Spectrosc. 1978, 7, 321–324. [Google Scholar] [CrossRef]
  29. Ottermann, C.; Otto, J.; Jeschkowski, U.; Anderson, O.; Heming, M.; Bange, K. Stress of TiO2 Thin Films Produced by Different Deposition Techniques. MRS Proc. 1993, 308, 69. [Google Scholar] [CrossRef]
  30. Cullity, B.D.; Stock, S.R. Elements of X-ray Diffraction, 3rd ed.; Prentice Hall: Upper Saddle River, NJ, USA, 2001; ISBN 978-0-201-61091-8. [Google Scholar]
  31. Dehghani, Z.; Shadrokh, Z.; Nadafan, M. The Effect of Magnetic Metal Doping on the Structural and the Third-Order Nonlinear Optical Properties of ZnS Nanoparticles. Optik 2017, 131, 925–931. [Google Scholar] [CrossRef]
  32. Singh, A.K.; Singh, R. Effect of Different UV Cut off Wavelength of EVA Encapsulant on Cr-Si PV Module’s Performance & Reliability. In Proceedings of the 32nd European Photovoltaic Solar Energy Conference and Exhibition, Munich, Germany, 20–24 June 2016; pp. 1823–1825. [Google Scholar] [CrossRef]
  33. Coto, M.; Troughton, S.C.; Knight, P.; Joshi, R.; Francis, R.; Kumar, R.V.; Clyne, T.W. Optimization of the Microstructure of TiO2 Photocatalytic Surfaces Created by Plasma Electrolytic Oxidation of Titanium Substrates. Surf. Coat. Technol. 2021, 411, 127000. [Google Scholar] [CrossRef]
Figure 1. Average deposition rate during TiO2 thin film deposition as a function of O2/Ar flow rate ratio. Red symbols represent experimentally obtained data and blue line linear least square trend line.
Sustainability 14 10970 g001
Figure 2. OES spectra of DC plasma discharge during TiO2 thin films deposition by reactive magnetron sputtering as a function of O2/Ar ratio. Discharge power and pressure were kept constant (100 W, 0.67 × 10⁻³ mbar).
Sustainability 14 10970 g002
Figure 3. OES spectra in wavelength range close to O2 maximum (777 nm) taken from Figure 2. O2 and Ar emission lines used in O2/Ar flow rate ratio calculations are labelled.
Sustainability 14 10970 g003
Figure 4. Ratio of integrated intensity of oxygen (777 nm) and argon (772 nm) emission lines as a function of working gas O2/Ar flow ratio. Linear dependence is observed in whole tested O2/Ar flow rate ratio range for two different values of working gas pressure in magnetron vacuum chamber.
Sustainability 14 10970 g004
Figure 5. Raman spectra of TiO2 thin film samples as a function of working gas pressure p, and O2/Ar flow rate ratio and pressure 0.66 Pa. Positions of Raman active modes for anatase TiO2 are marked with vertical dashed lines.
Sustainability 14 10970 g005
Figure 6. GIXRD of TiO2 thin film samples as a function of working gas pressure and O2/Ar flow rate ratio during deposition. Positions of diffraction lines for anatase and rutile polymorph, taken from literature, are labelled by black dashed and grey dotted vertical lines respectively.
Sustainability 14 10970 g006
Figure 7. AFM image of the surface of a TiO2 sample (O2/Ar flow rate ratio = 0.50 and p = 0.67 Pa). The scan size is 10 × 10 μm.
Sustainability 14 10970 g007
Figure 8. Optical transmittance (full lines) and reflectance (dashed lines) of TiO2 thin film samples as a function of working gas pressure and O2/Ar flow rate ratio. The transmittance of EVA foil is added for comparison.
Sustainability 14 10970 g008
Figure 9. The spectral distribution of the absorption coefficient in UV wavelength range for TiO2 thin film samples as a function of working gas pressure and O2/Ar flow rate ratio.
Sustainability 14 10970 g009
Figure 10. Results of the photocatalytic experiment: normalised ammonia concentration in the outlet air stream after t/τ passes through as a function of TiO2 deposition parameters (working gas pressure and O2/Ar flow rate ratio).
Sustainability 14 10970 g010
Figure 11. Experimental (dots) vs. model data (lines) for ammonia degradation over different samples; obtained kinetic parameters are given in Table 2.
Sustainability 14 10970 g011
Table 1. Results of structural and optical analysis of TiO2 thin film obtained by RS, GIXRD, AFM and UV-Vis transmittance.
O2/Ar Flow Rate RatioO2/Ar
Pressure (Pa)
Raman
Eg Band Position
(cm−1)
GIXRD
DScherrer
(nm)
AFM
RMS Roughness
(nm)
UV-Vis
Optical Gap Eg
(eV)
0.050.67144.25 ± 0.054.32 ± 0.053.963.27 ± 0.01
0.200.67142.9 ± 0.14.44 ± 0.051.703.34 ± 0.01
0.500.67142.99 ± 0.093.87 ± 0.052.123.35 ± 0.02
0.051.33144.1 ± 0.14.71 ± 0.054.663.32 ± 0.02
0.201.33142.5 ± 0.14.60 ± 0.054.363.36 ± 0.02
0.501.33142.5 ± 0.1-2.803.36 ± 0.02
Table 2. Results of ammonia photodegradation kinetic analysis using a model for steady state PFR and zero-order kinetics. αUVB and αUVA are mean values of the absorption coefficient in UVA (315–400 nm) and UVB range (280–315 nm).
O2/Ar Ratiop (Pa)kz
(ppm s−1)
αUVB
(105 cm−1)
αUVA
(105 cm−1)
kintrinsic
10−9 ppm cm2.5 mW−0.5 s−1
0.050.670.002206.3331.1243.63
0.200.670.002254.3160.7055.51
0.500.670.002103.8780.4575.94
0.051.330.002813.9930.7067.35
0.201.330.002773.4080.4368.83
0.501.330.002213.3640.4607.09
Publisher’s Note: MDPI stays neutral with regard to jurisdictional claims in published maps and institutional affiliations.

