Article

Photoelectrochemical Water Splitting and H2 Generation Enhancement Using an Effective Surface Modification of W-Doped TiO2 Nanotubes (WT) with Co-Deposition of Transition Metal Ions

1
Department of Chemistry, Isfahan University of Technology, Isfahan 84156-83111, Iran
2
Department of Chemistry, Bu-Ali Sina University, Hamedan 65167-38695, Iran
3
Ruđer Bošković Institute, Bijenička Cesta 54, 10000 Zagreb, Croatia
*
Authors to whom correspondence should be addressed.
Sustainability 2022, 14(20), 13251; https://doi.org/10.3390/su142013251
Submission received: 12 September 2022 / Revised: 2 October 2022 / Accepted: 12 October 2022 / Published: 14 October 2022
(This article belongs to the Special Issue Sustainable Photocatalytic Water Treatment and Energy Production)

Abstract

:
W-doped TiO2 nanotube arrays (WT) were fabricated by in situ electrochemical anodization of titanium substrate. The results of the influence of different photo-deposited transition ions (CrxFe1−x, 0 ≤ x ≤ 1) on the surface of WT on photoelectrochemical (PEC) water splitting and H2 generation are presented. The crystallinities, structural, elemental, and absorption analysis were conducted by XRD, SEM, RAMAN, EDX, and UV–Vis absorption spectroscopy, which demonstrated anatase as the main crystalline phase of TiO2, and the existence of CrxFe1−x (nano)particles/film deposited on the surface of WT. The SEM images revealed that the deposition rate and morphology are highly related to the ratio of Cr and Fe ions. Under visible light illumination, the entire photoelectrodes showed a very good response to light with stable photocurrent density. PEC measurements revealed that the mixture of transition ions with a certain ratio of ions (Cr0.8Fe0.2–T) led to enhanced photocurrent density more than that of other modifiers due to decreasing charge recombination as well as improving the charge transfer. Moreover, PEC water splitting was conducted in an alkaline solution and the Cr0.8Fe0.2–T photoelectrode generated 0.85 mL cm−2 h−1 H2, which is over two times that of pristine WT.

1. Introduction

Hydrogen (H2) as renewable energy has attracted significant attention to be the best replacement for fossil fuels to move toward a decarbonized future owing to unique properties such as high efficiency and energy density (120–142 MJ/kg), the ability to obtain from H2O and generate only H2O with its combustion [1,2]. Photoelectrochemical (PEC) water splitting using sunlight is the most promising strategy to generate hydrogen. Early work on TiO2 for water splitting and PEC H2 generation was reported by Fujishima and Honda in 1972 [3]. Since then, extensive efforts have been invested in exploring and introducing new materials such as WO3, MnOx, Bismuth-based nanomaterials, and Fe2O3 [4,5,6,7]. Although a large number of semiconductors have been inspected over the past few decades, TiO2 is still particularly appealing because of suitable band-edge positions and relatively good stability in different electrolytes as well as photo-corrosion resistance [8,9]. The TiO2 nanotube (NTs) structures, as one-dimensional (1D) nanostructures, have been considered highly promising candidates with high efficiency in PEC water splitting because of high specific surface area, electron mobility, and mechanical strength [10,11]. However, pristine TiO2 is still suffering from the utilization of less than 5% of sunlight, thanks to its wide band gap (≥3.0 eV) [12] and its modification is necessary to improve photo-response in the visible range and enhance the efficiency of chemical solar energy conversion [13,14]. To achieve this, many efforts have been made such as composites with other metal oxide and/or carbon-based materials, metal or non-metal doping, and surface modification [13,15,16,17]. For example, composite with other semiconductors such as WO3 applied in this work, not only enhances the visible light absorption but also increases the photo-generated charge (e/h+) separation [18]. Another simple and effective technique is through the TiO2 NTs surface modification, especially with the transition metals. Transition metals can improve PEC activities of TiO2 NTs through (i) decreasing the band gap by introducing new sub-levels because of partially filled D-orbitals, and (ii) decreasing charge recombination by trapping photo-generated charge (e/h+) of TiO2 [9,19,20]. Suligoj et al. have recently reported that deposited transition metal ion clusters on the TiO2, via surface modification, can also act as co-catalysts and improve the photocatalytic activity of TiO2 [21].
There are several methods to deposit transition metal (oxide) particles on the surface of TiO2 NTs such as sputtering, chemical bath deposition, electrodeposition, and photo-deposition [13,21,22,23,24,25]. Among these, photo-deposition is one of the easiest methods that does not need an elevated temperature or applied (bias) potential. Moreover, adjusting some parameters in this method (metal precursor, pH, sacrificial reagent, time of deposition, etc.), gives the possibility to control the size and geometrical distribution, and oxidation state of the deposited (nano)particles [15,22,26].
In this work, self-organized WO3 doped TiO2 NTs (WT) were successfully fabricated through an optimized in situ electrochemical anodization of titanium substrate according to our previous studies [13]. Then, Fe and Cr ions were chosen for the WT surface modification via the photo-deposition method. Different mixtures of them, CrxFe1-x (0 ≤ x ≤ 1), were also prepared for photo-deposition to clarify the effects of different ratios of two transition metal ions. The CrxFe1-x–T (0 ≤ x ≤ 1) abbreviation has been used throughout the manuscript; x stands for the molar ratio of Cr and Fe ions used in the photo-deposition precursor for the WT surface modification. CrxFe1−x–T (0 ≤ x ≤ 1) photoelectrodes were submitted for thorough material characterization, electrochemical and semiconducting properties, and the activity in PEC water splitting for H2 evolution.

2. Materials and Methods

2.1. Materials

Titanium foils (Ti, 99%) with 1 mm thickness, sodium tungstate dihydrate (Na2WO4 × 2 H2O, 99%), hydrogen fluoride (HF, 40%), nitric acid (HNO3, 65%), dimethyl sulfoxide (C2H6SO, 99.5%), ethanol (C2H6O, 99%), potassium hydroxide (KOH, 499%), ethylene glycol (C2H6O2, 99.5%), potassium chromate (K2CrO4, 99.5%), and iron (III) chloride hexahydrate (FeCl3 × 6 H2O, 99%) were purchased from commercial sources and were used as purchased and without further purification. Solutions were prepared using deionized (DI) water within this work.

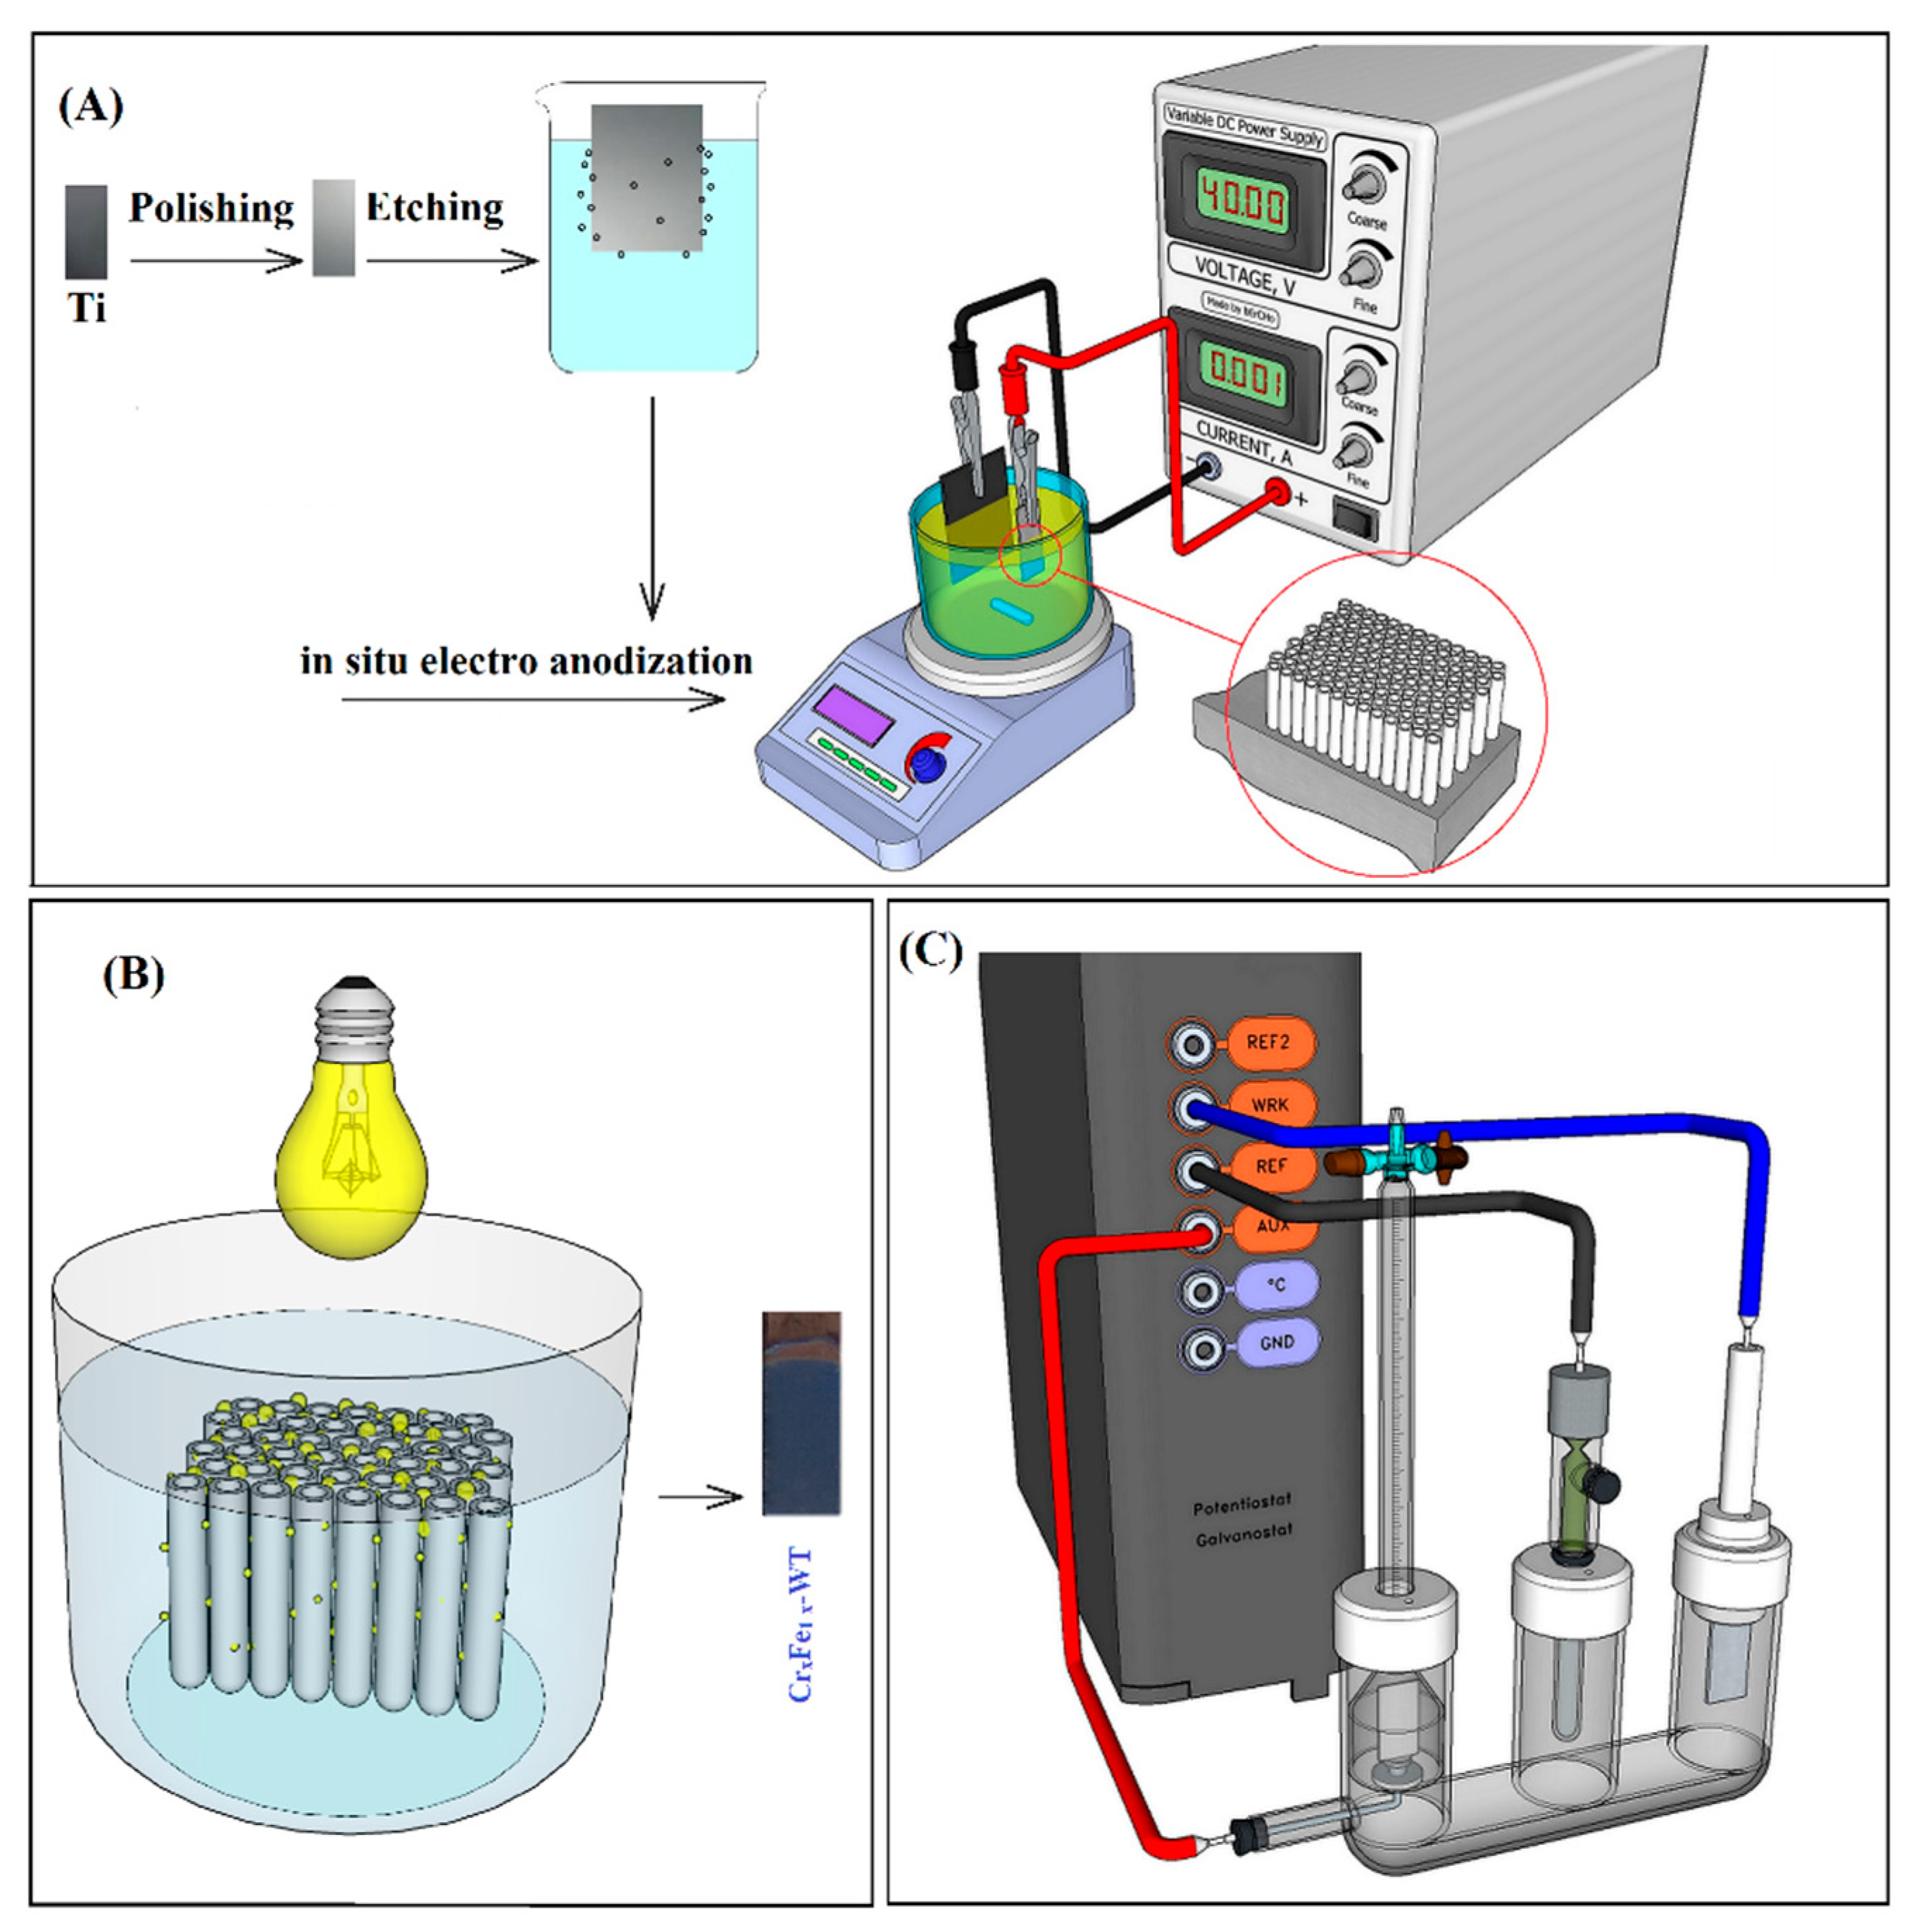
2.2. In Situ Electrochemical Anodization Procedure

The TiO2 NTs were prepared by in situ electrochemical anodization with the two-electrode system including Ti foil and platinum-coated titanium mesh electrodes as anode and cathode electrodes, respectively. Prior to anodization, the surface of Ti sheets (1 × 3 cm2) was polished with different emery types of abrasive papers and then cleaned by rinsing with DI water. Afterward, Ti sheets were chemically etched with a mixture of HF:HNO3:H2O in a volume ratio of 1:4:5 for 30 s at room temperature and then washed with DI water. In situ electrochemical anodization was performed at 40 V for 8 h in a solution of dimethyl sulfoxide as an electrolyte containing 12 mM of sodium tungstate dihydrate, HF (2 vol%), and H2O (1 vol%). Finally, as-anodized amorphous W-doped TiO2 nanotubes were annealed at 400 °C in air for 2 h, with a heating rate of 2 °C min−1 (F3L-1720, AZAR Furnaces, Tehran, Iran) (Figure 1A).

2.3. Photo-Deposition Procedure

Surface modification of WT with CrxFe1−x (0 ≤ x ≤ 1) was accomplished using the photo-deposition method. Briefly, the WT electrodes were soaked in 25 mL precursor of K2CrO4 (10 mM), or FeCl3 × 6H2O (10 mM), and different molar ratio of Fe and Cr as CrxFe1-x, (x = 0, 0.2, 0.4, 0.5, 0.6, 0.8, and 1), containing ethanol (10 vol%). Photo-deposition was performed by illuminating the solution in which WT electrodes were immersed with a high-pressure mercury lamp (400 W) for 1 h. After the photo-deposition, photoelectrodes were washed with DI water (Figure 1B). Accordingly, obtained photoelectrodes are denoted onward throughout the manuscript as CrxFe1−x–T (x = 0, 0.2, 0.4, 0.5, 0.6, 0.8, and 1), corresponding to the used molar ratio of Fe and Cr in the photo-deposition precursor.

2.4. Material Characterization

A Philips XL30 (Eindhoven, The Netherlands) field-emission scanning electron microscope equipped with an energy dispersive X-ray (EDX) mapping port was used to characterize the morphology and the elemental distribution of the microscopic region of the materials. X-ray diffraction using a PMD Philips X-Pert (Panalytical, Almelo, The Netherlands) was used for crystal structure characterization. The Raman spectra of the samples were obtained with a TakRam N1-541 (Tehran, Iran) Raman spectrometer. Moreover, the UV–vis absorption spectra were measured by a JASCO V-570 (Tokyo, Japan) UV–vis spectrophotometer.

2.5. Photoelectrochemical (PEC) Characterization and PEC Water Splitting

PEC measurements were carried out in KOH (1 M, pH = 13.9) solution containing ethylene glycol (5 vol%) with a potentiostat/galvanostat OGF 500 (Origsflex, Lyon, France). Linear sweep voltammetry (LSV), chronoamperometry (CA), and open circuit potential (OCP) measurements were conducted in a standard three-electrode configuration including as-prepared CrxFe1−x–WT photoelectrodes, Ag/AgCl electrode, and platinum foil as working electrode, reference electrode, and counter electrode, respectively (Figure 1C). All of these electrochemical tests were carried out in the presence, absence, and chopped light. The photoelectrodes were illuminated by a 35 W Xenon (Xe) lamp (200 mW cm−2) equipped with a UV cut-off filter (λ ˃ 420 nm). The potential of the photoelectrodes was reported versus (vs.) the reversible hydrogen electrode (RHE) using Equation (1):
E RHE = 0.1976   V + 0.059   pH +   E Ag / AgCl
The electrochemical impedance spectra (EIS) were also performed on the electrochemical workstation system Zahner Zenium Pro (Zahner-Elektrik, Kronach, Germany) in a range of 100 kHz−100 mHz under 1.22 V vs. RHE and a DC voltage of 10 mV amplitude in the dark and under illumination in the same electrolyte used in PEC measurements.
The same three-electrode configuration was used for PEC water splitting (Figure 1C). CrxFe1−x–WT photoelectrodes were placed in the anodic chamber while immersed in KOH (1 M, pH = 13.9) solution containing ethylene glycol (5 vol%) and irradiated by Xe lamp (200 mW cm−2, and λ ˃ 420 nm). A platinum-coated titanium mesh electrode as the cathode was inserted into an inverted burette, where H2 was collected [27,28,29]. PEC water splitting was continued by applying a constant external potential of 1.23 V vs. RHE. The volume of the produced hydrogen gas was quantitatively measured via electrolyte displacement level in the inverted burette at predefined time (Figure 1C).

3. Results and Discussion

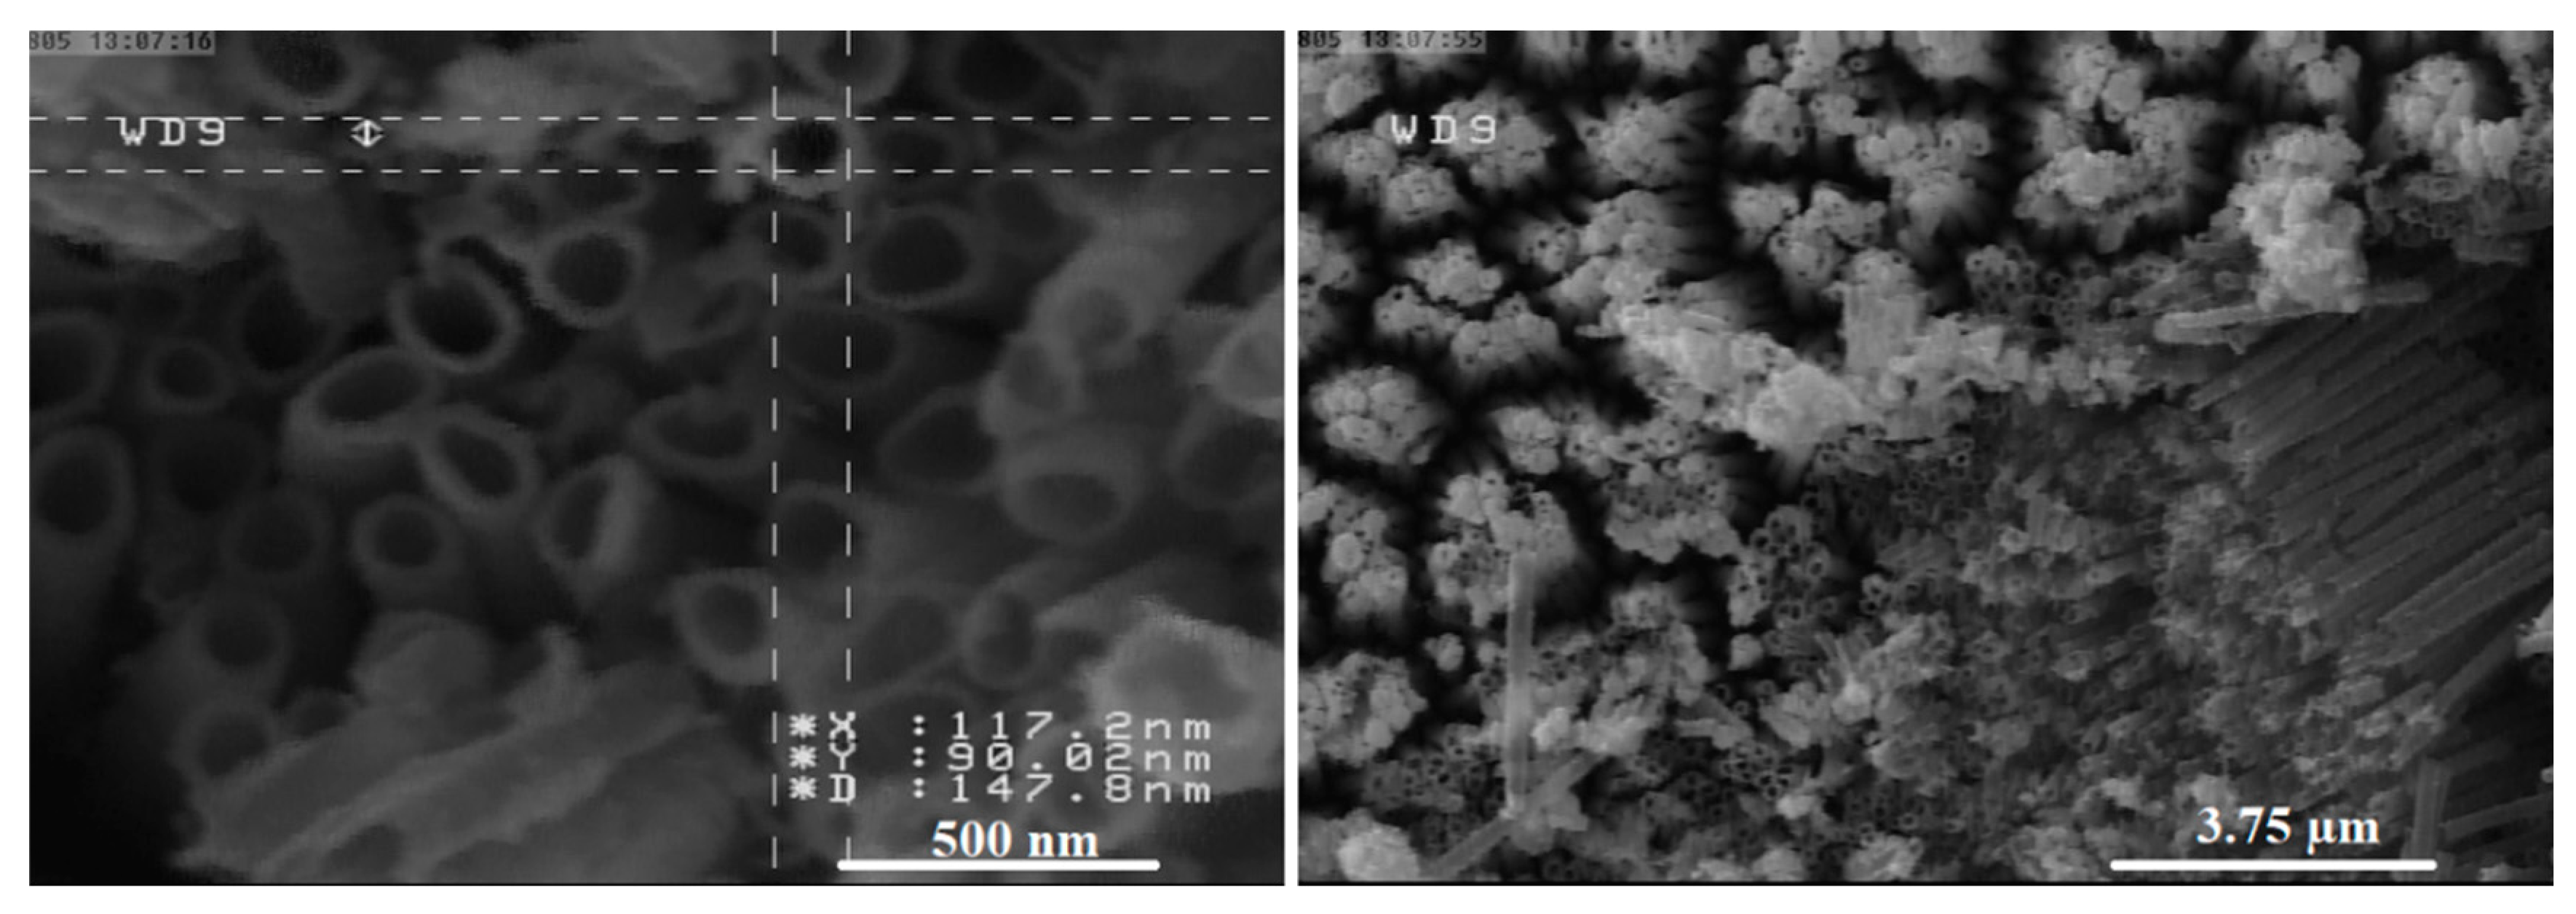
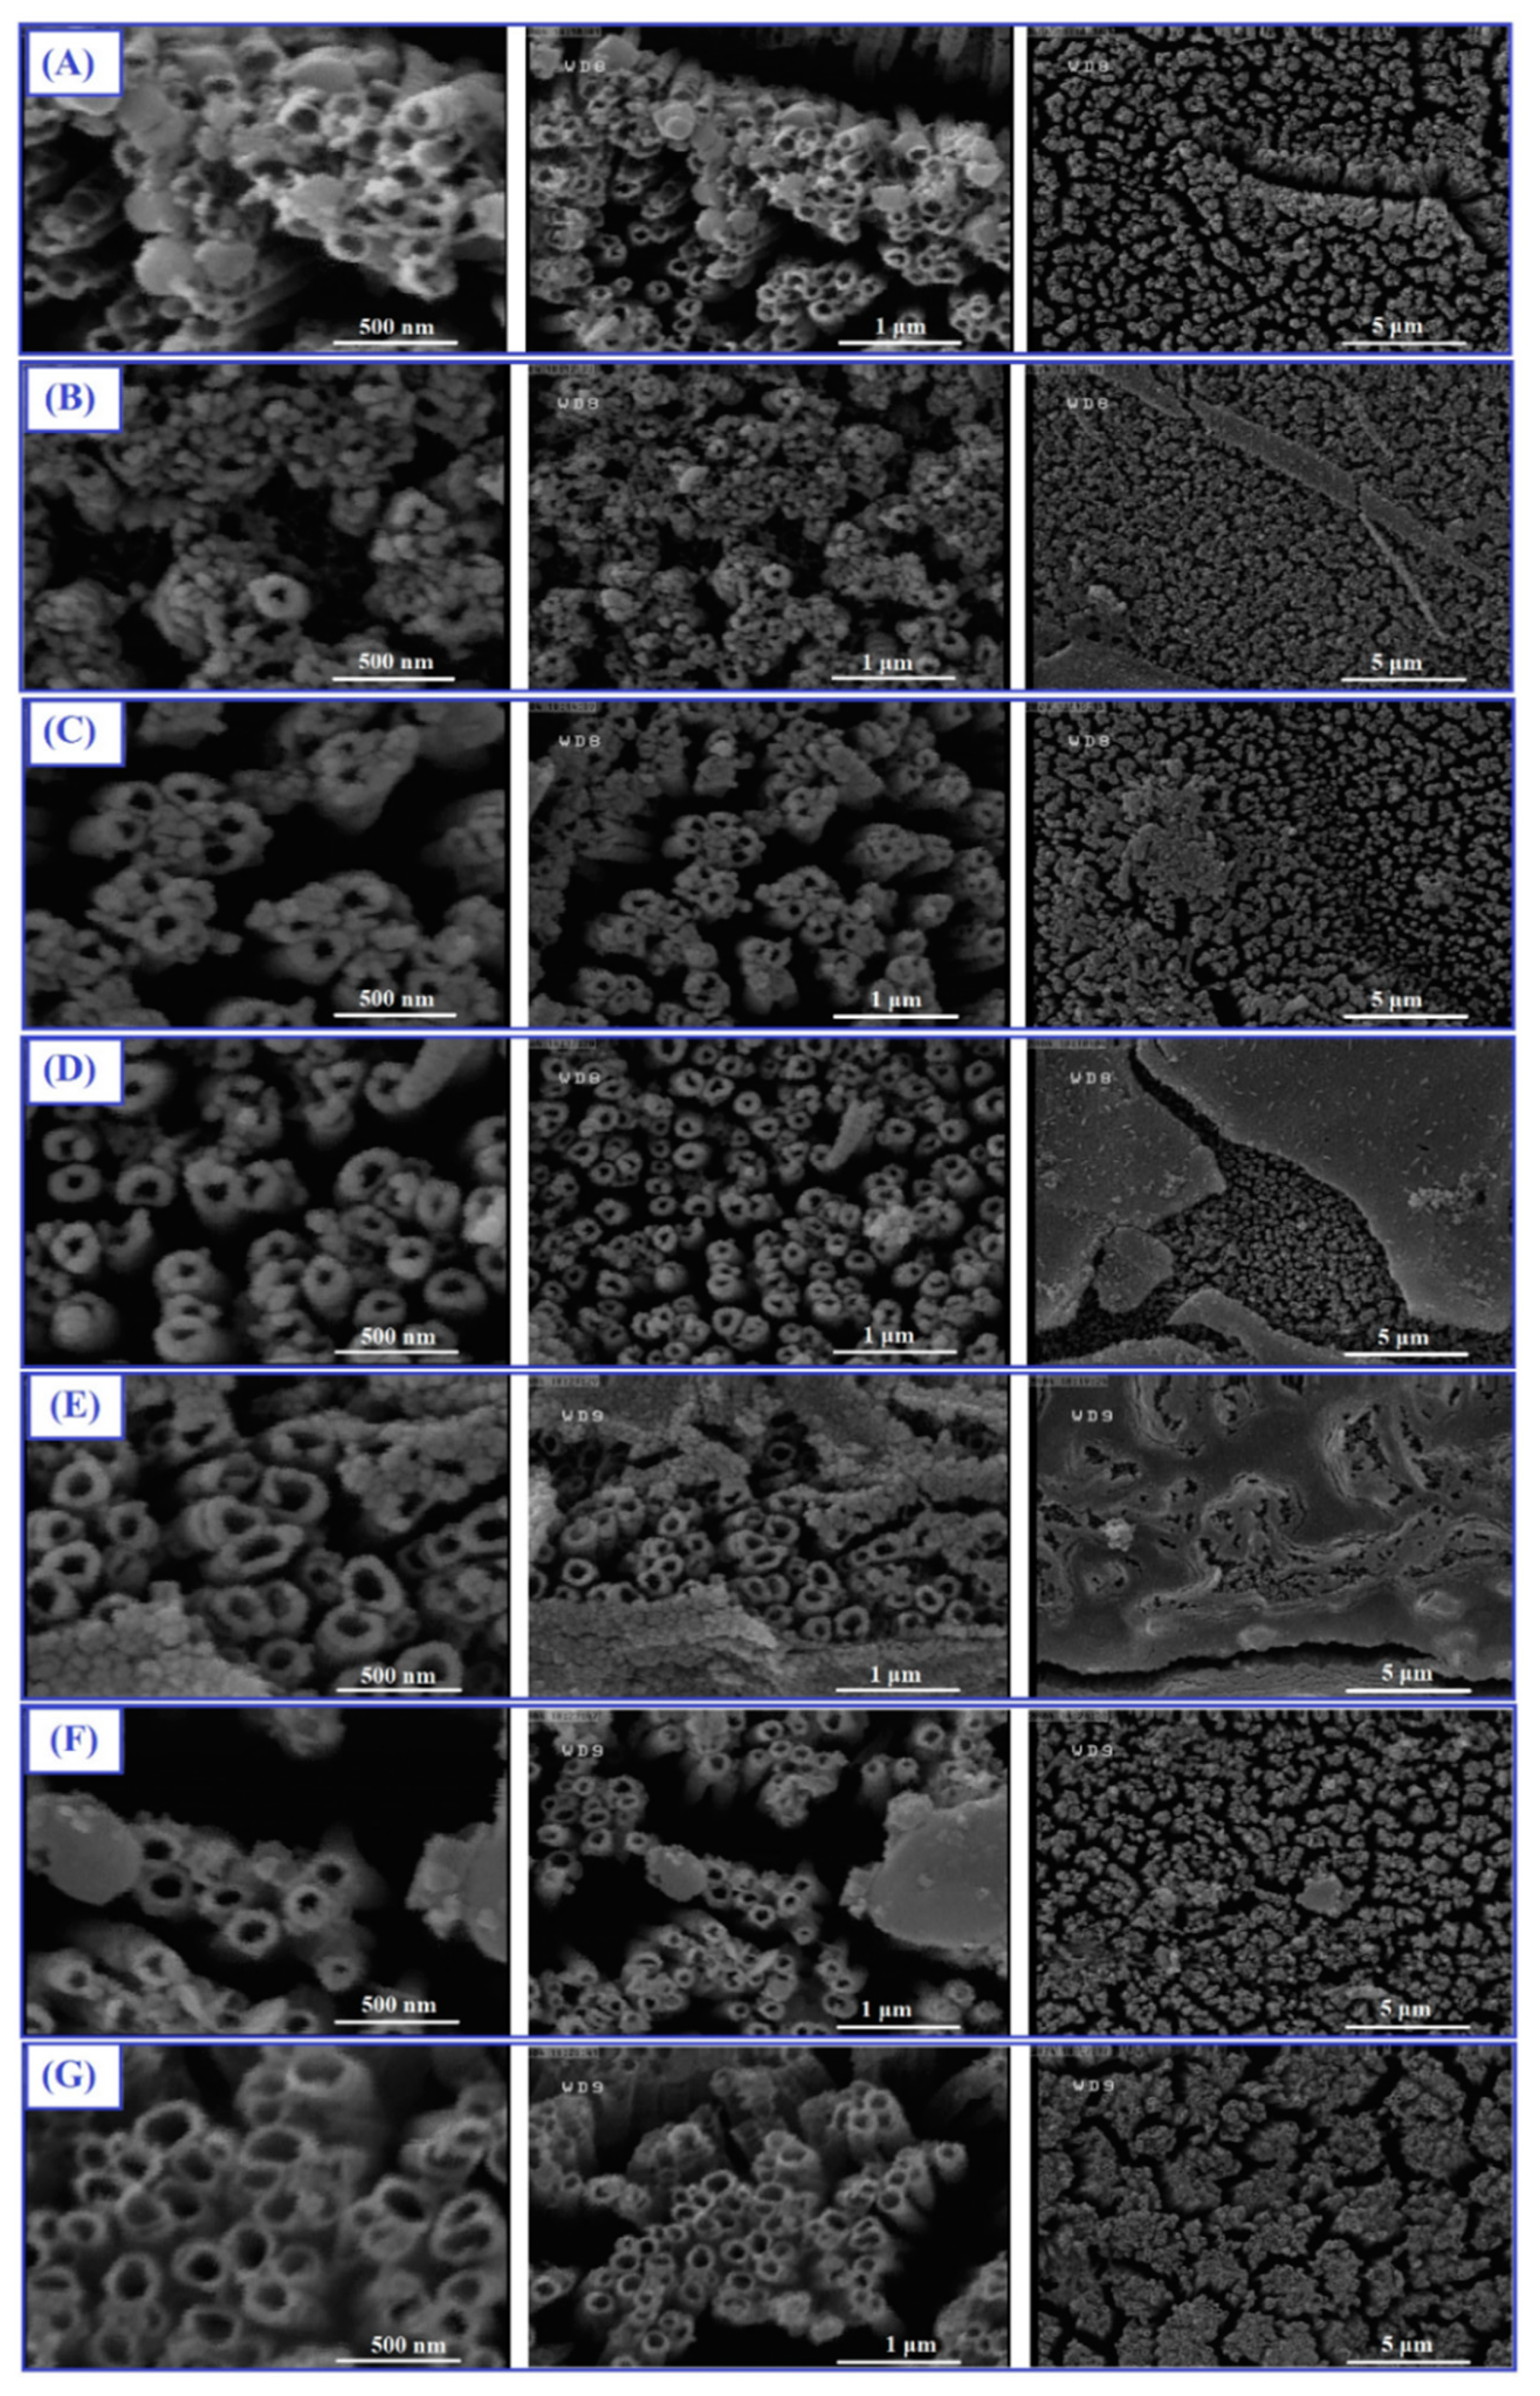
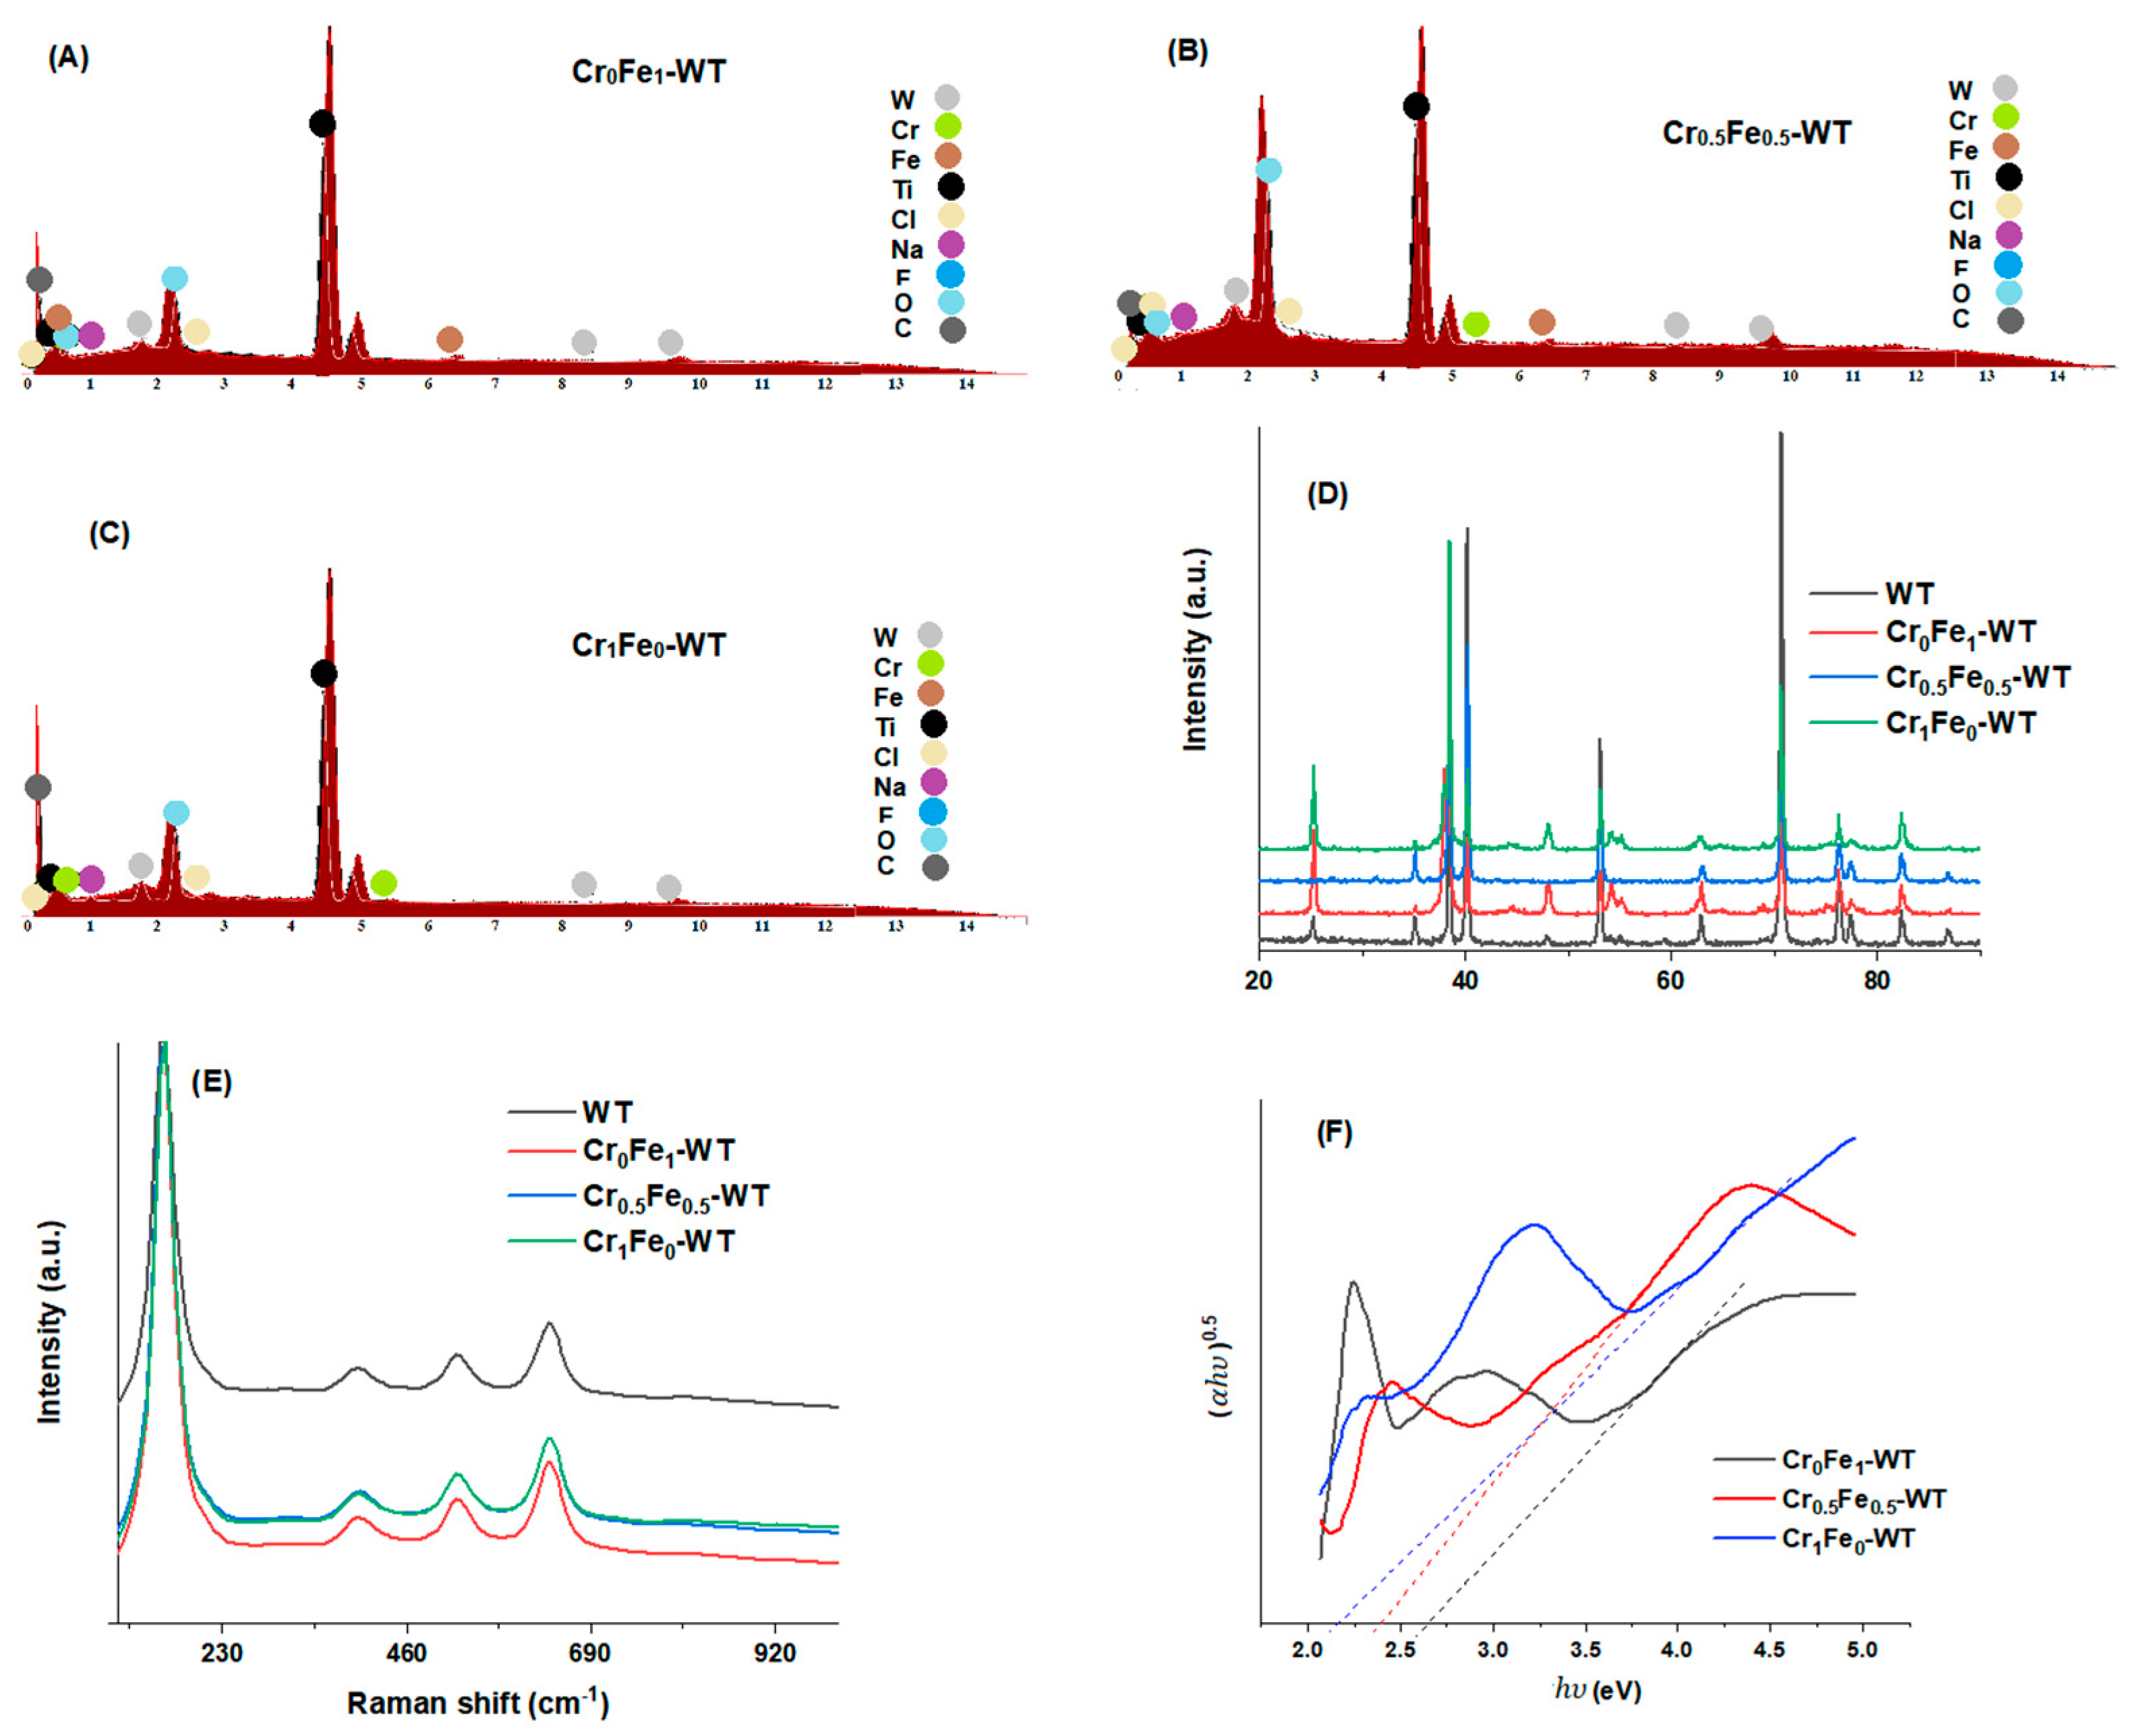
3.1. Material Characterization

Our previous results revealed that highly ordered WT was fabricated through in situ electrochemical anodization of Ti foil in an electrolyte containing Na2WO4. Although, the concentration of Na2WO4 did not show a significant influence on WT morphology. However, the PEC activity of fabricated WT can change and the maximum PEC activity for WT was obtained using ~12 mM of Na2WO4 as an optimum concentration [13,30]. Hence, in this work, WT photoelectrode was fabricated according to the optimal conditions established in our previous studies [13,30].
The surface morphology of pristine WT nanotubes can be seen in Figure 2. Uniform and highly ordered nanotubes were observed with an average inner diameter and wall thickness of about 110 nm and 25 nm, respectively. The surface modification of WTs was then performed with the photo-deposition of CrxFe1−x (0 ≤ x ≤ 1) and their SEM images have been compared in Figure 3. In the case of Cr0Fe1–WT, the precursor of photo-deposition only consisted of Fe ions, particles with sizes of ≤200 nm × 200 nm were observed on the WT surface (Figure 3A). Although particles are fairly homogeneously distributed over the WT surface, some of them covered the top of the nanotubes (Figure 3A) which might decrease PEC activity.
Interesting effects can be observed regarding the different ratios of Fe and Cr ions in the photo-deposition precursor (0.2 ≤ x ≤ 0.8, Figure 3B–F), particularly when comparing with Figure 3A,G which correspond to using single metal ions, Cr0Fe1–WT and Cr1Fe0–WT, respectively. Remarkably, with the introduction of a low ratio of Cr ions in the photo-deposition precursor, in the case of Cr0.2Fe0.8–WT and Cr0.4Fe0.6–WT, smaller rounded nanoparticles (diameter ≤ 25 nm) were deposited onto the edge of the WT nanotubes (Figure 3B,C). However, with a more increasing Cr ratio, e.g., Cr0.5Fe0.5–WT, a well-decorated amorphous composite of Cr and Fe as a uniform film on the top of WT was observed (Figure 3D). In the case of Cr0.6Fe0.2–WT, a similar coated film is noticeable with an agglomeration of nanoparticles on the top of the film (Figure 3E). In the case of Cr0.8Fe0.2–WT, there is no trace of the above-mentioned film covering the WT surface. Nanoparticles are homogeneously deposited on the WT surface and few partial agglomerations are observed on the WT surface (Figure 3F). It can be stated that the Fe photo-deposition rate is higher than that of Cr (comparing Figure 3A,G) since, in the case of Cr1Fe0–WT, fewer and smaller nanoparticles can be seen all over the edge of open-top WT nanotubes.
The elemental EDS and EDS-mapping images were provided in Figure 4A–C and Figures S1 and S2 (Supplementary Materials), revealing the presence of Ti and O elements, as well as W, Fe, and Cr which confirmed the successfully fabricated CrxFe1−x–WT photoelectrodes. It can be clearly seen that the Fe and Cr were homogeneously distributed on the surface of WT, as demonstrated by the elemental mapping (Figures S1 and S2 (Supplementary Materials)). The amount of Fe and Cr deposited on the surface of WT, listed in Table S1, showed that Fe has a rather higher photo-deposition rate than that of Cr; comparing the Cr0Fe1–WT and Cr1Fe0–WT. This result can explain the SEM results where bigger and more agglomerations of Fe particles were obtained rather than that of Cr (Figure 3A,G).
The X-ray diffractograms of TiO2 NTs, WT, Cr0Fe1–WT, Cr0.5Fe0.5–WT, and Cr1Fe0–WT are shown in Figure 4D. Generally, similar XRD patterns were observed for all measured photoelectrodes but Cr0.5Fe0.5–WT. Diffraction peaks can be assigned to metallic Ti substrate and TiO2 at its anatase phase with evidence of the peaks at 2θ of 25.3°, 37.8°, 48.1°, 53.9°, and 70.3° which could be attributed to the (101), (004), (200), (105), and (220) planes of anatase, respectively (ICDD-JCPD: 01-086-1156). The crystalline phase of tungsten (W) was not detected by XRD in the samples which can be due to the incorporation of a low concentration of W into the TiO2 lattice since the radii of W+6 and Ti+4 are so close to each other as explained in our previous reports [13,31]. In the case of Fe0.5Cr0.5–WT as shown in the XRD pattern, the anatase peaks at 25.3° and 48.1° were not detected. That can be attributed to deposited amorphous Cr0.5Fe0.5 film which covered the top of the WT photoelectrode as mentioned in SEM results (Figure 3D). There is no sign of Fe or Cr crystalline phase in XRD patterns. However, this result does not exclude the possible deposited amorphous phase of CrxFe1−x at the surface of WT.
Raman was employed to further structural analysis of CrxFe1−x-WT photoelectrodes. The characteristic peaks observed at 159, 401, 520, and 637 cm−1 are consistent with those of anatase TiO2; corresponding to Eg, B1g, A1g, and Eg, respectively (Figure 4E). No crystalline phases related to other species were observed.
The optical properties of CrxFe1−x–WT photoelectrodes were also studied (Figure S3 (Supplementary Materials) and the band gaps of photoelectrodes have been estimated from the Tauc plot (Figure 4F and Figure S3). CrxFe1−x–WT (0 ≤ x ≤ 1) photoelectrodes exhibit better visible region absorption than that of pristine WT, especially in the case of using Cr ions for the WT surface modification. The estimated band gaps were found to be in the range of 2.16–2.65 eV after the photo-deposition of CrxFe1−x, (0 ≤ x ≤ 1)) on the WT surface (Table S2). As can be seen in Figure S3, in the case of Cr1Fe0–WT, a peak around 550 nm was observed that belongs to the presence of Cr on the surface of WT photoelectrodes. This kind of peak, λ > 500 nm, was also observed in other literature [26,32].

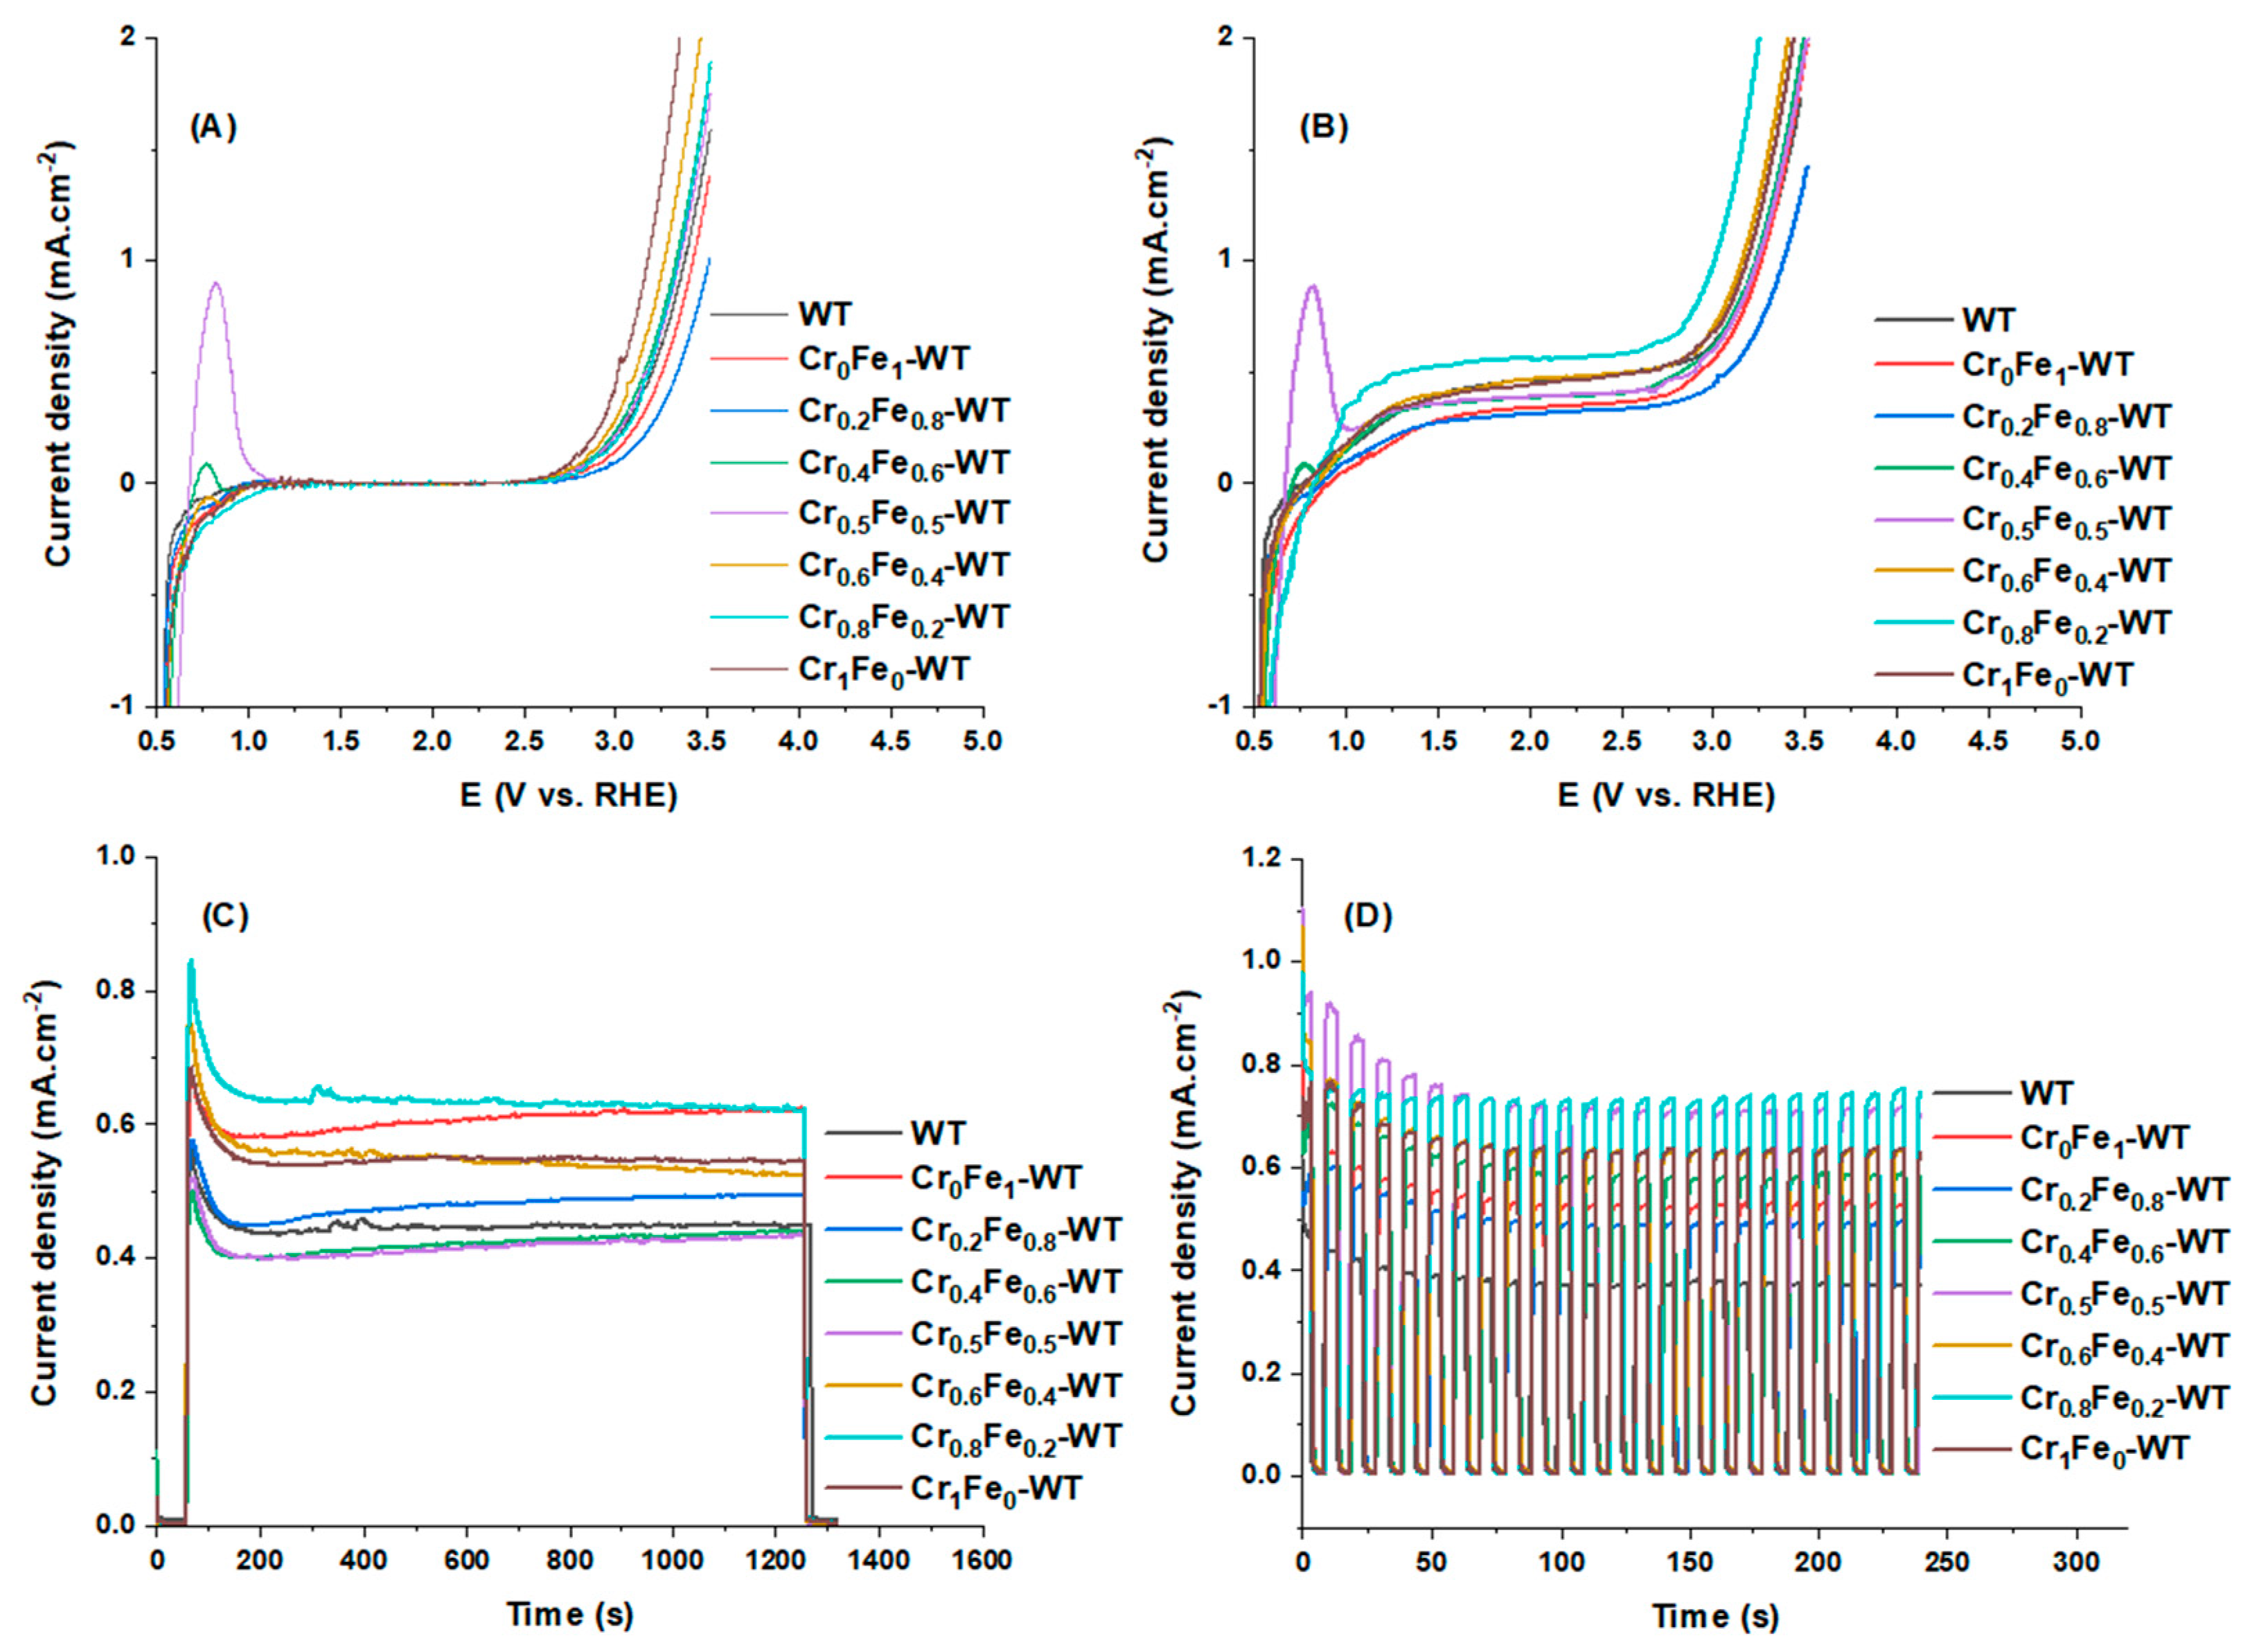
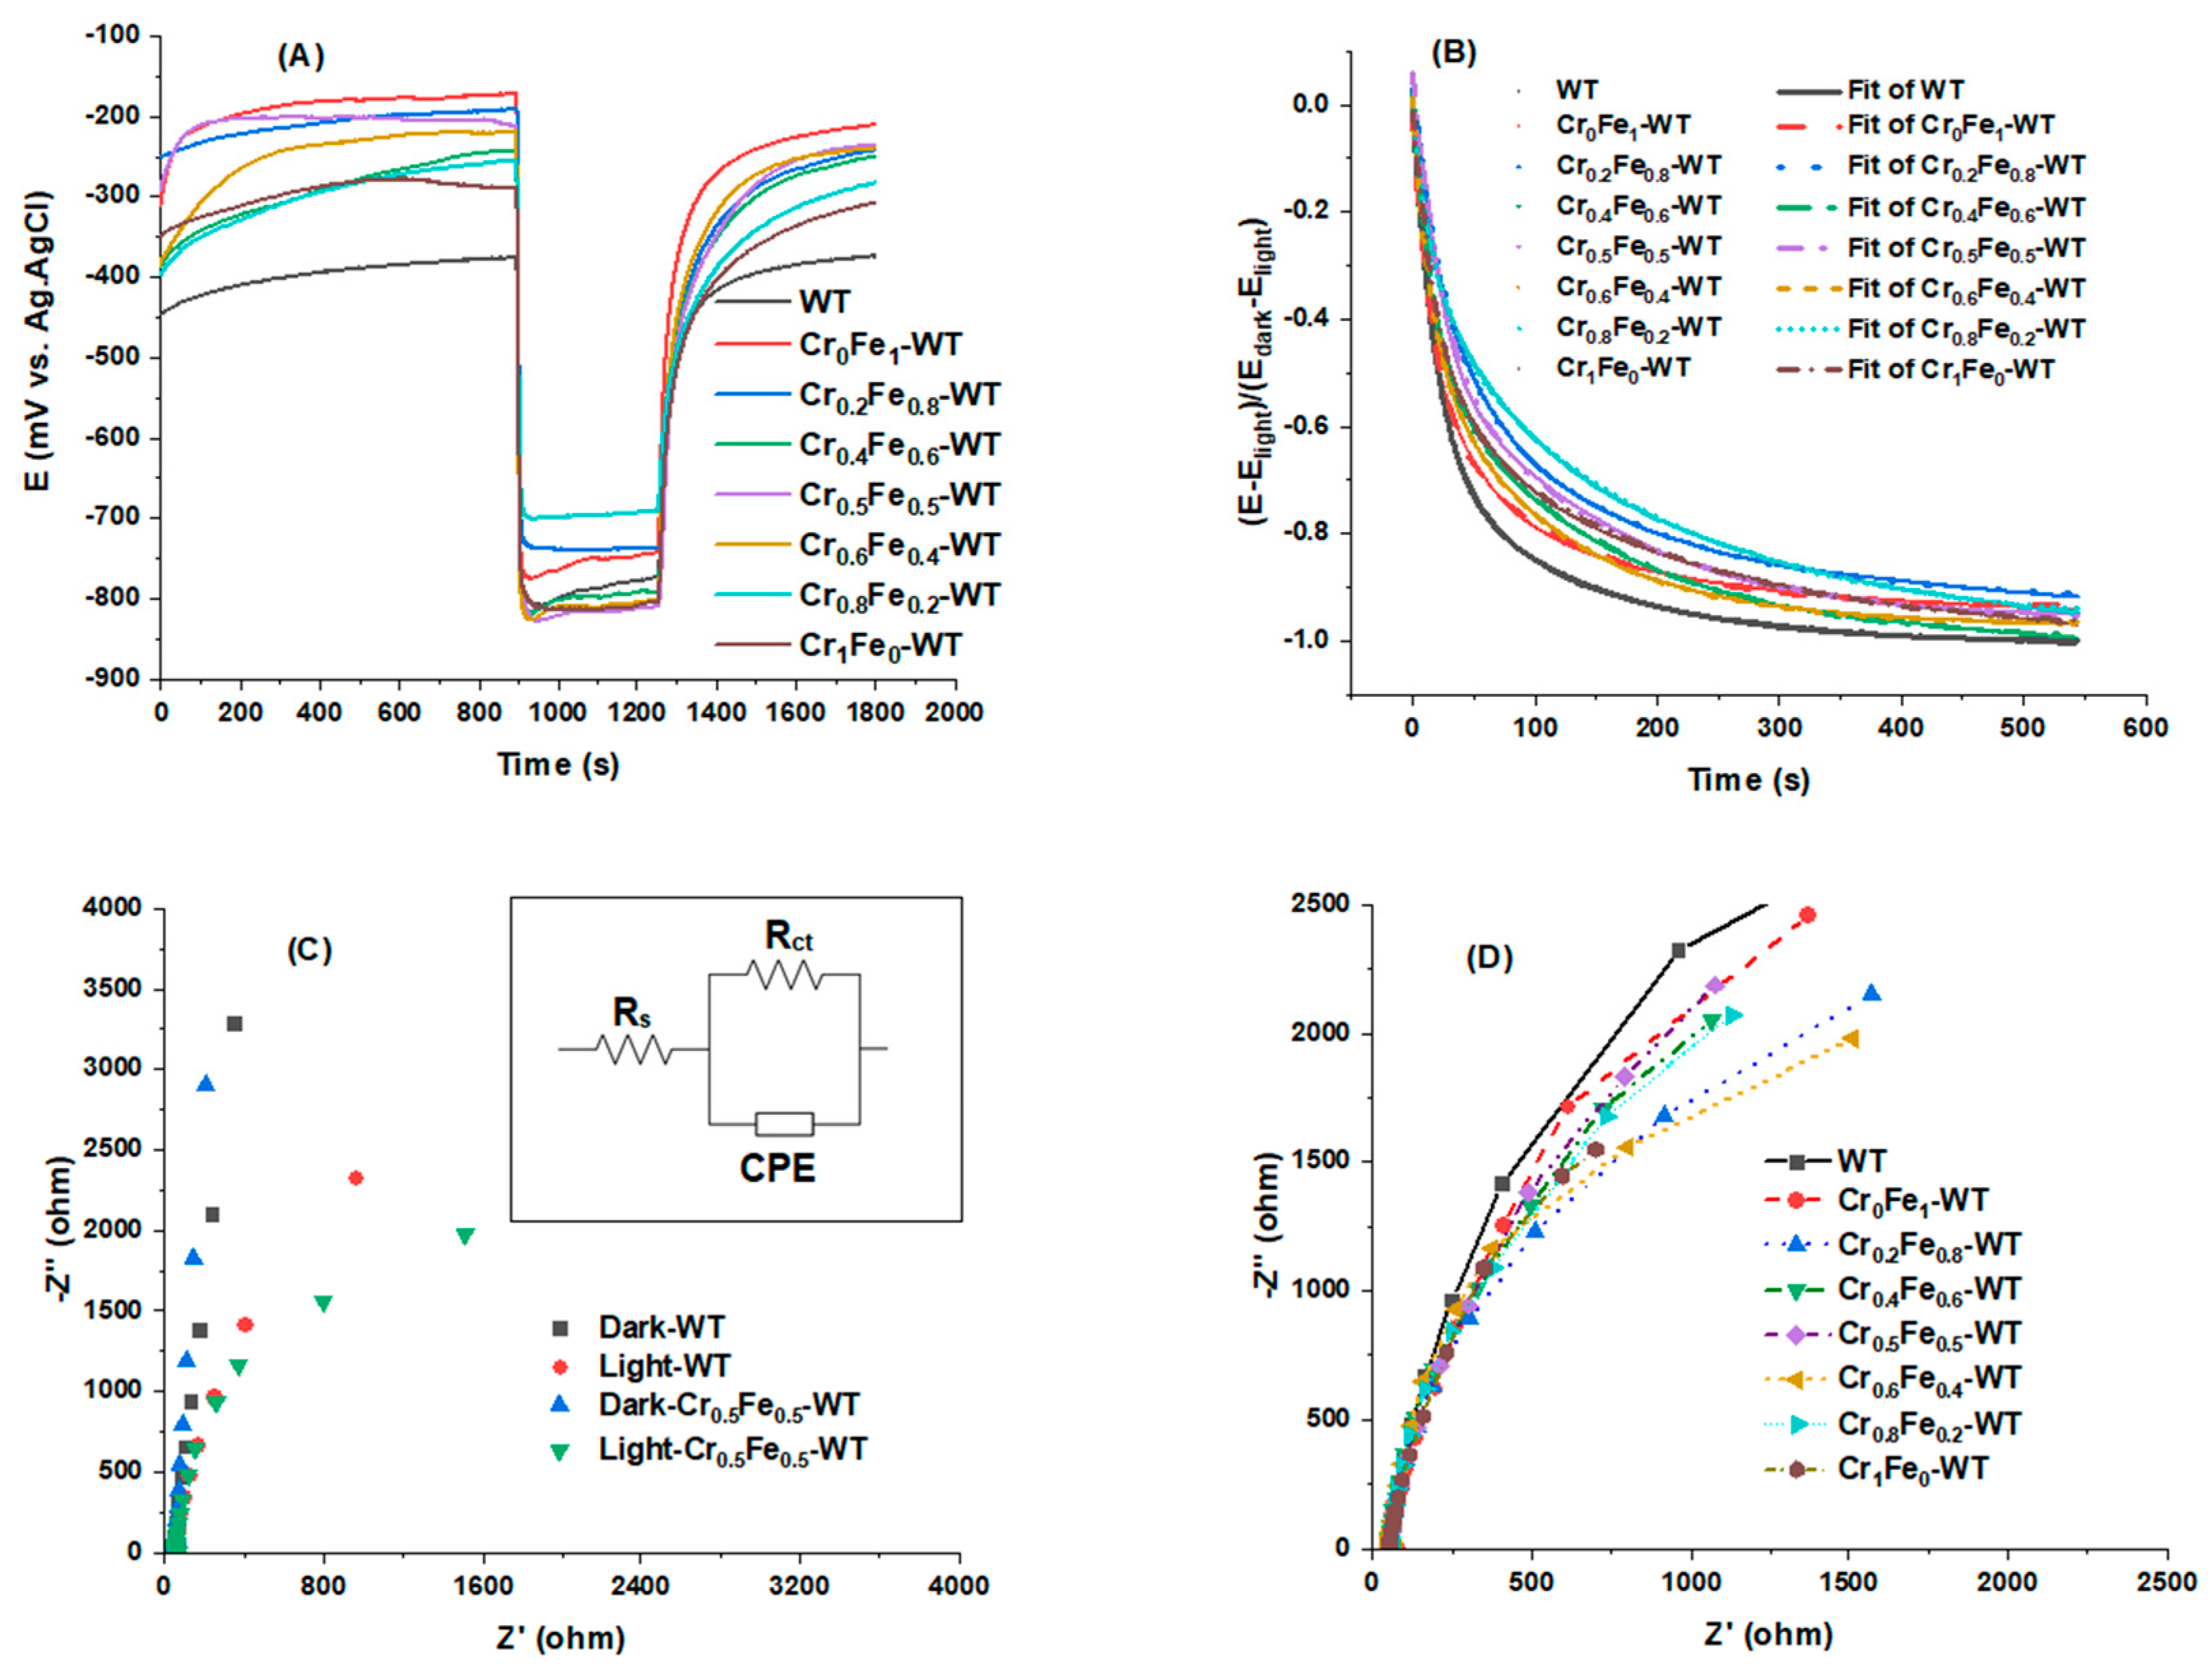
3.2. PEC Characterization

LSV measurements were performed to examine the photo-sensitivity of CrxFe1−x–WT by recording current density as responses of as-prepared photoelectrodes, through scanning the voltage in the dark, under illumination, and by switching the light on and off (Figure 5A,B and Figure S4). The current density of CrxFe1−x–WT is near zero in the dark (Figure 5A) and significant light sensitivity was observed under light illumination for all CrxFe1−x–WT photoelectrodes. In some cases, particularly Cr0.5Fe0.5–WT, an anodic peak centered at +0.75 V was observed which can be assigned to surface oxidation of the deposited amorphous composite CrxFe1−x (0.5 ≤ x ≤ 0.6) film on the surface of WT photoelectrode (see Figure 3D,E). Cr0.8Fe0.2–WT showed the maximum photocurrent density. It achieved a value of 0.48 mA cm−2 at 1.23 V vs. RHE, which corresponds to a ~2 times increase compared to the pristine WT (Figure 5B). The chopped light polarization curves revealed that CrxFe1−x–WT (0 ≤ x ≤ 1) photoelectrodes have good repeatability and stability during light irradiation (Figure S5).
Chronoamperometry (CA) measurement was conducted to evaluate the stability of the photocurrent density of CrxFe1−x–WT (Figure 5C). The response of CrxFe1−x–WT photoelectrodes to light is rapid and after the initial spike, the photocurrent decreases due to the strong e/h+ recombination and then stabilizes less than 60 s. Generally, the current density of pristine WT was increased after the surface modification. The photocurrent density of pristine WT was 0.43 mA cm−2 which enhanced to 0.63 mA cm−2 for the Cr0.8Fe0.2–WT photoelectrode at a bias of +1.62 V vs. RHE (Figure 5C). Highly sensitive photocurrent responses were observed upon switching the light on and off. The photocurrent was enhanced significantly under illumination and returned to near zero value as the light was turned off (Figure 5D).
Open circuit potential (OCP) of pristine WT and CrxFe1−x–WT photoelectrodes were investigated to study photovoltage as well as the lifetime of photo-generated e/h+. Characteristic behavior of an n-type semiconducting material was observed (Figure 6A); upon illumination, the potential of CrxFe1−x–WT shifts to more negative values. Afterward, when the light is turned off, the potential of CrxFe1−x–WT increases back to near initial values prior to the illumination and a decay profile appears. In all CrxFe1−x–WT photoelectrodes, a fast change in OCP was observed after the light is switched on which correlated with the fast response to light in photocurrent measurements. The photovoltages are ≥ 400 mV, which suggests a significant concentration of photo–generated electrons (Figure 6A). The higher photovoltages for CrxFe1−x–WT were obtained rather than that of pristine WT, suggesting a more remarkable photo response after the WT surface modification. Moreover, it has been reported that the decay profile of OCP after turning the light off represents the charge recombination kinetics (Figure 6B) [9,13].
Then, by fitting OCP decay profiles with a bi-exponential function (Equation (2)), the average recombination lifetime of photo charges was calculated.
V ( t ) =   V 0 + A 1 e t τ 1 + A 2 e t τ 2
where V, t, V0, A1 and A2 are potential decay, time, fitting constants, and τ1 and τ2 are exponential lifetime components for recombination processes in the bulk and surface, respectively.
The harmonic mean of decay lifetime (τm) is calculated by Equation (3) and the data are summarized in Table S3.
τ m = ( A 1 τ 1 × A 2 τ 2 ) / ( A 1 A 2 )
The longest photo charge lifetime was obtained in the case of Cr0.8Fe0.2–WT photoelectrode, indicating more efficient charge recombination suppression compared with other CrxFe1−x–WT photoelectrodes.
To further confirm the e/h+ separation and transfer of photogenerated carriers, electrochemical impedance spectroscopy (EIS) was measured. EIS data under the dark and light illumination have been plotted as Nyquist plots in Figure 6C,D, fitted by the equivalent circuit model (the inset plot in Figure 6C) to simulate the Nyquist plots. Rs is the uncompensated solution resistance, Rct denotes the charge transfer resistance, and CPE is defined as CPE-T and CPE-P, representing the constant phase elements. The fitting impedance parameter values are listed in Table 1.
The diameter of the semicircle of the Nyquist plot represents the photoelectrode charge transfer resistance and the smaller arc radius means better e/h+ separation efficiency (Figure 6C,D). The charge transfer resistances of photoelectrodes under light illumination are much smaller than those obtained in the dark (Figure 6C). Moreover, the Cr0.8Fe0.2–WT photoelectrode showed the smallest Rct value, indicating better charge separation and faster charge transfer kinetics at the electrode interface.

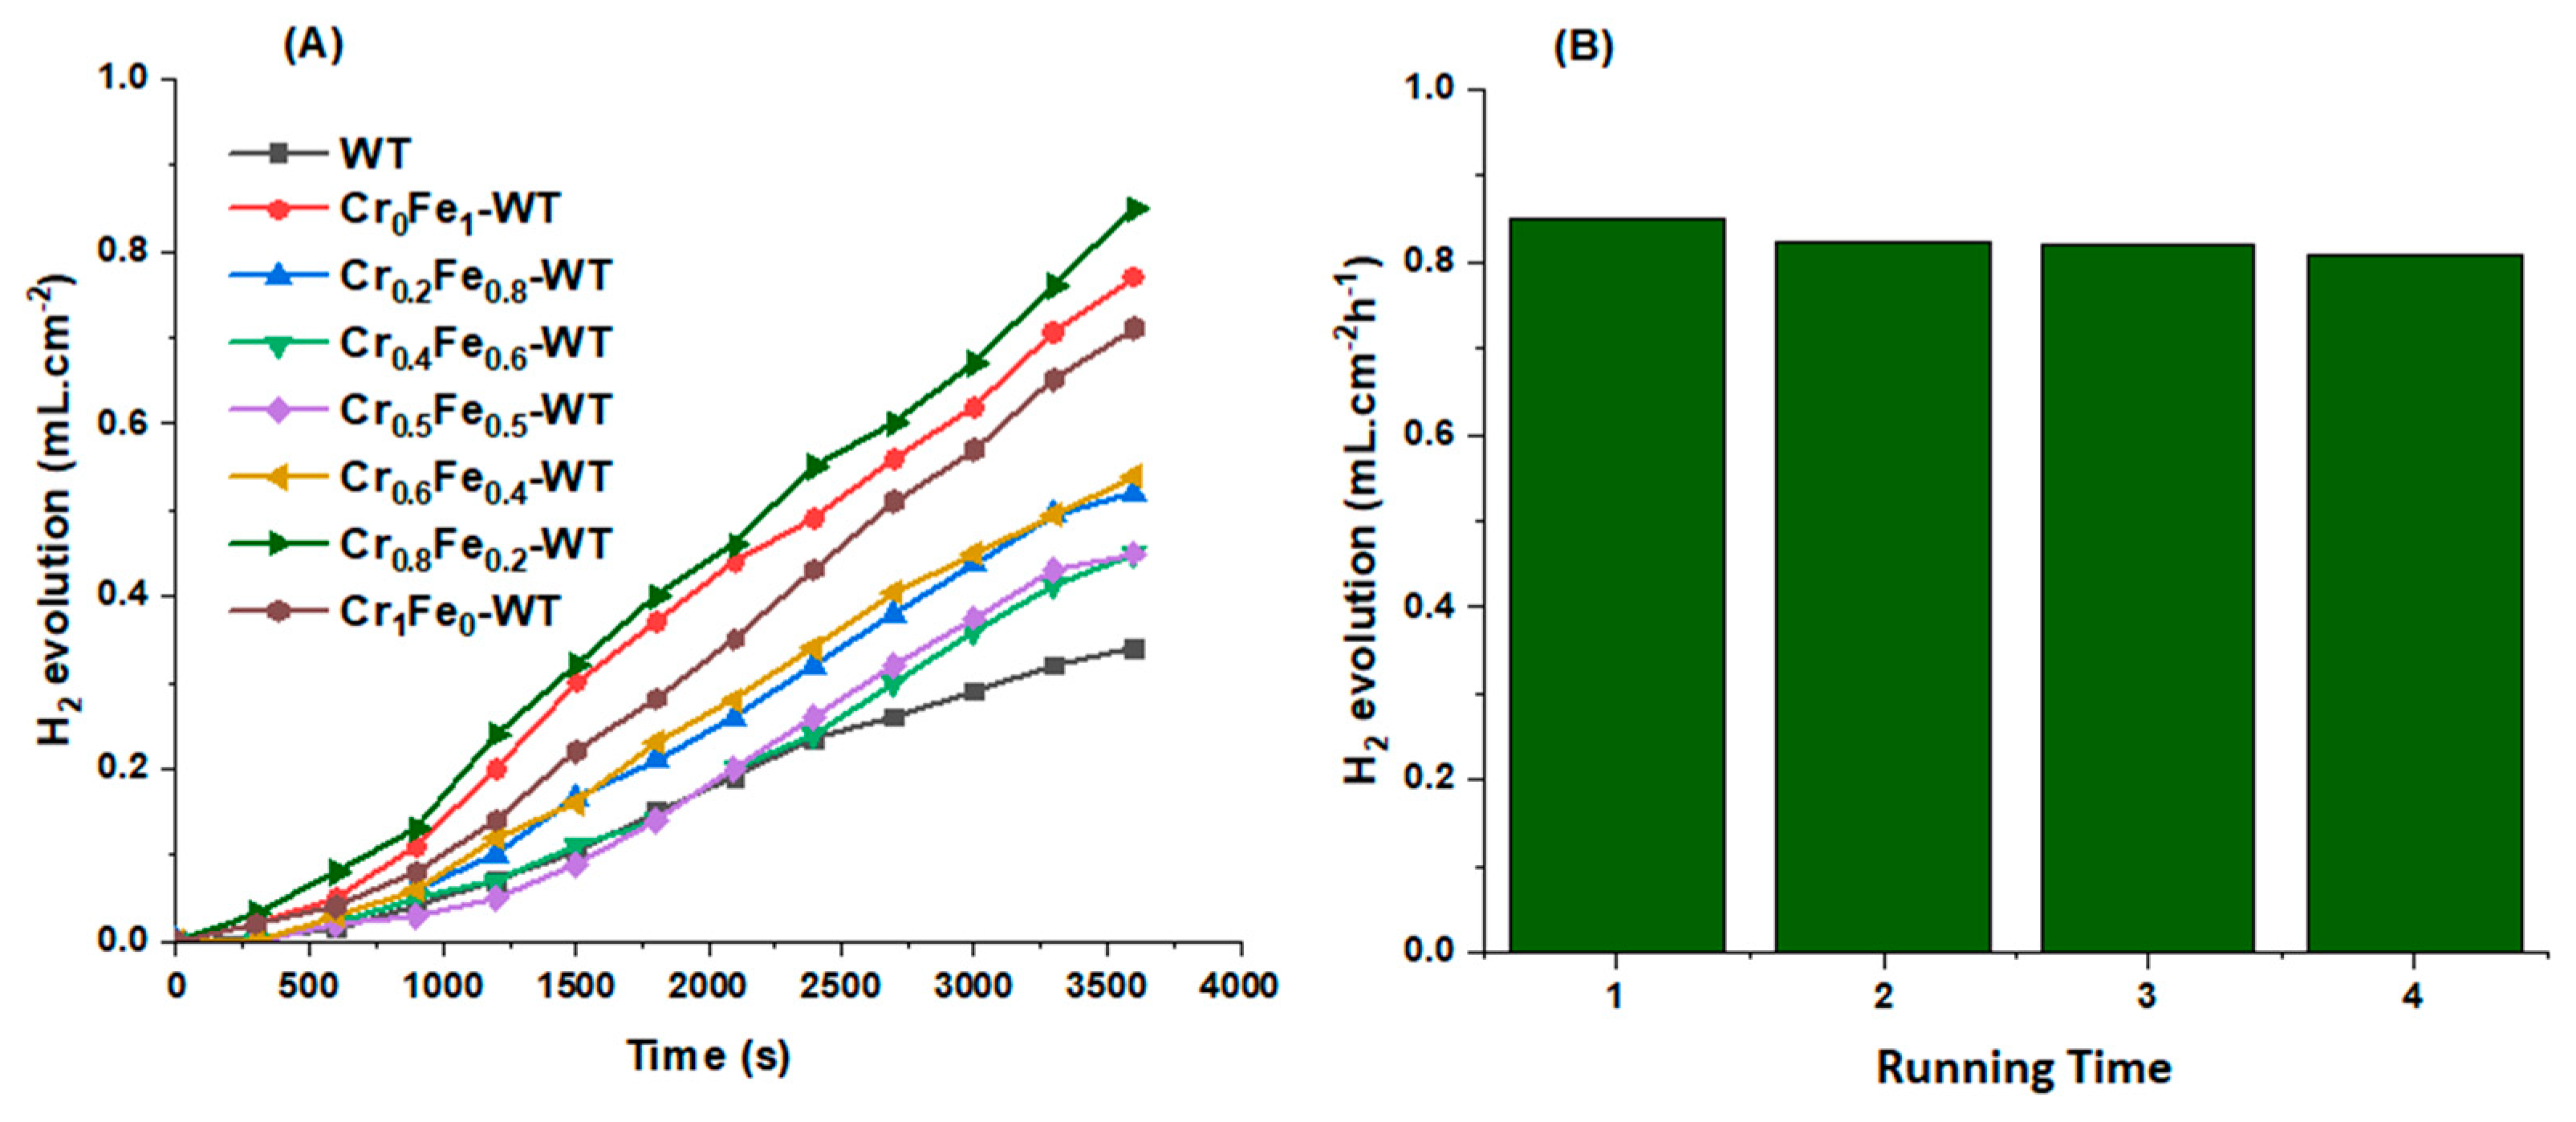
3.3. PEC Water Splitting and H2 Generation

PEC water splitting using CrxFe1−x–WT photoelectrodes was conducted via an inverted burette setup (Figure 1C). The volume of H2 production was then quantitatively recorded according to the variation of the electrolyte level in the burette every 5 min. As can be seen (Figure 7A), the Cr0.8Fe0.2–WT photoelectrode produced more H2 than that of pristine WT and other photoelectrodes in an alkaline electrolyte. Water splitting for H2 evolution using Cr0.8Fe0.2–WT conducted during four cycles of 60 min (Figure 7B) showed no significant decrease in activity during consecutive cycles, which proves the good stability of the as-prepared electrodes in the PEC water splitting. The PEC evolved H2 in this work compared with some of the other materials used in PEC water splitting in Table 2.

4. Conclusions

A simple and effective surface modification was applied by photo-deposition of a single ion of Fe, Cr, as well as dual ions (CrxFe1−x, 0 ≤ x ≤ 1) on the surface of WT to fabricate CrxFe1−x–WT photoelectrodes. The determined band gaps of the photoelectrodes using Tauc plots were in a range of 2.16–2.65 eV which is less than pristine WT. The ratio of Fe and Cr showed a significant effect on the deposition rate. In some ratios, an amorphous layer of CrxFe1−x (0.5 ≤ x ≤ 0.6) covered the WT surface which is unfavorable for the separation of photo-generated e/h+ and consequently decreases the PEC efficiency of these photoelectrodes. The Cr and Fe doping individually might improve the photocurrent by expended visible light absorbance as well as the effective separation of photo-generated e/h+. However, the ratio of dual co-catalysts should be carefully optimized. On the other hand, Cr0.8Fe0.2–WT made a great improvement in PEC activities. Better PEC activity of Cr0.8Fe0.2–WT can be due to less charge transfer resistance as well as a longer photo charge lifetime. The maximum evolved H2 was also obtained for Cr0.8Fe0.2–WT photoelectrodes which are over two times that of pristine WT.

Supplementary Materials

The following supporting information can be downloaded at: www.mdpi.com/article/10.3390/su142013251/s1, Figure S1: EDS mapping of Cr0Fe1–WT, Figure S2: EDS mapping of Cr1Fe0–WT; Figure S3: UV–Vis spectra (inset: Tauc plot) of CrxFe1−x–WT; Figure S4: LSV of CrxFe1−x–WT under chopped light; Table S1: The elements ratio obtained by EDS in CrxFe1−x–WT; Table S2: The estimated band gap (BG) of CrxFe1−x–WT; Table S3: Parameters obtained from OCP decay profiles according to a dual exponentials decay of CrxFe1−x–WT.

Author Contributions

Conceptualization, T.M., Y.G., T.S. and M.M.M.; formal analysis, T.M., S.S. and T.S.; investigation, T.M. and S.S.; data curation, T.M. and Y.G.; writing—original draft preparation, T.M.; writing—review and editing, T.S. and S.S.; supervision, Y.G. and M.M.M.; funding acquisition, Y.G. All authors have read and agreed to the published version of the manuscript.

Funding

This work was supported by the Isfahan University of Technology.

Institutional Review Board Statement

Not applicable.

Informed Consent Statement

Not applicable.

Data Availability Statement

The data presented in this study are available on request from the corresponding author.

Acknowledgments

The financial support of the Research Council of the Isfahan University of Technology is gratefully acknowledged.

Conflicts of Interest

The authors declare no conflict of interest.

References

  1. Nazir, H.; Muthuswamy, N.; Louis, C.; Jose, S.; Prakash, J.; Buan, M.E.; Flox, C.; Chavan, S.; Shi, X.; Kauranen, P. Is the H2 economy realizable in the foreseeable future? Part III: H2 usage technologies, applications, and challenges and opportunities. Int. J. Hydrogen Energy 2020, 45, 28217–28239. [Google Scholar] [CrossRef] [PubMed]
  2. Wang, M.; Wang, G.; Sun, Z.; Zhang, Y.; Xu, D. Review of renewable energy-based hydrogen production processes for sustainable energy innovation. Glob. Energy Interconnect. 2019, 2, 436–443. [Google Scholar] [CrossRef]
  3. Fujishima, A.; Honda, K. Electrochemical Photolysis of Water at a Semiconductor Electrode. Nature 1972, 238, 37–38. [Google Scholar] [CrossRef]
  4. Kalanur, S.S.; Duy, L.T.; Seo, H. Recent Progress in Photoelectrochemical Water Splitting Activity of WO3 Photoanodes. Top. Catal. 2018, 61, 1043–1076. [Google Scholar] [CrossRef]
  5. Sivula, K.; Le Formal, F.; Grätzel, M. Solar Water Splitting: Progress Using Hematite (α-Fe2O3) Photoelectrodes. ChemSusChem 2011, 4, 432–449. [Google Scholar] [CrossRef]
  6. dos Santos, W.S.; Rodriguez, M.; Khoury, J.M.O.; Nascimento, L.A.; Ribeiro, R.J.P.; Mesquita, J.P.; Silva, A.C.; Nogueira, F.G.E.; Pereira, M.C. Bismuth Vanadate Photoelectrodes with High Photovoltage as Photoanode and Photocathode in Photoelectrochemical Cells for Water Splitting. ChemSusChem 2018, 11, 589–597. [Google Scholar] [CrossRef] [PubMed]
  7. Liu, J.; Li, S.; Dewil, R.; Vanierschot, M.; Baeyens, J.; Deng, Y. Water Splitting by MnOx/Na2CO3 Reversible Redox Reactions. Sustainability 2022, 14, 7597. [Google Scholar] [CrossRef]
  8. Yu, Z.; Liu, H.; Zhu, M.; Li, Y.; Li, W. Interfacial Charge Transport in 1D TiO2 Based Photoelectrodes for Photoelectrochemical Water Splitting. Small 2021, 17, 1903378. [Google Scholar] [CrossRef] [PubMed]
  9. Sharifi, T.; Ghayeb, Y.; Mohammadi, T.; Momeni, M.M.; Bagheri, R.; Song, Z. Surface treatment of titanium by in-situ anodizination and NiO photodeposition: Enhancement of photoelectrochemical properties for water splitting and photocathodic protection of stainless steel. Appl. Phys. A 2021, 127, 72. [Google Scholar] [CrossRef]
  10. Zhao, Y.; Hoivik, N.; Wang, K. Recent advance on engineering titanium dioxide nanotubes for photochemical and photoelectrochemical water splitting. Nano Energy 2016, 30, 728–744. [Google Scholar] [CrossRef]
  11. Ge, M.; Li, Q.; Cao, C.; Huang, J.; Li, S.; Zhang, S.; Chen, Z.; Zhang, K.; Al-Deyab, S.S.; Lai, Y. One-dimensional TiO2 nanotube photocatalysts for solar water splitting. Adv. Sci. 2017, 4, 1600152. [Google Scholar] [CrossRef]
  12. Natarajan, T.S.; Natarajan, K.; Bajaj, H.C.; Tayade, R.J. Enhanced photocatalytic activity of bismuth-doped TiO2 nanotubes under direct sunlight irradiation for degradation of Rhodamine B dye. J. Nanoparticle Res. 2013, 15, 1669. [Google Scholar] [CrossRef]
  13. Mohammadi, T.; Ghayeb, Y.; Sharifi, T.; Momeni, M.M. RuO2 photodeposited on W-doped and Cr-doped TiO2 nanotubes with enhanced photoelectrochemical water splitting and capacitor properties. New J. Chem. 2020, 44, 2339–2349. [Google Scholar] [CrossRef]
  14. Huo, K.; Gao, B.; Fu, J.; Zhao, L.; Chu, P.K. Fabrication, modification, and biomedical applications of anodized TiO2 nanotube arrays. Rsc Adv. 2014, 4, 17300–17324. [Google Scholar] [CrossRef]
  15. Sharifi, T.; Mohammadi, T.; Momeni, M.M.; Kusic, H.; Kraljic Rokovic, M.; Loncaric Bozic, A.; Ghayeb, Y. Influence of Photo-Deposited Pt and Pd onto Chromium Doped TiO2 Nanotubes in Photo-Electrochemical Water Splitting for Hydrogen Generation. Catalysts 2021, 11, 212. [Google Scholar] [CrossRef]
  16. Tobaldi, D.M.; Kočí, K.; Edelmannová, M.; Lajaunie, L.; Figueiredo, B.; Calvino, J.J.; Seabra, M.P.; Labrincha, J.A. CuxO and carbon–modified TiO2–based hybrid materials for photocatalytically assisted H2 generation. Mater. Today Energy 2021, 19, 100607. [Google Scholar] [CrossRef]
  17. Huerta-Flores, A.M.; Chávez-Angulo, G.; Carrasco-Jaim, O.A.; Torres-Martínez, L.M.; Garza-Navarro, M.A. Enhanced photoelectrochemical water splitting on heterostructured α-Fe2O3-TiO2:X (X = Co, Cu, Bi) photoanodes: Role of metal doping on charge carrier dynamics improvement. J. Photochem. Photobiol. A Chem. 2021, 410, 113077. [Google Scholar] [CrossRef]
  18. Draz, M.A.; El-Maghrabi, H.H.; Soliman, F.S.; Selim, H.; Razik, A.A.; Amin, A.E.-s.; Moustafa, Y.M.; Hamdy, A.; Nada, A.A. Large scale hybrid magnetic ZnFe2O4/TiO2 nanocomposite with highly photocatalytic activity for water splitting. J. Nanopart. Res. 2021, 23, 10. [Google Scholar] [CrossRef]
  19. Liang, Z.; Chen, D.; Xu, S.; Fang, Z.; Wang, L.; Yang, W.; Hou, H. Synergistic promotion of photoelectrochemical water splitting efficiency of TiO2 nanorod arrays by doping and surface modification. J. Mater. Chem. C 2021, 9, 12263–12272. [Google Scholar] [CrossRef]
  20. Montoya, A.T.; Gillan, E.G. Enhanced Photocatalytic Hydrogen Evolution from Transition-Metal Surface-Modified TiO2. ACS Omega 2018, 3, 2947–2955. [Google Scholar] [CrossRef]
  21. Šuligoj, A.; Arčon, I.; Mazaj, M.; Dražić, G.; Arčon, D.; Cool, P.; Štangar, U.L.; Tušar, N.N. Surface modified titanium dioxide using transition metals: Nickel as a winning transition metal for solar light photocatalysis. J. Mater. Chem. A 2018, 6, 9882–9892. [Google Scholar] [CrossRef] [Green Version]
  22. Wenderich, K.; Mul, G. Methods, Mechanism, and Applications of Photodeposition in Photocatalysis: A Review. Chem. Rev. 2016, 116, 14587–14619. [Google Scholar] [CrossRef] [PubMed]
  23. Tada, H.; Jin, Q.; Iwaszuk, A.; Nolan, M. Molecular-scale transition metal oxide nanocluster surface-modified titanium dioxide as solar-activated environmental catalysts. J. Phys. Chem. C 2014, 118, 12077–12086. [Google Scholar] [CrossRef]
  24. Shopova-Gospodinova, D.; Jeurgens, L.P.; Welzel, U.; Bauermann, L.P.; Hoffmann, R.C.; Bill, J. Synthesis of V-doped TiO2 films by chemical bath deposition and the effect of post-annealing on their properties. Thin Solid Films 2012, 520, 5928–5935. [Google Scholar] [CrossRef]
  25. Kyeremateng, N.A.; Lebouin, C.; Knauth, P.; Djenizian, T. The electrochemical behaviour of TiO2 nanotubes with Co3O4 or NiO submicron particles: Composite anode materials for Li-ion micro batteries. Electrochim. Acta 2013, 88, 814–820. [Google Scholar] [CrossRef]
  26. Sharifi, T.; Ghayeb, Y.; Mohammadi, T.; Momeni, M.M. Enhanced photoelectrochemical water splitting of CrTiO2 nanotube photoanodes by the decoration of their surface via the photodeposition of Ag and Au. Dalton Trans. 2018, 47, 11593–11604. [Google Scholar] [CrossRef]
  27. Hariri, A.; Gilani, N.; Pasikhani, J.V. Promoting the photo-induced charge separation and photoelectrocatalytic hydrogen generation: Z-scheme configuration of WO3 quantum nanodots-decorated immobilized Ti/TiO2 nanorods. J. Alloys Compd. 2021, 871, 159528. [Google Scholar] [CrossRef]
  28. Yang, B.; Chai, Y.; Yang, F.; Zhang, Q.; Liu, H.; Wang, N. Hydrogen generation by aluminum-water reaction in acidic and alkaline media and its reaction dynamics. Int. J. Energy Res. 2018, 42, 1594–1602. [Google Scholar] [CrossRef]
  29. Mishra, P.; Shukla, P.; Srivastava, O. Study of modular PEC solar cells for photoelectrochemical splitting of water employing nanostructured TiO2 photoelectrodes. Int. J. Hydrogen Energy 2007, 32, 1680–1685. [Google Scholar] [CrossRef]
  30. Momeni, M.M.; Ghayeb, Y.; Davarzadeh, M. Single-step electrochemical anodization for synthesis of hierarchical WO3–TiO2 nanotube arrays on titanium foil as a good photoanode for water splitting with visible light. J. Electroanal. Chem. 2015, 739, 149–155. [Google Scholar] [CrossRef]
  31. Momeni, M.M.; Akbarnia, M.; Ghayeb, Y. Preparation of S–W-codoped TiO2 nanotubes and effect of various hole scavengers on their photoelectrochemical activity: Alcohol series. Int. J. Hydrogen Energy 2020, 45, 33552–33562. [Google Scholar] [CrossRef]
  32. Yang, Y.; Wang, G.; Gu, G.; Li, Q.; Kang, S.; Zhang, Y.; Ng, D.H.; Zhao, H. One pot microwave-assisted synthesis of Ag decorated yolk@ shell structured TiO2 microspheres. Rsc Adv. 2015, 5, 11349–11357. [Google Scholar] [CrossRef]
  33. D’Elia, D.; Beauger, C.; Hochepied, J.-F.; Rigacci, A.; Berger, M.-H.; Keller, N.; Keller-Spitzer, V.; Suzuki, Y.; Valmalette, J.-C.; Benabdesselam, M.; et al. Impact of three different TiO2 morphologies on hydrogen evolution by methanol assisted water splitting: Nanoparticles, nanotubes and aerogels. Int. J. Hydrogen Energy 2011, 36, 14360–14373. [Google Scholar] [CrossRef] [Green Version]
  34. Spanu, D.; Recchia, S.; Mohajernia, S.; Schmuki, P.; Altomare, M. Site-selective Pt dewetting on WO3-coated TiO2 nanotube arrays: An electron transfer cascade-based H2 evolution photocatalyst. Appl. Catal. B Environ. 2018, 237, 198–205. [Google Scholar] [CrossRef]
  35. Momeni, M.M.; Ghayeb, Y. Photoelectrochemical water splitting on chromium-doped titanium dioxide nanotube photoanodes prepared by single-step anodizing. J. Alloys Compd. 2015, 637, 393–400. [Google Scholar] [CrossRef]
  36. Nguyen, N.T.; Ozkan, S.; Hejazi, S.; Denisov, N.; Tomanec, O.; Zboril, R.; Schmuki, P. Providing significantly enhanced photocatalytic H2 generation using porous PtPdAg alloy nanoparticles on spaced TiO2 nanotubes. Int. J. Hydrogen Energy 2019, 44, 22962–22971. [Google Scholar] [CrossRef]
  37. Li, F.; Huang, H.; Li, G.; Leung, D.Y. TiO2 nanotube arrays modified with nanoparticles of platinum group metals (Pt, Pd, Ru): Enhancement on photoelectrochemical performance. J. Nanopart. Res. 2019, 21, 29. [Google Scholar] [CrossRef]
  38. Momeni, M.M.; Ghayeb, Y. Fabrication, characterization and photoelectrochemical behavior of Fe–TiO2 nanotubes composite photoanodes for solar water splitting. J. Electroanal. Chem. 2015, 751, 43–48. [Google Scholar] [CrossRef]
Figure 1. Schematic presentation of fabrication of WT nanotubes by in situ electrochemical anodization (A) CrxFe1−x–T by photo-deposition (B) and measuring H2 evolution from PEC water splitting using an inverted burette (C).
Sustainability 14 13251 g001
Figure 2. SEM images of WT photoelectrode.
Sustainability 14 13251 g002
Figure 3. SEM images of Cr0Fe1–WT (A), Cr0.2Fe0.8–WT (B), Cr0.4Fe0.6–WT (C), Cr0.5Fe0.5–WT (D), Cr0.6Fe0.4–WT (E), Cr0.8Fe0.2–WT (F), Cr1Fe0–WT (G) at different magnifications.
Sustainability 14 13251 g003
Figure 4. EDX (AC), XRD (D), Raman (E), and Tauc plot (F) of CrxFe1-x−WT (x = 0, 0.5, and 1).
Sustainability 14 13251 g004
Figure 5. LSV of CrxFe1−x-WT in the dark (A), and under light illumination (B), photocurrent response curves at a given +1.62 V vs. RHE (C) and chopped light (D) in KOH (1 M, pH = 13.9) solution containing ethylene glycol (5 vol%).
Sustainability 14 13251 g005
Figure 6. OCP (A) and fitted decay profile of CrxFe1−x–WT (B), EIS plots in the dark and light (inset: equivalent circuit model used for fitting EIS data) (C), and EIS plots under light illumination for all photoelectrodes at a bias of 1.22 V vs. RHE (D).
Sustainability 14 13251 g006
Figure 7. PEC H2 evolution of CrxFe1-x–WT during 1 h at 1.5 V vs. RHE (A), reusability examination of the Cr0.8Fe0.2–WT photoelectrode (B) in KOH (1 M, pH = 13.9) solution containing ethylene glycol (5 vol%).
Sustainability 14 13251 g007
Table 1. EIS fitting parameters of CrxFe1−x–WT photoelectrodes under illumination.
PhotoelectrodeRct (kΩcm−2)CPE
nQ (μFcm−2)C (μFcm−2)
WT7.2470.9771.970.3
Cr0Fe1–WT7.5410.90106104
Cr0.2Fe0.8–WT9.6700.9286.084.7
Cr0.4Fe0.6–WT5.7160.9573.870.4
Cr0.5Fe0.5–WT6.5110.9481.378.3
Cr0.6Fe0.4–WT4.2530.9581.977.8
Cr0.8Fe0.2–WT3.4200.9488.381.8
Cr1Fe0–WT10.0160.91117119
Table 2. Comparison of H2 evolution using TiO2-based nanomaterials.
PhotoelectrodeElectrolyteLight SourceRate of H2 EvolutionRef.
TiO2 NPMeOH + H2O 150 W halide 0.270 µmol g−1min−1[33]
1Pt-3WO3 -TiO2 NTsH2O +20 vol% EtOH UV5 µL h−1[34]
Cr-doped TiO2 NTsNaOH Vis9.70 μL cm−2 h−1[35]
Pd-TiO2 NTsH2O +50 vol% MeOHUV70 μL cm−2 h−1[36]
Ru-TiO2 NTsNa2SO4 (2 M)Vis29 μmol cm−2 h−1[37]
Fe-TiO2 NTsNaOHVis10 μL cm−2 h−1[38]
Cu-TiO2H2O +50 vol% EtOHUV81.1 µmol g−1h−1[20]
Cr0.8Fe0.2–WTKOH + 10 vol% EG Vis0.85 mL cm−2 h−1This work
Publisher’s Note: MDPI stays neutral with regard to jurisdictional claims in published maps and institutional affiliations.

