
Does Low-Carbon City Policy Improve Industrial Capacity Utilization? Evidence from a Quasi-Natural Experiment in China


Abstract
:1. Introduction
2. Feature Fact Analysis and Theoretical Mechanisms
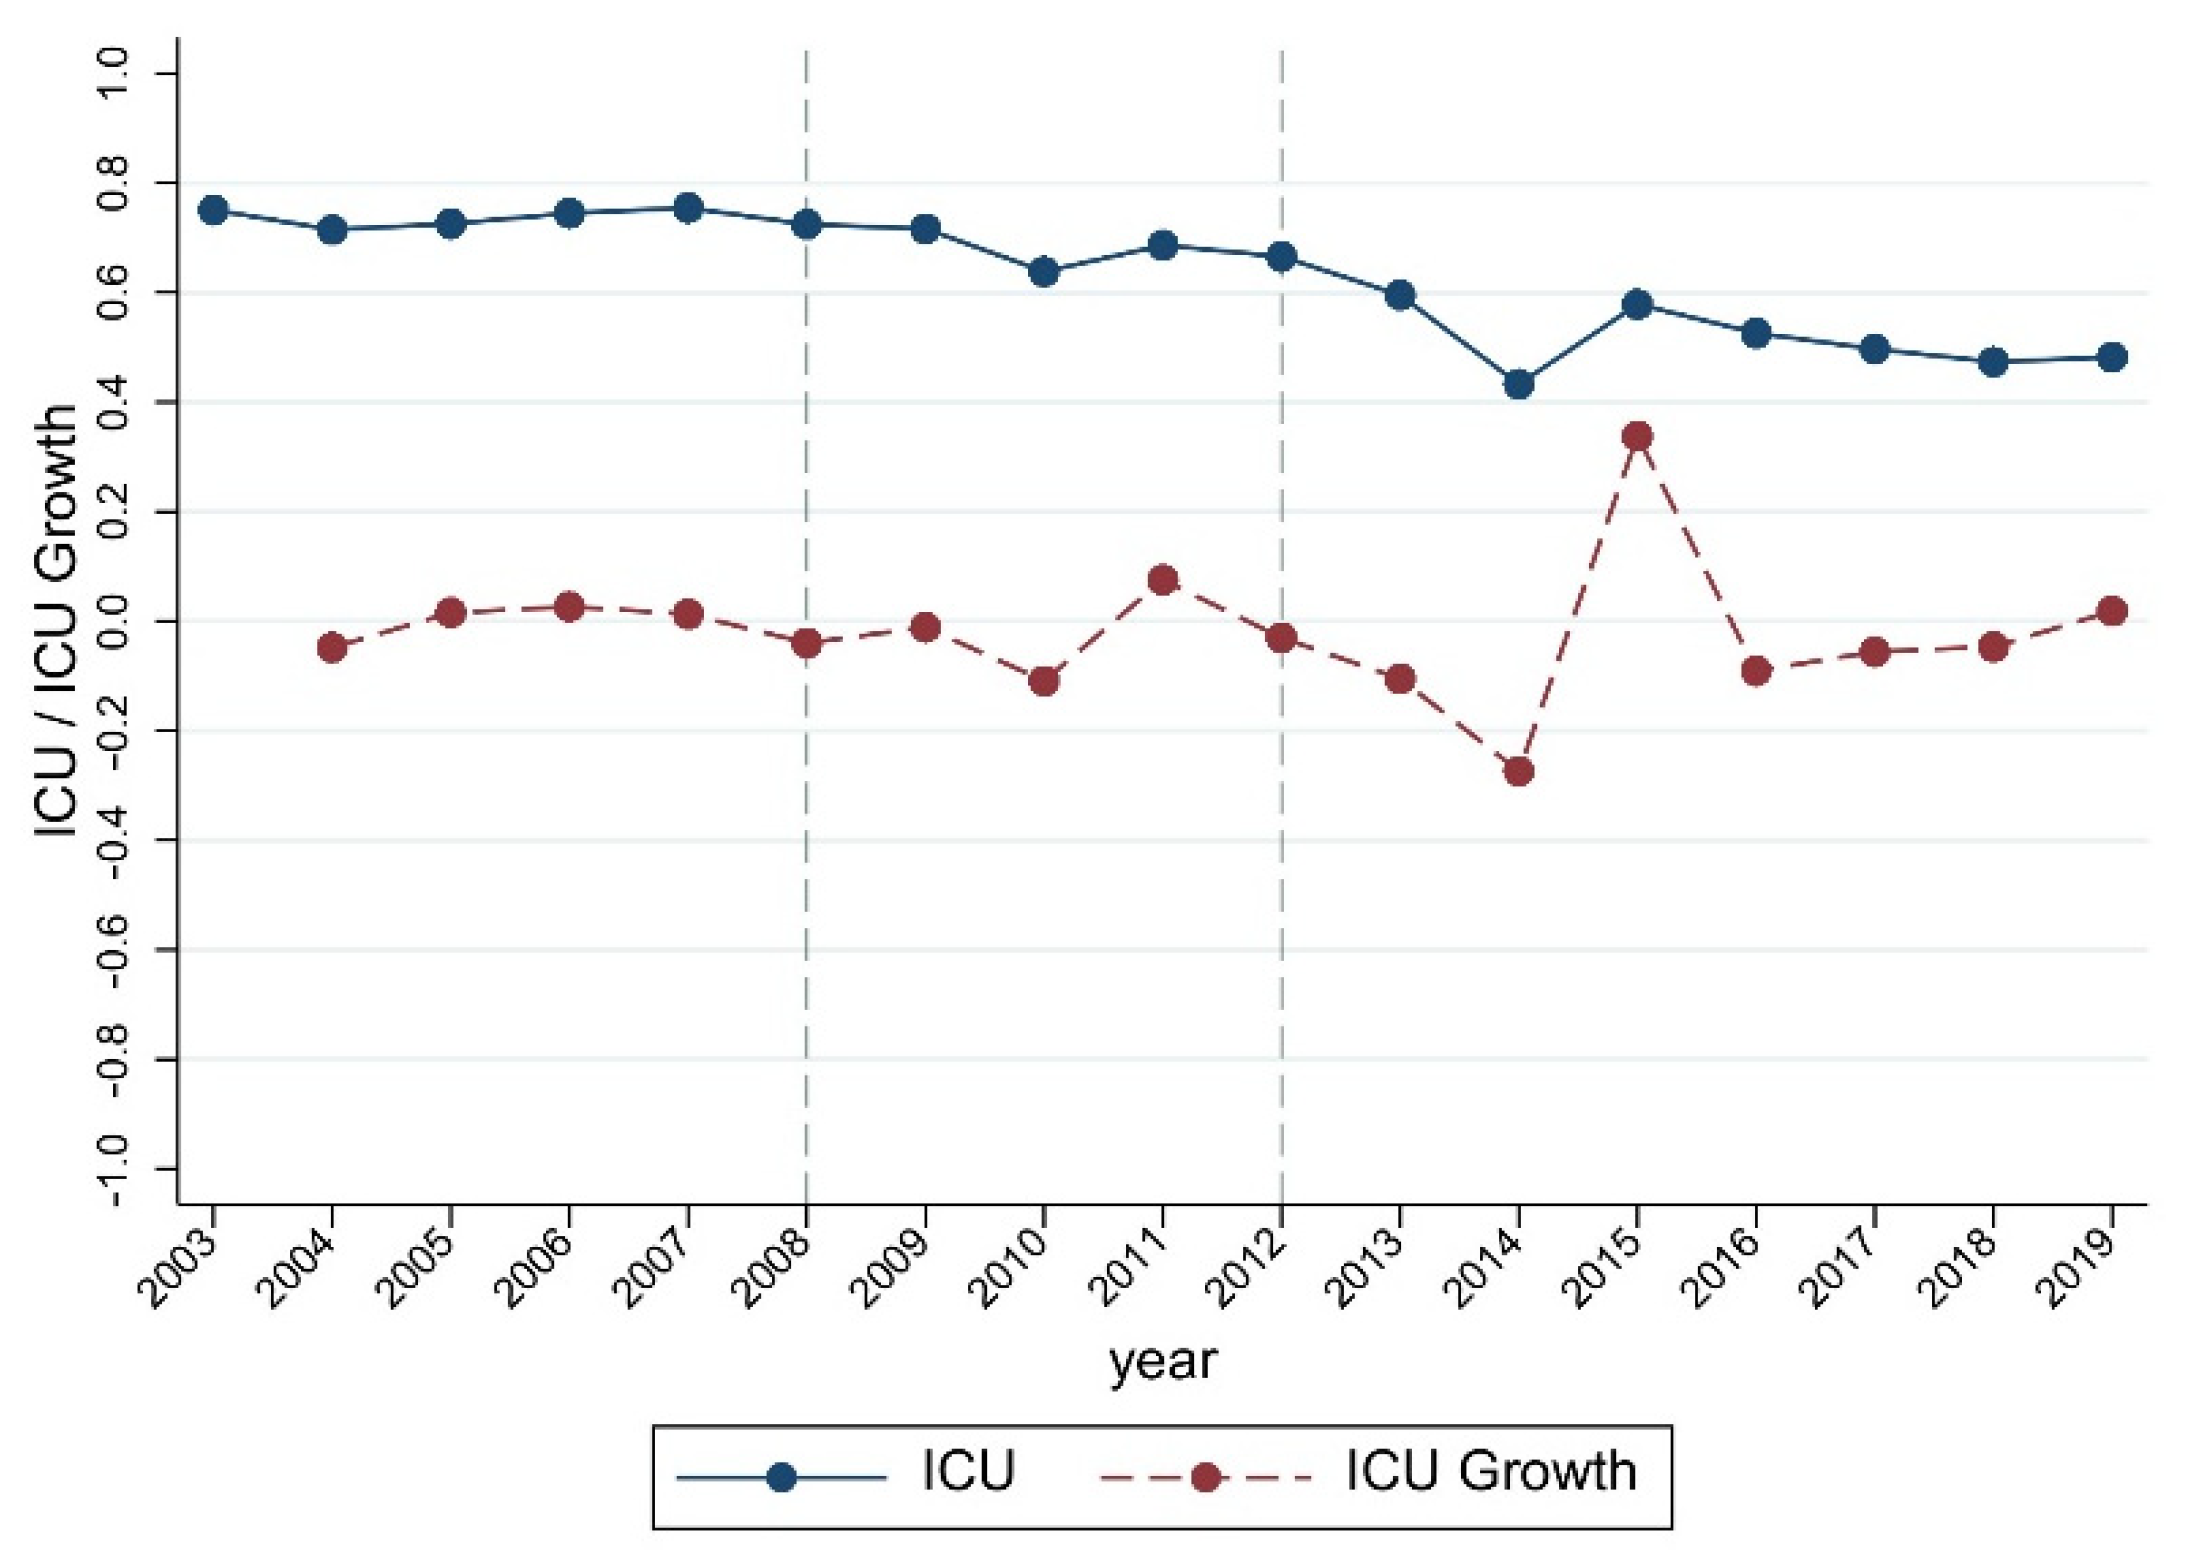
2.1. Characteristic Fact Analysis
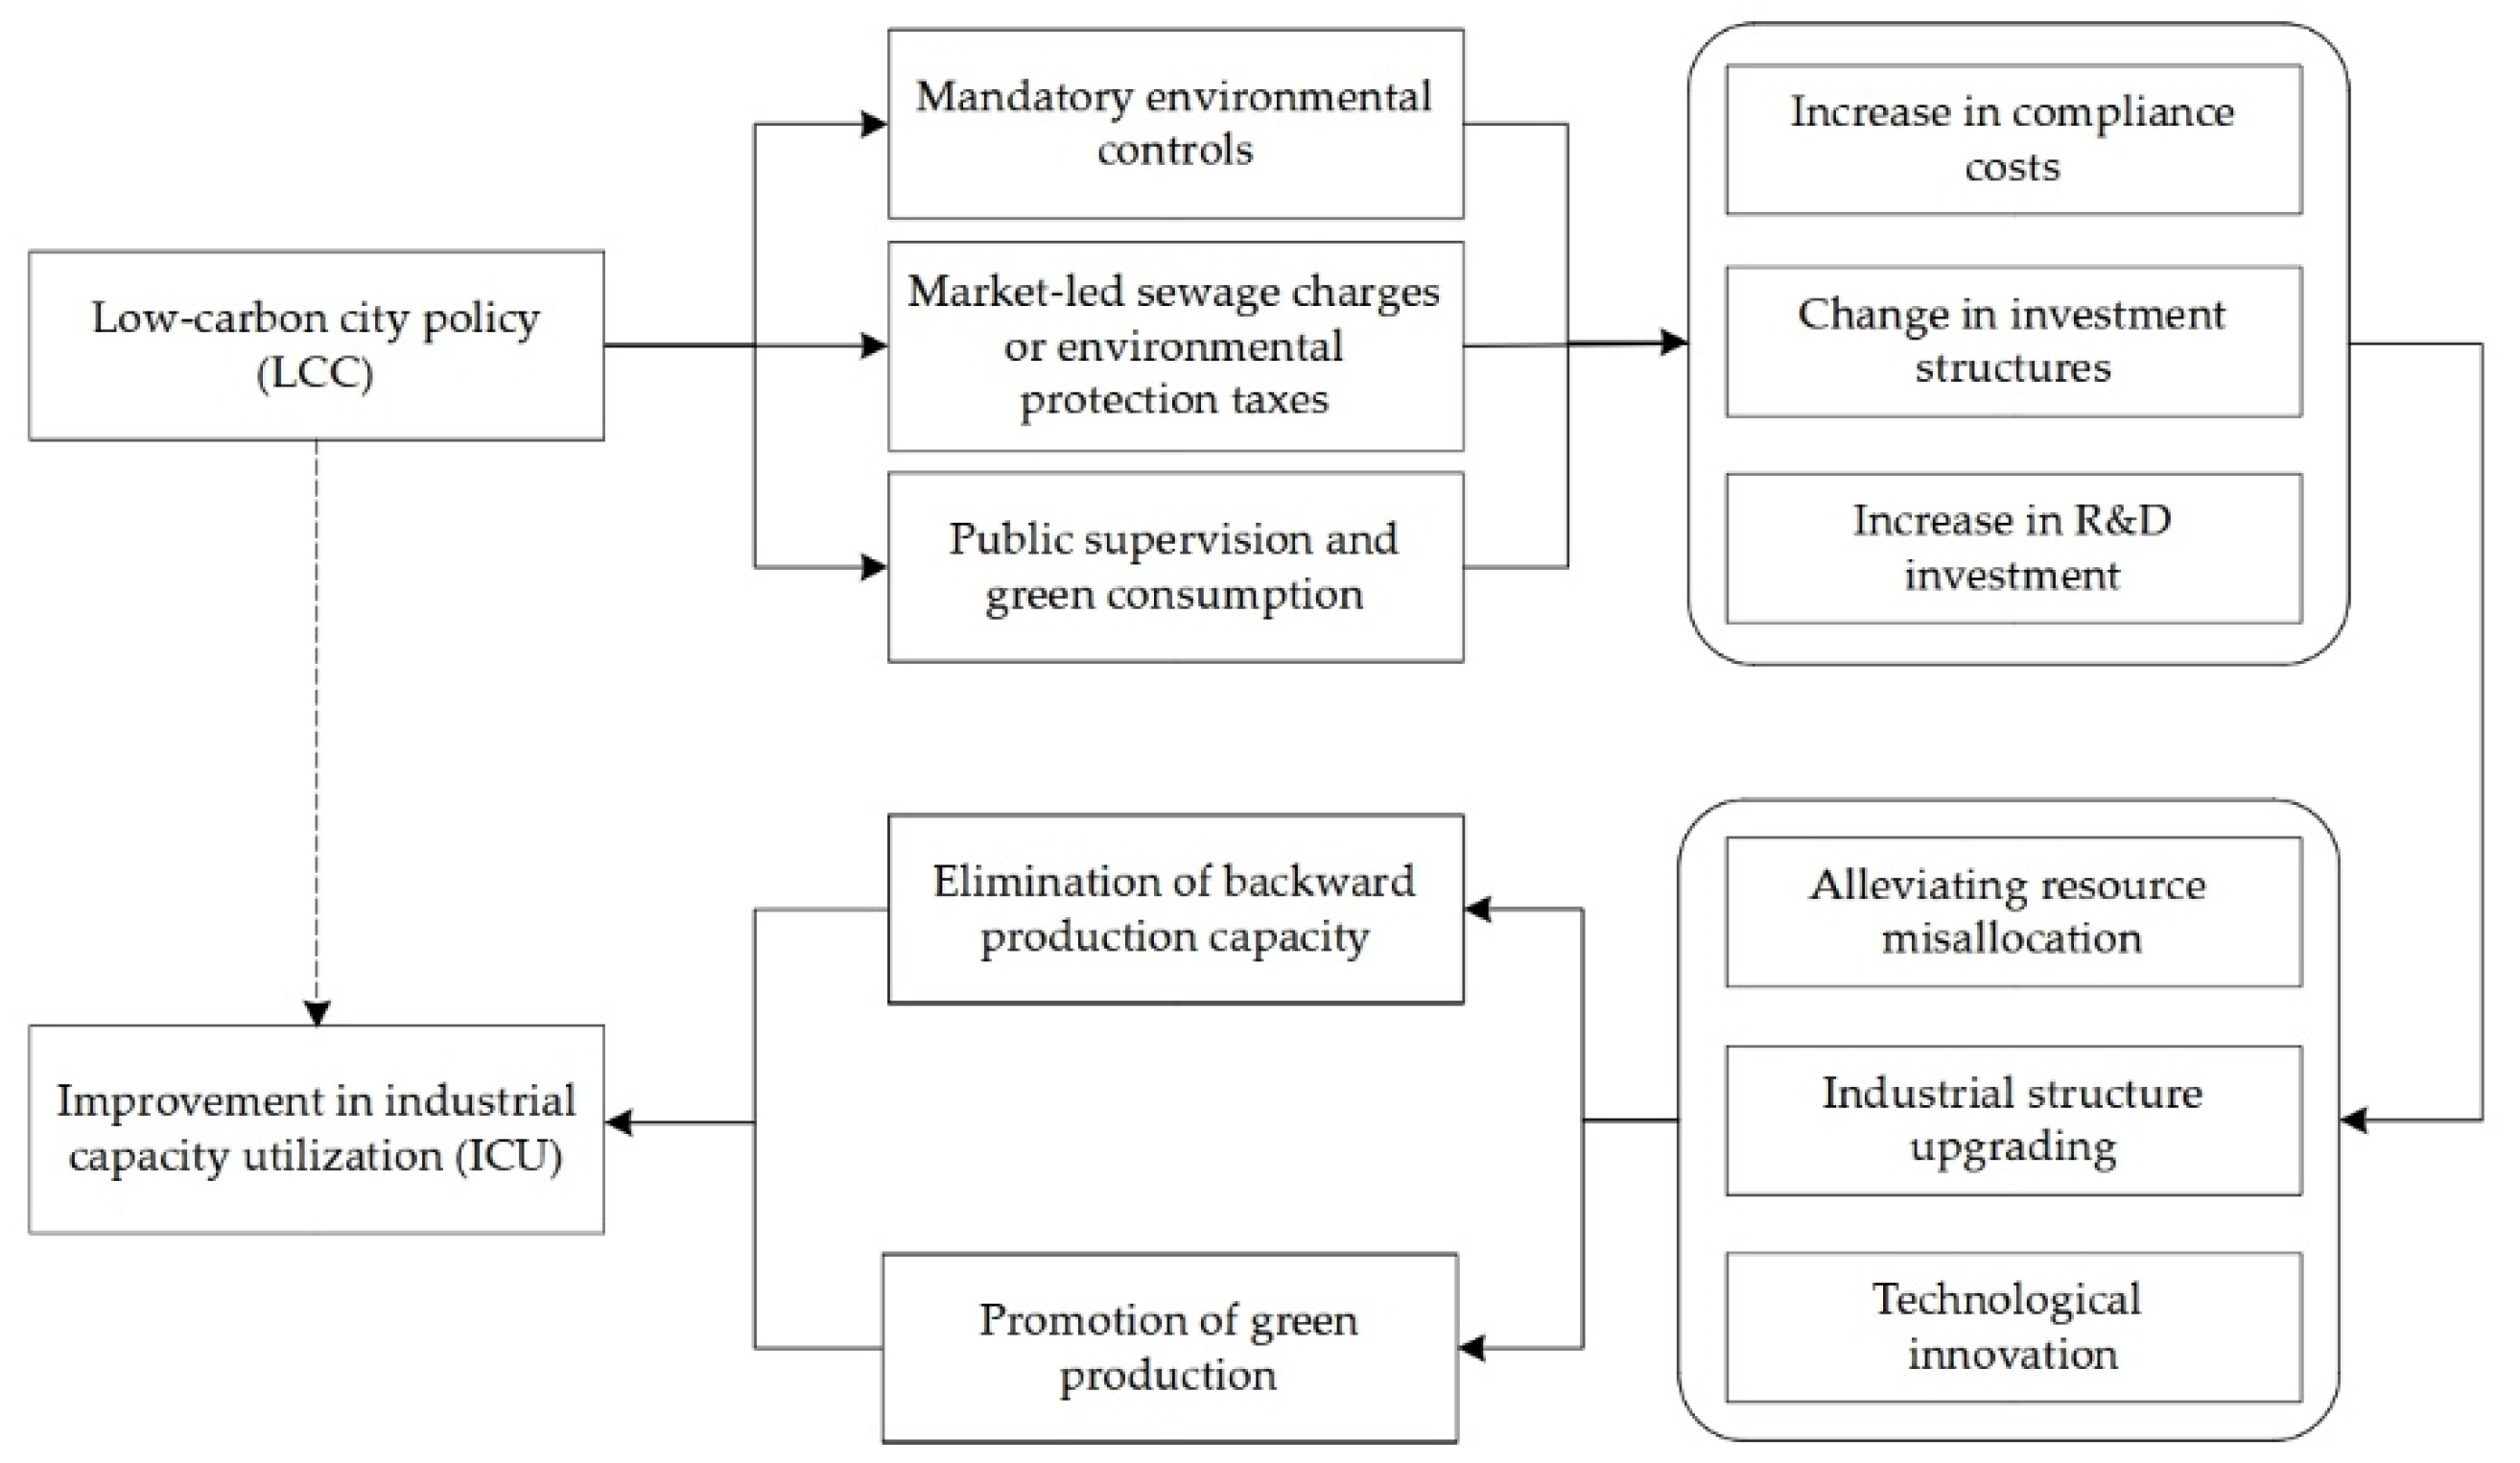
2.2. Theoretical Mechanisms
3. Case Study and Discussion
3.1. Model Setting
3.2. Variable Descriptions
3.2.1. Dependent Variables and Independent Variables
3.2.2. Covariates
3.2.3. Mediators
3.3. Data Method
4. Results Discussion
4.1. Benchmark Regression Results
4.2. Robustness Tests
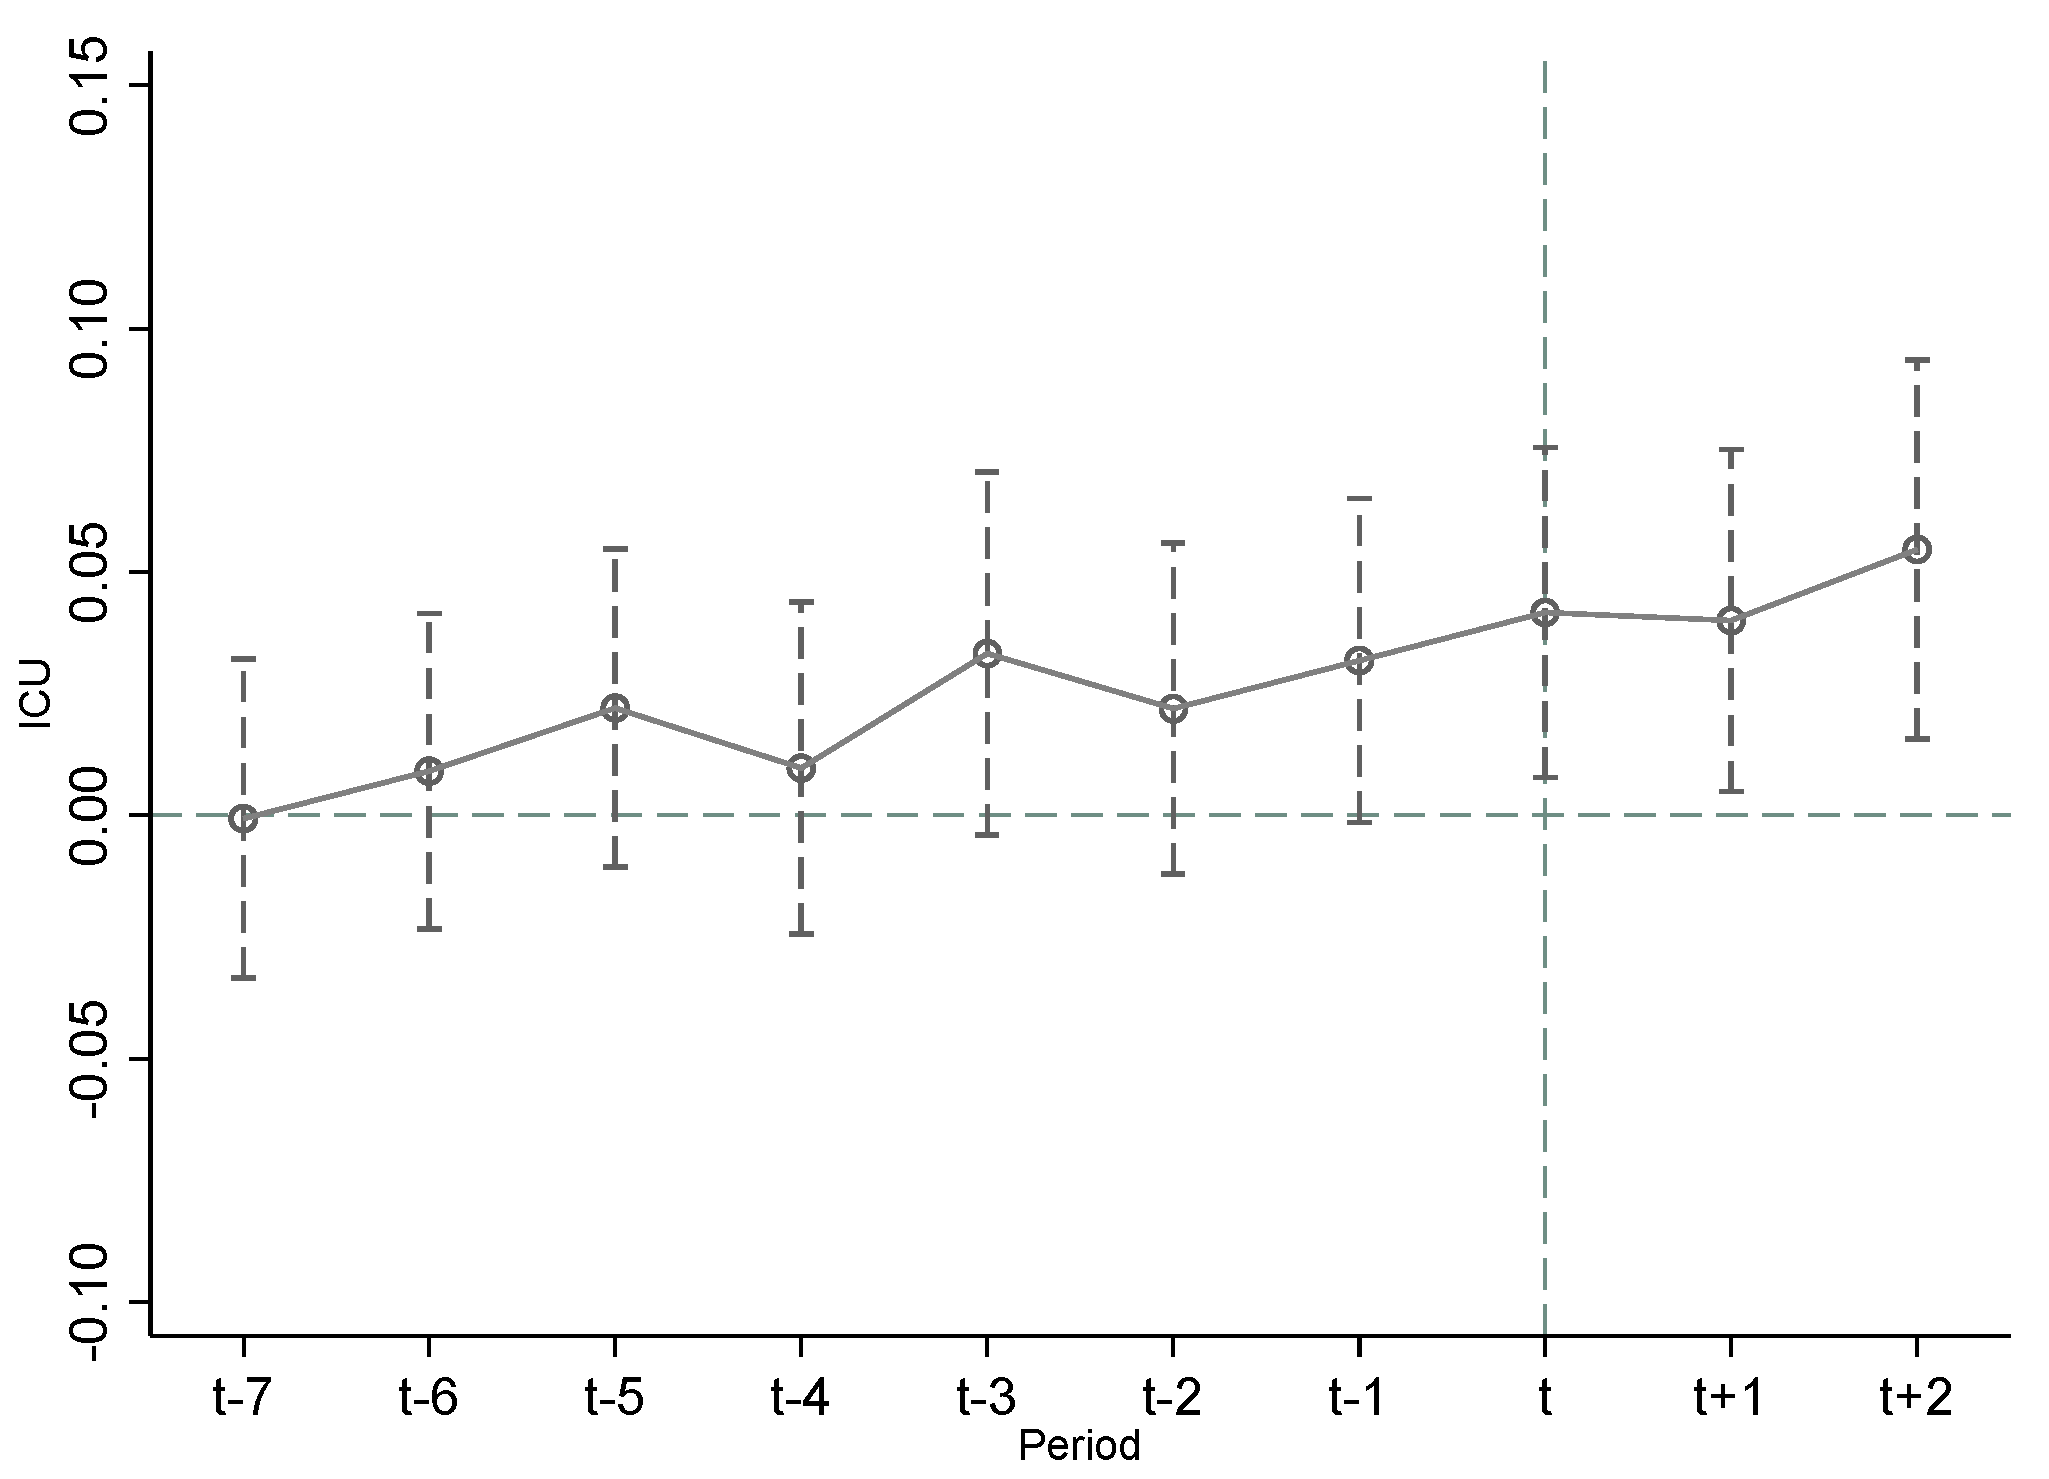
4.2.1. Parallel Trend Test
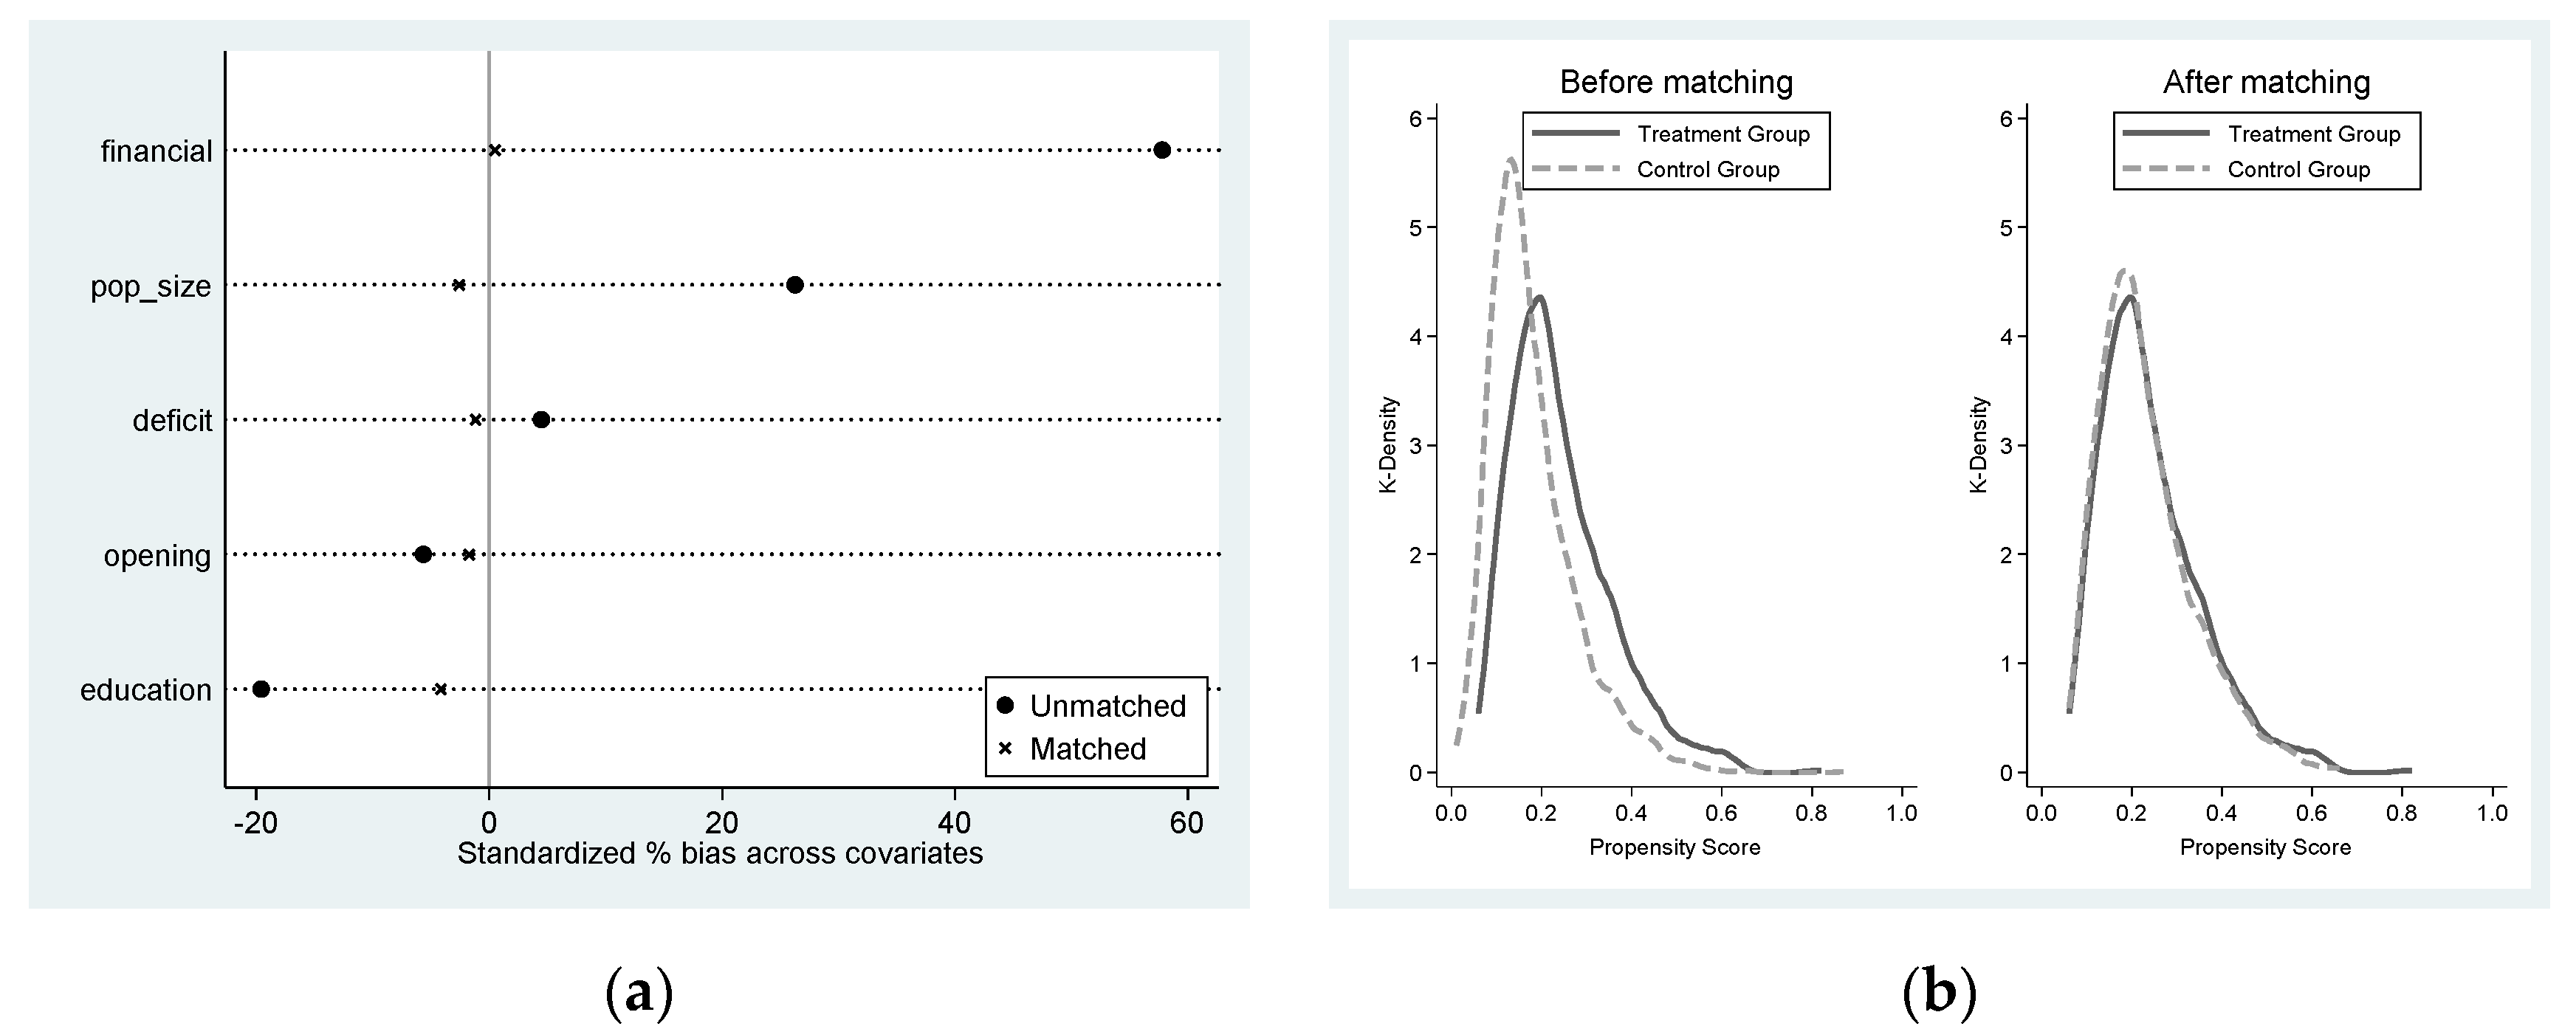
4.2.2. Removing the Control Group Sample Selection Bias: PSM-DID Model
4.2.3. Removing Other Policy Interference: DDD Model
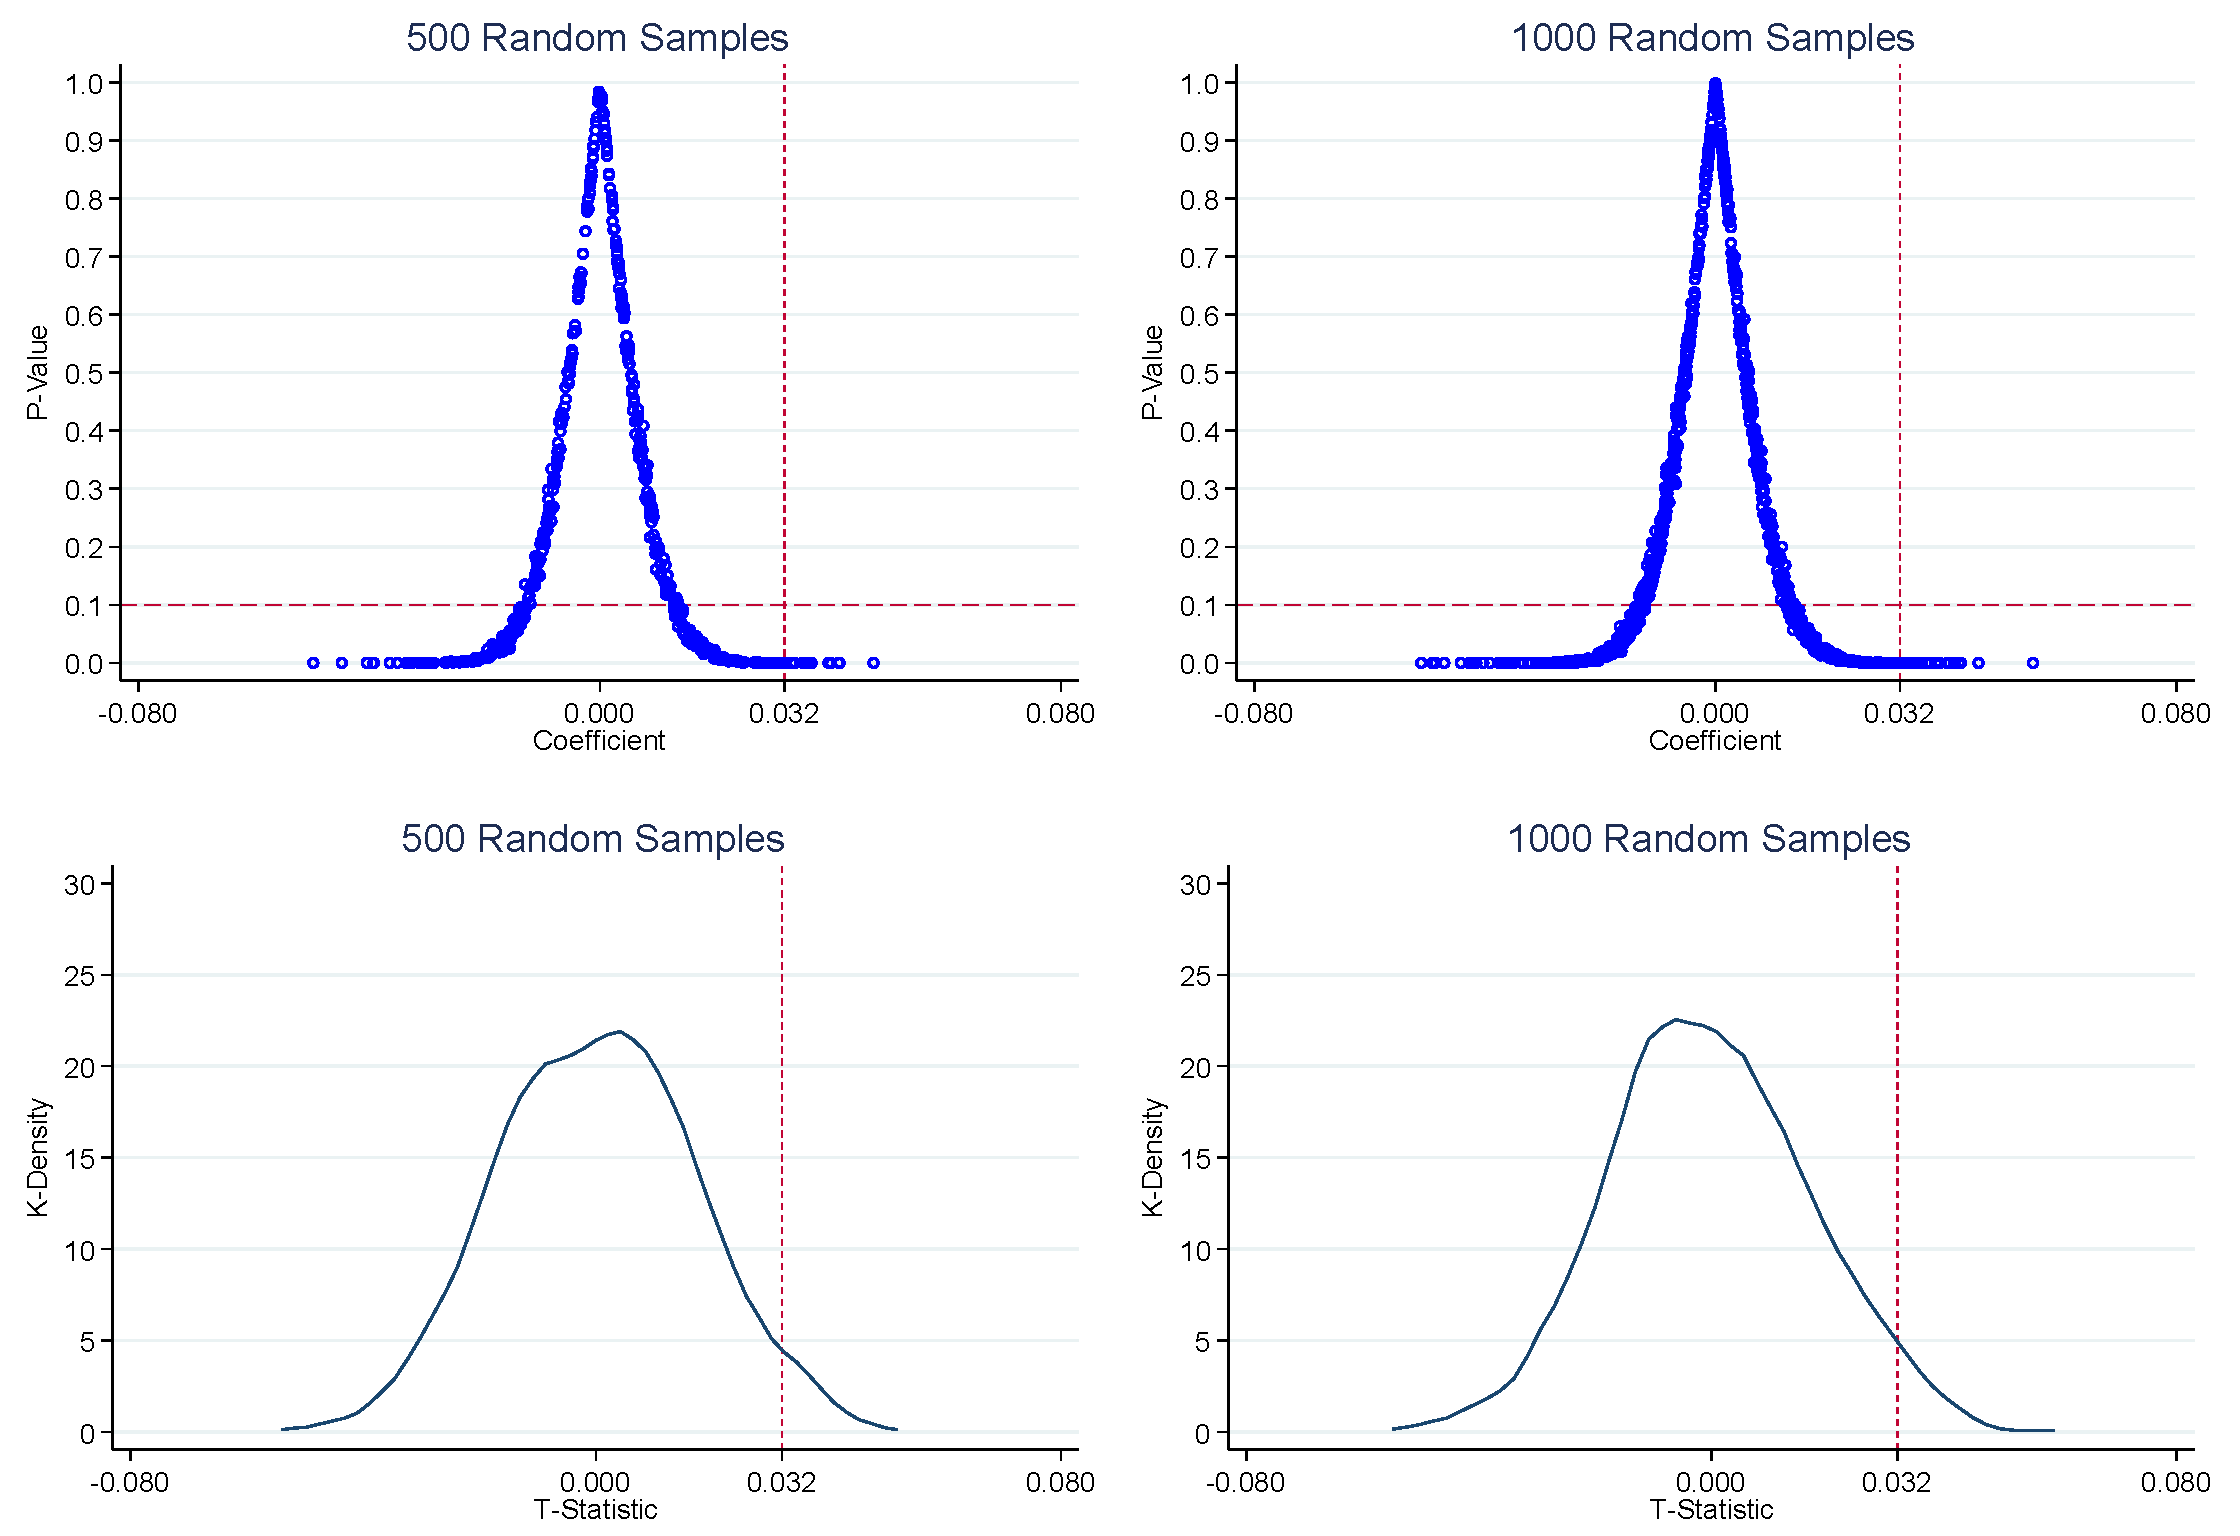
4.2.4. Removing Random Factor Confounding: Placebo Test
4.3. Mechanism Analysis
5. Heterogeneity and Spatial Effect
5.1. Heterogeneity Analysis
5.1.1. Panel Quantile Regression
5.1.2. Grouping Regression
5.2. Spatial Effect Analysis
6. Concluding Remarks
Author Contributions
Funding
Institutional Review Board Statement
Informed Consent Statement
Data Availability Statement
Conflicts of Interest
References
- Soytas, U.; Sari, R. Energy consumption, economic growth, and carbon emissions: Challenges faced by an EU candidate member. Ecol. Econ. 2009, 68, 1667–1675. [Google Scholar] [CrossRef]
- Wang, Q.; Wang, S. Decoupling economic growth from carbon emissions growth in the United States: The role of research and development. J. Clean. Prod. 2019, 234, 702–713. [Google Scholar] [CrossRef]
- Jaffe, A.B.; Peterson, S.R.; Portney, P.R.; Stavins, R.N. Environmental Regulation and the Competitiveness of U.S. Manufacturing: What Does the Evidence Tell Us? J. Econ. Lit. 1995, 33, 132–163. [Google Scholar]
- Wu, H.; Hao, Y.; Ren, S. How do environmental regulation and environmental decentralization affect green total factor energy efficiency: Evidence from China. Energy Econ. 2020, 91, 104880. [Google Scholar] [CrossRef]
- Wu, Z.; Tang, J.; Wang, D. Low Carbon Urban Transitioning in Shenzhen: A Multi-Level Environmental Governance Perspective. Sustainability 2016, 8, 720. [Google Scholar] [CrossRef]
- Huo, W.; Qi, J.; Yang, T.; Liu, J.; Liu, M.; Zhou, Z. Effects of China’s pilot low-carbon city policy on carbon emission reduction: A quasi-natural experiment based on satellite data. Technol. Forecast. Soc. Change 2022, 175, 121422. [Google Scholar] [CrossRef]
- Yao, Y.; Shen, X. Environmental protection and economic efficiency of low-carbon pilot cities in China. Environ. Dev. Sustain. 2021, 23, 18143–18166. [Google Scholar] [CrossRef]
- Liu, T.L.; Song, Q.J.; Lu, J.; Qi, Y. An integrated approach to evaluating the coupling coordination degree between low-carbon development and air quality in Chinese cities. Adv. Clim. Change Res. 2021, 12, 710–722. [Google Scholar] [CrossRef]
- Zheng, J.; Shao, X.; Liu, W.; Kong, J.; Zuo, G. The impact of the pilot program on industrial structure upgrading in low-carbon cities. J. Clean. Prod. 2021, 290, 125868. [Google Scholar] [CrossRef]
- Zhang, H.; Huang, L.; Zhu, Y.; Si, H.; He, X. Does Low-Carbon City Construction Improve Total Factor Productivity? Evidence from a Quasi-Natural Experiment in China. Int. J. Environ. Res. Public. Health 2021, 18, 11974. [Google Scholar] [CrossRef]
- Song, M.; Zhao, X.; Shang, Y. The impact of low-carbon city construction on ecological efficiency: Empirical evidence from quasi-natural experiments. Resour. Conserv. Recycl. 2020, 157, 104777. [Google Scholar] [CrossRef]
- Qiu, S.; Wang, Z.; Liu, S. The policy outcomes of low-carbon city construction on urban green development: Evidence from a quasi-natural experiment conducted in China. Sustain. Cities Soc. 2021, 66, 102699. [Google Scholar] [CrossRef]
- Chen, H.; Guo, W.; Feng, X.; Wei, W.; Liu, H.; Feng, Y.; Gong, W. The impact of low-carbon city pilot policy on the total factor productivity of listed enterprises in China. Resour. Conserv. Recycl. 2021, 169, 105457. [Google Scholar] [CrossRef]
- Ma, J.; Hu, Q.; Shen, W.; Wei, X. Does the Low-Carbon City Pilot Policy Promote Green Technology Innovation? Based on Green Patent Data of Chinese A-Share Listed Companies. Int. J. Environ. Res. Public. Health 2021, 18, 3695. [Google Scholar] [CrossRef]
- Smets, F.; Wouters, R. Shocks and Frictions in US Business Cycles: A Bayesian DSGE Approach. Am. Econ. Rev. 2007, 97, 586–606. [Google Scholar] [CrossRef]
- Schmitt-Grohé, S.; Uribe, M. What’s news in business cycles. Econometrica 2012, 80, 2733–2764. [Google Scholar] [CrossRef]
- Parker, J.A. On Measuring the Effects of Fiscal Policy in Recessions. J. Econ. Lit. 2011, 49, 703–718. [Google Scholar] [CrossRef]
- Cassels, J.M. Excess Capacity and Monopolistic Competition. Q. J. Econ. 1937, 51, 426. [Google Scholar] [CrossRef]
- Klein, L.R. Some Theoretical Issues in the Measurement of Capacity. Econometrica 1960, 28, 272. [Google Scholar] [CrossRef]
- Berndt, E.R.; Morrison, C.J. Capacity Utilization Measures: Underlying Economic Theory and an Alternative Approach. Am. Econ. Rev. 1981, 71, 48–52. [Google Scholar]
- Aigner, D.; Lovell, C.A.K.; Schmidt, P. Formulation and estimation of stochastic frontier production function models. J. Econom. 1977, 6, 21–37. [Google Scholar] [CrossRef]
- Meeusen, W.; van Den Broeck, J. Efficiency Estimation from Cobb-Douglas Production Functions with Composed Error. Int. Econ. Rev. 1977, 18, 435. [Google Scholar] [CrossRef]
- Shaikh, A.M.; Moudud, J.K. Measuring Capacity Utilization in OECD Countries: A Cointegration Method; Working Paper; The Levy Economics Institute of Bard College: Annandale-on-Hudson, NY, USA, 2004. [Google Scholar]
- Fare, R.; Grosskopf, S.; Kokkelenberg, E.C. Measuring Plant Capacity, Utilization and Technical Change: A Nonparametric Approach. Int. Econ. Rev. 1989, 30, 655. [Google Scholar] [CrossRef]
- Dong, M.; Liang, Y.; Zhang, Q. Industrial capacity utilization of China: Industry comparisons, regional gap and affecting factors. Econ. Res. J. 2015, 50, 84–98. [Google Scholar]
- Kirkley, J.; Morrison Paul, C.J.; Squires, D. Capacity and Capacity Utilization in Common-pool Resource Industries. Environ. Resour. Econ. 2002, 22, 71–97. [Google Scholar] [CrossRef]
- Raymond, W. A Perpetual Inventory of National Wealth NBER Studies in Income and Wealth. Natl. Bur. Econ. Res. 1951, 14, 5–61. [Google Scholar]
- Lin, B.; Zhu, J. Fiscal spending and green economic growth: Evidence from China. Energy Econ. 2019, 83, 264–271. [Google Scholar] [CrossRef]
- Cheng, Y.; Shao, T.; Lai, H.; Shen, M.; Li, Y. Total-Factor Eco-Efficiency and Its Influencing Factors in the Yangtze River Delta Urban Agglomeration, China. Int. J. Environ. Res. Public. Health 2019, 16, 3814. [Google Scholar] [CrossRef]
- Crafts, N. Regulation and Productivity Performance. Oxf. Rev. Econ. Policy 2006, 22, 186–202. [Google Scholar] [CrossRef]
- Du, W.; Wang, F.; Li, M. Effects of environmental regulation on capacity utilization: Evidence from energy enterprises in China. Ecol. Indic. 2020, 113, 106217. [Google Scholar] [CrossRef]
- Yu, B.; Shen, C. Environmental regulation and industrial capacity utilization: An empirical study of China. J. Clean. Prod. 2020, 246, 118986. [Google Scholar] [CrossRef]
- Cole, D.H.; Grossman, P.Z. When is command-and-control efficient? Institutions, technology, and the comparative efficiency of alternative regulatory regimes for environmental protection. In The Theory and Practice of Command and Control in Environmental Policy; Routledge: London, UK, 2018; ISBN 1-315-19729-4. [Google Scholar]
- Tang, H.; Liu, J.; Wu, J. The impact of command-and-control environmental regulation on enterprise total factor productivity: A quasi-natural experiment based on China’s “Two Control Zone” policy. J. Clean. Prod. 2020, 254, 120011. [Google Scholar] [CrossRef]
- Yu, X.; Wang, P. Economic effects analysis of environmental regulation policy in the process of industrial structure upgrading: Evidence from Chinese provincial panel data. Sci. Total Environ. 2021, 753, 142004. [Google Scholar] [CrossRef] [PubMed]
- Song, M.; Wang, S.; Zhang, H. Could environmental regulation and R&D tax incentives affect green product innovation? J. Clean. Prod. 2020, 258, 120849. [Google Scholar] [CrossRef]
- Martens1, S. Public participation with Chinese characteristics: Citizen consumers in China’s environmental management. Environ. Polit. 2006, 15, 211–230. [Google Scholar] [CrossRef]
- Goulden, M.; Spence, A.; Wardman, J.; Leygue, C. Differentiating ‘the user’ in DSR: Developing demand side response in advanced economies. Energy Policy 2018, 122, 176–185. [Google Scholar] [CrossRef]
- André, F.J.; Cardenete, M.A.; Velázquez, E. Performing an environmental tax reform in a regional economy. A computable general equilibrium approach. Ann. Reg. Sci. 2005, 39, 375–392. [Google Scholar] [CrossRef]
- Shao, S.; Hu, Z.; Cao, J.; Yang, L.; Guan, D. Environmental Regulation and Enterprise Innovation: A Review. Bus. Strategy Environ. 2020, 29, 1465–1478. [Google Scholar] [CrossRef]
- Porter, M.E.; van der Linde, C. Toward a New Conception of the Environment-Competitiveness Relationship. J. Econ. Perspect. 1995, 9, 97–118. [Google Scholar] [CrossRef]
- Angrist, J.D.; Pischke, J.S. Mostly Harmless Econometrics: An Empiricist’s Companion; Princeton University Press: Princeton, NJ, USA, 2009; ISBN 0-691-12035-8. [Google Scholar]
- Butsic, V.; Lewis, D.J.; Radeloff, V.C.; Baumann, M.; Kuemmerle, T. Quasi-experimental methods enable stronger inferences from observational data in ecology. Basic Appl. Ecol. 2017, 19, 1–10. [Google Scholar] [CrossRef]
- Packalen, M.; Bhattacharya, J. Cities and Ideas; National Bureau of Economic Research: Cambridge, MA, USA, 2015. [Google Scholar] [CrossRef]
- Yan, S.; Peng, J.; Wu, Q. Exploring the non-linear effects of city size on urban industrial land use efficiency: A spatial econometric analysis of cities in eastern China. Land Use Policy 2020, 99, 104944. [Google Scholar] [CrossRef]
- Xu, H.; Jiao, M. City size, industrial structure and urbanization quality—A case study of the Yangtze River Delta urban agglomeration in China. Land Use Policy 2021, 111, 105735. [Google Scholar] [CrossRef]
- Levinson, D. Network Structure and City Size. PLoS ONE 2012, 7, e29721. [Google Scholar] [CrossRef]
- Tavares, A.F.; Carr, J.B. So Close, Yet so Far Away? the Effects of City Size, Density and Growth on Local Civic Participation. J. Urban Aff. 2013, 35, 283–302. [Google Scholar] [CrossRef]
- Godin, A.; Kinsella, S. Leverage, Liquidity and Crisis: A Simulation Study. 2011. [Google Scholar] [CrossRef]
- Hartman, H.C. Deficit-related explanations for the US interest rate conundrum. Appl. Econ. Lett. 2007, 14, 261–265. [Google Scholar] [CrossRef]
- Liu, G.; Zhang, X.; Zhang, W.; Wang, D. The impact of government subsidies on the capacity utilization of zombie firms. Econ. Model. 2019, 83, 51–64. [Google Scholar] [CrossRef]
- Yeo, B.; Grant, D. Exploring the effects of ICTs, workforce, and gender on capacity utilization. Inf. Technol. Dev. 2019, 25, 122–150. [Google Scholar] [CrossRef]
- Zhang, J.; Cai, W.; Philbin, S.P.; Li, H.; Lu, Q.-C.; Ballesteros-Pérez, P.; Yang, G. Measuring the capacity utilization of China’s transportation industry under environmental constraints. Transp. Res. Part Transp. Environ. 2020, 85, 102450. [Google Scholar] [CrossRef]
- Xu, L.; Tan, J. Financial development, industrial structure and natural resource utilization efficiency in China. Resour. Policy 2020, 66, 101642. [Google Scholar] [CrossRef]
- Yang, L.; Ni, M. Is financial development beneficial to improve the efficiency of green development? Evidence from the “Belt and Road” countries. Energy Econ. 2022, 105, 105734. [Google Scholar] [CrossRef]
- Ma, H.; Mei, X.; Tian, Y. The impacts and potential mechanisms of credit support with regard to overcapacity: Based on theoretical and empirical analyses of steel enterprises. Resour. Policy 2020, 68, 101704. [Google Scholar] [CrossRef]
- Damijan, J.P.; Kostevc, Č. Learning-by-Exporting: Continuous Productivity Improvements or Capacity Utilization Effects? Evidence from Slovenian Firms. Rev. World Econ. 2006, 142, 599–614. [Google Scholar] [CrossRef]
- Sun, H.; Liu, Z.; Chen, Y. Foreign direct investment and manufacturing pollution emissions: A perspective from heterogeneous environmental regulation. Sustain. Dev. 2020, 28, 1376–1387. [Google Scholar] [CrossRef]
- Wang, H.; Li, B. Environmental regulations, capacity utilization, and high-quality development of manufacturing: An analysis based on Chinese provincial panel data. Sci. Rep. 2021, 11, 19566. [Google Scholar] [CrossRef]
- Hsieh, C.-T.; Klenow, P.J. Misallocation and Manufacturing TFP in China and India*. Q. J. Econ. 2009, 124, 1403–1448. [Google Scholar] [CrossRef]
- Chen, Y.; Hu, W. Distortions, misallocation and losses: Theory and application. China Econ. Q. 2011, 10, 1401–1422. [Google Scholar] [CrossRef]
- Zhang, Y.J.; Liu, Z.; Zhang, H.; Tan, T.D. The impact of economic growth, industrial structure and urbanization on carbon emission intensity in China. Nat. Hazards 2014, 73, 579–595. [Google Scholar] [CrossRef]
- Li, K.; Lin, B. Economic growth model, structural transformation, and green productivity in China. Appl. Energy 2017, 187, 489–500. [Google Scholar] [CrossRef]
- Qi, Y.; Peng, W.; Xiong, N.N. The Effects of Fiscal and Tax Incentives on Regional Innovation Capability: Text Extraction Based on Python. Mathematics 2020, 8, 1193. [Google Scholar] [CrossRef]
- Kemp, R.; Pontoglio, S. The innovation effects of environmental policy instruments — A typical case of the blind men and the elephant? Ecol. Econ. 2011, 72, 28–36. [Google Scholar] [CrossRef]
- Cantoni, D.; Chen, Y.; Yang, D.Y.; Yuchtman, N.; Zhang, Y.J. Curriculum and Ideology. J. Polit. Econ. 2017, 125, 338–392. [Google Scholar] [CrossRef]
- Zhao, X.; Lynch, J.G.; Chen, Q. Reconsidering Baron and Kenny: Myths and Truths about Mediation Analysis. J. Consum. Res. 2010, 37, 197–206. [Google Scholar] [CrossRef]
- LeSage, J.; Pace, R.K. Introduction to Spatial Econometrics; Chapman and Hall/CRC: New York, NY, USA, 2009; ISBN 0-429-13808-3. [Google Scholar]

| Variable Type. | Variables | Symbol | Measurement |
|---|---|---|---|
| Output Indicators | Real industrial output | y | The total industrial output value above the scale and deflated by the industrial producer ex-factory price index in the province where it is located, using 2003 as a benchmark |
| Input Indicators | Industrial Capital Inputs | K | Fixed capital stock, which is measured using the perpetual inventory method and is deflated by the fixed asset investment price index of the province in which it is located using 2003 as a benchmark |
| Industrial labor input | L | The number of employees in the secondary industry minus the number of employees in the construction industry gives | |
| Industrial Energy Inputs | E | Use of industrial electricity consumption as a proxy variable |
| Test Method | Statistic Type | Statistic Value | p-Value |
|---|---|---|---|
| Kao test | Modified Dickey–Fuller t | 3.188 | 0.001 |
| Pedroni test | Modified Phillips–Perron t | 5.021 | 0.000 |
| Westerlund test | Variance ratio | 3.125 | 0.001 |
| Year | N | p25 | p50 | p75 | Mean | SD |
|---|---|---|---|---|---|---|
| 2003 | 4522 | 0.620 | 0.768 | 0.955 | 0.751 | 0.217 |
| 2004 | 4522 | 0.599 | 0.735 | 0.864 | 0.715 | 0.199 |
| 2005 | 4522 | 0.600 | 0.716 | 0.920 | 0.726 | 0.208 |
| 2006 | 4522 | 0.601 | 0.751 | 0.975 | 0.745 | 0.221 |
| 2007 | 4522 | 0.600 | 0.792 | 0.952 | 0.755 | 0.216 |
| 2008 | 4522 | 0.550 | 0.750 | 0.939 | 0.725 | 0.224 |
| 2009 | 4522 | 0.613 | 0.720 | 0.849 | 0.717 | 0.182 |
| 2010 | 4522 | 0.488 | 0.650 | 0.788 | 0.638 | 0.207 |
| 2011 | 4522 | 0.549 | 0.702 | 0.837 | 0.686 | 0.191 |
| 2012 | 4522 | 0.549 | 0.690 | 0.813 | 0.666 | 0.188 |
| 2013 | 4522 | 0.467 | 0.612 | 0.736 | 0.596 | 0.180 |
| 2014 | 4522 | 0.238 | 0.422 | 0.599 | 0.435 | 0.233 |
| 2015 | 4522 | 0.427 | 0.581 | 0.732 | 0.579 | 0.196 |
| 2016 | 4522 | 0.401 | 0.507 | 0.653 | 0.526 | 0.175 |
| 2017 | 4522 | 0.360 | 0.472 | 0.631 | 0.497 | 0.179 |
| 2018 | 4522 | 0.339 | 0.468 | 0.594 | 0.474 | 0.180 |
| 2019 | 4522 | 0.352 | 0.485 | 0.604 | 0.483 | 0.184 |
| Overall | 4522 | 0.468 | 0.636 | 0.798 | 0.630 | 0.226 |
| Variable Type | Variables | Symbol | Obs | Min | Max | Mean | S.E. |
|---|---|---|---|---|---|---|---|
| Dependent variable | Industrial capacity utilization | IUC | 4522 | 0.106 | 1.000 | 0.630 | 0.226 |
| Independent variable | Low-carbon city policy variable | treat×post | 4522 | 0.000 | 1.000 | 0.196 | 0.397 |
| Covariates | City size | pop_size | 4522 | −7.662 | −1.288 | −3.409 | 0.227 |
| Fiscal deficit | deficit | 4522 | −9.544 | 0.584 | −2.776 | 0.872 | |
| Education level | education | 4522 | −4.032 | −0.705 | −1.725 | 1.049 | |
| Financial development level | financial | 4522 | −0.897 | 3.075 | 0.642 | 0.258 | |
| Opening degree | opening | 4522 | −12.830 | −0.781 | −4.154 | 0.363 | |
| Mediators | Integrated resource misallocation index | misallocation | 4522 | 0.000 | 0.999 | 0.918 | 1.448 |
| Industrial structure upgrading index | upgrade | 4522 | 0.095 | 5.154 | 0.895 | 0.092 | |
| Technological innovation index | innovation | 4522 | 0.000 | 0.207 | 0.013 | 0.471 |
| Variable | (1) | (2) | (3) | (4) |
|---|---|---|---|---|
| ICU | ICU | ICU | ICU | |
| BCC/SBM(VRS) | BCC/SBM(VRS) | Super-SBM(VRS) | Super-SBM(VRS) | |
| treat × post | 0.033 *** | 0.032 *** | 0.037 *** | 0.033 *** |
| (0.007) | (0.007) | (0.007) | (0.007) | |
| pop_size | 0.291 *** | 0.382 *** | ||
| (0.038) | (0.044) | |||
| deficit | 0.001 | 0.003 | ||
| (0.006) | (0.007) | |||
| education | 0.059 *** | 0.078 *** | ||
| (0.014) | (0.015) | |||
| financial | 0.045 *** | 0.038 ** | ||
| (0.014) | (0.015) | |||
| opening | 0.005 * | 0.004 | ||
| (0.002) | (0.003) | |||
| _cons | 0.623 *** | 1.705 *** | 0.614 *** | 2.049 *** |
| (0.002) | (0.136) | (0.002) | (0.162) | |
| Covariant | No | Yes | No | Yes |
| Year-FE | Yes | Yes | Yes | Yes |
| City-FE | Yes | Yes | Yes | Yes |
| N | 4522 | 4522 | 4522 | 4522 |
| R-squared | 0.757 | 0.763 | 0.740 | 0.750 |
| Variable | (1) | (2) | (3) | (4) |
|---|---|---|---|---|
| ICU | ICU | ICU | ICU | |
| PSM-DID | PSM-DID | DDD | DDD | |
| treat × post | 0.034 *** | 0.033 *** | ||
| (0.007) | (0.007) | |||
| treat × post × group | 0.118 *** | 0.105 *** | ||
| (0.010) | (0.010) | |||
| pop_size | 0.309 *** | 0.253 *** | ||
| (0.039) | (0.040) | |||
| deficit | 0.002 | −0.002 | ||
| (0.006) | (0.005) | |||
| education | 0.061 *** | 0.047 *** | ||
| (0.015) | (0.014) | |||
| financial | 0.042 *** | 0.047 *** | ||
| (0.015) | (0.014) | |||
| opening | 0.003 | 0.004 * | ||
| (0.002) | (0.002) | |||
| _cons | 0.624 *** | 1.755 *** | 0.623 *** | 1.547 *** |
| (0.002) | (0.137) | (0.002) | (0.139) | |
| Covariant | No | Yes | No | Yes |
| Year-FE | Yes | Yes | Yes | Yes |
| City-FE | Yes | Yes | Yes | Yes |
| Group-FE | No | No | Yes | Yes |
| N | 4461 | 4461 | 4522 | 4522 |
| R-squared | 0.757 | 0.764 | 0.761 | 0.766 |
| Variable | Alleviating Resource Misallocation | Industrial Structure Upgrading | Technology Innovation | |||
|---|---|---|---|---|---|---|
| (1) | (2) | (3) | (4) | (5) | (6) | |
| Misallocation | ICU | Upgrade | ICU | Innovation | ICU | |
| treat × post | −0.011 *** | 0.026 *** | 0.046 *** | 0.031 *** | 0.003 *** | 0.028 *** |
| (0.001) | (0.007) | (0.012) | (0.007) | (0.001) | (0.007) | |
| misallocation | −0.558 *** | |||||
| (0.069) | ||||||
| upgrade | 0.026 *** | |||||
| (0.009) | ||||||
| innovation | 1.312 *** | |||||
| (0.331) | ||||||
| pop_size | −0.075 *** | 0.249 *** | 0.151 * | 0.287 *** | 0.018 *** | 0.267 *** |
| (0.016) | (0.038) | (0.087) | (0.039) | (0.006) | (0.040) | |
| deficit | 0.001 | 0.001 | −0.010 | 0.000 | −0.001 | 0.002 |
| (0.002) | (0.006) | (0.009) | (0.006) | (0.001) | (0.006) | |
| education | −0.021 *** | 0.047 *** | 0.140 *** | 0.055 *** | 0.006 * | 0.051 *** |
| (0.004) | (0.014) | (0.025) | (0.015) | (0.003) | (0.016) | |
| financial | −0.004 | 0.043 *** | 0.389 *** | 0.035 ** | −0.005 *** | 0.051 *** |
| (0.004) | (0.014) | (0.035) | (0.015) | (0.001) | (0.014) | |
| opening | −0.000 | 0.004 * | −0.005 | 0.005 * | 0.000 * | 0.004 * |
| (0.000) | (0.002) | (0.006) | (0.002) | (0.000) | (0.002) | |
| _cons | 0.635 *** | 2.060 *** | 1.342 *** | 1.671 *** | 0.086 *** | 1.592 *** |
| (0.054) | (0.137) | (0.315) | (0.138) | (0.021) | (0.144) | |
| Covariant | Yes | Yes | Yes | Yes | Yes | Yes |
| Year−FE | Yes | Yes | Yes | Yes | Yes | Yes |
| City−FE | Yes | Yes | Yes | Yes | Yes | Yes |
| N | 4522 | 4522 | 4522 | 4522 | 4522 | 4522 |
| R−squared | 0.933 | 0.766 | 0.822 | 0.763 | 0.670 | 0.765 |
| Variable | (1) | (2) | (3) | (4) | (5) |
|---|---|---|---|---|---|
| P10 | P25 | P50 | P75 | P90 | |
| ICU | ICU | ICU | ICU | ICU | |
| treat × post | 0.023 | 0.026 ** | 0.032 *** | 0.038 ** | 0.041 * |
| (0.017) | (0.013) | (0.011) | (0.017) | (0.022) | |
| pop_size | 0.379 *** | 0.345 *** | 0.289 *** | 0.236 *** | 0.204 * |
| (0.093) | (0.069) | (0.059) | (0.091) | (0.119) | |
| deficit | 0.002 | 0.001 | 0.000 | −0.001 | −0.002 |
| (0.013) | (0.010) | (0.009) | (0.013) | (0.017) | |
| education | 0.048 | 0.052 ** | 0.059 *** | 0.066 * | 0.070 |
| (0.034) | (0.026) | (0.022) | (0.034) | (0.044) | |
| financial | 0.055 | 0.051 * | 0.045 ** | 0.039 | 0.036 |
| (0.035) | (0.026) | (0.023) | (0.035) | (0.045) | |
| opening | 0.003 | 0.003 | 0.005 | 0.006 | 0.006 |
| (0.006) | (0.005) | (0.004) | (0.006) | (0.008) | |
| Covariant | Yes | Yes | Yes | Yes | Yes |
| Year-FE | Yes | Yes | Yes | Yes | Yes |
| City-FE | Yes | Yes | Yes | Yes | Yes |
| N | 4522 | 4522 | 4522 | 4522 | 4522 |
| Variable | (1) | (2) | (3) | (4) | (5) | (6) |
|---|---|---|---|---|---|---|
| OIB | Non-OIB | B&R | Non-B&R | FTZ | Non-FTZ | |
| ICU | ICU | ICU | ICU | ICU | ICU | |
| treat×post | 0.051 *** | 0.026 *** | 0.067 *** | 0.010 | 0.066 *** | 0.016 ** |
| (0.009) | (0.009) | (0.010) | (0.009) | (0.013) | (0.008) | |
| pop_size | 0.457 *** | 0.104 ** | 0.312 *** | 0.231 *** | 0.101 ** | 0.326 *** |
| (0.058) | (0.048) | (0.049) | (0.063) | (0.045) | (0.055) | |
| deficit | 0.002 | 0.005 | −0.005 | 0.009 | 0.003 | −0.002 |
| (0.008) | (0.008) | (0.008) | (0.007) | (0.007) | (0.008) | |
| education | 0.092 *** | 0.085 *** | 0.054 ** | 0.032 ** | 0.041 | 0.052 *** |
| (0.018) | (0.020) | (0.025) | (0.016) | (0.032) | (0.016) | |
| financial | −0.013 | 0.059 *** | 0.041 ** | 0.033 * | −0.004 | 0.067 *** |
| (0.019) | (0.021) | (0.020) | (0.019) | (0.038) | (0.017) | |
| opening | 0.002 | 0.010 *** | 0.004 | 0.003 | 0.016 * | 0.002 |
| (0.003) | (0.004) | (0.003) | (0.004) | (0.010) | (0.002) | |
| _cons | 2.427 *** | 1.090 *** | 1.868 *** | 1.414 *** | 1.060 *** | 1.817 *** |
| (0.208) | (0.168) | (0.192) | (0.198) | (0.156) | (0.200) | |
| Covariant | Yes | Yes | Yes | Yes | Yes | Yes |
| Year−FE | Yes | Yes | Yes | Yes | Yes | Yes |
| City−FE | Yes | Yes | Yes | Yes | Yes | Yes |
| N | 1884 | 2581 | 2024 | 2441 | 756 | 3709 |
| R-squared | 0.785 | 0.737 | 0.759 | 0.777 | 0.813 | 0.764 |
| Year | Local Moran’s I | E.V. | S.E. | Z-Statistic | p-Value |
|---|---|---|---|---|---|
| 2003 | 0.198 | −0.004 | 0.042 | 4.762 | 0.000 |
| 2004 | 0.195 | −0.004 | 0.042 | 4.706 | 0.000 |
| 2005 | 0.173 | −0.004 | 0.042 | 4.180 | 0.000 |
| 2006 | 0.203 | −0.004 | 0.042 | 4.887 | 0.000 |
| 2007 | 0.153 | −0.004 | 0.042 | 3.702 | 0.000 |
| 2008 | 0.148 | −0.004 | 0.042 | 3.582 | 0.000 |
| 2009 | 0.087 | −0.004 | 0.042 | 2.133 | 0.033 |
| 2010 | 0.123 | −0.004 | 0.042 | 2.997 | 0.003 |
| 2011 | 0.175 | −0.004 | 0.042 | 4.224 | 0.000 |
| 2012 | 0.203 | −0.004 | 0.042 | 4.887 | 0.000 |
| 2013 | 0.302 | −0.004 | 0.042 | 7.232 | 0.000 |
| 2014 | 0.340 | −0.004 | 0.042 | 8.123 | 0.000 |
| 2015 | 0.204 | −0.004 | 0.042 | 4.913 | 0.000 |
| 2016 | 0.252 | −0.004 | 0.042 | 6.054 | 0.000 |
| 2017 | 0.256 | −0.004 | 0.042 | 6.131 | 0.000 |
| 2018 | 0.256 | −0.004 | 0.042 | 6.150 | 0.000 |
| 2019 | 0.275 | −0.004 | 0.042 | 6.595 | 0.000 |
| Global Moran’s I | 0.358 | −0.000 | 0.010 | 36.878 | 0.000 |
| Effect Type | Variable | (1) | (2) | (3) | (4) |
|---|---|---|---|---|---|
| ICU | ICU | ICU | ICU | ||
| Adjacency Matrix | Adjacency Matrix | Economic Matrix | Economic Matrix | ||
| Direct effect | treat × post | 0.025 ** | 0.025 ** | 0.030 ** | 0.029 ** |
| pop_size | 0.250 *** | 0.289 *** | |||
| deficit | 0.001 | 0.001 | |||
| education | 0.039 | 0.056 ** | |||
| financial | 0.029 | 0.039 | |||
| opening | 0.005 * | 0.005 * | |||
| Indirect effect | treat × post | 0.012 * | 0.011 * | 0.009 * | 0.009 * |
| pop_size | 0.113 | 0.090 ** | |||
| deficit | 0.001 | 0.001 | |||
| education | 0.018 * | 0.017 * | |||
| financial | 0.013 | 0.012 | |||
| opening | 0.002 * | 0.001 | |||
| Total effect | treat × post | 0.037 ** | 0.036 ** | 0.039 ** | 0.038 ** |
| pop_size | 0.362 *** | 0.379 *** | |||
| deficit | 0.002 | 0.002 | |||
| education | 0.056 * | 0.074 ** | |||
| financial | 0.043 | 0.052 | |||
| opening | 0.008 * | 0.007 * | |||
| Covariant | No | Yes | No | Yes | |
| Year-FE | Yes | Yes | Yes | Yes | |
| City-FE | Yes | Yes | Yes | Yes | |
| N | 4461 | 4461 | 4522 | 4522 | |
Publisher’s Note: MDPI stays neutral with regard to jurisdictional claims in published maps and institutional affiliations. |
© 2022 by the authors. Licensee MDPI, Basel, Switzerland. This article is an open access article distributed under the terms and conditions of the Creative Commons Attribution (CC BY) license (https://creativecommons.org/licenses/by/4.0/).
Share and Cite
Han, Z.; Wang, L.; Zhao, F.; Mao, Z. Does Low-Carbon City Policy Improve Industrial Capacity Utilization? Evidence from a Quasi-Natural Experiment in China. Sustainability 2022, 14, 10941. https://doi.org/10.3390/su141710941
Han Z, Wang L, Zhao F, Mao Z. Does Low-Carbon City Policy Improve Industrial Capacity Utilization? Evidence from a Quasi-Natural Experiment in China. Sustainability. 2022; 14(17):10941. https://doi.org/10.3390/su141710941
Chicago/Turabian StyleHan, Zhipeng, Liguo Wang, Feifei Zhao, and Zijun Mao. 2022. "Does Low-Carbon City Policy Improve Industrial Capacity Utilization? Evidence from a Quasi-Natural Experiment in China" Sustainability 14, no. 17: 10941. https://doi.org/10.3390/su141710941
APA StyleHan, Z., Wang, L., Zhao, F., & Mao, Z. (2022). Does Low-Carbon City Policy Improve Industrial Capacity Utilization? Evidence from a Quasi-Natural Experiment in China. Sustainability, 14(17), 10941. https://doi.org/10.3390/su141710941