Article

Are There Differences in Thermal Comfort Perception of Children in Comparison to Their Caregivers’ Judgments? A Study on the Playgrounds of Parks in China’s Hot Summer and Cold Winter Region

1
School of Urban Design, Wuhan University, Wuhan 430072, China
2
School of Design, Jianghan University, Wuhan 430056, China
*
Author to whom correspondence should be addressed.
Sustainability 2022, 14(17), 10926; https://doi.org/10.3390/su141710926
Submission received: 26 July 2022 / Revised: 18 August 2022 / Accepted: 27 August 2022 / Published: 1 September 2022

Abstract

:
Playgrounds in urban parks are important for children’s physical and mental health, but global warming has led to a worsening outdoor environment and children’s outdoor activities have been affected. Improving the outdoor thermal comfort (OTC) of playgrounds can encourage children to engage in more and safer outdoor activities. However, there are a limited number of studies focusing on preschoolers’ outdoor thermal comfort (OTC) and most of them have substituted children’s thermal comfort with caregivers’ evaluations. To investigate the differences between children’s and caregivers’ evaluations of thermal sensation, thermal benchmarks and thermal adaptive behavior for children, we conducted meteorological measurements on representative playgrounds in three parks in Wuhan, China, and administered thermal perception questionnaires to preschool children and their caregivers. In addition, the Physiological Equivalent Temperature (PET) was used to establish evaluation criteria for children’s OTC and to make recommendations for the improvement of the playground environment. We draw five conclusions by analyzing 719 valid questionnaires: (1) Children were less sensitive to changes in meteorological factors than caregivers and had better tolerance of cold environments. (2) The NPET for preschoolers was evaluated by children and by caregivers, respectively, as 22.9 °C and 22.3 °C in summer and 10.6 °C and 11.2 °C in winter. (3) Playgrounds in Wuhan’s parks are uncomfortable for a long time in summer and a short time in winter. (4) Both children and caregivers want to improve summer comfort by lowering the temperature and winter comfort by increasing solar radiation. At the same time, children and caregivers show different preferences in adaptive behavior choices. (5) Adding deciduous trees and water play facilities can improve the site thermal environment. Furthermore, the OTC of humans can be improved by adding more service facilities on playgrounds.

1. Introduction

The playgrounds in urban parks provide children with a place to play outdoors, which is important for children’s physical and mental health [1,2]. Regular outdoor activities not only reduce childhood obesity rates and strengthen skeletal development [3,4], but also promote healthy growth of children’s cognition and their emotional and behavioral resilience [5,6]. However, global warming has made the outdoor environment harsher and the number of reports related to thermal injuries in children is on the rise [7,8,9]. Children, as an environmentally sensitive group, are also spending less time outdoors under the influence of their caregivers [10,11]. Therefore, improving OTC to provide comfortable outdoor play areas and increasing children’s outdoor activity time is receiving attention [12].
Although scholars have realized that thermal comfort has an important significance for children’s outdoor activities, the existing thermal comfort standards were developed to evaluate indoor or occupational environments’ thermal comfort for adults [13,14,15,16], and the applicability to children’s groups needs more in-depth research [12]. Currently, research on children’s thermal environment is mostly conducted in kindergartens and schoolyards. Due to children’s limited comprehension, research has mostly been conducted to construct children’s indoor thermal sensation and thermal standards through caregivers’ evaluation of children’s thermal sensation [17,18,19]. Moreover, there are few studies on the thermal sensation and thermal criteria of children’s outdoor activity environment. Vanos et al. used the COMFA (Comfort Formula) model to study children aged 9–13 years and found that children’s perception of “thermal comfort” may be different from that of adults due to experiential and cognitive limitations [20]. Huang et al. determined thermal benchmarks for children’s parks in cold regions of China using the universal thermal climate index (UTCI) combined with the results of a questionnaire survey of children (4–13 years old, mean age 9 years old) [21]. Liu et al. in a study compared the effects of heat stress on natural and artificial turf on the outdoor activities of seven-year-old children [22].
Through the above analysis, thermal comfort is significant for children’s outdoor activities. Most of the existing studies focus on older children, and there is a lack of relevant studies on preschool children aged 3–6 years old. Therefore, it is an urgent need to establish corresponding “thermal comfort” evaluation criteria. In previous studies of OTC, the thermal environment is evaluated either by the caregiver or by the child. However, their physical fitness, cognitive competence and social experiences are diverse. As a result, is the child’s own evaluation of thermal sensations different from the caregiver’s judgment towards the child about it? And is the child’s own adaptation preferences choice for the thermal environment different from the caregiver’s choice for them? We need to interview them simultaneously to establish more comprehensive criteria for evaluating children’s OTC and to make recommendations for thermal environment improvement.
To this end, we selected seven sites in children’s activity spaces in three city parks in Wuhan for climate monitoring in winter and summer, and also conducted a questionnaire survey of the group of children most frequently using these spaces (preschoolers aged 3–6) and their caregivers to study the thermal comfort of children’s outdoor activity spaces in hot summer and cold winter areas. We have three research objectives: (1) To study the differences in heat evaluation, heat benchmarking and adaptive preferences among children themselves and among their caregivers. (2) To establish a thermal benchmark applicable to children aged 3–6 years and evaluate the thermal comfort of the playground in Wuhan Park utilizing the thermal calendars approach. (3) To propose site optimization strategies based on the results of climate adaptation selection preferences. Our study will reveal the differences between the judgements of caregivers and children’s own assessments about outdoor space thermal evaluations and adaptive behaviors. We also provide guidance and suggestions for improving the thermal comfort of children’s outdoor spaces in hot summer and cold winter areas in China.

2. Methods

2.1. Study Sites

Wuhan is located in central China, at the confluence of the Yangtze and Han rivers, and has four distinct seasons, cold winters and hot summers. In the Köppen climate classification, Wuhan belongs to the Humid Subtropical (Cfa) climate zone [23]. It belongs to the Hot Summer Cold Winter (HSCW) region in China’s climate classification for construction. The four seasons are divided based on the pentad temperature (average temperature of each five days); the Wuhan summer (pentad temperature ≥ 22 °C) lasts up to 131 days, winter (pentad temperature < 10 °C) up to 111 days, spring and autumn (pentad temperature 10~22 °C) about 60 days each, so winter and summer take up about 2/3 of the year [24]. According to meteorological data from 2000–2021, July is the hottest month with a mean temperature of 33.47 °C, and January is the coldest month with a mean temperature of 8.34 °C. The mean humidity of each month ranges from 72.69% to 77.94%.
The survey was conducted on seven children’s playgrounds, which are located in Shahu Park (114°33’52″ E, 30°57′44″ N), Wangjiadun Park (114°24′36″ E, 30°61′ N) and Zhangzhidong Sports Park (114°23′49″ E, 30°56′ N). The three parks are popular sites for children’s outdoor activities in Wuhan, are located in Wuchang, Hankou and Hanyang, and contain different substrate types and spatial structures, which can avoid biased results from research on a single type of site (Figure 1 and Table 1).

2.2. Experimental Design

2.2.1. Survey Time

The fieldwork for this study was conducted in the summer and winter seasons. Due to the high temperatures in June, July and August, few children were doing outdoor activities, so the summer research was conducted in September 2021 (12, 18, 20 September), as shown in Table 1. The winter research was conducted in January 2022 (2, 3, 8, 9,15 January), the coldest month. Both winter and summer research was conducted on weekends or holidays, with daily research hours from 9:30 to 19:00 in summer and 9:30 to 17:30 in winter.

2.2.2. Meteorological Measurement

In this field survey, the meteorological factors related to thermal comfort were monitored, including air temperature (Ta), relative humidity (RH), globe temperature (Tg) and wind velocity (Va) [25,26]. Temperature and humidity were recorded using the WAZY-1 temperature and relative humidity self-register, globe temperature was recorded using the AZ87786 heat index meter, and wind speed was recorded using the UT363 BT anemometer. The above instruments are in accordance with ISO 7726 standard, GB/T 40233-2021, and the specific instrument parameters are shown in Table 2.
All instruments were set up in advance in the center of the site (as shown in the figure) and pre-run for half an hour before starting the monitoring to reduce measurement errors [27]. The subjects of this study were children aged 3–6 years, so the instruments were set up at a height of 1 m above the ground to measure the perceived thermal environment of the children [21]. The sampling interval set for all instruments was 1 min.
Mean radiant temperature (Tmrt) is an important factor affecting human thermal comfort. It is an equivalent surface temperature that summarizes the effect of all the different short and longwave radiation fluxes. Tmrt can be calculated from measured climate parameters by the following formula [28]:
Tmrt = [ ( T g + 273.15 ) 4 + 1.10 × 10 8 V a 0.6 ε D 0.4 ( T g T a ) ] 1 4 273.15
where D is the globe diameter (D = 0.075 m in this study) and ε is the emissivity (ε = 0.95 for a black globe).

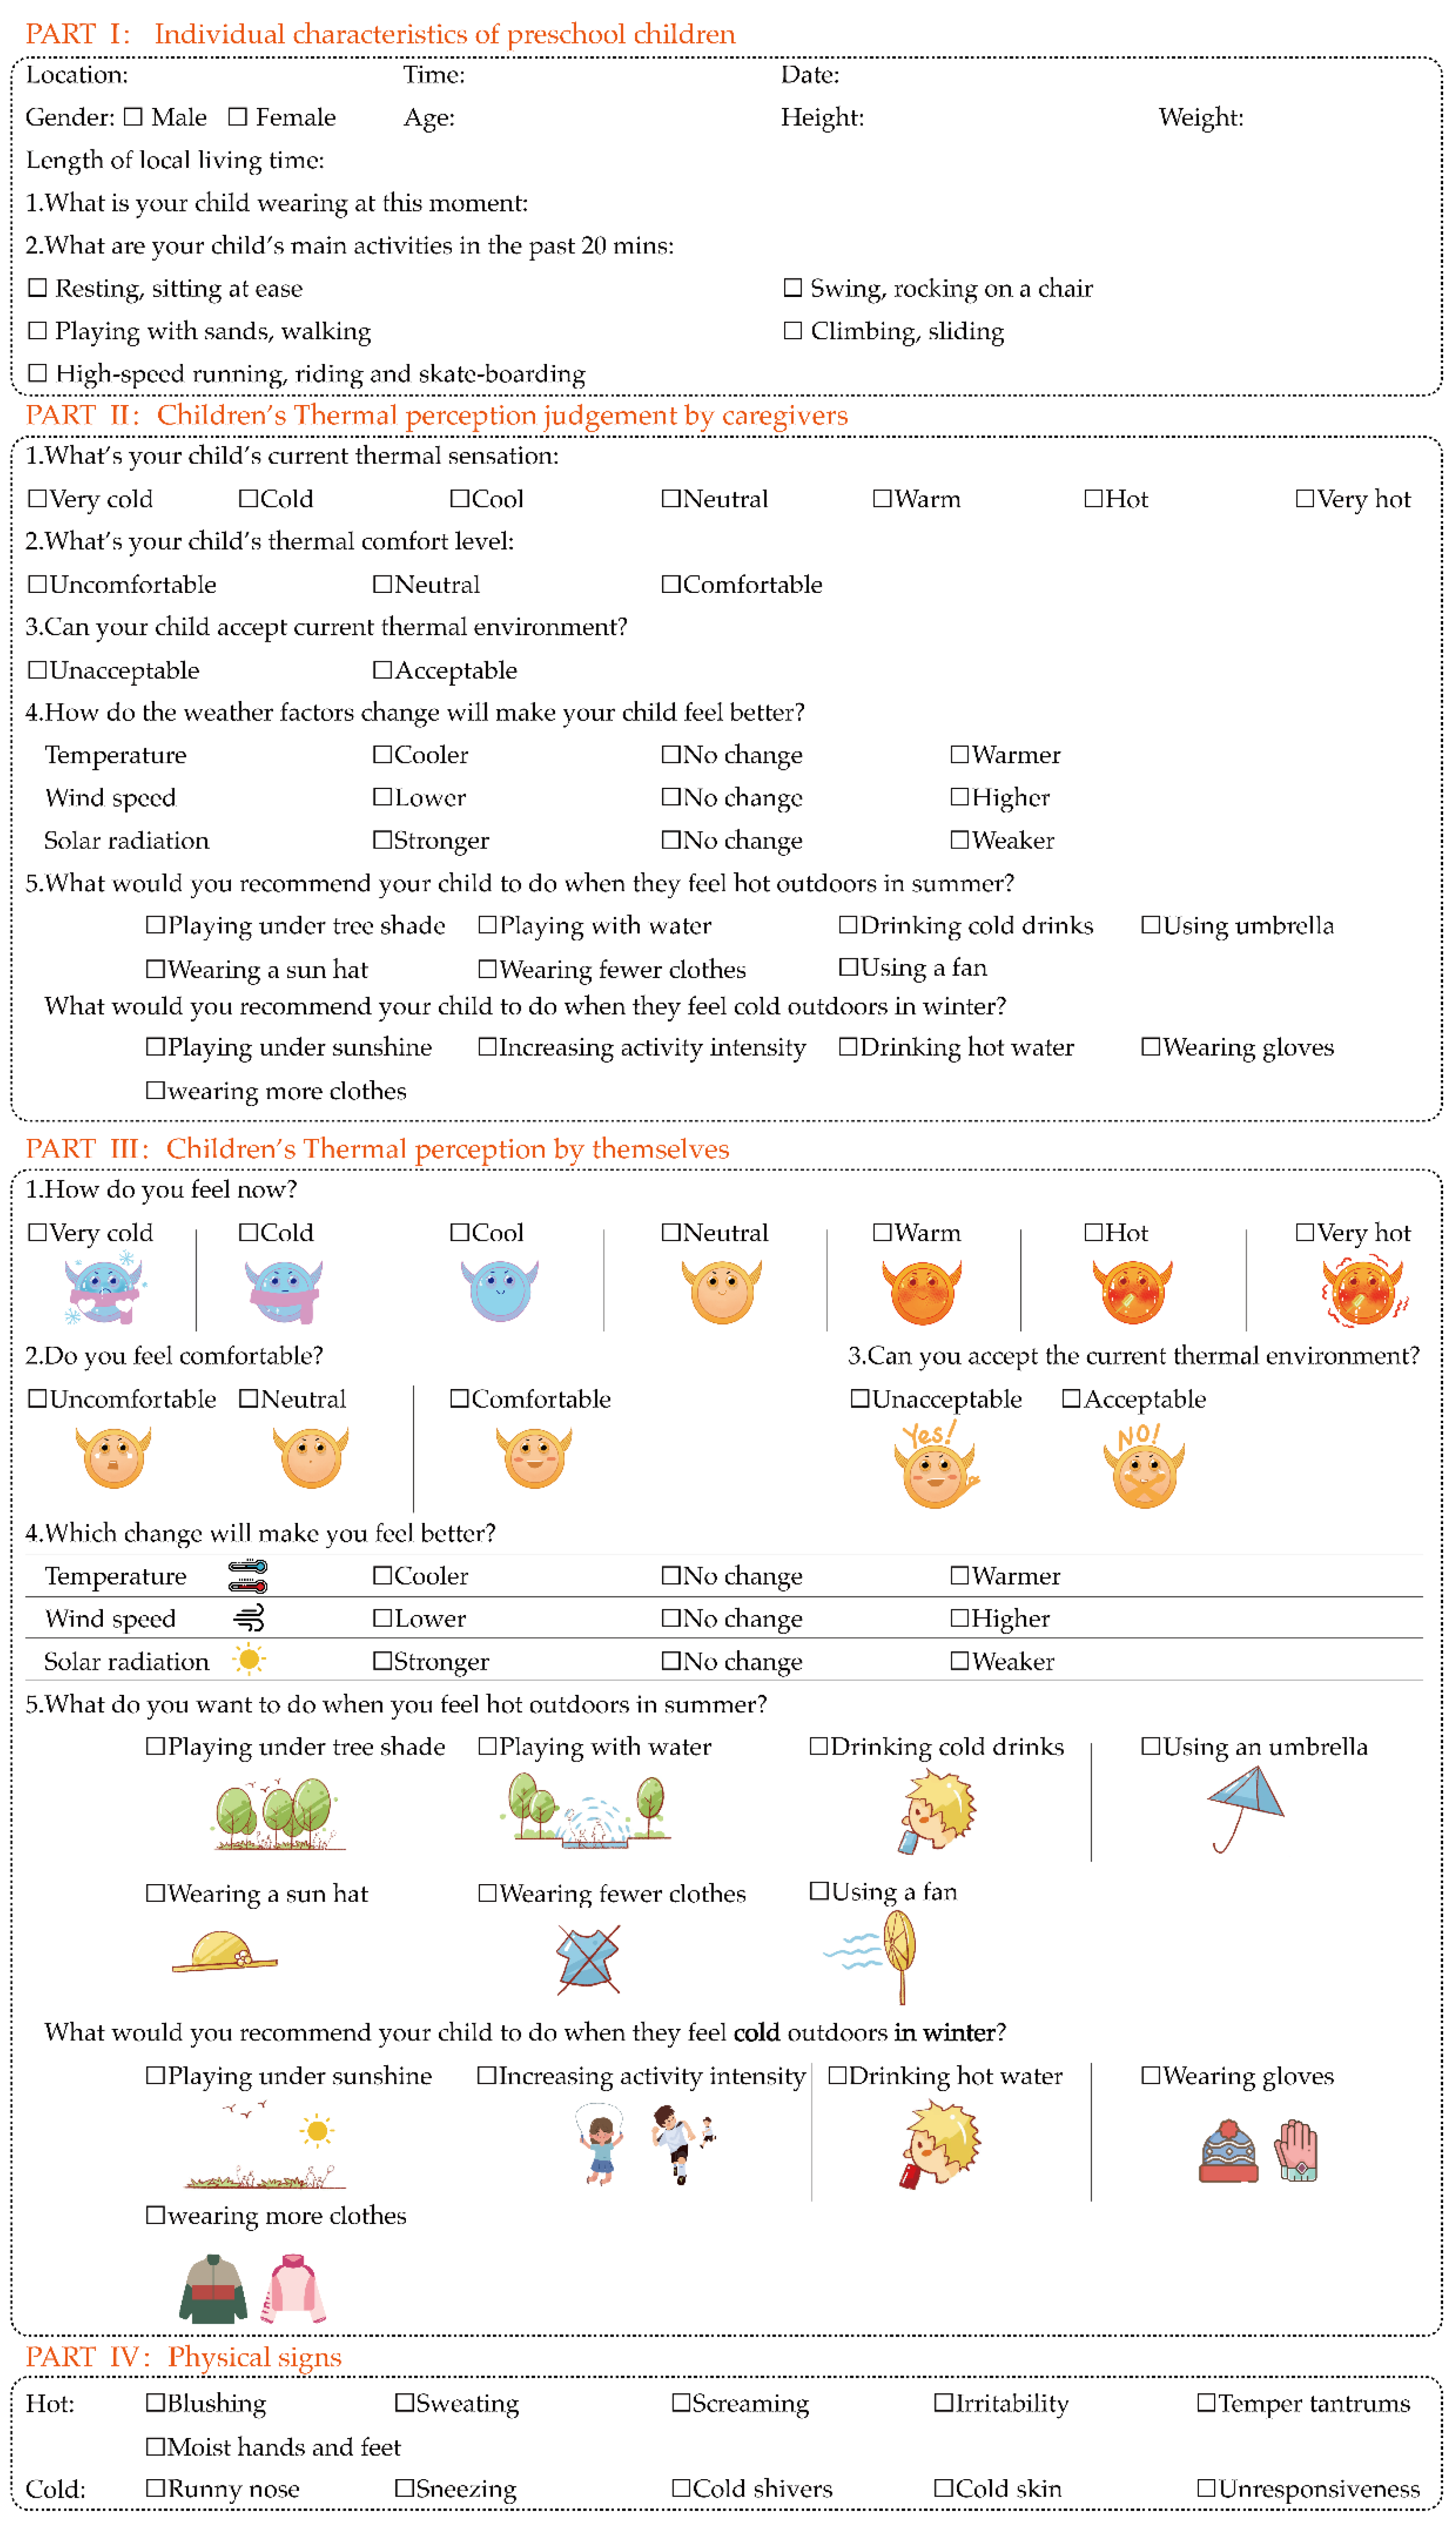
2.2.3. Questionnaire Design

The subjects of this survey are 3–6 years-old children, who are the main users of the sites, and caregivers are also investigated. Unlike in the past, children and caregivers in this study will complete separate evaluations of the site’s thermal environment and make predictions of adaptive preferences. The questionnaire was divided into four given sections: basic information about the subject, the primary caregiver’s assessment of the child’s thermal environment and adaptive preferences, the child’s own assessment of the thermal environment and adaptive preferences, and the subject’s thermal representations.
The first part focused on collecting basic information about the subjects, mainly including the time and place of questionnaire collection and the personal information of the children under study. Children’s personal information included their life background, age, gender, height, weight, dress, and the main activities performed in the venue in the previous 20 min (Figure 2).
The second part and the third part have the same structure but are completed separately by the caregiver and the child. In Part III, the authors used pictures to help children better understand the options (Figure 2). The comfort level of the thermal environment is evaluated by using the 7-point scale thermal sensation vote (TSV), the thermal comfort poll and the thermal acceptability poll [13]. In the 7-point scale thermal sensation vote (TSV), thermal sensation was classified into seven levels, as very cold (−3), cold (−2), cool (−1), neutral (0), warm (1), hot (2), and very hot (3). The adaptation mechanisms of children to the thermal environment are interpreted by changing preferences for climate elements and adaptive behavioral choices under the influence of the thermal environment [21,29].
Climate adaptive behavior options include reactive behaviors (RB) and interactive behaviors (IB). RB are behaviors in which people adapt to their environment through personal changes, such as donning or doffing clothing, changing their type of activity, or drinking water at different temperatures [30]. In this study, we set up different options in summer and winter to explore the different choices of children and caregivers for children’s reactive adaptation. Options for summer include drinking cold drinks, wearing a hat and removing clothing, and for winter, drinking hot water, wearing a hat and gloves, increasing clothing and increasing activity. IB are behaviors that people use to improve climate comfort by changing the environment, such as improving shade conditions or using fans. In this study, different options for IB were set up in summer (shade, water play, umbrellas, portable fans) and winter (sunny sites).
The fourth part was completed by the investigators to determine whether the child was cold or hot in the moment based on the observed physical manifestations of the child. Heat manifestations include blushing, sweating, screaming, irritability, temper tantrums, and moist hands and feet. Cold symptoms include runny nose, cold shivers, cold skin, sneezing and unresponsiveness. At the same time, the investigator will determine the validity of the questionnaire by judging whether the subject’s responses in Part II and Part III are consistent with the observed information.
To ensure the reliability of the questionnaire, the research needed to do the following:
  • Ensure that the caregiver answering the questions is the primary caregiver in the child’s daily life and knows the child well;
  • Participating children and their caregivers need to be in the same place and no more than 20 m away from the environmental testing instrument [31];
  • The caregiver should answer independently, and then the volunteer and caregiver should work together to help the child understand the questions and complete the answers.

2.3. Thermal Index

This study used PET as a thermal index to evaluate the comfort of children’s outdoor spaces, which is now widely used in OTC studies [28,32,33,34,35]. PET is a universal climate index developed based on the Munich Energy-balance Model for Individuals (MEMI) [36]. It is described as is the Ta, and the heat budget of the individual body is balanced with the same core and skin temperature as under the complex outdoor circumstances to be evaluated [37,38]. It is measured in “°C”, which is easy for people to understand. If an outdoor environment has a PET value of 38 °C, people will have the same thermal sensation in this environment as in a room with an air temperature of 38 °C.
The calculation of PET is very complex, but the Rayman model developed by Matzarakis et al. allows researchers to calculate PET values easily and quickly [39]. In this study, the respondent attributes (height, weight, age, gender, thermal resistance of clothing, active metabolic rate) obtained from the questionnaire and the Ta, RH, Va, and Tmrt data detected at the corresponding time periods are brought into the Rayman model to calculate the PET for each individual sample.

2.4. Clothing Insulation and Metabolic Rate

The calculation of children’s PET is based on the data of clothing insulation and the active metabolic rate of children. Therefore, in this study, we determined the indicators of children, with reference to relevant studies and standards, as follows:
Clothing insulation of children: studies have confirmed that the clothing insulation of children is similar to that of adults in the same season [40]. In this study, children’s clothing insulation value refers to the relevant standards for adults [40] and the dressing habits of children in Wuhan are considered; see Table A1 for details.
Active metabolic rate of children: most of the current international standards on metabolic rate target the general working population [13,14,17], and the metabolic rate of children in outdoor activities is not clear. In this study, we followed the method proposed by Ainsworth and colleagues to estimate metabolic rates [41,42]. Specifically, metabolic equivalent for task (MET) was selected to evaluate physical activity under different intensities. The MET is a unit that estimates the amount of energy used by the body during physical activity, as compared to resting metabolic rate (RMR).
Firstly, we calculated the children’s RMR based on the data of their body surface area and resting energy expenditure (REE) (Equation (2)). The mean values of height and weight of children from “Chinese Reference Standards for Growth and Development of Children under 7 Years” issued by the Chinese Ministry of Health [43] were taken into the body surface area calculation formula (Equation (3)) proposed by Haycock [44] and the Schofield REE calculation formula (Equations (4) and (5)) [45] to calculate the RMR for children of different sexes at each age.
RMR = REE/A
A = W0.5378 × H0.3964 × 0.024265
REE = 0.071W + 0.677H + 1.736 (male)
where RMR is resting metabolic rate (W/m2), REE is resting energy expenditure (MJ/day), A is body surface area(m2), W is weight (kg), and H is height (cm).
REE = 0.082W + 0.545H + 1.736 (male)
REE = 0.071W + 0.677H + 1.736 (female)
where REE is resting energy expenditure (MJ/day), W is weight (kg), and H is height (m).
The main activities we observed during the survey are “Resting, sitting “, “Swinging, rocking on a chair”, “Playing with sands, walking”, “Climbing and sliding”, and “High-speed running, riding and skateboarding”. The metabolic rate of children’s activity was estimated by comparing several international standards and selecting adult activities that were similar to those we observed, for example, we used the mean values of “Walking” and “Lifting/packing” from ISO7730 to convert the MET level of “Playing with sands, walking” for children (Table A2).
Finally, the metabolic rate of children with different ages, genders and activities were calculated by using the data of RMR and MET levels (Table 3).

2.5. Data Analysis and Statistics

Personal data (height, weight, age, sex), clothing insulation, metabolic rate data and meteorological data (Ta, RH, Va, Tmrt) obtained from monitoring were brought into the Rayman model to calculate PET. Spearman correlation analysis was performed on meteorological variables and TSVpc and TSVcg, respectively. Linear regressions of MTSVpc and MTSVcg were conducted with PET. Microsoft Excel and SPSS were used for data recording and statistical analysis.

3. Results

3.1. Descriptive Analysis

3.1.1. Physiological Characteristics

A total of 850 questionnaires were distributed and 813 were collected, of which 719 were valid (303 in summer and 416 in winter), and the number of valid questionnaires for each site is shown in Table 4. The children interviewed were 56.9% male and 43.1% female, with a majority of children aged 4–6 years, as shown in Table 5, which showed a balanced distribution. All interviewed children and their caregivers had lived in Wuhan for more than 1 year, understood and adapted to the local climate, and had good accuracy in evaluating the outdoor thermal environment.
Children had a clothing insulation value of 0.25 clo in the summer and a mean clothing insulation value of 1.52 clo in the winter. The mean metabolic rates of preschool children during trials were of 127.9 W in summer and 119.9 W in winter (Table 5).

3.1.2. Meteorological Parameters
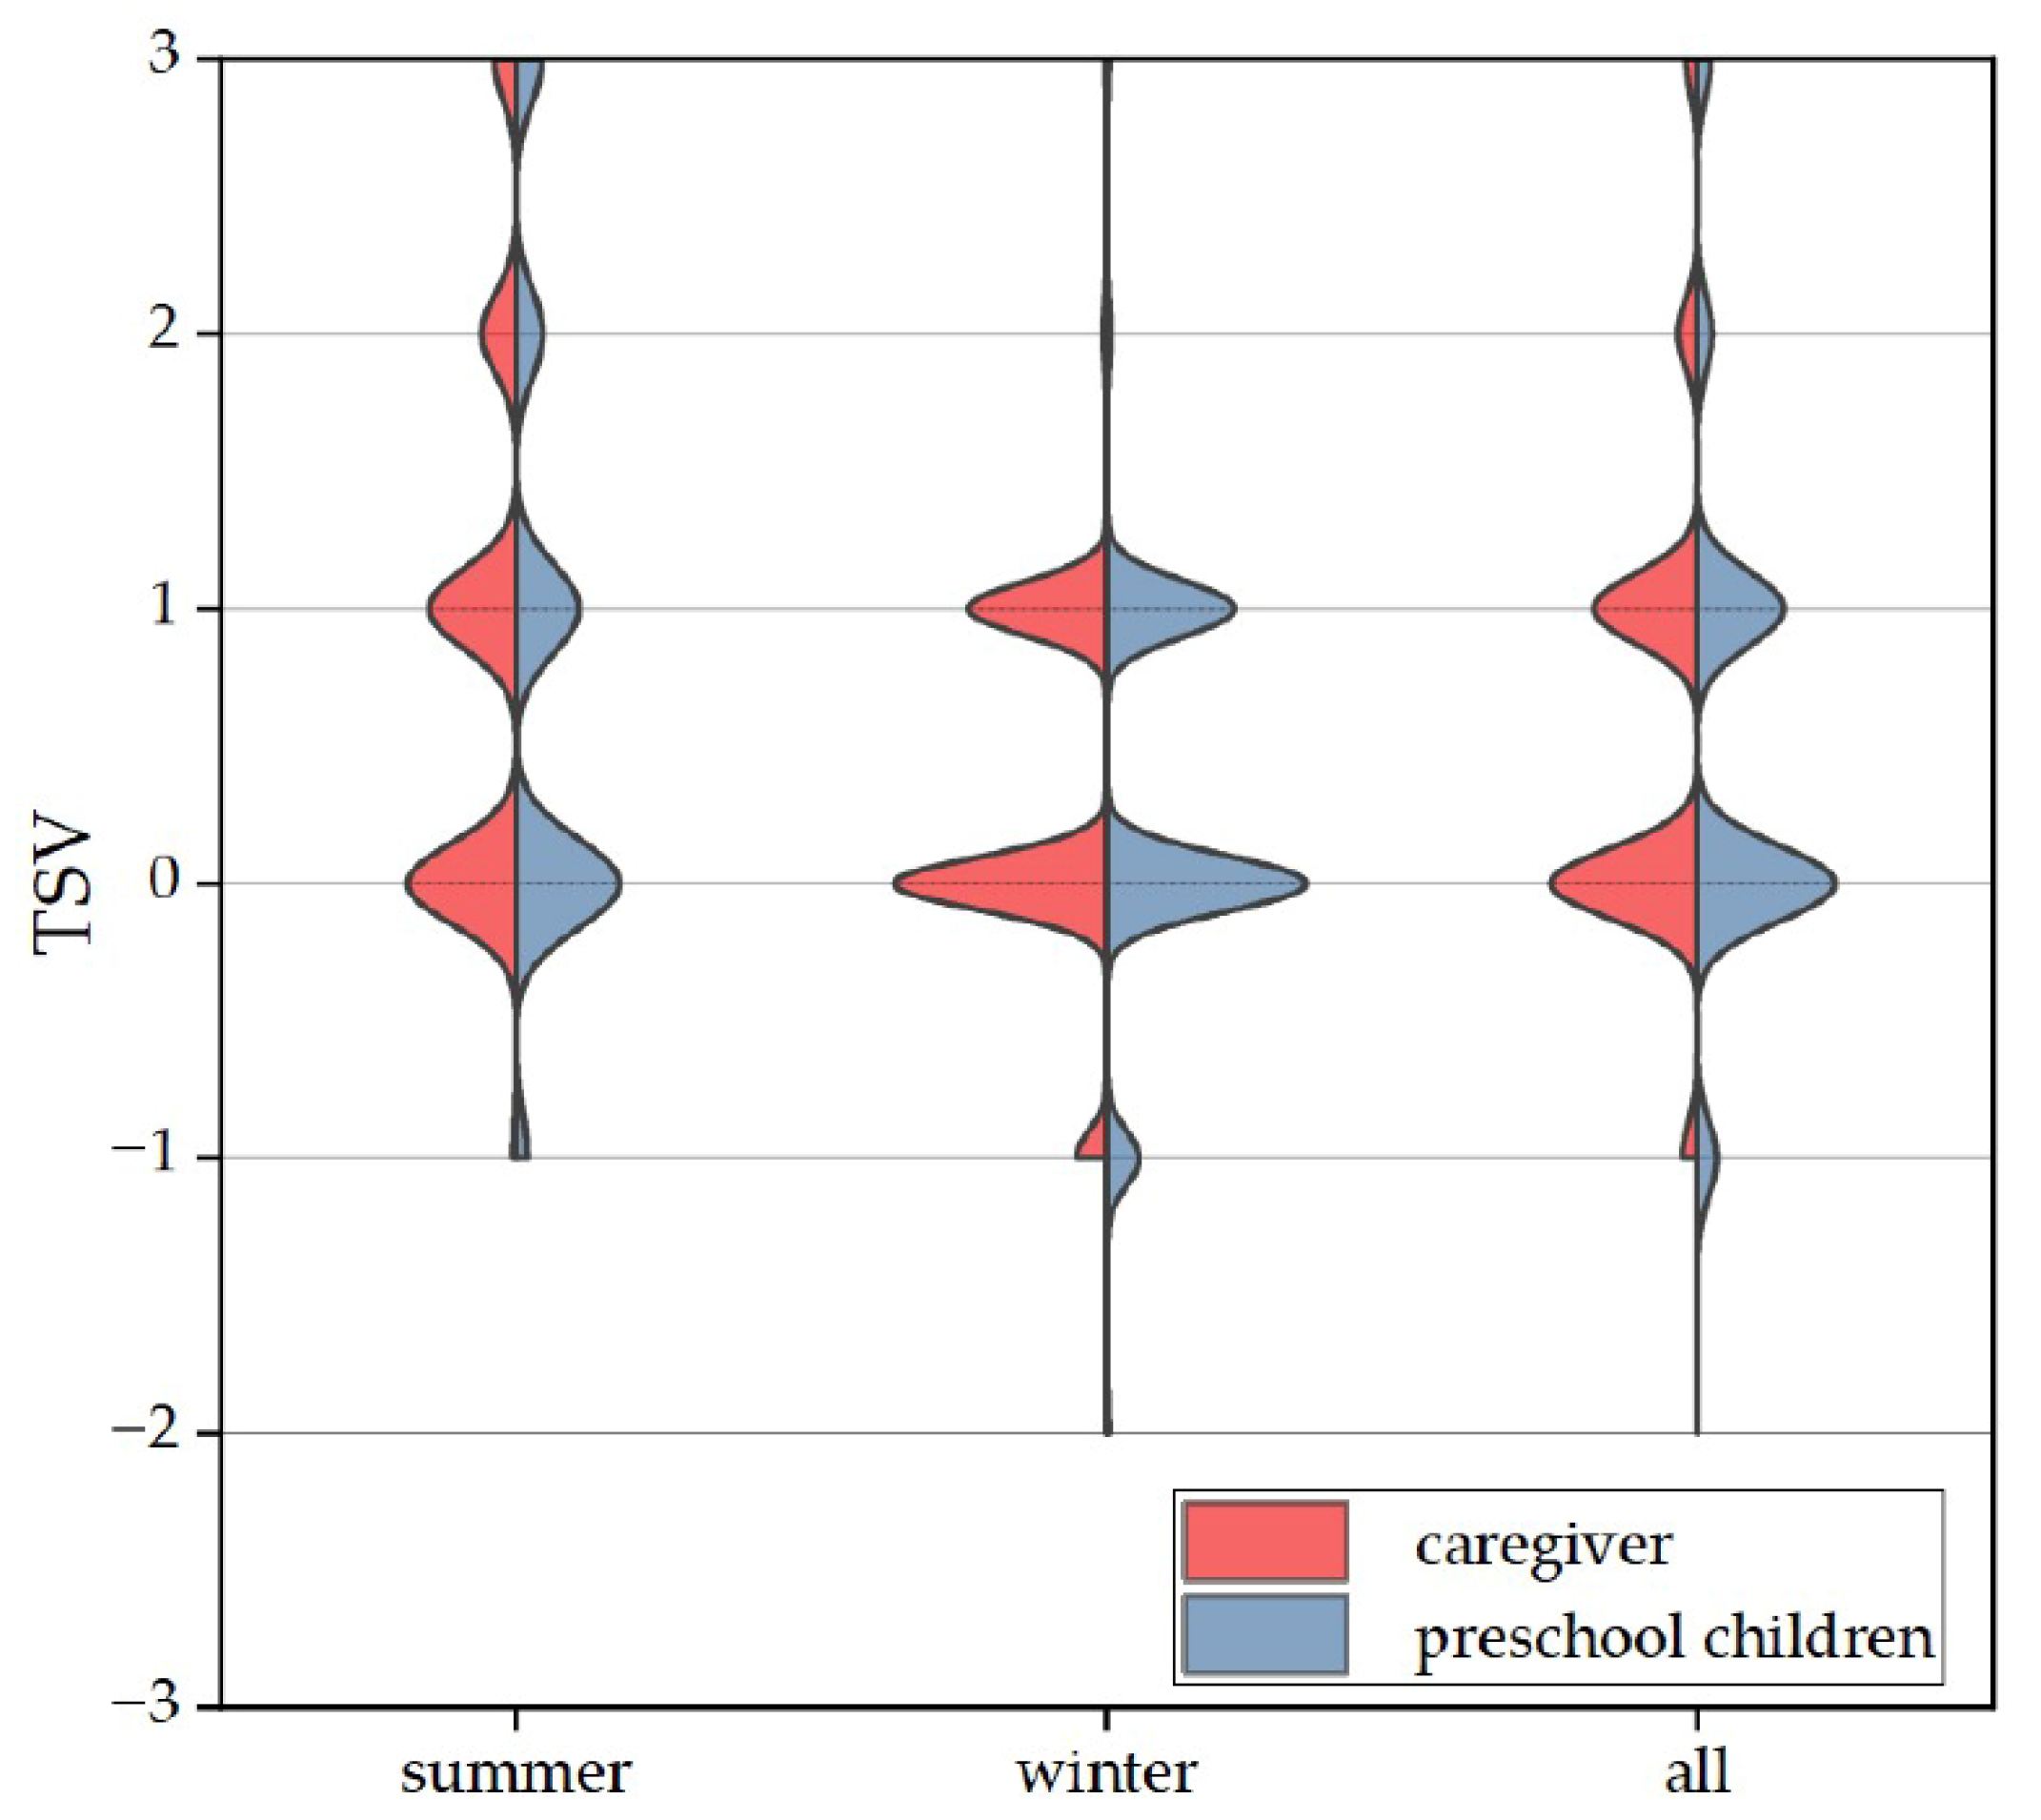
The mean temperature monitored during the experiment was 33.6 °C in summer and 16.8 °C in winter, and the mean humidity was 44.9% in summer and 32.8% in winter. The mean summer temperature is similar to the mean July temperature in 2000–2021, but the winter temperature is higher. This is due to the fact that sunny days are selected for monitoring when children will be outdoors, but the mean temperature measures the mean of the temperature in all weather conditions. As the monitoring was done during daylight hours, the mean relative humidity values monitored were lower than the mean values for each month.
In summer, the sites with lowest PET sites were A2 and A4, and they also had lower TMRT values, probably due to the fact that these two sites had more trees associated with them (Table 6). In winter, the highest PET site was C1, which also had the highest TMRT values, probably due to the plastic substrate and deciduous trees planted on the site. It can be seen that high greenery can reduce the PET value in summer, and plastic substrate and deciduous trees can make the site have a higher PET value in winter (Table 7).

3.1.3. TSV

In the summer, both children and caregivers voted on a scale of “neutral”, “warm” and “hot”, with the children voting on these three scales accounting for 83.9% of the total sample size and caregivers 90%. In winter, both children and caregivers rated their heat sensations as “neutral”, “warm” and “cool”, with children voting being 98% of the total sample size for these three ratings and caregivers 98.6%. In addition, there was a large difference in perception between children and caregivers in that no caregiver perceived the child’s heat sensation to be on the level of “cold” (Figure 3).
The distribution of children and their primary caregivers’ ratings of children’s heat sensation was generally consistent over the study period, centered on “neutral” with a shift toward heat in the summer and a greater shift toward cold in the winter than in the summer. The highest percentage being “neutral” results in both summer and winter is probably due to the fact that caregivers take children outdoors during suitable weather conditions. No respondent chose “very cold” in the overall evaluation, as mentioned above, which may be influenced by the fact that caregivers do not take children outside to play when the weather is too cold. In addition, a study by Boze Huang et al. found that children are better adapted to cold environments because they have higher activity levels outdoors (re 106 ± 27.5 W/m2) than adults [21]. The activity level of children in our study was higher than that in Boze Huang et al. This may be another reason why no participants chose “very cold”.

3.1.4. Meteorological Variables and TSV

Meteorological variables are key factors in the evaluation of thermal comfort in outdoor environments, so a Spearman correlation analysis was performed between meteorological variables and TSVpc (thermal sensation vote by preschool children) and TSVcg (preschool children’s thermal sensation vote by their caregivers) separately, to analyze the effects of meteorological variables on both. Four indicators, Ta, RH, Tg, Tmrt and PET, were found to be significantly correlated both with TSVpc and TSVcg, and the correlation between VA and TSV was significant in summer and relatively less significant in winter, which may be due to the fact that the mean value of Va in winter is only 0.1 m/s. Comparison of the specific correlation indices shows that the correlation of each meteorological factor on the TSVcg was greater than TSVpc, indicating that preschool children are less sensitive to environmental changes than caregivers (Table 8).

3.2. Outdoor Thermal Benchmark and Environmental Assessment

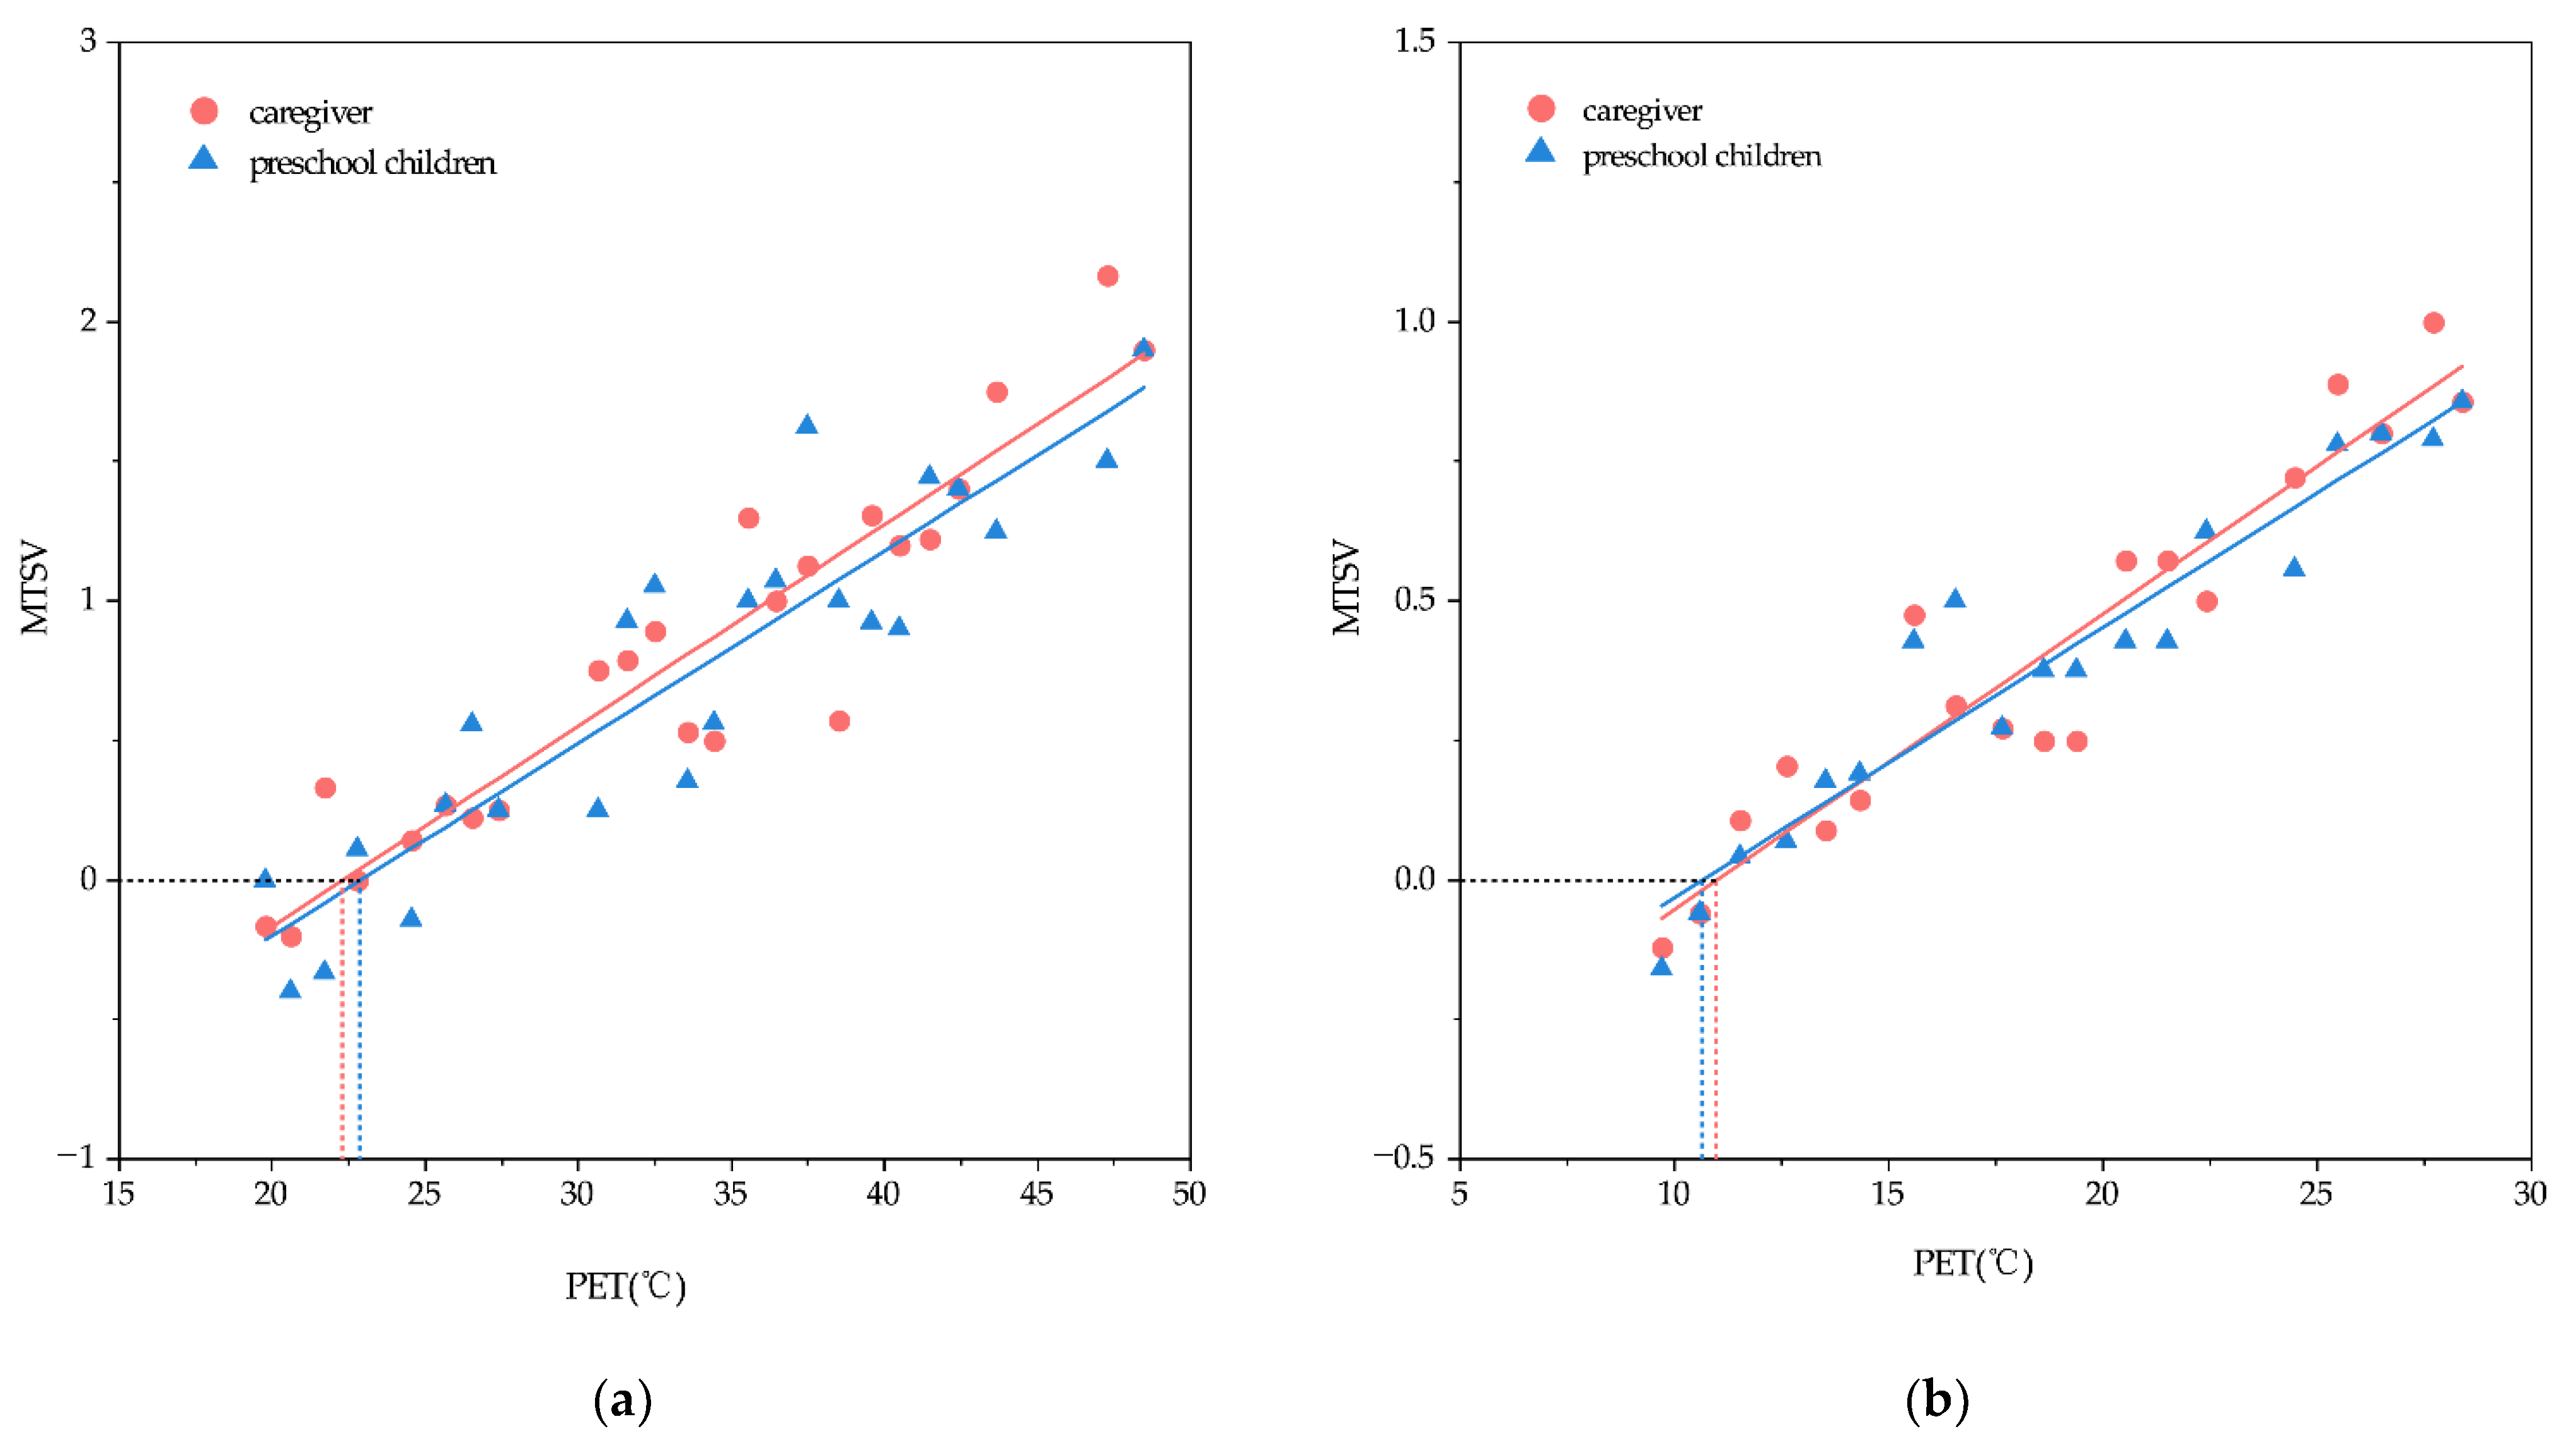
3.2.1. Neutral PET (NPET)

NPET refers to the PET value at which people feel neutral (not too cold or too hot). Therefore, when TSV is neutral (0), the corresponding PET value is NPET. The number of samples within each 1 °C PET interval during the experiment were counted separately, and intervals with a sample number greater than five were included in the statistics. The number of samples included in the analysis was 686 (summer 281, winter 405). The samples within each valid interval were calculated as the mean of TSV (MTSV) and PET, and linear regression analysis was performed on them (Figure 4). Based on the linear regression results, NPET values could be determined. We processed the child and caregiver data separately for different seasons to obtain the linear regression Equations (7)–(10).
Summer:
MTSVpc = 0.0670 PET − 1.5799 (R2 = 0.82474, p < 0.001)
MTSVcg = 0.0720 PET − 1.6072 (R2 = 0.89593, p < 0.001)
Winter:
MTSVpc = 0.0483 PET − 0.5142 (R2 = 0.90853, p < 0.001)
MTSVcg = 0.0720 PET − 1.6072 (R2 = 0.89439, p < 0.001)
In the summer, the slope of the linear regression equation of mean TSV (MTSV) and PET of children is 0.0690, which corresponded to 14.5 °C PET/MTSV. The slope of the linear regression equation of mean TSV (MTSV) and PET for caregivers is 0.072, which corresponded to 13.9 °C PET/MTSV. According to the regression equation, the NPET of children is 22.9 °C and the NPET of the caregiver evaluation is 22.3 °C in summer.
In the winter, the slope of the linear regression equation of mean TSV (MTSV) and PET of children is 0.0483, which corresponded to 20.7 °C PET/MTSV. The slope of the linear regression equation of mean TSV (MTSV) and PET of caregiver is 0.0529, which corresponded to 18.9 °C PET/MTSV. According to the regression equation, the NPET of children is 10.6 °C and the NPET of the caregiver evaluation is 11.0 °C in winter.
From the above results, it can be seen that the NPET values of preschoolers in summer were 0.6 °C higher than evaluated by their caregivers, while the NPET values of preschoolers in winter were 0.4 °C lower than evaluated by their caregivers. A study conducted in Beijing on differences in indoor thermal comfort between preschoolers’ and parents’ assessments concluded that preschoolers have higher tolerance of thermal environments than their parents [46]. Although this phenomenon was also observed in our study, the difference between the evaluations of children and their caregivers in summer and winter was within 1 °C, which does not exclude that it was caused by experimental error.

3.2.2. Neutral PET Range (NPETR)

NPETR refers to the PET range of TSV between −0.5 and 0.5. During the summer months, the NPETR rated by the child population was 15.7–30.2 °C, and caregivers perceived the NPETR for children to be 15.4–29.3 °C. The lower limit of the NPETR evaluated by children themselves was 0.3 °C higher than the caregivers’, while the upper limit was 0.9 °C higher. The range of comfort PET evaluated by the children themselves is greater than the range judged by the caregivers. The NPETR rated by the child population in winter was 0.3–21 °C, and the caregivers perceived the children’s NPETR to be 1.6–20.5 °C. The lower limit of the children’s own rated NPETR was 1.3 °C lower than the caregivers’, while the upper limit was 0.5 °C higher. It can be seen that the range of NPET evaluated by preschoolers in summer and winter is slightly wider than the evaluations made by their caregivers, but this difference is not significant, and the difference in the lower limit is above 1 °C only in winter.

3.2.3. PET Calibrations

According to the changes of thermal environment, people will have a different intensity of heat stress response. Different people have different upbringings, customs and climates, which may lead to different PET ranges for different stress categories [24]. Based on the measured data, the relationship between PET and heat stress in Wuhan in summer and winter was established from the evaluation dimensions of children themselves and their caregivers separately (Table 9). The range of summer PET monitored at this survey is 19.7–57.6 °C. The interval is divided according to TSV: −0.5 to 0.5 interval is no thermal stress, 0.5 to 1.5 is slight heat stress, and 1.5 to 2.5 is moderate heat stress. According to Table 9, it can be seen that the range of each rating for children is slightly wider than that of caregivers, which may be due to children being more interested in playing than the thermal environment during outdoor activities, and more research is needed to clarify this in the future. Winter PET ranges from 9.9 to 29.8 °C. Although this study was conducted in January, the coldest month in Wuhan, the corresponding heat stress levels included only no thermal stress (TSV −0.5 to 0.5) and slight heat stress (TSV 0.5 to 1.5), which may be related to the fact that the study was conducted on sunny days and to the high metabolic intensity of children’s outdoor activities.

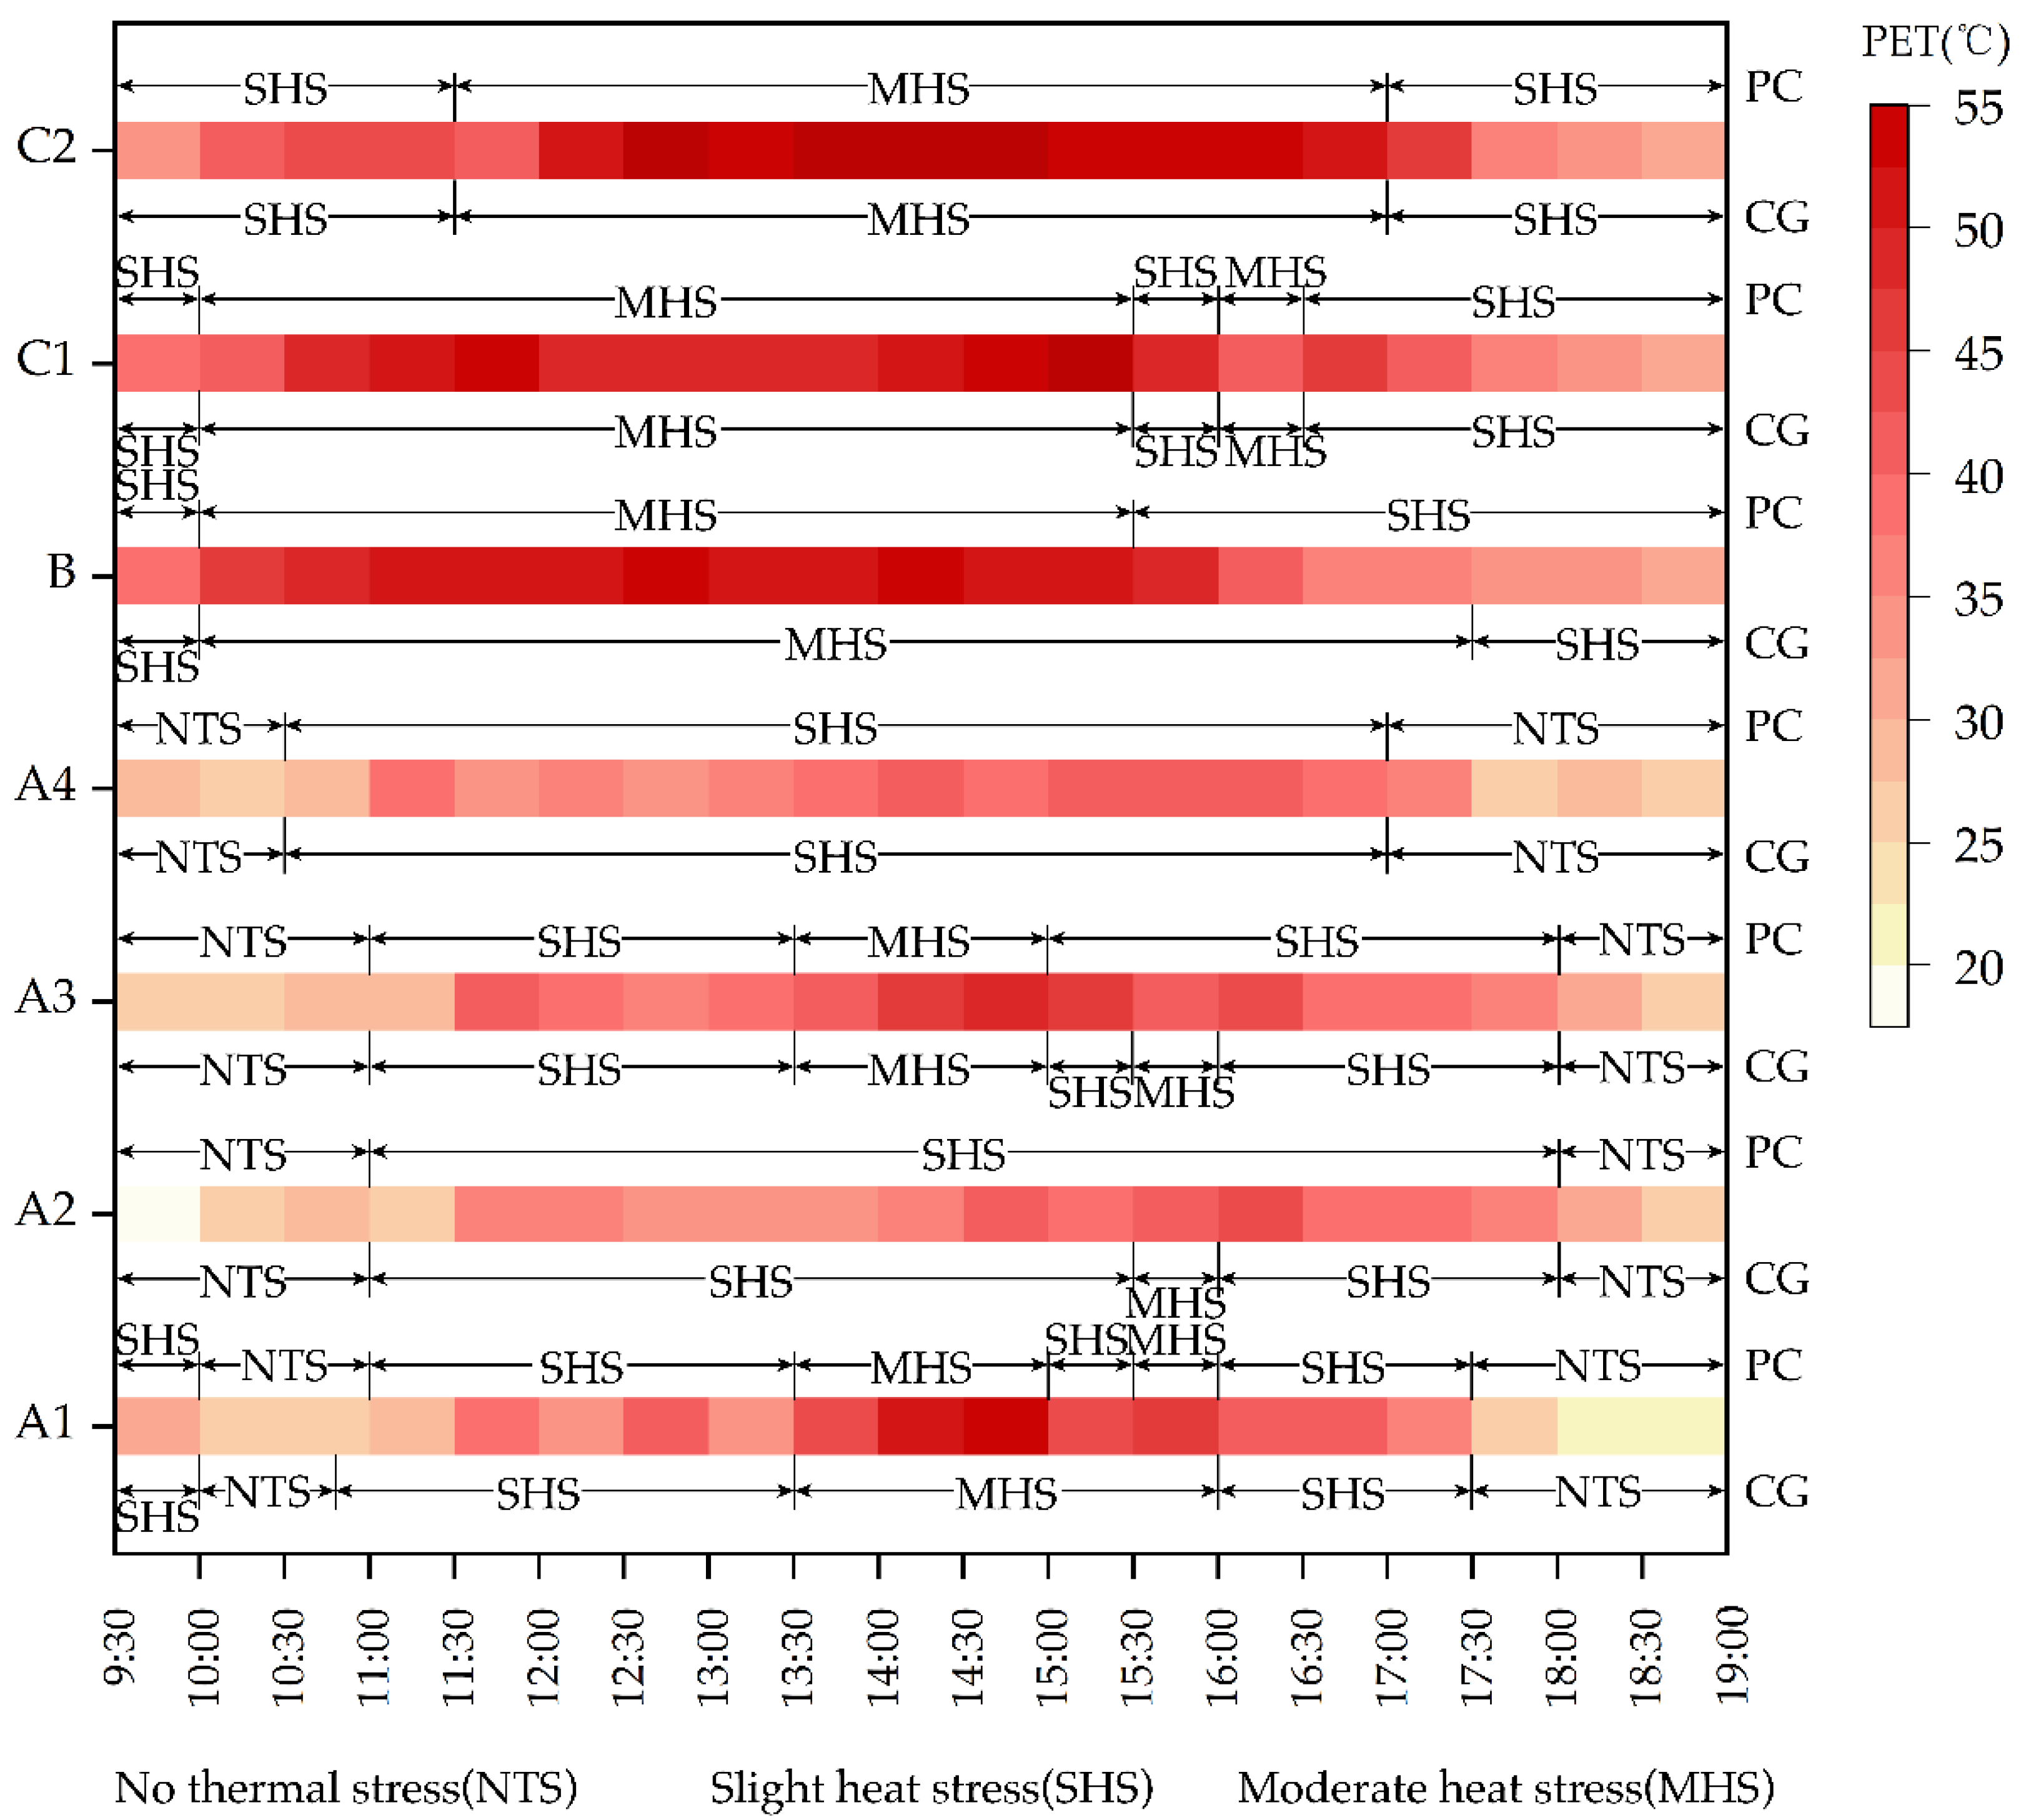
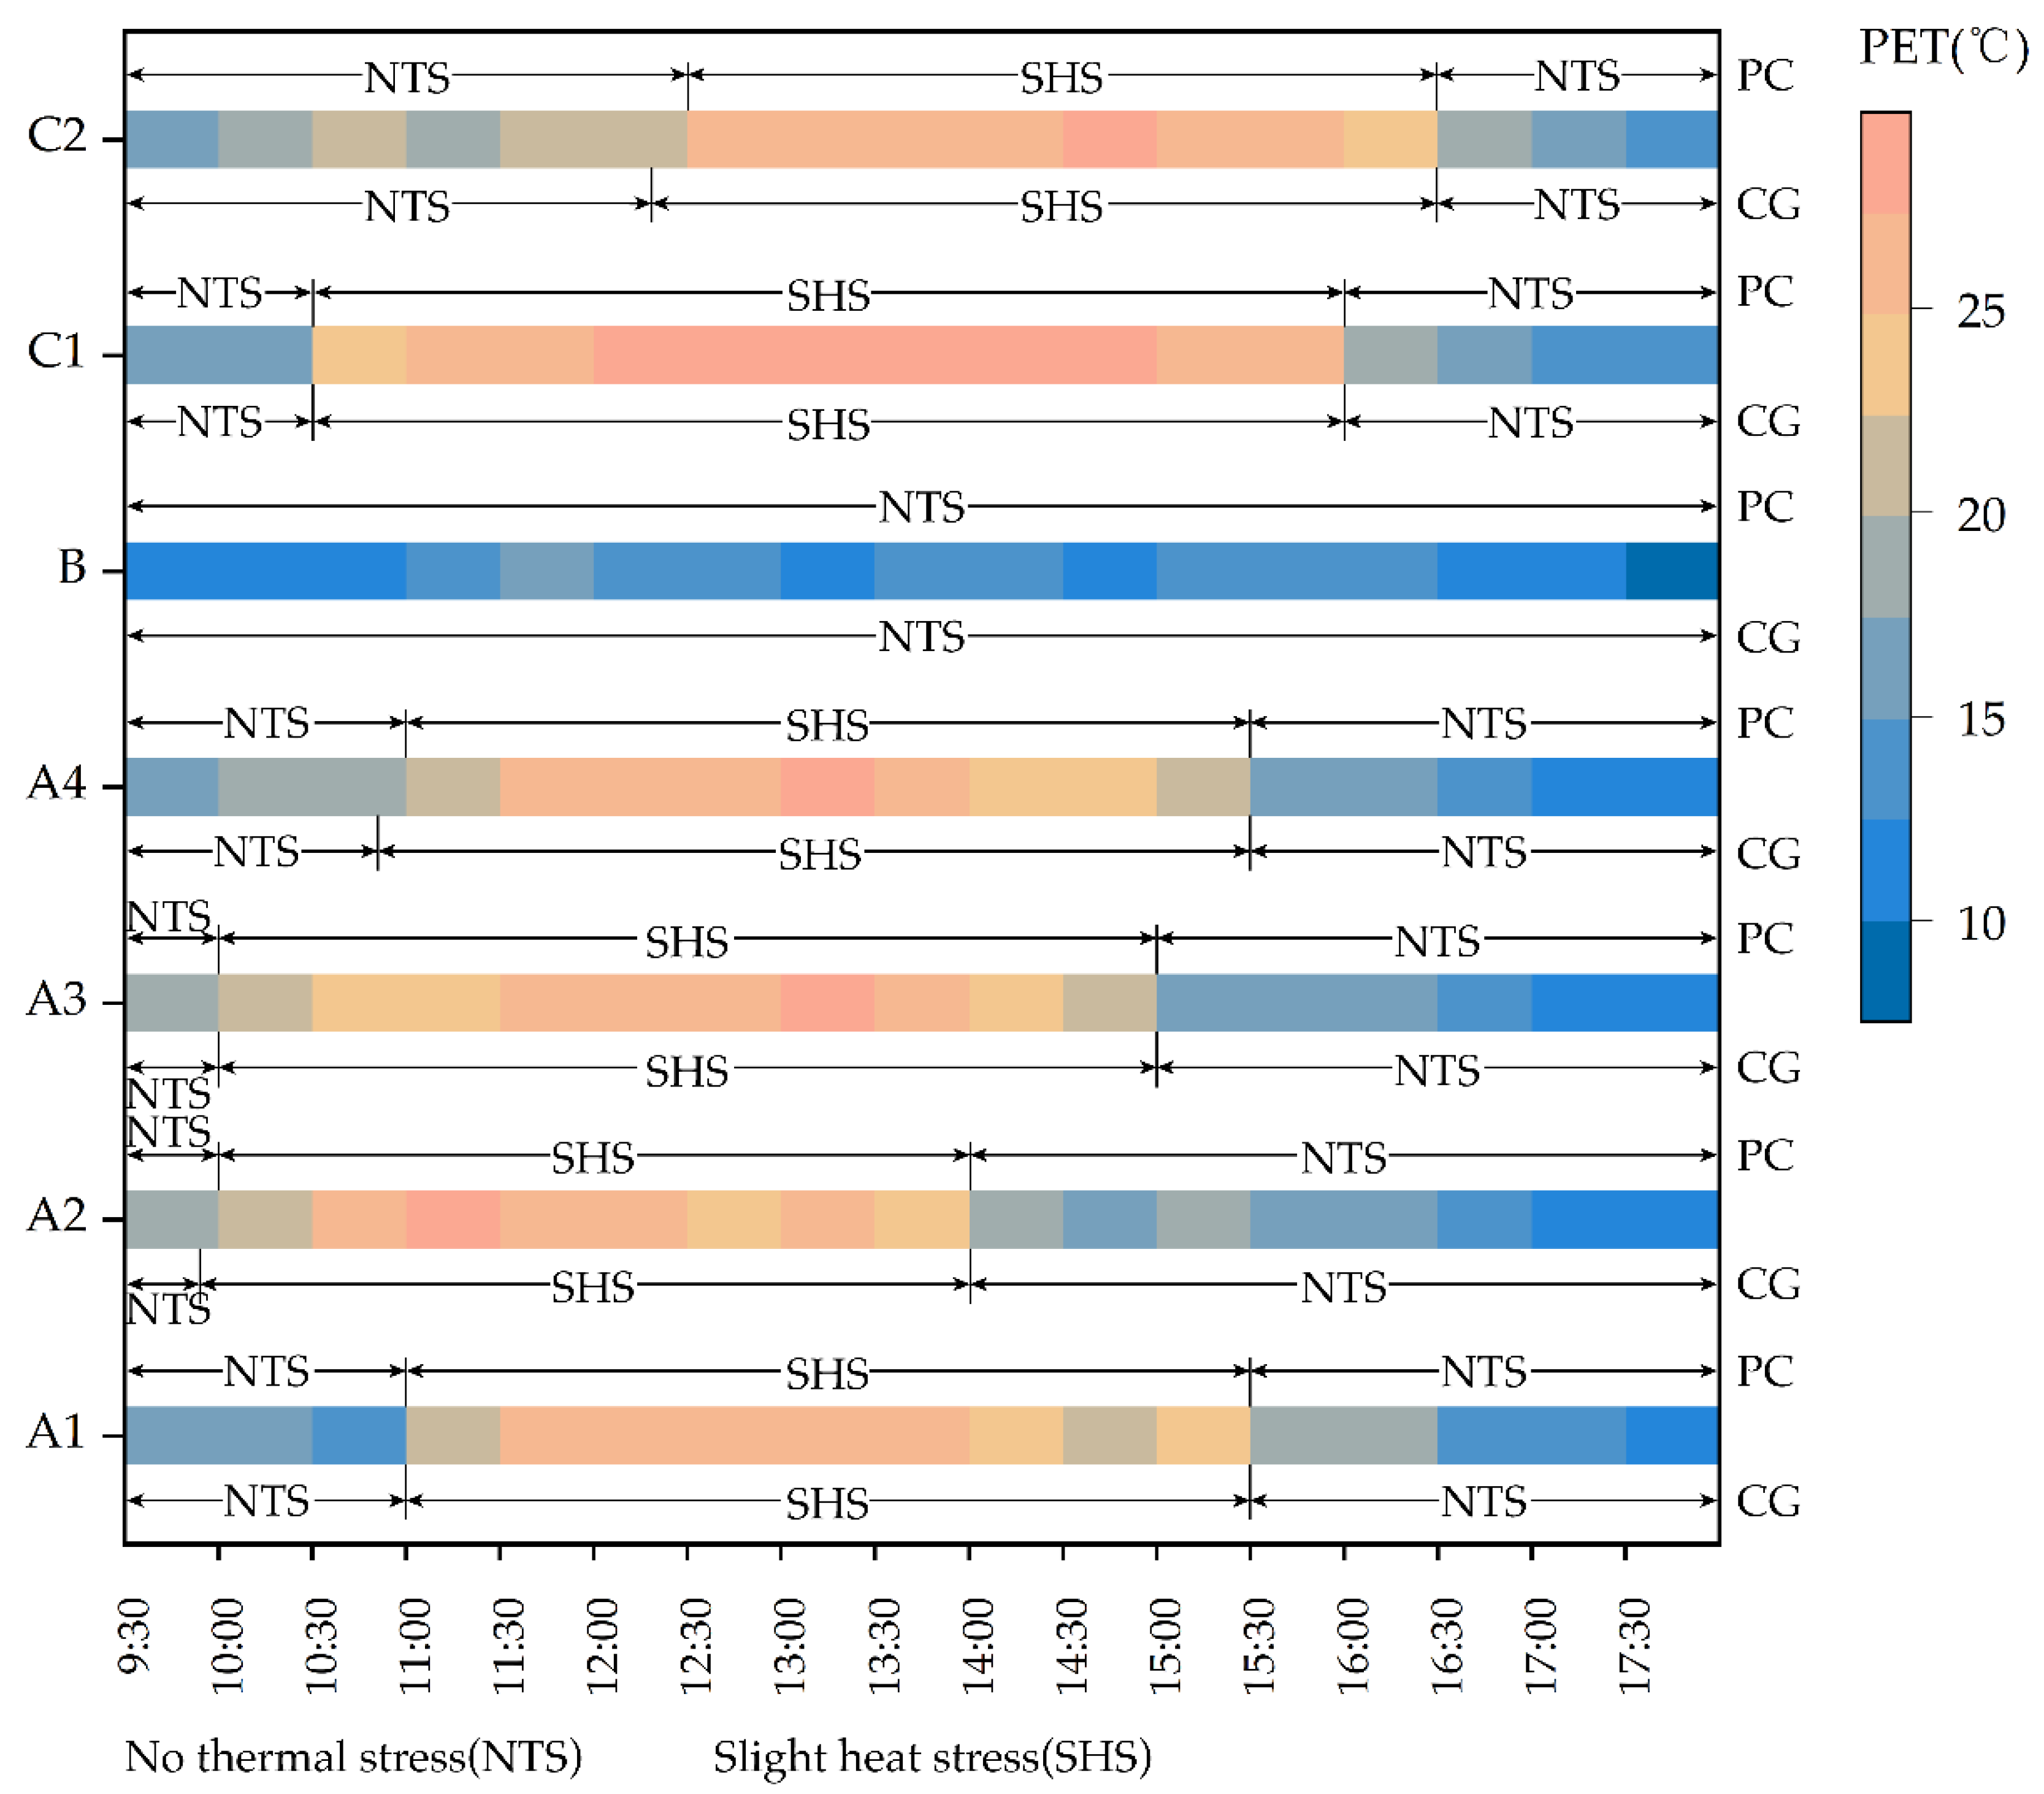
3.2.4. Thermal Calendars

A thermal environment calendar can visualize the thermal conditions of outdoor activity spaces and also provide a theoretical reference for environmental optimization. In this study, the half-hourly mean PET values were used to plot the thermal calendars of each site separately for summer and winter, and each color on the calendar represents a 2.5 °C temperature interval. Also, the modified PET calibrations were used to assess the thermal comfort of the sites.
During the field research in summer, the no thermal stress condition occurred roughly between 9:30–10:30 and after 17:30 for sites A1 and A4, and between 9:30–11:00 and after 18:30 for sites A2 and A3, while all other sites were under thermal stress. The moderate heat stress condition occurred at sites A1 and A3 around 14:00–15:30 and lasted for 1–1.5 h. Sites B, C1, and C2 were in the moderate heat stress condition for about 6 h. The rest of the time it was slight heat stress. Both children and caregivers rated the sites as thermally uncomfortable most of the time during the summer monitoring period. The difference between the caregivers’ and preschool children’s evaluations of the heat stress state of the sites was mainly concentrated in the 3:00–4:00 p.m. period in sites A1, A2 and A3. The caregivers assessed the length of moderate heat stress as half an hour longer than did the preschool children during this time period (Figure 5).
In winter, the overall duration of no thermal stress accounted for half of the total test period. For sites A1, A2, A3 and A4, the slight heat stress state started at 10:30–11:30, and site A2 was the first to enter the no thermal stress state at 14:00. Site A2 was the first to enter “no thermal stress” at 14:00, site A3 at 14:30, and sites A1 and A4 at 15:00. Site C1 is in “slight heat stress” from 10:30–15:30, site C2 is in “slight heat stress” from 12:30–16:00, and both sites are comfortable at other times. Site B is in comfortable condition all day. The winter sites were in no thermal stress longer than in the summer, and the overall comfort level was higher and only slight thermal stress occurred (Figure 6).
The thermal environment calendar for the experimental periods shows that the overall comfort level is higher in winter than in summer. The summer thermal comfort in Wuhan was not good. Although we did not choose the hottest month of the summer, during which few children were active in the study sites, the study sites were still uncomfortable (with heat stress) for most of the time. In winter, we chose the coldest month of January for the study, and the sites were comfortable (no thermal stress) half of the time, and the other half of the time was not “cold” but slightly warm. The thermal environment calendar provides direction for climate-responsive design of the sites, and priority should be given to improving the thermal conditions of the sites in summer by designing them to influence the summer site microclimates.

3.3. Climate Adaptation Preferences and Design Strategies

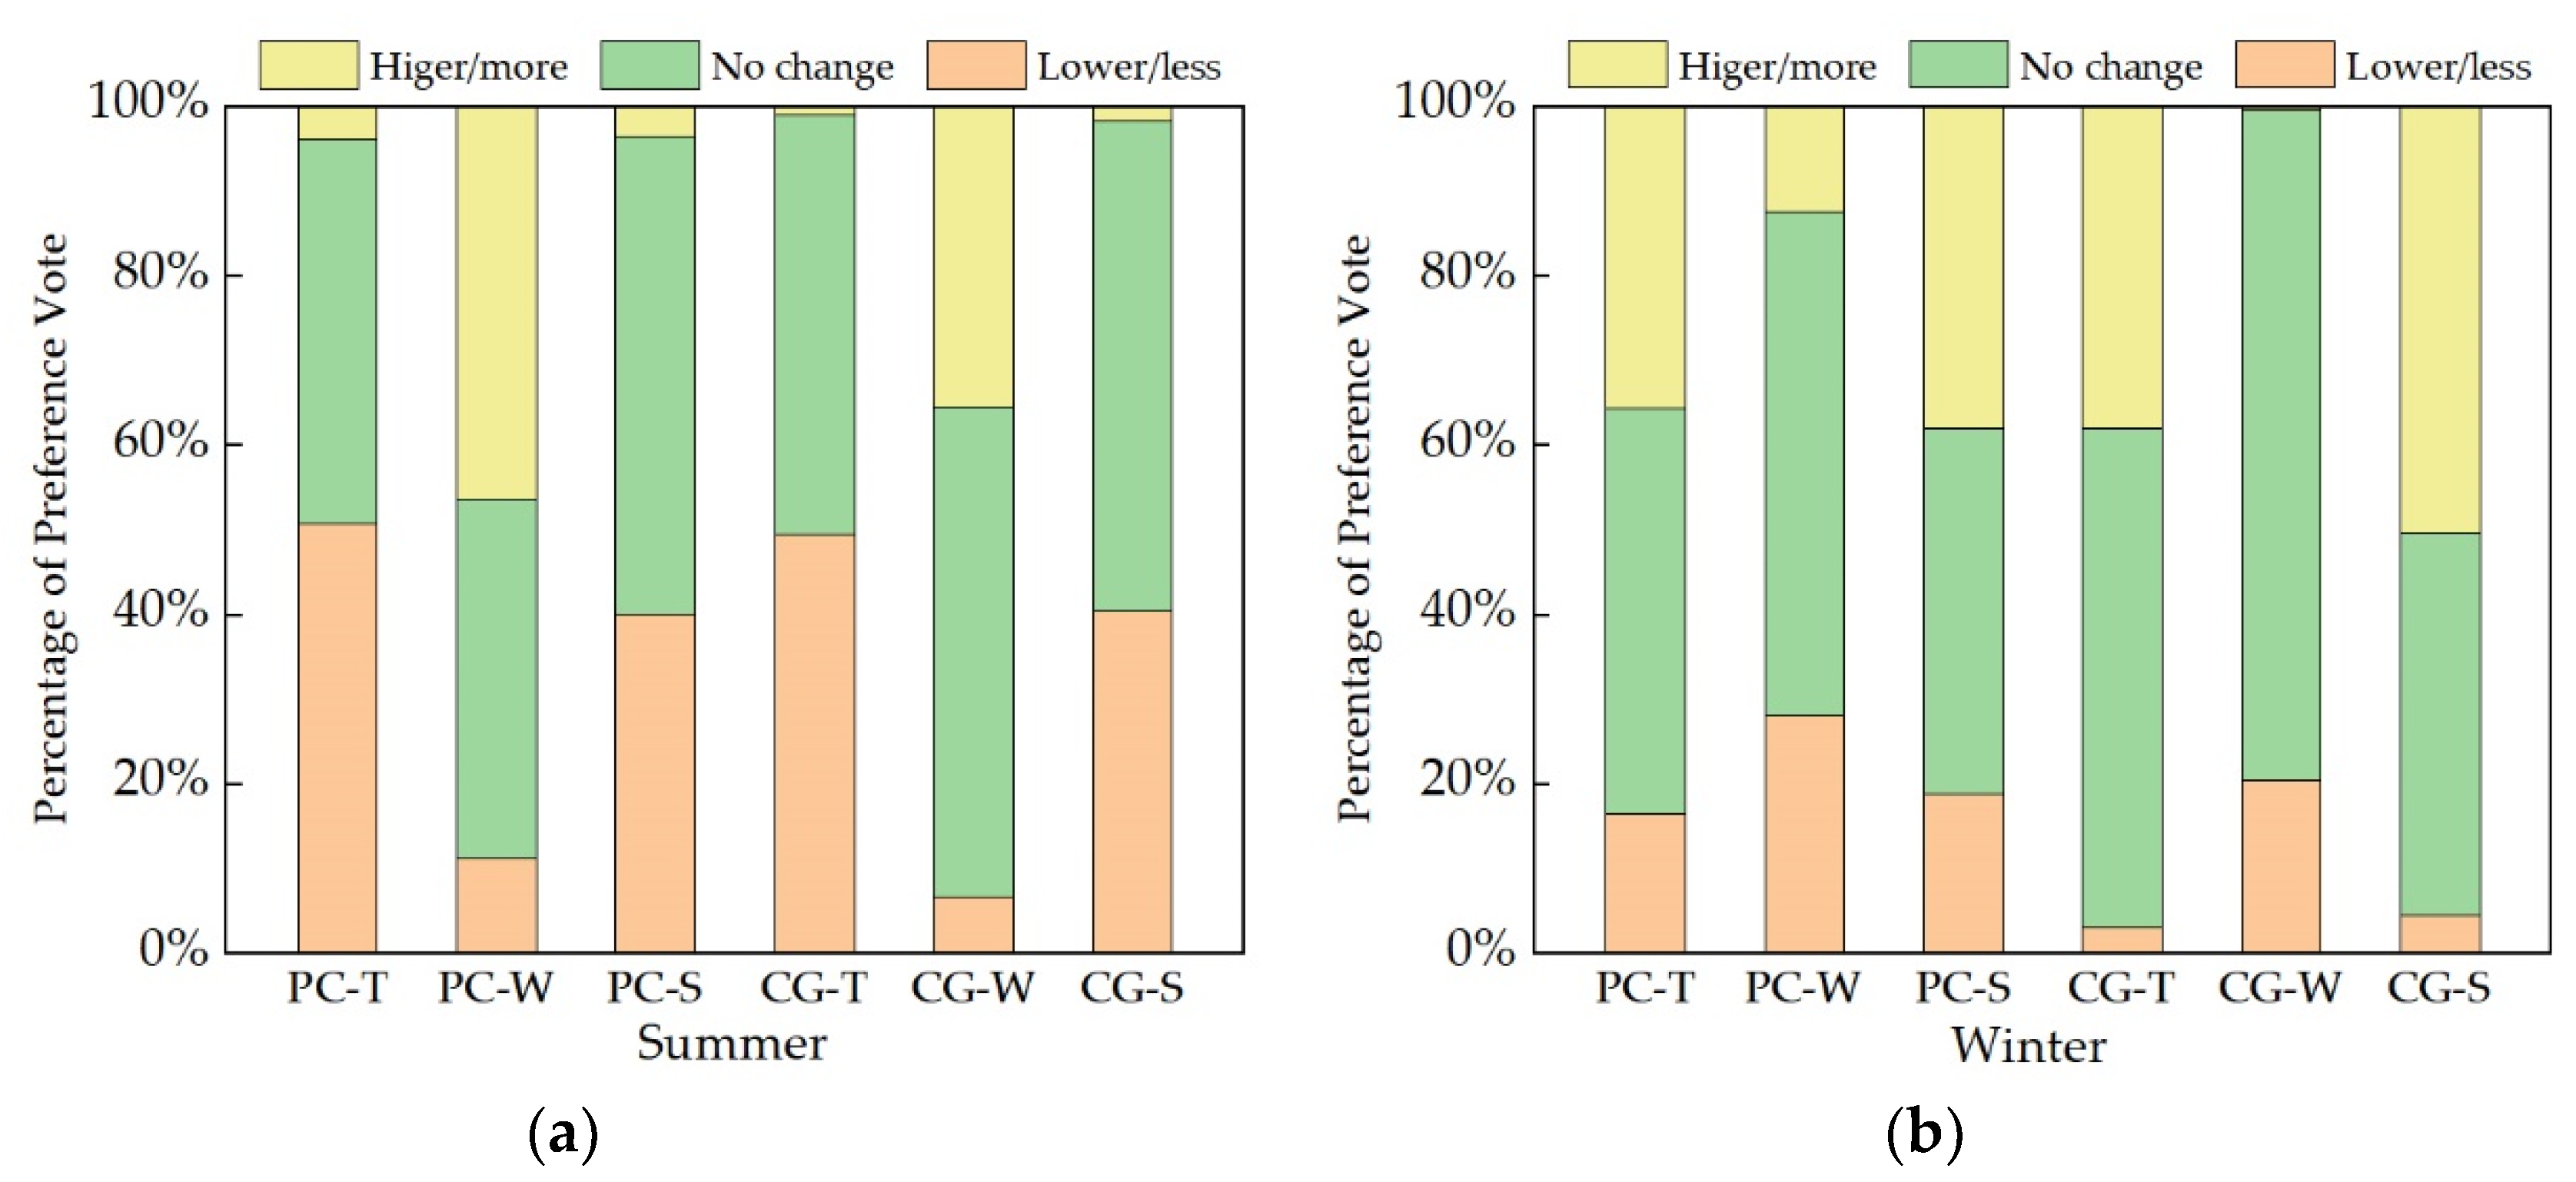
3.3.1. Meteorological Parameter Preference Vote

During the summer months, children and caregivers had similar preferences for weather factors, with approximately 42% of children and 50% of caregivers expressing satisfaction with each weather factor at the time of the study. Preferences for changes in meteorological factors were focused on three dimensions: lowering temperature (49.5% for children; 56.3% for caregivers), increasing wind speed (35.4% for children; 46.3% for caregivers) and lowering sunlight (40.5% for children; 40.2% for caregivers), with the highest expectation of lowering temperature (Figure 7).
In winter, children and caregivers were more satisfied with each meteorological factor, with higher satisfaction rates for temperature (48.0% for children; 58.9% for caregivers), wind speed (59.4% for children; 79.0% for caregivers) and sunlight (43.2% for children; 45.1% for caregivers). Preferences for changes in meteorological factors were concentrated in three dimensions: increasing temperature (35.6% for children; 37.9% for caregivers), decreasing wind speed (28.2% for children; 20.5% for caregivers) and increasing sunlight (37.9% for children; 50.4% for caregivers), with the highest expectation for increasing sunlight. Comparing the data between the summer and winter seasons, it can be seen that in summer the overall voting rate of children and caregivers on the three items of lowering temperature, increasing wind speed and lowering solar radiation, was higher than it was in winter for children and caregivers on raising temperature, lowering wind speed and increasing solar radiation. This indicates that children and caregivers prefer a “cooler” summer climate to a “warmer” winter climate.

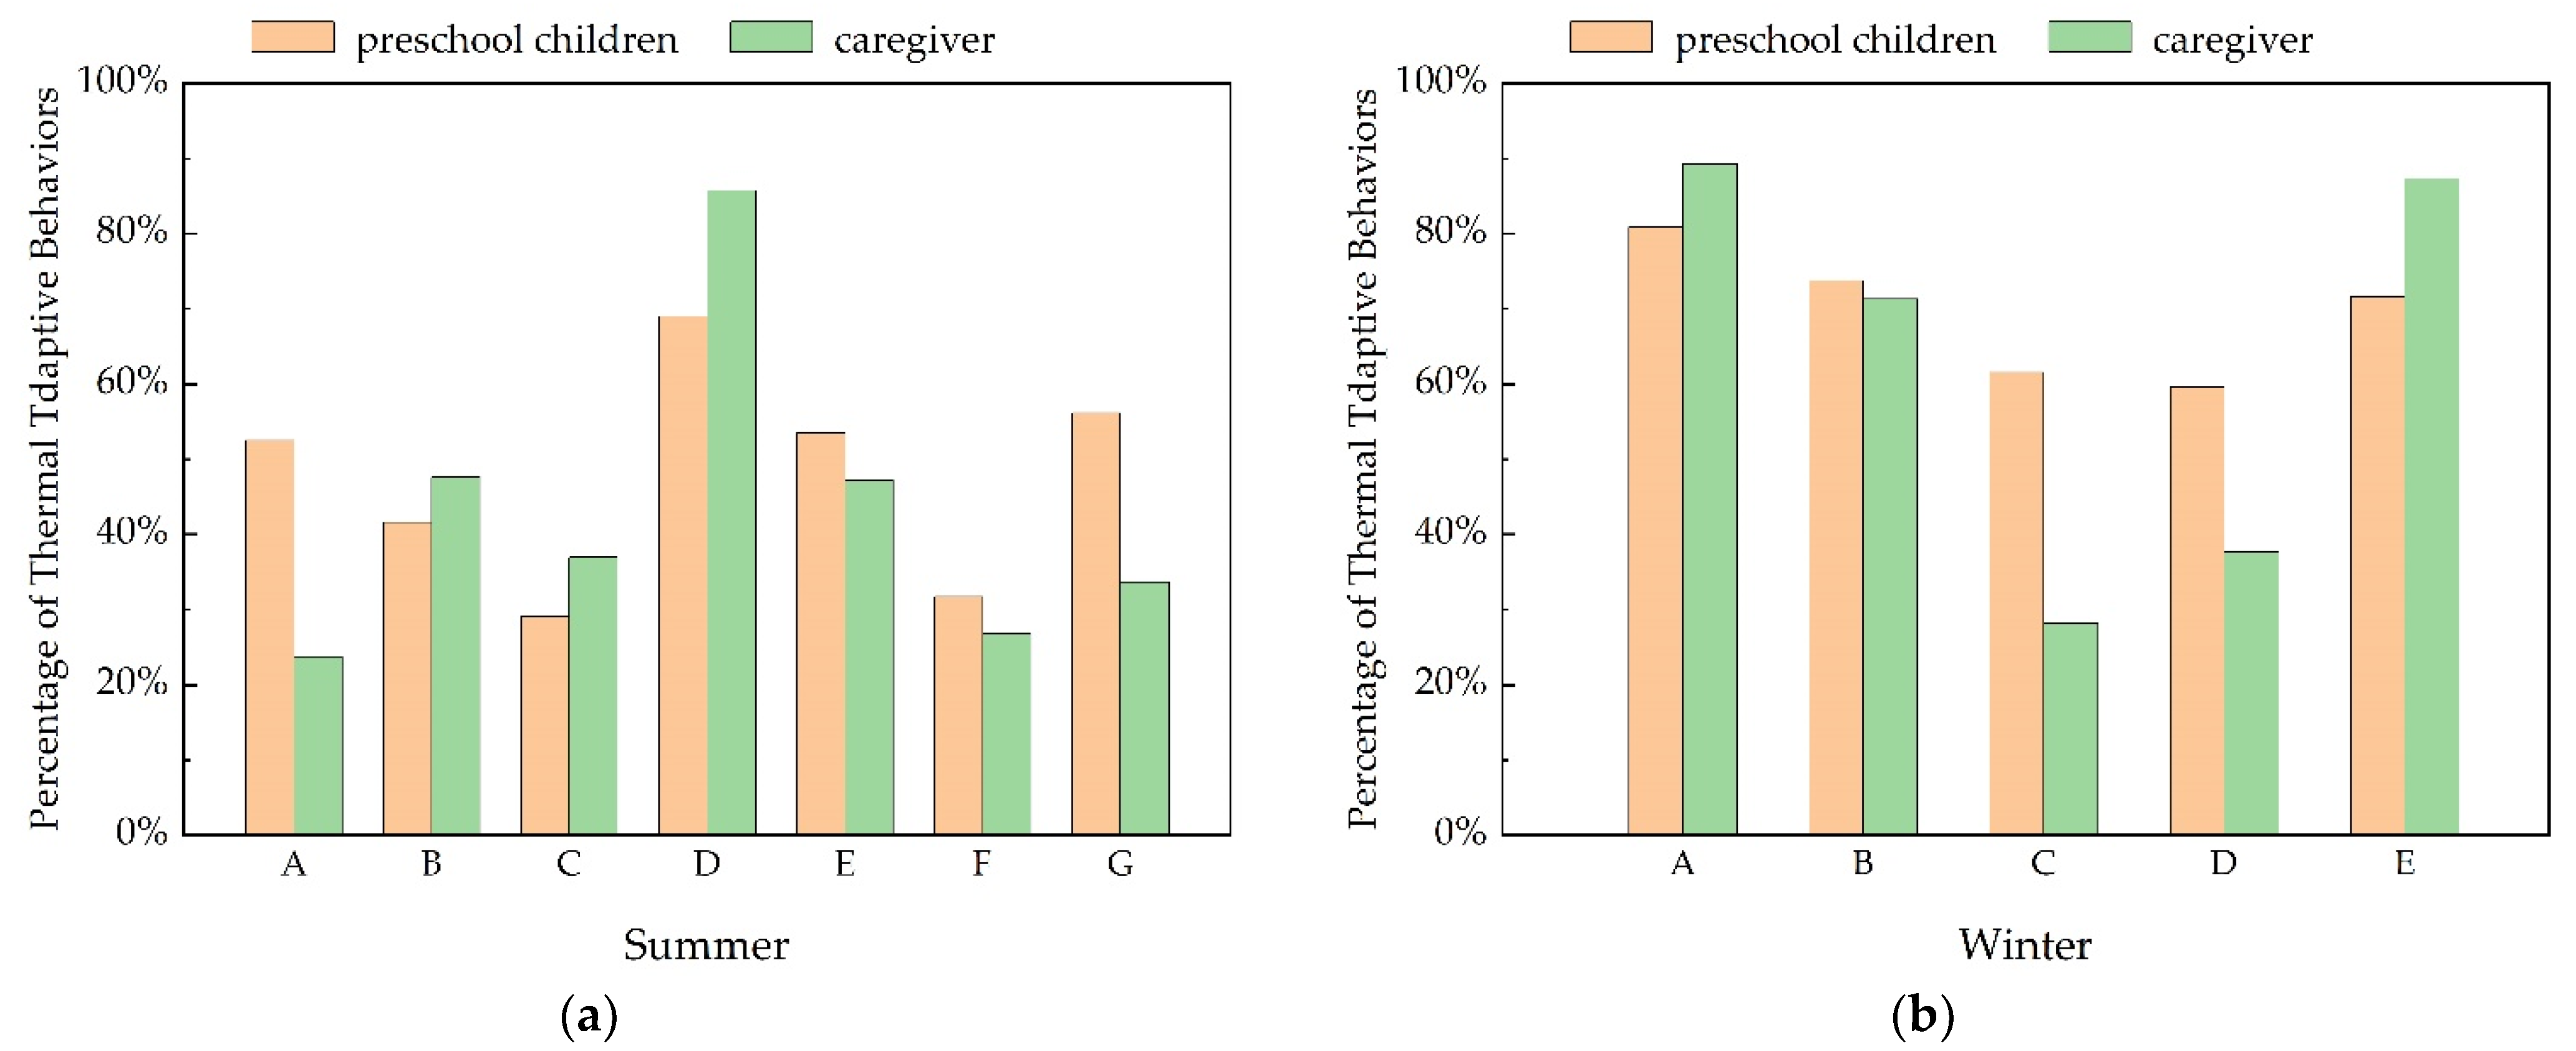
3.3.2. Thermal Adaptive Behaviors

Based on the analysis of the results of the reactive behaviors selection (Figure 8), it is clear that in summer children and caregivers have different preferences for the three options of drinking cold drinks, wearing hats, and reducing clothing. Children chose to drink cold drinks the most (52.5%), more than twice as much as caregivers (23.7%). This difference may be related to traditional Chinese beliefs that some adults believe that drinking cold drinks can have a negative impact on children’s bodies. Caregivers had the highest number opting for wearing hats (47.7%), which was similar to children (41.6%) (Figure 8). Both children and caregivers had the lowest percentages for the option to reduce clothing, 29.1% and 21.8%, respectively. This is due to the fact that the children surveyed had already been wearing the minimum socially acceptable clothing (mean clothing thermal resistance of 0.25 clo) and had reached adaptive saturation in terms of clothing [24,39].
In winter, the highest proportions of children and caregivers chose increased activity, 80.9% and 89.3%, followed by drinking hot water, 73.7% and 71.4%. The proportion of children who chose hat and gloves and additional clothing as options to improve thermal comfort was distinctly higher than caregivers. The mean thermal resistance of children’s clothing in winter was 1.52 clo, and most children did not wear hats and gloves. The caregivers thought that the children did not like to wear hats and gloves, which would cause inconvenience for the children’s outdoor activities. At the same time, they thought that the clothing they chose for the children was sufficient to cope with the cold weather in Wuhan and that adding more clothes would make the children’s activities difficult (Figure 8).
On the basis of the interactive behaviors survey data, the number of children and caregivers who chose to add shade during the summer months far exceeded the other three options, indicating that they were highly supportive of this type of environmental improvement. There were more children than caregivers who chose to add water play facilities and to use sunshades and portable fans. Children showed higher interest in water play and the use of portable fans, but caregivers showed less preference for the use of portable fans than for water play facilities, which may have been caused by the fear that children would be injured during the use of fans. In winter, 71.6% of children and 87.4% of caregivers chose to play in a sunny area. They all expressed high preferences for improving climate comfort by increasing solar radiation, which is consistent with the Preference vote results (Figure 8).

3.3.3. Application of “Research for Design”

The improvement of the thermal comfort of outdoor activity spaces can enhance the quality of children’s outdoor activity spaces and extend the time of children’s outdoor activities. According to this study, outdoor thermal comfort in Wuhan is worse in summer than that in winter, and a previous study also drew the same conclusion [47]. Therefore, it is particularly important to improve the summer thermal comfort of children’s activity spaces in Wuhan. We will propose a strategy for retrofitting outdoor children’s activity sites within parks in Wuhan to improve site thermal comfort based on the environmental behavioral preferences of the respondents, combined with the site thermal calendar.
Firstly, the thermal comfort of the environment should be improved through design, and the sites should be located in a waterfront location as often as possible, while children’s water play facilities can be added inside the site to lower the environmental temperature and increase the environmental humidity through water bodies. Moreover, the richness of plant levels and the green volume should be increased to enhance the environmental thermal comfort through green areas. Without affecting the use function, more deciduous trees should be planted, which can improve the environmental comfort by reducing solar radiation in summer, and will not reduce the site radiation in winter, causing the environment to be too cold.
Secondly, on top of environmental improvements, service facilities should be added that will support children and caregivers in improving environmental comfort. For example, hot and cold drink dispensers should be added to provide drinking water in summer and hot water in winter, so that children can improve their comfort through different temperatures of water intake in different seasons. In addition, we can design and distribute brochures to encourage caregivers and preschoolers to bring items such as umbrellas, hats and fans to improve their comfort. Rental facilities can also be provided for those who are in urgent need of such items.

4. Discussion

4.1. Children-Caregiver Differences

It was found that the differences in NPET and NPETR as evaluated by preschoolers and their caregivers were not significant, while there were differences that existed in their sensitivity to changes in meteorological factors and in thermal adaptation preferences. These differences may be caused by the following reasons:
  • There are differences in morphology, metabolism, cardiovascular and sweating rates between children and adults, which will lead to caregivers evaluating the child’s thermal comfort differently from the child’s results [48,49,50]. In addition, children have limited cognition and their behaviors and personal responses are less influenced by social experiences and traditional rules than adults, which leads children to be less sensitive than adults to changes in meteorological factors and to show differences in adaptive behavioral choices when conducting thermal environment evaluations [51,52].
  • These differences may be affected by the different activities of preschool children and their caregivers on the playground. When preschool children are engaged in outdoor activities, they focus on the game and are attracted by the natural and artificial elements of the site. Compared to changes in meteorological factors, they are more concerned with the playfulness of the site. However, for caregivers, their primary task on playgrounds is to care for their children and prevent them from being harmed, so change in meteorological factors is one of the key elements that caregivers pay attention to. Due to the different concerns of children and their caregivers on the playground, there may be differences in their sensitivity to environmental changes and climate adaptation preferences.

4.2. Thermal Benchmarks

In this section, the results of thermal benchmark studies in other regions of China are selected and discussed in comparison with this study to avoid differences in thermal benchmarks due to ethnic differences and folk customs, and to investigate the characteristics of thermal benchmarks for children in hot-summer and cold-winter regions.

4.2.1. NPET

The summer NPET of Wuhan children was similar to that of Changsha (23.3 °C) in the same climatic region. The NPET values in our study were slightly lower, and it has been confirmed that physiological differences in children can impair their tolerance of hot environments [53]. In addition, the Changsha study was conducted on a university campus and the main respondents were people under 30 years old, while our study was conducted with preschool children, and the intensity of children’s outdoor activities was higher, which may be another reason why the Wuhan NPET is lower than Changsha [54]. Chengdu’s summer NPET (24.4 °C) was also higher than Wuhan’s. In addition to the age difference, the research period in Chengdu (10:30–16:30) was the highest temperature time of the day compared to Wuhan’s all-day research (9:30–19:00), which may be another reason for Chengdu’s higher NPET than Wuhan’s [55] (Table 10).
In addition, the table shows that the summer NPET of Xi’an (20.2 °C) is lower than that of Wuhan. Since Xi’an has a shorter summer and lower mean temperature than Wuhan, Xi’an people have a lower tolerance to summer heat than Wuhan, and therefore have a lower NPET in summer [56]. Another study in Xi’an had NPET values between winter and summer in Wuhan because this study covered all seasons [29]. The winter NPET value of children in Wuhan is about 4 °C lower than that in Guangdong. Wuhan belongs to the hot summer and cold winter region, while Guangzhou belongs to the hot summer and warm winter region. The residents of Wuhan have better adaptability to the low temperature in winter, so the winter NPET will be lower than that of Guangzhou [57] (Table 10).

4.2.2. NPETR

The upper limit of NPETR (24–31 °C) in summer in Changsha is similar to that of Wuhan, but the overall range is narrower [58]. In Changsha, 88% of the research respondents in summer accepted a temperature range of 18.6–31.2 °C, but the researchers defined the NPETR with the lowest PET (24 °C) that appeared in the study as the lower limit temperature, which is an important reason for the overall narrower range than Wuhan. The width of summer NPETR in Xi’an is similar to that of Wuhan in summer, but it is about 3 °C lower than that of Wuhan, which is similar to the pattern of differences between the two NPETs [56] (Table 11).
The NPETR in Wuhan winter is the widest in the table, indicating that children are highly adaptable to the Wuhan winter climate. On the one hand, this may be caused by a warmer winter in Wuhan 2021 compared to previous years, and, on the other hand, children can cope with the cold winter climate through high metabolic intensity activities in winter, which makes them better adapted to winter weather. In addition, the NPETR of three studies from Tianjin, Xi’an and Changsha were 11–24 °C, 12.4–26.9 °C and 15–22 °C, respectively. Their upper limit is similar to Wuhan’s winter upper limit but slightly higher than Wuhan’s winter upper limit. Their lower limit is similar to Wuhan’s summer lower limit but slightly lower than Wuhan’s summer lower limit. The time of these research studies encompassing four seasons is the main reason for this phenomenon [29,54,59].

4.3. Limitations

Our study has some limitations. Although some recent studies have shown that the Tmrt calculated by black global measurements may not be completely accurate [27,60], black global measurements is still one of the main methods used to assess Tmrt in most microclimate studies due to its convenience and inexpensiveness [38,61,62]. Some scholars have found through experiments that the error can be reduced by using instruments with large-diameter balls, extending the measurement period, etc. [27]. Our research followed this corrective method, selecting an instrument with a larger diameter ball and running it in advance to reduce the error. In addition, it is worth noting that this approach can only reduce but not completely avoid the possibility of bias in the results, especially in the evaluation of NPET and NPETR values.
There are also some other limitations. Firstly, the influence of the constituent elements of space on the thermal environment has been demonstrated. This research focuses on the evaluation of thermal comfort and its improvement strategies for children’s activity sites in parks in hot-summer and cold-winter areas, and does not involve the specific analysis of spatial components. In the future, this aspect of the spatial variation of the site on the mechanism of environmental thermal comfort can be studied in order to propose environmental improvement strategies based on targeting. Secondly, different types of children’s activities can be supported by different site forms. Subsequent studies can further determine the thermal benchmarks for different types of activities for children and provide individualized thermal environment evaluation criteria for different activity venues accordingly. Finally, the study was conducted on children aged 3–6 years old playing in a park. In China, the decision of whether to go outside for outdoor activities is mostly made by the caregivers according to the weather conditions, so there is a lack of thermal sensory evaluation during overcooling and overheating periods.

5. Conclusions

Through the investigation of playgrounds in Wuhan, this study explores children’s OTC as estimated by themselves and speculated by their caregivers. The main findings are as follows:
  • TSVpc and TSVcg had the highest proportion of “neutral” in both winter and summer seasons. The proportion of “neutral” in winter is higher than in summer, and no respondents chose “very cold” in winter, which reflects that playgrounds offer better thermal comfort in winter.
  • The correlation between TSVpc and meteorological factors was weaker than that of TSVcg, indicating that children are less sensitive to changes in meteorological factors than adults.
  • The NPET of preschool children is 22.9 °C in summer and 10.6 °C in winter, while that of caregivers is 22.3 °C in summer and 11.0 °C in winter. The NPETR of preschool children is 15.7–30.2 °C in summer and 0.3–21 °C in winter, while that of caregivers is 15.4–29.3 °C in summer and 1.6–20.5 °C in winter.
  • To improve thermal comfort, preschool children and caregivers want lower temperatures in the summer and more solar radiation in the winter. They also expect to be “cooler” in the summer than “warmer” in the winter. Although both preschool children and caregivers showed a preference for summer shade and winter sunlight in their adaptive behavioral choices, there were differences between their preferences. Significantly more preschool children (52.5%) than caregivers (23.7%) chose “cold drinks” in summer, and more children than caregivers chose additional clothing and hat-gloves in winter.
  • Based on the evaluation of preschool children and caregivers, the improvement of summer comfort is important to increase the usage of playgrounds. The comfort level of the sites can be improved by planting deciduous trees and adding water play and service facilities.
These findings can help caregivers make better judgments and help researchers make accurate decisions about environmental improvement.

Author Contributions

Conceptualization, J.Q. and J.W. (Jiangping Wang); data curation, J.Q., W.Z. and Z.J.; formal analysis, W.Z.; funding acquisition, J.Q.; investigation, J.Q. and J.W. (Jingyong Wang); methodology, J.Q., W.Z. and Z.J.; project administration, J.W. (Jiangping Wang); resources, J.Q. and J.W. (Jingyong Wang); software, J.Q., W.Z. and Z.J.; supervision, J.W. (Jiangping Wang); validation, J.Q. and Z.J.; visualization, J.Q. and W.Z.; writing—original draft, J.Q. and J.W. (Jingyong Wang); writing—review and editing, J.Q., J.W. (Jiangping Wang) and J.W. (Jingyong Wang). All authors have read and agreed to the published version of the manuscript.

Funding

This research was funded by Jianghan University, grant number 3015/08210126.

Institutional Review Board Statement

Not applicable.

Informed Consent Statement

Informed consent was obtained from all subjects involved in the study.

Data Availability Statement

Not applicable.

Acknowledgments

The authors would like to thank Li Kun of Wuhan University for providing experimental instruments. We would also like to thank the volunteers at Jianghan University.

Conflicts of Interest

The authors declare no conflict of interest.

Appendix A

Table A1. Simplified garment checklist table.
SummerWinter
GarmentcloGarmentclo
TopsSleeveless vest0.06Long underwear top0.2
T-shirt, short sleeves0.08Flannel long underwear0.3
T-shirt, long sleeves0.2Thin sweater0.25
Summer jacket0.3Thick sweater0.36
Thick coat0.4
Down jacket0.55
Parka0.7
BottomsShort shorts0.06Long underwear bottoms0.15
Trousers0.20Trousers0.20
Summer skirt0.14Flannel trousers0.28
Winter skirt0.23
Upper and lower one-piece clothesSummer dress, short sleeves0.29Winter dress, long sleeves0.47
Summer dress, long sleeves0.33
SundriesThin ankle socks0.02Thick ankle socks0.05
Sandals0.02Thick long socks0.10
Thin sneakers0.02Thick sneakers0.04
Hat0.01Boots0.10
Hat0.01
Scarf0.08
Gloves0.05
Table A2. Metabolic equivalent reference table.
Preschool Children’s ActivitiesReference ActivitiesMET Units
Resting, sittingResting1.0
Swing, rocking on a chairFiling, sitting1.2
Playing with sands and walkingWalking and lifting/packing1.9
Climbing and slidingClimbing ladder and sitting and walking3.4
High-speed running, riding, and skateboardingMoving at 1.8 m/s, 6.8 km/h3.9

References

  1. Bento, G.; Dias, G. The importance of outdoor play for young children’s healthy development. Porto Biomed. J. 2017, 2, 157–160. [Google Scholar] [CrossRef]
  2. Jutras, S. Go outside and play! Contributions of an urban environment to the developing and wellbeing of children. Can. Psychol. Psychol. Can. 2003, 44, 257–266. [Google Scholar] [CrossRef]
  3. Oakley, J.; Peters, R.L.; Wake, M.; Grobler, A.C.; Kerr, J.A.; Lycett, K.; Cassim, R.; Russell, M.; Sun, C.; Tang, M.L.K.; et al. Backyard benefits? A cross-sectional study of yard size and greenness and children’s physical activity and outdoor play. BMC Public Health 2021, 21, 1402. [Google Scholar] [CrossRef] [PubMed]
  4. McCurdy, L.E.; Winterbottom, K.E.; Mehta, S.S.; Roberts, J.R. Using nature and outdoor activity to improve children’s health. Curr. Problem Pediatr. Adoles. Health Care. 2010, 40, 102–117. [Google Scholar] [CrossRef] [PubMed]
  5. Flouri, E.; Midouhas, E.; Joshi, H. The role of urban neighbourhood green space in children’s emotional and behavioural resilience. J. Environ. Psychol. 2014, 40, 179–186. [Google Scholar] [CrossRef]
  6. Vella-Brodrick, D.A.; Gilowska, K. Effects of Nature (Greenspace) on Cognitive Functioning in School Children and Adolescents: A Systematic Review. Educ. Psychol. Rev. 2022, 1–38. [Google Scholar] [CrossRef]
  7. Sherbakov, T.; Malig, B.; Guirguis, K.; Gershunov, A.; Basu, R. Ambient temperature and added heat wave effects on hospitalizations in California from 1999 to 2009. Environ. Res. 2018, 160, 83–90. [Google Scholar] [CrossRef]
  8. Grundstein, A.J.; Scarneo-Miller, S.E.; Adams, W.M.; Casa, D.J. From theory to practice: Operationalizing a climate vulnerability for sport organizations framework for heat hazards among US High schools. J. Sci. Med. Sport 2020, 24, 718–722. [Google Scholar] [CrossRef]
  9. Akerlof, K.; Debono, R.; Berry, P.; Leiserowitz, A.; Roser-Renouf, C.; Clarke, K.-L.; Rogaeva, A.; Nisbet, M.C.; Weathers, M.R.; Maibach, E.W. Public Perceptions of Climate Change as a Human Health Risk: Surveys of the United States, Canada and Malta. Int. J. Environ. Res. Public Health 2010, 7, 2559–2606. [Google Scholar] [CrossRef]
  10. Tremblay, M.S.; Gray, C.; Babcock, S.; Barnes, J.; Bradstreet, C.C.; Carr, D.; Chabot, G.; Choquette, L.; Chorney, D.; Collyer, C.; et al. Position Statement on Active Outdoor Play. Int. J. Environ. Res. Public Health 2015, 12, 6475–6505. [Google Scholar] [CrossRef] [Green Version]
  11. Tremblay, M.S.; Barnes, J.D.; González, S.A.; Katzmarzyk, P.T.; Onywera, V.O.; Reilly, J.J.; Tomkinson, G.R. Global matrix 2.0: Report card grades on the physical activity of children and youth comparing 38 countries. J. Phys. Act. Health 2016, 13, S343–S366. [Google Scholar] [CrossRef] [PubMed]
  12. Antoniadis, D.; Katsoulas, N.; Papanastasiou, D. Thermal Environment of Urban Schoolyards: Current and Future Design with Respect to Children’s Thermal Comfort. Atmosphere 2020, 11, 1144. [Google Scholar] [CrossRef]
  13. ISO 7730; Ergonomics of the Thermal Environment—Analytical Determination and Interpretation of Thermal Comfort using Calcu-lation of the PMV and PPD Indices and Local Thermal Comfort. International Standardization Organization: Geneva, Switzerland, 2005.
  14. ANSI/ASHRAE Standard 55-2020; Thermal Environmental Conditions for Human Occupancy. ASHRAE: Atlanta, GA, USA, 2020.
  15. ISO 8996; Ergonomics of the Thermal Environment—Determination of Metabolic Rate. International Standardization Organization: Geneva, Switzerland, 2021.
  16. ISO 7243; Ergonomics of the Thermal Environment—Assessment of Heat Stress using the WBGT (Wet Bulb Globe Temperature) Index. International Standardization Organization: Geneva, Switzerland, 2017.
  17. Haddad, S.; Osmond, P.; King, S. Revisiting thermal comfort models in Iranian classrooms during the warm season. Build Res. Inform. 2017, 45, 457–473. [Google Scholar] [CrossRef]
  18. Aparicio-Ruiz, P.; Barbadilla-Martín, E.; Guadix, J.; Muñuzuri, J. A field study on adaptive thermal comfort in Spanish primary classrooms during summer season. Build. Environ. 2021, 203, 108089. [Google Scholar] [CrossRef]
  19. Teli, D.; Jentsch, M.F.; James, P.A.B. Naturally ventilated classrooms: An assessment of existing comfort models for predicting the thermal sensation and preference of primary school children. Energy Build. 2012, 53, 166–182. [Google Scholar] [CrossRef]
  20. Vanos, J.K.; Herdt, A.J.; Lochbaum, M.R. Effects of physical activity and shade on the heat balance and thermal perceptions of children in a playground microclimate. Build. Environ. 2017, 126, 119–131. [Google Scholar] [CrossRef]
  21. Huang, B.; Hong, B.; Tian, Y.; Yuan, T.; Su, M. Outdoor thermal benchmarks and thermal safety for children: A study in China’s cold region. Sci. Total Environ. 2021, 787, 147603. [Google Scholar] [CrossRef]
  22. Liu, Z.; Jim, C. Playing on natural or artificial turf sports field? Assessing heat stress of children, young athletes, and adults in Hong Kong. Sustain. Cities Soc. 2021, 75, 103271. [Google Scholar] [CrossRef]
  23. Peel, M.C.; Finlayson, B.L.; McMahon, T.A. Updated world map of the Köppen-Geiger climate classification. Hydrol. Earth Syst. Sci. 2007, 11, 1633–1644. [Google Scholar] [CrossRef]
  24. Wuhan Local Chronicles Digital Local Chronicles Museum. Wuhan Chronicle—Volume 1 General Category Urban Construction. Available online: http://szfzg.wuhan.gov.cn/book/dfz/bookread/id/249/category_id/49630.html (accessed on 12 July 2021).
  25. Li, K.; Li, X.; Yao, K. Outdoor Thermal Environments of Main Types of Urban Areas during Summer: A Field Study in Wuhan, China. Sustainability 2022, 14, 952. [Google Scholar] [CrossRef]
  26. Nasrollahi, N.; Ghosouri, A.; Khodakarami, J.; Taleghani, M. Heat-Mitigation Strategies to Improve Pedestrian Thermal Comfort in Urban Environments: A Review. Sustainability 2020, 12, 10000. [Google Scholar] [CrossRef]
  27. Oliveira, A.V.M.; Raimundo, A.M.; Gaspar, A.R.; Quintela, D.A. Globe Temperature and Its Measurement: Requirements and Limitations. Ann. Work Expo. Health 2019, 63, 743–758. [Google Scholar] [CrossRef] [PubMed]
  28. Matzarakis, A.; Rutz, F.; Mayer, H. Modelling radiation fluxes in simple and complex environments—Application of the RayMan model. Int. J. Biometeorol. 2007, 51, 323–334. [Google Scholar] [CrossRef]
  29. Mi, J.; Hong, B.; Zhang, T.; Huang, B.; Niu, J. Outdoor thermal benchmarks and their application to climate—responsive designs of residential open spaces in a cold region of China. Build. Environ. 2019, 169, 106592. [Google Scholar] [CrossRef]
  30. Nikolopoulou, M.; Steemers, K. Thermal comfort and psychological adaptation as a guide for designing urban spaces. Energy Build. 2003, 35, 95–101. [Google Scholar] [CrossRef]
  31. Sun, C.-Y. A street thermal environment study in summer by the mobile transect technique. Arch. Meteorol. Geophys. Bioclimatol. Ser. B 2011, 106, 433–442. [Google Scholar] [CrossRef]
  32. Oliveira, S.; Andrade, H. An initial assessment of the bioclimatic comfort in an outdoor public space in Lisbon. Int. J. Biometeorol. 2007, 52, 69–84. [Google Scholar] [CrossRef]
  33. Kántor, N.; Unger, J. Benefits and opportunities of adopting GIS in thermal comfort studies in resting places: An urban park as an example. Landsc. Urban Plan. 2010, 98, 36–46. [Google Scholar] [CrossRef]
  34. Kántor, N.; Kovács, A.; Takács, Á. Seasonal differences in the subjective assessment of outdoor thermal conditions and the impact of analysis techniques on the obtained results. Int. J. Biometeorol. 2016, 60, 1615–1635. [Google Scholar] [CrossRef]
  35. Cheung, P.K.; Jim, C. Improved assessment of outdoor thermal comfort: 1-hour acceptable temperature range. Build. Environ. 2019, 151, 303–317. [Google Scholar] [CrossRef]
  36. Höppe, P. Die Wärmebilanzmodelle MEMI und IMEM zur Bewertung der thermischen Beanspruchung am Arbeitsplatz. Verh Dtsch Ges Arb. Umw. 1994, 34, 153–158. [Google Scholar]
  37. Baruti, M.M.; Johansson, E.; Yahia, M.W. Urbanites’ outdoor thermal comfort in the informal urban fabric of warm-humid Dar es Salaam, Tanzania. Sustain. Cities Soc. 2020, 62, 102380. [Google Scholar] [CrossRef]
  38. Makvandi, M.; Zhou, X.; Li, C.; Deng, Q. A Field Investigation on Adaptive Thermal Comfort in an Urban Environment Considering Individuals’ Psychological and Physiological Behaviors in a Cold-Winter of Wuhan. Sustainability 2021, 13, 678. [Google Scholar] [CrossRef]
  39. Matzarakis, A.; Rutz, F.; Mayer, H. Modelling radiation fluxes in simple and complex environments: Basics of the RayMan model. Int. J. Biometeorol. 2010, 54, 131–139. [Google Scholar] [CrossRef] [PubMed]
  40. Havenith, G. Metabolic rate and clothing insulation data of children and adolescents during various school activities. Ergonomics 2007, 50, 1689–1701. [Google Scholar] [CrossRef]
  41. Ainsworth, B.E.; Haskell, W.L.; Leon, A.S.; Jacobs, D.R., Jr.; Montoye, H.J.; Sallis, J.F.; Paffenbarger Jr, R.S. Compendium of physical activities: Classification of energy costs of human physical activities. Med. Sci. Sport Exerc. 1993, 25, 71–80. [Google Scholar] [CrossRef]
  42. Ainsworth, B.E.; Haskell, W.L.; Whitt, M.C.; Irwin, M.L.; Swartz, A.M.; Strath, S.J.; O’Brien, W.L.; Bassett, D.R., Jr.; Schmitz, K.H.; Emplaincourt, P.O.; et al. Compendium of Physical Activities: An update of activity codes and MET intensities. Med. Sci. Sports Exerc. 2000, 32, S498–S516. [Google Scholar] [CrossRef]
  43. National Health Commission of the People’s Republic of China. Notice of the Department of Women’s and Social Security of the Ministry of Health on Printing and Distributing the “Reference Standards for the Growth and Development of Children Under 7 Years of Age in China”. Available online: http://www.nhc.gov.cn/wjw/gfxwj/201304/b64543eaaee1463992e8ce97441c59bb.shtml (accessed on 12 July 2021).
  44. Haycock, G.B.; Schwartz, G.J.; Wisotsky, D.H. Geometric method for measuring body surface area: A height-weight formula validated in infants, children, and adults. J. Pediatr. 1978, 93, 62–66. [Google Scholar] [CrossRef]
  45. Schofield, W.N. Predicting basal metabolic rate, new standards and review of previous work. Hum. Nutr. Clin. Nutr. 1985, 39 (Suppl. S1), 5–41. [Google Scholar]
  46. Chen, W.; Deng, Y.; Cao, B. An experimental study on the difference in thermal comfort perception between preschool children and their parents. J. Build. Eng. 2022, 56, 104723. [Google Scholar] [CrossRef]
  47. Li, K.; Xia, T.; Li, W. Evaluation of Subjective Feelings of Outdoor Thermal Comfort in Residential Areas: A Case Study of Wuhan. Buildings 2021, 11, 389. [Google Scholar] [CrossRef]
  48. Falk, B.; Dotan, R. Children’s thermoregulation during exercise in the heat—a revisit. Appl. Physiol. Nutrit. Metab. 2008, 33, 420–427. [Google Scholar] [CrossRef] [PubMed]
  49. Smith, C.J. Pediatric Thermoregulation: Considerations in the Face of Global Climate Change. Nutrients 2019, 11, 2010. [Google Scholar] [CrossRef] [PubMed]
  50. Notley, S.R.; Akerman, A.P.; Meade, R.D.; Mcgarr, G.W.; Kenny, G.P. Exercise Thermoregulation in Prepubertal Children: A Brief Methodological Review. Med. Sci. Sports Exerc. 2020, 52, 2412–2422. [Google Scholar] [CrossRef]
  51. Ciucci, E.; Calussi, P.; Menesini, E.; Mattei, A.; Petralli, M.; Orlandini, S. Seasonal variation, weather and behavior in day-care children: A multilevel approach. Int. J. Biometeorol. 2012, 57, 845–856. [Google Scholar] [CrossRef]
  52. Vanos, J.K. Children’s health and vulnerability in outdoor microclimates: A comprehensive review. Environ. Int. 2015, 76, 1–15. [Google Scholar] [CrossRef]
  53. Leites, G.T.; Cunha, G.S.; Obeid, J.; Wilk, B.; Meyer, F.; Timmons, B.W. Thermoregulation in boys and men exercising at the same heat production per unit body mass. Eur. J. Appl. Physiol. 2016, 116, 1411–1419. [Google Scholar] [CrossRef]
  54. Liu, W.; Zhang, Y.; Deng, Q. The effects of urban microclimate on outdoor thermal sensation and neutral temperature in hot-summer and cold-winter climate. Energy Build. 2016, 128, 190–197. [Google Scholar] [CrossRef]
  55. Zeng, Y.; Dong, L. Thermal human biometeorological conditions and subjective thermal sensation in pedestrian streets in Chengdu, China. Int. J. Biometeorol. 2014, 59, 99–108. [Google Scholar] [CrossRef]
  56. Niu, J.; Hong, B.; Geng, Y.; Mi, J.; He, J. Summertime physiological and thermal responses among activity levels in campus outdoor spaces in a humid subtropical city. Sci. Total Environ. 2020, 728, 138757. [Google Scholar] [CrossRef]
  57. Li, K.; Zhang, Y.; Zhao, L. Outdoor thermal comfort and activities in the urban residential community in a humid subtropical area of China. Energy Build. 2016, 133, 498–511. [Google Scholar] [CrossRef]
  58. Yang, W.; Wong, N.H.; Zhang, G. A comparative analysis of human thermal conditions in outdoor urban spaces in the summer season in Singapore and Changsha, China. Int. J. Biometeorol. 2012, 57, 895–907. [Google Scholar] [CrossRef] [PubMed]
  59. Chen, Q.; Lin, C.; Guo, D.; Hou, Y.; Lai, D. Studies of outdoor thermal comfort in northern China. Build. Environ. 2014, 77, 110–118. [Google Scholar] [CrossRef]
  60. Alfano, F.D.; Ficco, G.; Frattolillo, A.; Palella, B.; Riccio, G. Mean Radiant Temperature Measurements through Small Black Globes under Forced Convection Conditions. Atmosphere 2021, 12, 621. [Google Scholar] [CrossRef]
  61. Lau, K.K.-L.; Choi, C.Y. The influence of perceived aesthetic and acoustic quality on outdoor thermal comfort in urban environment. Build. Environ. 2021, 206, 108333. [Google Scholar] [CrossRef]
  62. Khalili, S.; Fayaz, R.; Zolfaghari, S.A. Analyzing outdoor thermal comfort conditions in a university campus in hot-arid climate: A case study in Birjand, Iran. Urban Clim. 2022, 43, 101128. [Google Scholar] [CrossRef]
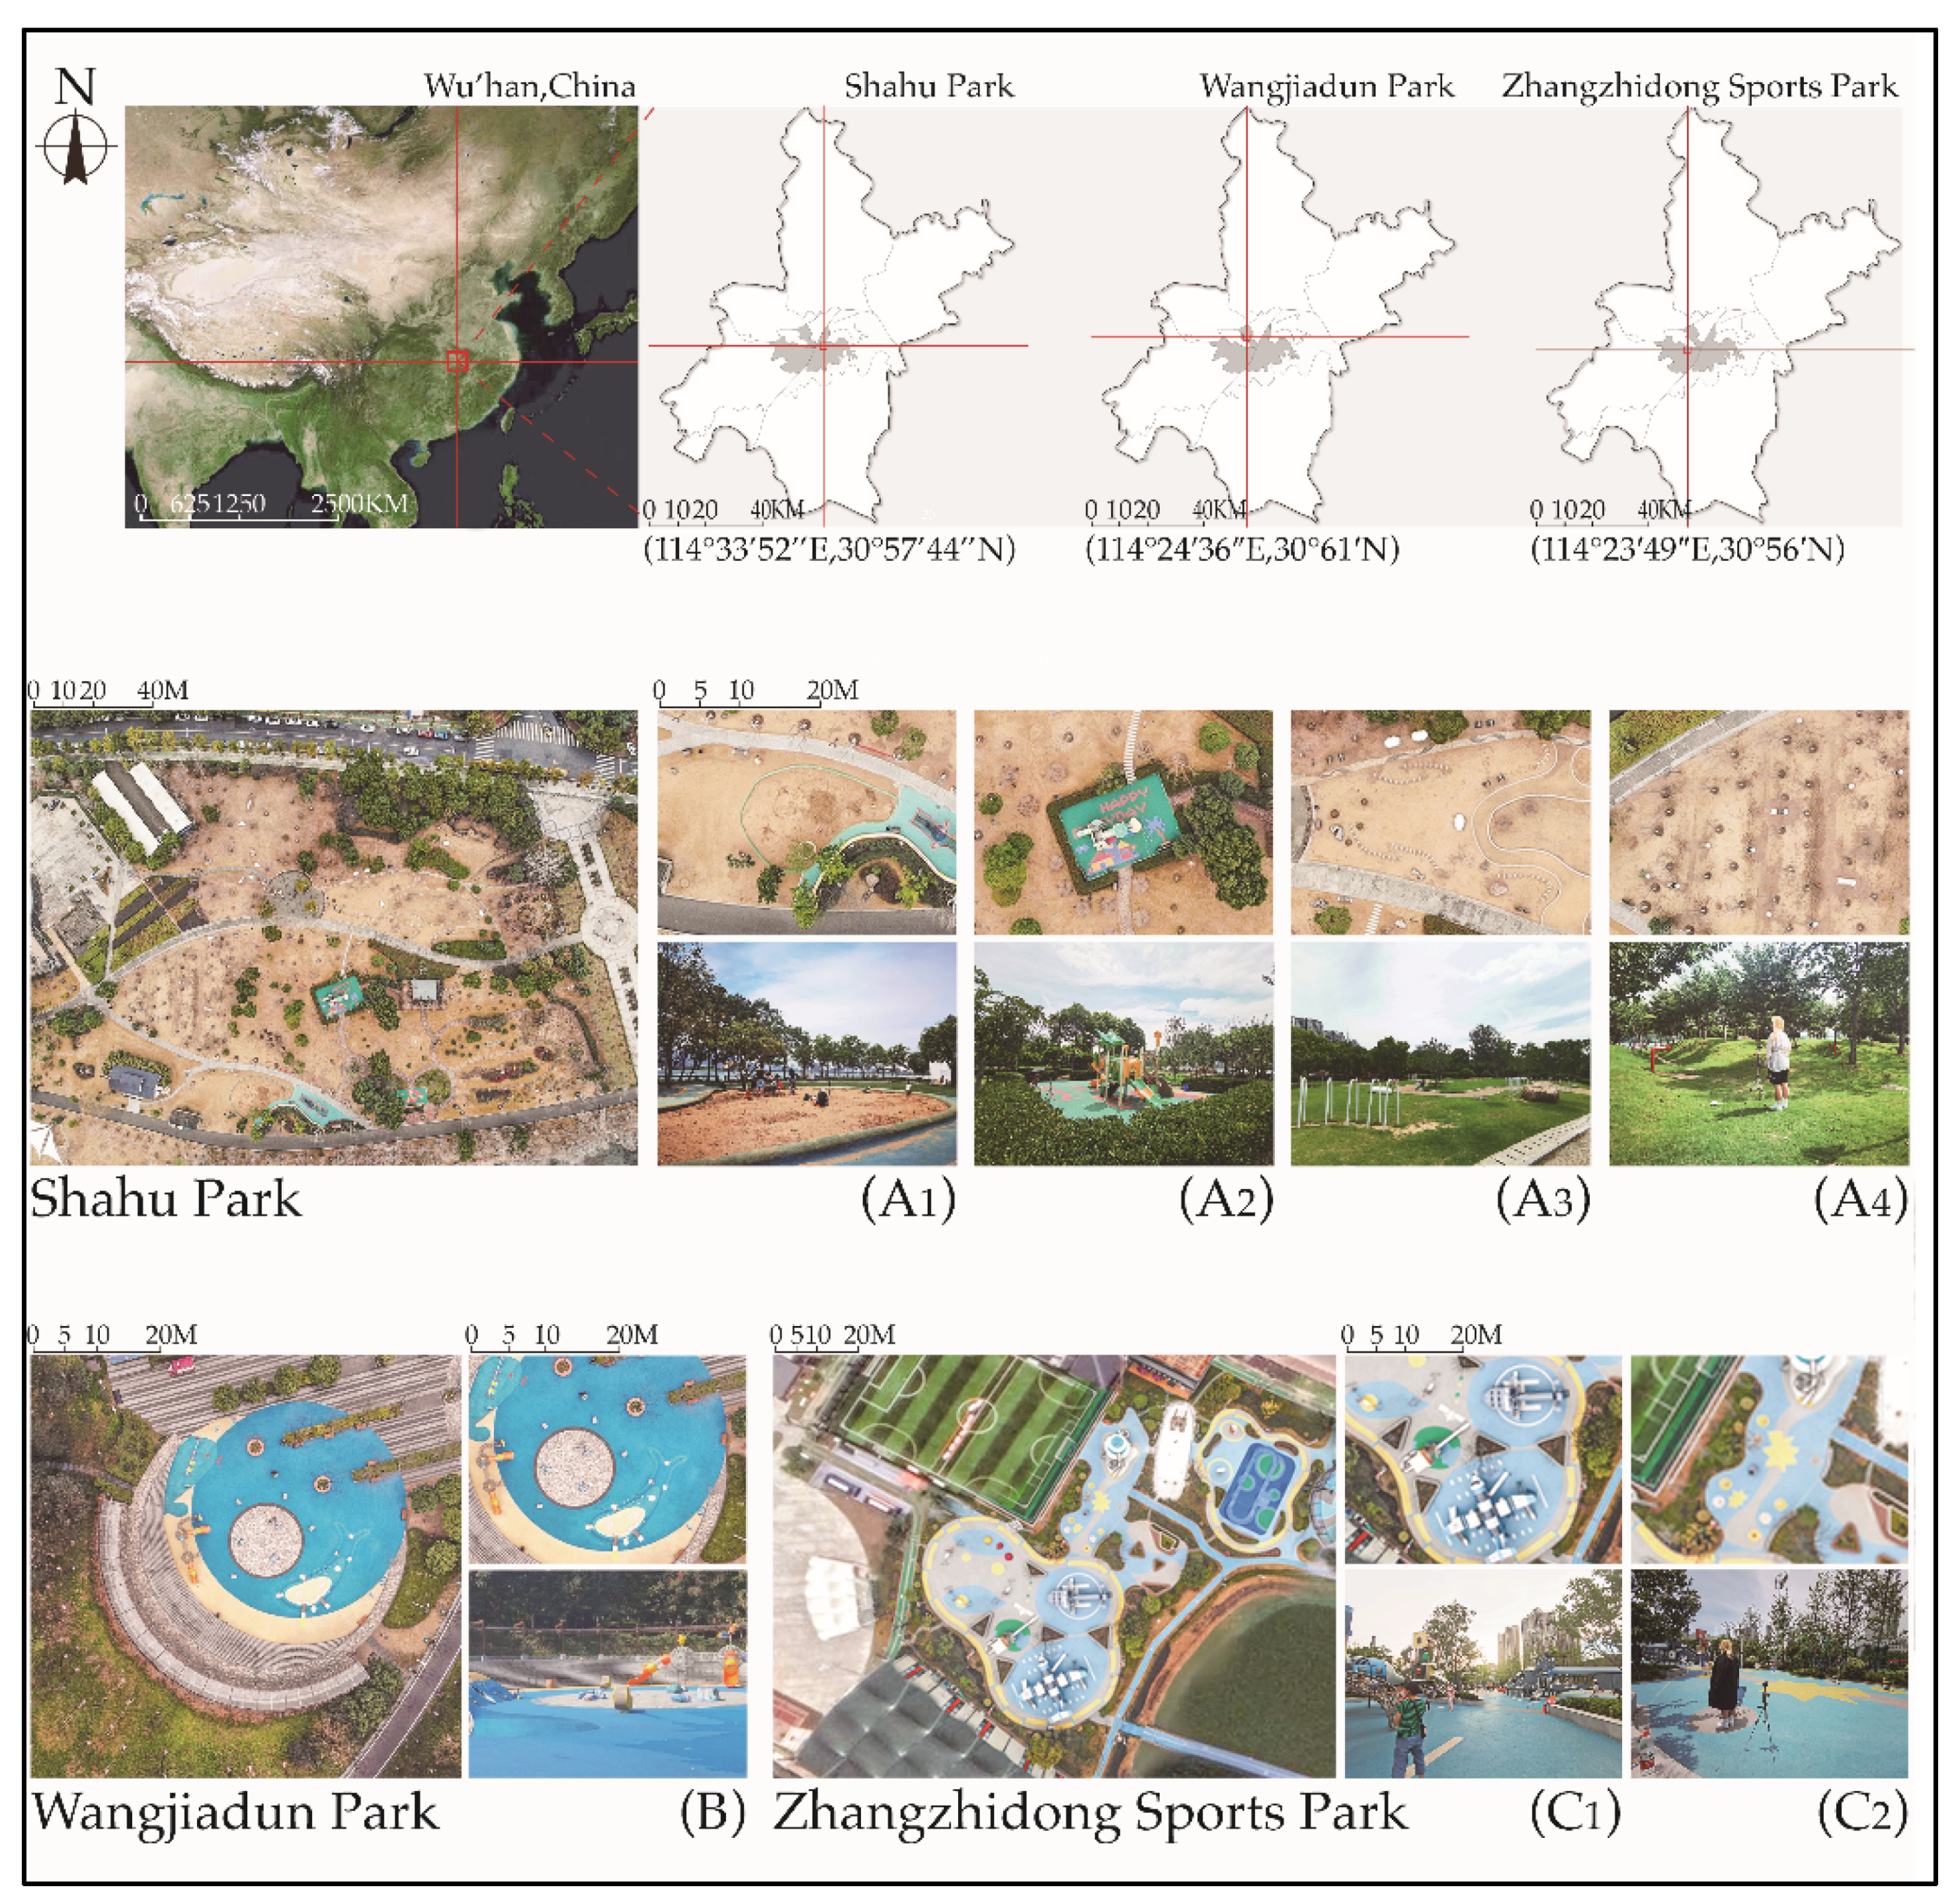
Figure 1. Site locations and study spaces. (A1A4) are located in Shahu Park, (B) is located in Wangjiadun Park, and (C1,C2) are located in Zhangzhidong Sports Park, details of which are shown in Table 1.
Sustainability 14 10926 g001
Figure 2. Outdoor thermal comfort questionnaire (English translation from the original Chinese).
Sustainability 14 10926 g002
Figure 3. TSV distributions.
Sustainability 14 10926 g003
Figure 4. Correlation between PET and MTSV (summer (a), winter (b)).
Sustainability 14 10926 g004
Figure 5. Summer thermal calendars for the seven sites.
Sustainability 14 10926 g005
Figure 6. Winter thermal calendars for the seven sites.
Sustainability 14 10926 g006
Figure 7. Meteorological parameter preference votes during summer (a) and winter (b). (PC—preschool children, CG—caregiver, T—temperature, W—wind, S—solar radiation).
Sustainability 14 10926 g007
Figure 8. Preferred thermal adaptive behaviors. (a) for summer (A—Drink cold drinks, B—Put on hat, C—Remove clothes, D—Play under tree shade, E—Play with water, F—Use umbrella, G—Use fan); (b) for winter (A—Increase activity intensity, B—Drink hot water, C—Put on hat-gloves, D—Increase clothes, E—Play under sunshine).
Sustainability 14 10926 g008
Table 1. Descriptions of the seven playgrounds.
ParkSite No.Site CharacteristicsSurvey Date
Shahu ParkA1Close to water bodies, sandy underlying surface, little vegetation, low arbor coverage.20 September 2021
2 January 2022
15 January 2022
A2Site with event facilities and enclosed by bushes.
A3Meadow as underlying surface, open site with no trees and shrubs.
A4Natural grass slope planted with deciduous trees.
Wangjiadun ParkBThe southwest side is a hillside, and the monitoring core area is a plastic underlying surface with no vegetation.18 September 2021
9 January 2022
Zhangzhidong Sports ParkC1Plastic underlying surface, large-scale event facilities, and few deciduous trees.12 September 2021
3 January 2022
8 January 2022
C2Plastic underlying surface, small-scale event facilities, and few evergreen trees.
Table 2. Technical details of meteorological equipment.
InstrumentationParameterRangeAccuracy
WSZY-1Air temperature−40–100 °C±0.5 °C
Relative humidity0–100%±3%
AZ87786Black globe temperature0–80 °C±1.5 °C
UT363 BTWind speed0–30 m/s±(5% + 0.5) m/s
Table 3. Metabolic rate for children of different activities.
Metabolic Rate (W)
Age Resting, SittingSwing, Rocking on a ChairPlaying with Sands, WalkingClimbing and SlidingHigh Speed Running, Riding and Skateboarding
3Male40.8 48.9 77.5 138.7 159.1
Female38.0 45.6 72.2 129.2 148.2
4Male43.4 52.1 82.5 147.7 169.4
Female40.3 48.3 76.5 136.9 157.0
5Male46.2 55.4 87.7 156.9 180.0
Female42.5 51.0 80.8 144.6 165.9
6Male48.7 58.5 92.6 165.7 190.1
Female44.8 53.7 85.0 152.2 174.5
Table 4. Respondent distributions.
Shahu ParkWangjiadun ParkZhangzhidong Sports Park
Summer1418082
Winter18965162
Table 5. Volunteers’ attributes.
SummerWinter
AgeTotalAgeTotal
34563456
NumbersMale2637504916258736056247
Female2124514514129505535169
Mean ValueHeight (cm)100109113122111100106112122110
Weight (kg)16.417.819.624.019.316.117.719.523.419.1
Clo (clo)0.250.250.250.260.251.511.531.541.491.52
Metabolic rates (W)103.4121.5129.2144.1127.9107.0117.18118.9137.4119.9
Table 6. Measurements of meteorological variables among spaces in summer.
Site Ta (°C)RH (%)Tg (°C)Va (m/s)Tmrt (°C)PET (°C)
A1Max32.672.343.21.7074.453.8
Mean28.756.333.80.9846.136.0
Min24.633.524.90.3022.421.7
A2Max35.273.542.11.1051.044.3
Mean30.553.433.70.3337.434.1
Min25.440.424.40.1020.719.7
A3Max33.075.244.30.6063.649.7
Mean28.855.934.20.3242.135.7
Min24.544.323.80.0023.224.1
A4Max35.173.940.30.5048.742.4
Mean30.553.333.70.2637.634.5
Min25.240.824.60.0024.125.3
BMax42.850.050.10.4060.753.0
Mean37.733.642.90.2348.945.0
Min31.225.630.60.0030.532.3
C1Max42.845.651.20.8062.955.8
Mean39.133.443.60.3948.945.7
Min33.123.032.20.1030.631.6
C2Max46.248.852.70.6062.257.6
Mean40.727.544.40.4949.947.1
Min32.917.632.40.4030.231.6
TotalMax46.275.252.71.7074.457.6
Mean33.644.938.00.4344.439.7
Min24.517.623.80.0020.719.7
Table 7. Measurements of meteorological variables among spaces in winter.
Ta (°C)RH (%)Tg (°C)Va (m/s)Tmrt (°C)PET (°C)
A1Max22.251.229.00.3638.127.0
Mean17.031.720.50.0722.720.4
Min10.721.39.70.009.711.5
A2Max25.443.727.70.3931.427.4
Mean18.029.319.90.0721.020.0
Min10.319.49.30.009.311.2
A3Max20.742.928.30.3336.128.1
Mean17.127.321.40.0924.420.7
Min10.318.09.30.009.311.2
A4Max22.046.429.60.3436.328.7
Mean16.929.620.50.0822.820.3
Min10.119.09.00.009.011.0
BMax11.764.515.20.1115.215.1
Mean10.255.911.70.0212.112.4
Min8.448.87.9 0.007.99.9
C1Max24.244.929.40.5540.929.8
Mean19.627.822.90.2027.423.2
Min12.619.110.90.0010.913.0
C2Max24.544.228.20.4236.527.4
Mean19.328.221.70.1424.221.7
Min12.818.611.30.0011.313.3
TotalMax25.464.529.60.5540.929.8
Mean16.932.819.80.1022.119.8
Min8.418.07.90.007.99.9
Table 8. Spearman correlation analysis between meteorological variables and TSV.
Ta (°C)RH (%)Tg (°C)Va (m/s)Tmrt (°C)PET (°C)
SummerTSVcg0.558 **−0.492 **0.505 **−0.335 **0.395 **0.512 **
TSVpc0.375 **−0.328 **0.339 **−0.272 **0.264 **0.340 **
WinterTSVcg0.452 **−0.439 **0.434 **0.113 *0.413 **0.465 **
TSVpc0.421 **−0.395 **0.411 **0.0690.379 **0.433 **
** Significance at 0.01 level (two-tailed); * Significance at 0.05 level (two-tailed).
Table 9. PET calibrations of TSV.
Thermal
Sensation
Thermal
Stress
PET Range (°C)
SummerWinter
PcCgPcCg
NeutralNo thermal stress15.7–30.215.4–29.30.3–21.01.6–20.5
WarmSlight heat stress30.2–44.729.3–43.221.0–41.720.5–39.3
HotModerate heat stress44.7–59.243.2–57.1
Pc—Preschool children; Cg—Caregiver.
Table 10. NPETs among OTC studies.
City, CountryClimate ZoneBuilding ClimateSeasonPopulationNPET (°C)
Wuhan, China
(this study)
CfaHSCWSummerPreschool children22.9
Caregiver22.3
WinterPreschool children10.6
Caregiver11.0
Changsha, China [54]CfaHSCWSummerYoung adults23.3
Chengdu, China [55]CwaHSCWSummerMixed populations24.4
Xi’an, China [56]Cwa/BSkCSummerCollege students 20.2
Xi’an, China [29]Cwa/BSkCAll YearMixed populations19.7
Guangzhou, China [57]CfaHSWWWinterMixed populations15.6
Table 11. NPETRs among OTC studies.
City, CountryClimate ZoneBuilding ClimateSeasonPopulationNPETR (°C)
Wuhan, China
(this study)
CfaHSCWSummerPreschool children15.7–30.2
Caregiver15.4–29.3
WinterPreschool children0.3–21.0
Caregiver1.6–20.5
Changsha, China [58]CfaHSCWSummerMixed populations24–31
Xi’an, China [56]Cwa/BSkCSummerCollege students12.7–27.7
Tianjin, China [59]Cwa/BSkCAll YearMixed populations11–24
Xi’an, China [29]Cwa/BSkCAll YearMixed populations12.4–26.9
Changsha, China [54]CfaHSCWAll YearMixed populations15–22
Publisher’s Note: MDPI stays neutral with regard to jurisdictional claims in published maps and institutional affiliations.

