1. Introduction
Since the beginning of the 21st century, emerging donors have developed an aid innovation package that combines concessional foreign aid with a variety of financial instruments. From 2013 to 2018, China provided the least developed countries (LDCs) and low- and middle-income countries with a total of USD 42.58 billion in grants, interest-free loans, and concessional loans, and promised to provide USD 218 billion in aid reservation funds and special-purpose loans [
1,
2]. Many of China’s foreign aid projects are in the infrastructure and trade sectors, which not only increase employment in the short term but also contribute to long-term local economic growth [
3]. It is reported that China has surpassed the United States and become the largest donor in Africa [
4,
5]. Along with the proceeding of the Belt and Road Initiative, the scale of China’s foreign aid is expected to continue increasing in the foreseeable future. Therefore, it is necessary to consider the fundamental mechanisms by which China’s foreign aid affects the growth drivers of recipient countries as such development finance plays a significant role in their international financing arrangements.
China’s foreign aid differs significantly from conventional foreign aid. Much of China’s aid cannot be classified as official development assistance (ODA), the “gold standard” of foreign aid that dominates traditional donors’ endowments for development assistance. As a result, prior research on China’s foreign aid has yielded divergent opinions and no consensus conclusion [
6,
7,
8]. One important point that affects academic analysis of China’s foreign aid is that its classification and the link with international aid specifications are not clear. Also rarely discussed is the heterogeneity of China’s foreign aid classifications. In fact, the majority of the existing literature examines the economic effects of China’s foreign aid [
3,
8,
9]. There is limited research [
10] on the mechanisms by which China’s foreign aid affects the economic growth of recipient countries. Our research contributes to the existing body of knowledge in the aforementioned two areas.
Using instrumental variables and stepwise regressions, we empirically examine, by category, the impact of China’s foreign aid on the economic growth of 121 recipient countries from 2000 to 2017. In addition, we discuss how China’s foreign aid influences the economic growth of recipient countries via three channels: factor mobility, FDI, and international trade. In addition, we find that growth aid (see
Section 3 for details) has a positive impact on all recipient countries, with a greater impact on low-income recipient countries than on high-income recipient countries. We also find that low-income recipients benefit most from welfare aid (see
Section 3 for details). The results of our robustness tests are consistent.
The rest of this paper is organized as follows.
Section 2 provides a literature review and the theoretical framework.
Section 3 classifies China’s foreign assistance according to CRS codes.
Section 4 describes the empirical model setting and data.
Section 5 is an empirical analysis.
Section 6 concludes.
2. Literature Review and Theoretical Framework
2.1. Literature Review
Foreign aid is a complex economic activity that can be analyzed using either the classical growth model or the new growth model [
11,
12,
13]. On the one hand, both the Harrod–Domar growth model and the two-gap model provide theoretical support for the positive impact of foreign aid on recipient countries [
11,
14,
15,
16,
17,
18]. On the other hand, liberal economists [
19] assert that foreign aid contributes to corruption and impedes economic growth. Jepma [
20] conducts a comprehensive review of the foreign aid literature published since the 1970s and concludes that the majority of foreign aid increases recipient countries’ public consumption while squeezing out private savings and investment, thereby having no appreciable effect on economic development. In contrast, Arndt et al. [
21] find that, since 2008, the majority of empirical studies based on cross-country analysis have revealed a positive relationship between foreign aid and economic development. Academic discussions on foreign aid frequently devolve into an endless cycle of debate in which no conclusion is reached. As the basis for policymaking, proponents of different political demands frequently cite diverse academic conclusions [
22].
Research on China’s foreign aid is also controversial, despite the fact that the structure and content of aid are distinct. Some studies assert that China’s foreign aid hinders the development of recipient countries. China’s aid may be used for self-serving purposes, such as exporting surplus domestic primary products and selling China’s development model, without regard for the environmental and social interests of recipient countries [
23,
24,
25]. Moreover, China’s foreign aid is believed to be easily exploited by politicians for political gain, which exacerbates corruption in recipient countries [
6,
26]. The recipient countries’ excessive access to China’s aid may result in economic issues such as over-debt and a decrease in aid effectiveness [
27,
28]. In contrast, an overwhelming majority of studies conclude that China’s foreign aid has a positive impact on the development of recipient countries. It is demonstrated that China’s aid has a positive impact on the recipient countries’ international trade, retail, and manufacturing industries [
29,
30,
31]. The construction of infrastructure in China’s foreign aid projects has substantially boosted the economic growth of recipient countries [
3,
4,
8,
9,
32]. China’s assistance can also effectively mitigate the conflict caused by the abrupt withdrawal of western assistance [
33,
34].
In addition, previous research has demonstrated that both public service and public investment have a significant impact on economic growth, albeit with distinct roles [
35,
36,
37,
38,
39]. The distribution of aid between welfare aid and growth aid has a direct impact on the level and composition of a country’s public expenditures between public service and public investment. However, few studies have attempted to analyze the relationship between foreign aid and public expenditure and growth. Chatterjee and Turnovsky [
40], Agénor et al. [
41], and Chatterjee et al. [
42] are a few exceptions. Chatterjee and Turnovsky [
40] developed a theoretical simulation that suggests foreign aid related to investment is more effective for long-term growth in recipient countries with a low degree of substitution in the production function. Agénor et al. [
41] construct a quantitative macroeconomic model to investigate the composition of foreign aid in public investment. Chatterjee et al. [
42] investigate the relationship between foreign aid and the structure of government spending in recipient countries. The previous two studies primarily involve model development and simulations. The latter study adopts the ODA data of 67 donors from 1972 to 2000 for empirical analysis. However, since the 2000 Millennium Summit, foreign aid has been characterized by an array of novel objectives and methods. In this context, it is necessary to reevaluate the relationship between aid composition and economic growth in the new millennium, especially for the development finance from China.
In conclusion, although there are numerous discussions on the effectiveness of China’s foreign aid, the following questions remain. First, there is a lack of discussion regarding the structure of China’s foreign aid and its connection to international aid standards. Second, there is a lack of focus on the channels through which China’s foreign aid contributes to the economic growth of recipient countries.
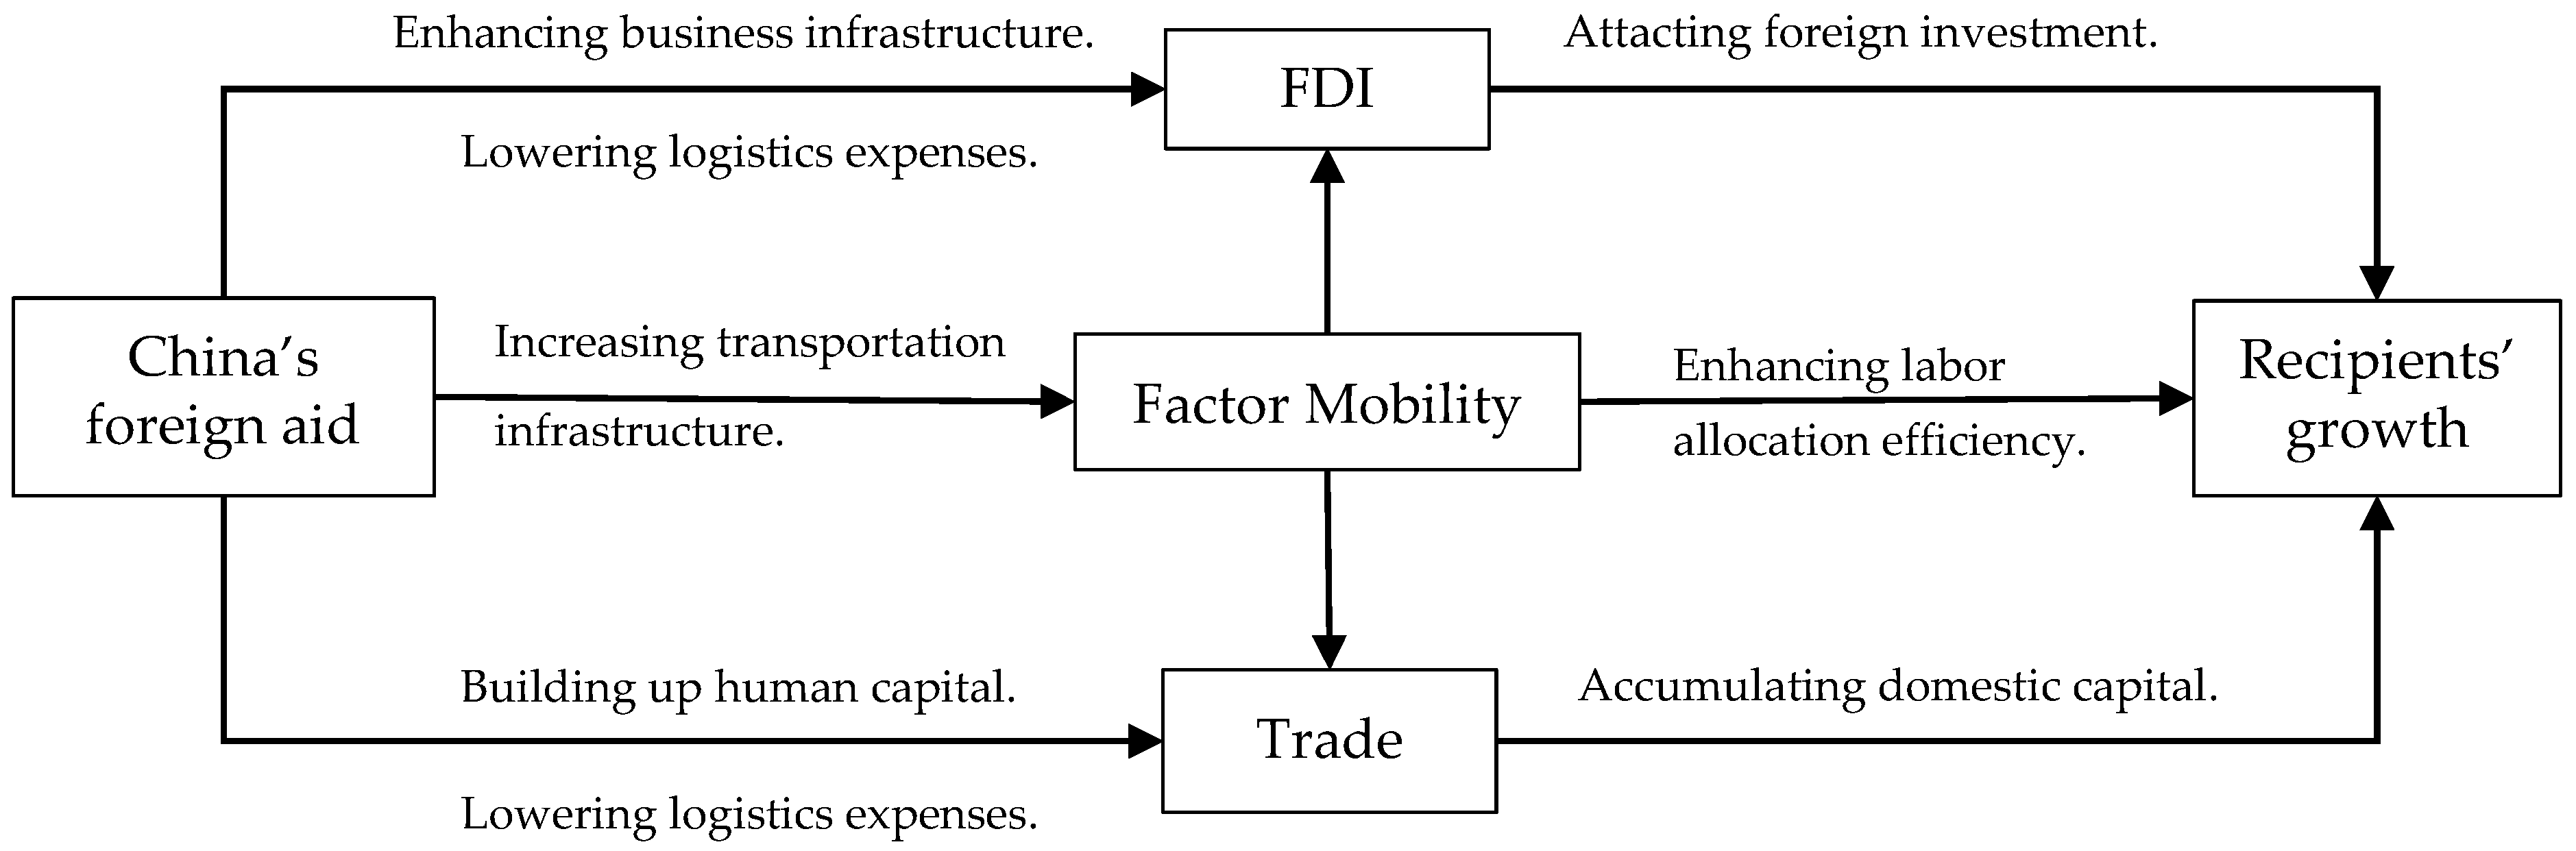
2.2. Theoretical Framework
Foreign aid supplements recipient countries’ capital requirements, improves infrastructure, raises total factor productivity, and stimulates long-term economic growth [
11,
15,
43,
44]. As shown in
Figure 1, the role of China’s foreign aid in the internal accumulation of recipient countries can be seen in three ways.
2.2.1. Contributing to Factor Mobility
China’s infrastructure aid can reduce transportation and logistics costs, thereby enhancing population mobility [
45,
46,
47]. The improvement of basic education and medical equipment raises the domestic education level and life expectancy, increases labor force participation and human capital, and promotes the mobility of interregional factors [
48,
49]. China’s aid on infrastructure projects and large manufacturing projects not only provides local workers with employment opportunities but also improves business facilities, thereby stimulating the local service sector. All of the aforementioned factors contribute to the growth of population concentration and urbanization in the recipient countries. Therefore, one of the primary mechanisms of China’s foreign aid is the promotion of factor mobility and enhancement of factor allocation efficiency via infrastructure upgrades [
10].
2.2.2. Promoting FDI
China’s aid increases the infrastructure level of recipient countries, boosts total factor productivity, reduces the investment cost of foreign capitals, and reduces the cost of production and logistics for local businesses [
30]. In addition, foreign aid can effectively mitigate the investment risk of foreign firms [
50]. China’s assistance enables external parties to better collect social and economic data on recipient countries, gain a better understanding of the business environment, and thus reduce information asymmetry and mitigate investment risks. Last but not the least, China supports the economic growth of recipient countries by investing heavily in infrastructure and transportation facilities, which directly increases the volume of FDI in countries [
51].
2.2.3. Increasing International Trade
China’s foreign aid influences the economic growth of recipient countries primarily through two aspects of trade promotion. On the one hand, foreign aid promotes recipient countries’ international trade by lowering logistics costs. Logistics expenses account for a significant portion of international trade expenses. China has supported the construction of a number of airports and seaports in recipient countries, thereby enhancing their transportation capacity and fostering the growth of international trade [
52]. On the other hand, foreign aid improves the industrial structure of countries by empowering factor mobility, which in turn influences the structure of international trade. China’s aid contributes to recipient countries’ e-commerce development and cross-border e-commerce cooperation, which drives the upgrading of recipient countries’ trade structures [
31].
3. Reclassify China’s Foreign Aid According to CRS Aid Activity Codes
Many existing studies on China’s foreign aid structure their heterogeneity analysis according to whether or not the aid is ODA. Such analysis is primarily based on the degree of preferential aid, whose economic significance is not always clear. We analyze China’s foreign aid from the standpoint of public expenditure and classify official foreign aid into two categories: welfare aid for public service resource mobilization and growth aid for public investment resource mobilization [
53,
54].
Welfare aid is assistance for social welfare goods. Examples of welfare aid include grants and interest-free loans provided by bilateral and multilateral donors, as well as global health and education programs. The supply of welfare aid as an additional public consumer good leads to an immediate increase in public consumption and indirectly affects economic output via the individual utility function of the recipient country. Under budget constraints, welfare aid may also alter the demand structure of the recipient country. Growth aid, however, is assistance for soft and hard infrastructure. Examples of growth aid include export buyer’s credits, special purpose loans, and preferential investment funds. The supply of growth aid as an additional investment input enters the production function directly and generates a strong impact on the recipient country’s output. Although the supply of growth aid has a substitution effect on the private capital of recipient countries, reducing the demand for private investment, growth aid may also increase the marginal output of private capital, thereby reducing marginal costs.
The OECD Creditor Reporting System (CRS) is the most widely used reporting and classification system for international aid. CRS purpose codes are utilized by many foreign aid databases, including the International Aid Transparency Initiative and AidData. According to the clarifications and additional notes in the CRS purpose codes, as shown in
Table 1, China’s foreign aid is divided into welfare aid and growth aid. The sub-subjects under IV. Multi-Sector/Cross-Cutting include welfare aid such as environmental protection and food safety, as well as growth aid such as urban management and rural development. The aid projects in IX. Unallocated/Unspecified should be manually assigned to welfare aid or growth aid based on their particular contents. See
Table A1 and
Table A2 in
Appendix A for details.
4. Empirical Model Setting and Data Description
4.1. Model Setting
To assess the economic impact of China’s foreign aid on recipient countries, we use the recipient countries’ GDP growth as the dependent variable. The total amount of China’s foreign aid to recipient countries, as well as the amounts of China’s growth aid and welfare aid, are the independent variables. The fundamental regression model is specified as follows:
Equation (1) evaluates the effect of aid size and structure on economic growth.
is the GDP per capita of the recipient country
i in year
t.
is the amount of China’s aid received by recipient country
i in year
t, and
k = {1,2,3}.
is the total aid amount.
and
are the sizes of growth aid and welfare aid, respectively. The terms α, α’, and
φ are parameters. Individual fixed effects are denoted by
and time fixed effects are denoted by
.
is an error term.
are the control variables. Government expenditure, ODA from DAC members, government institutional quality, FDI, international trade, and labor force percentage are used as control variables [
10,
34,
56,
57].
Furthermore, the impact of China’s foreign aid on economic growth may have a lag effect, as foreign aid in the current period may affect economic growth in the subsequent periods [
58]. To investigate the lag effect of foreign aid on economic growth, we utilize lagging terms of China’s total foreign aid, growth aid, and welfare aid. The model is configured as shown:
where
is the amount of China’s assistances received by country
i at time
t – 1. The terms
and
are parameters.
The effect of recipient countries’ dependence on foreign aid (i.e., the ratio of aid received to GDP) on their economic growth is then investigated. The model is configured as follows:
where
represents the ratio of China’s total aid received by country
i in period
t to its GDP.
and
represent the ratios of growth aid to GDP and welfare aid to GDP received by country
i during period
t. The terms
and
are parameters. To determine if there is an inflection point, we also introduce the square term of foreign aid dependence.
In addition, we use the stepwise regression method to examine the causal effects of the three factors on the economic growth of recipient countries caused by China’s foreign aid [
10,
59]. The models are configured as follows:
where
Zit represents the channels through which China’s foreign aid influences the economic growth of recipient countries, namely factor mobility, international trade, and foreign direct investment. The terms
,
and
are parameters. We wish to determine whether China’s foreign aid has a significant positive impact on the aforementioned channels and whether these channels have a significant positive impact on the economic growth of recipient countries.
4.2. Data Description
The dependent variable is the recipient countries’ economic growth. The logarithmic forms of the real GDP per capita are utilized. The data come from the World Bank’s World Development Indicators (WDI) database, and the base year is 2017.
The most important independent variables are China’s total aid, growth aid, and welfare aid. The data are derived from AidData’s Global Chinese Development Finance Dataset Version 2.0 and have been adjusted with a GDP deflator. In accordance with the method outlined in
Section 3, China’s total aid is divided into growth aid and welfare aid. To investigate the impact of recipient countries’ reliance on foreign aid, we also consider the ratio of China’s total foreign aid to the recipient countries’ GDP, as well as the ratios of growth aid to GDP and welfare aid to GDP. Our dataset consists of 121 countries from 2000 to 2017 and 2178 samples in total. The linear interpolation method is used to replace missing values. The analysis excludes samples with three or more consecutively absent values.
In addition, we control for a variety of variables [
10,
56,
57]. (1) As control variables for political institutions, government expenditures and government efficiency are selected. Derived from the Global Governance Index Database, government efficiency data reflect the institutional quality of the recipient countries and range from −2.5 to 2.5. A high value indicates efficient government operations. (2) As control variables for the business environment, FDI and international trade are selected. The more FDI and international trade a country receives, the better its business climate and the greater its ability to attract foreign investment. (3) As a population-based control variable, the ratio of the labor force to the working population is chosen. The labor force percentage indicates the recipient countries’ abundance of labor resources. (4) We also control for the economic impact of ODA provided by DAC members on recipient countries [
34].
Table 2 provides detailed definitions and data sources for the aforementioned variables, while
Table 3 provides a descriptive statistical analysis of the variables.
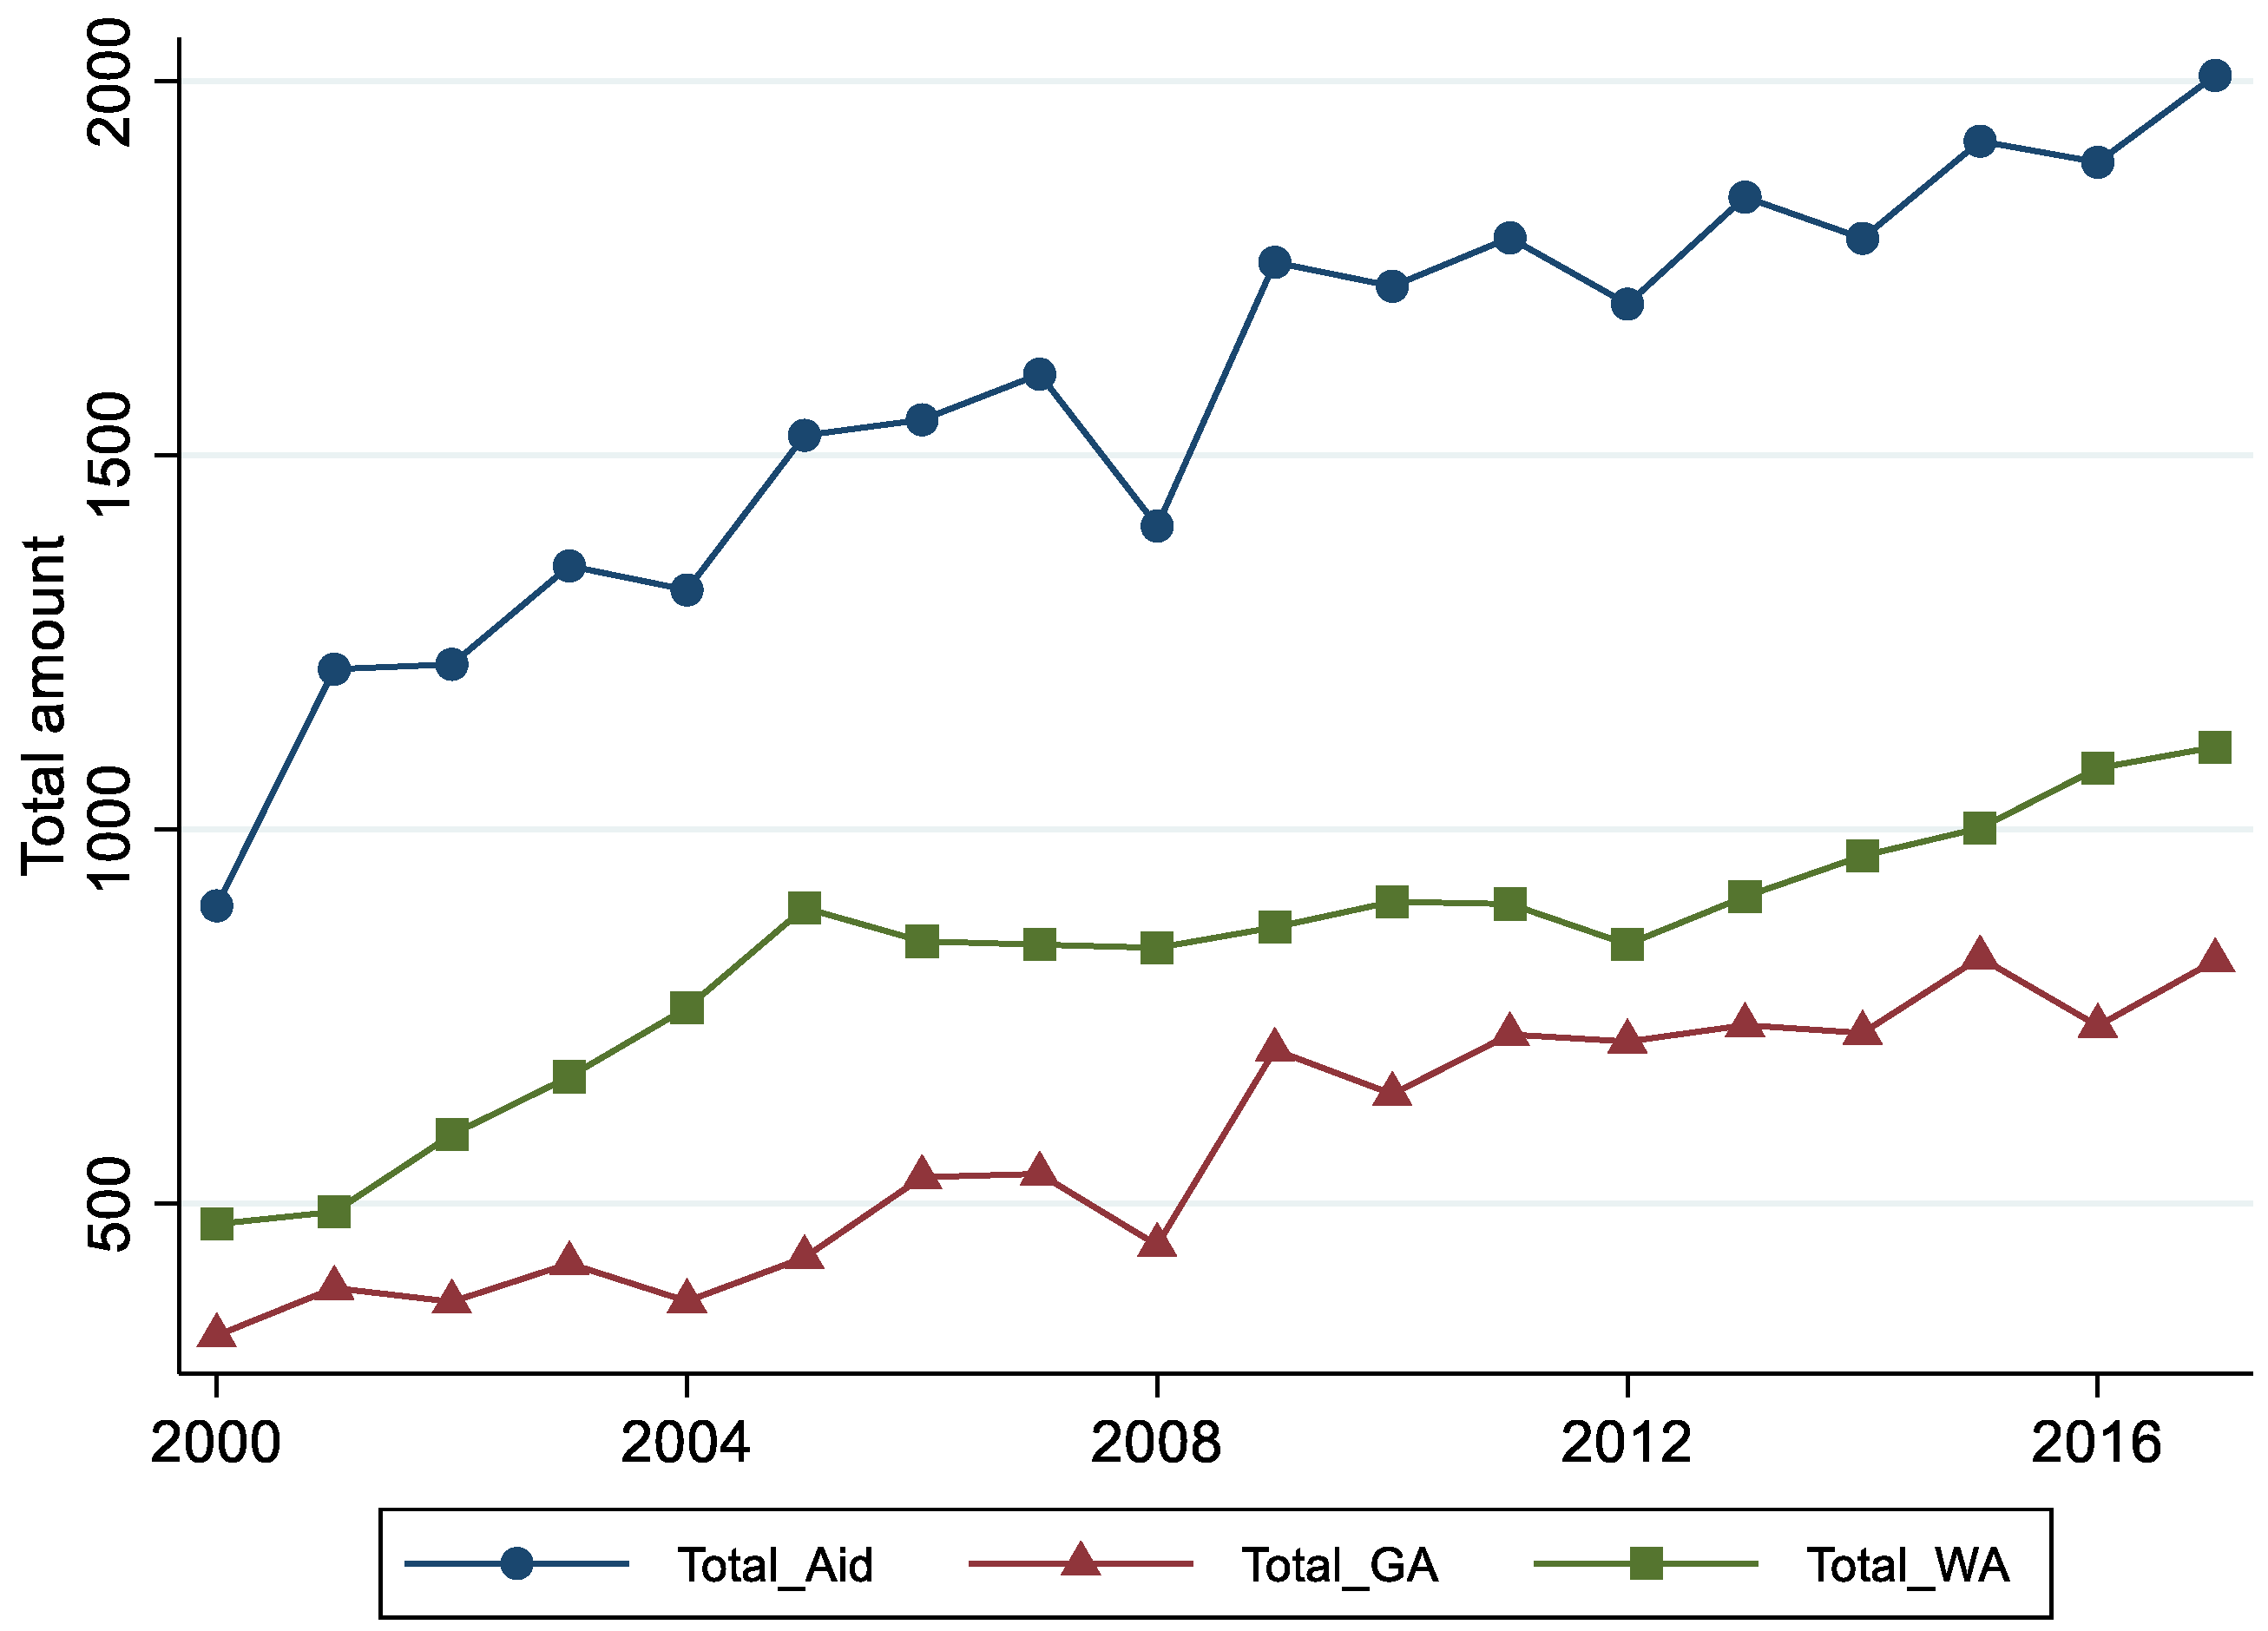
4.3. The Evolution of China’s Foreign Aid
Figure 2 displays the growth of China’s foreign aid from 2000 to 2017. China’s foreign aid is on the rise regardless of whether it is GA or WA, but the scale of GA has been smaller than that of WA aid.
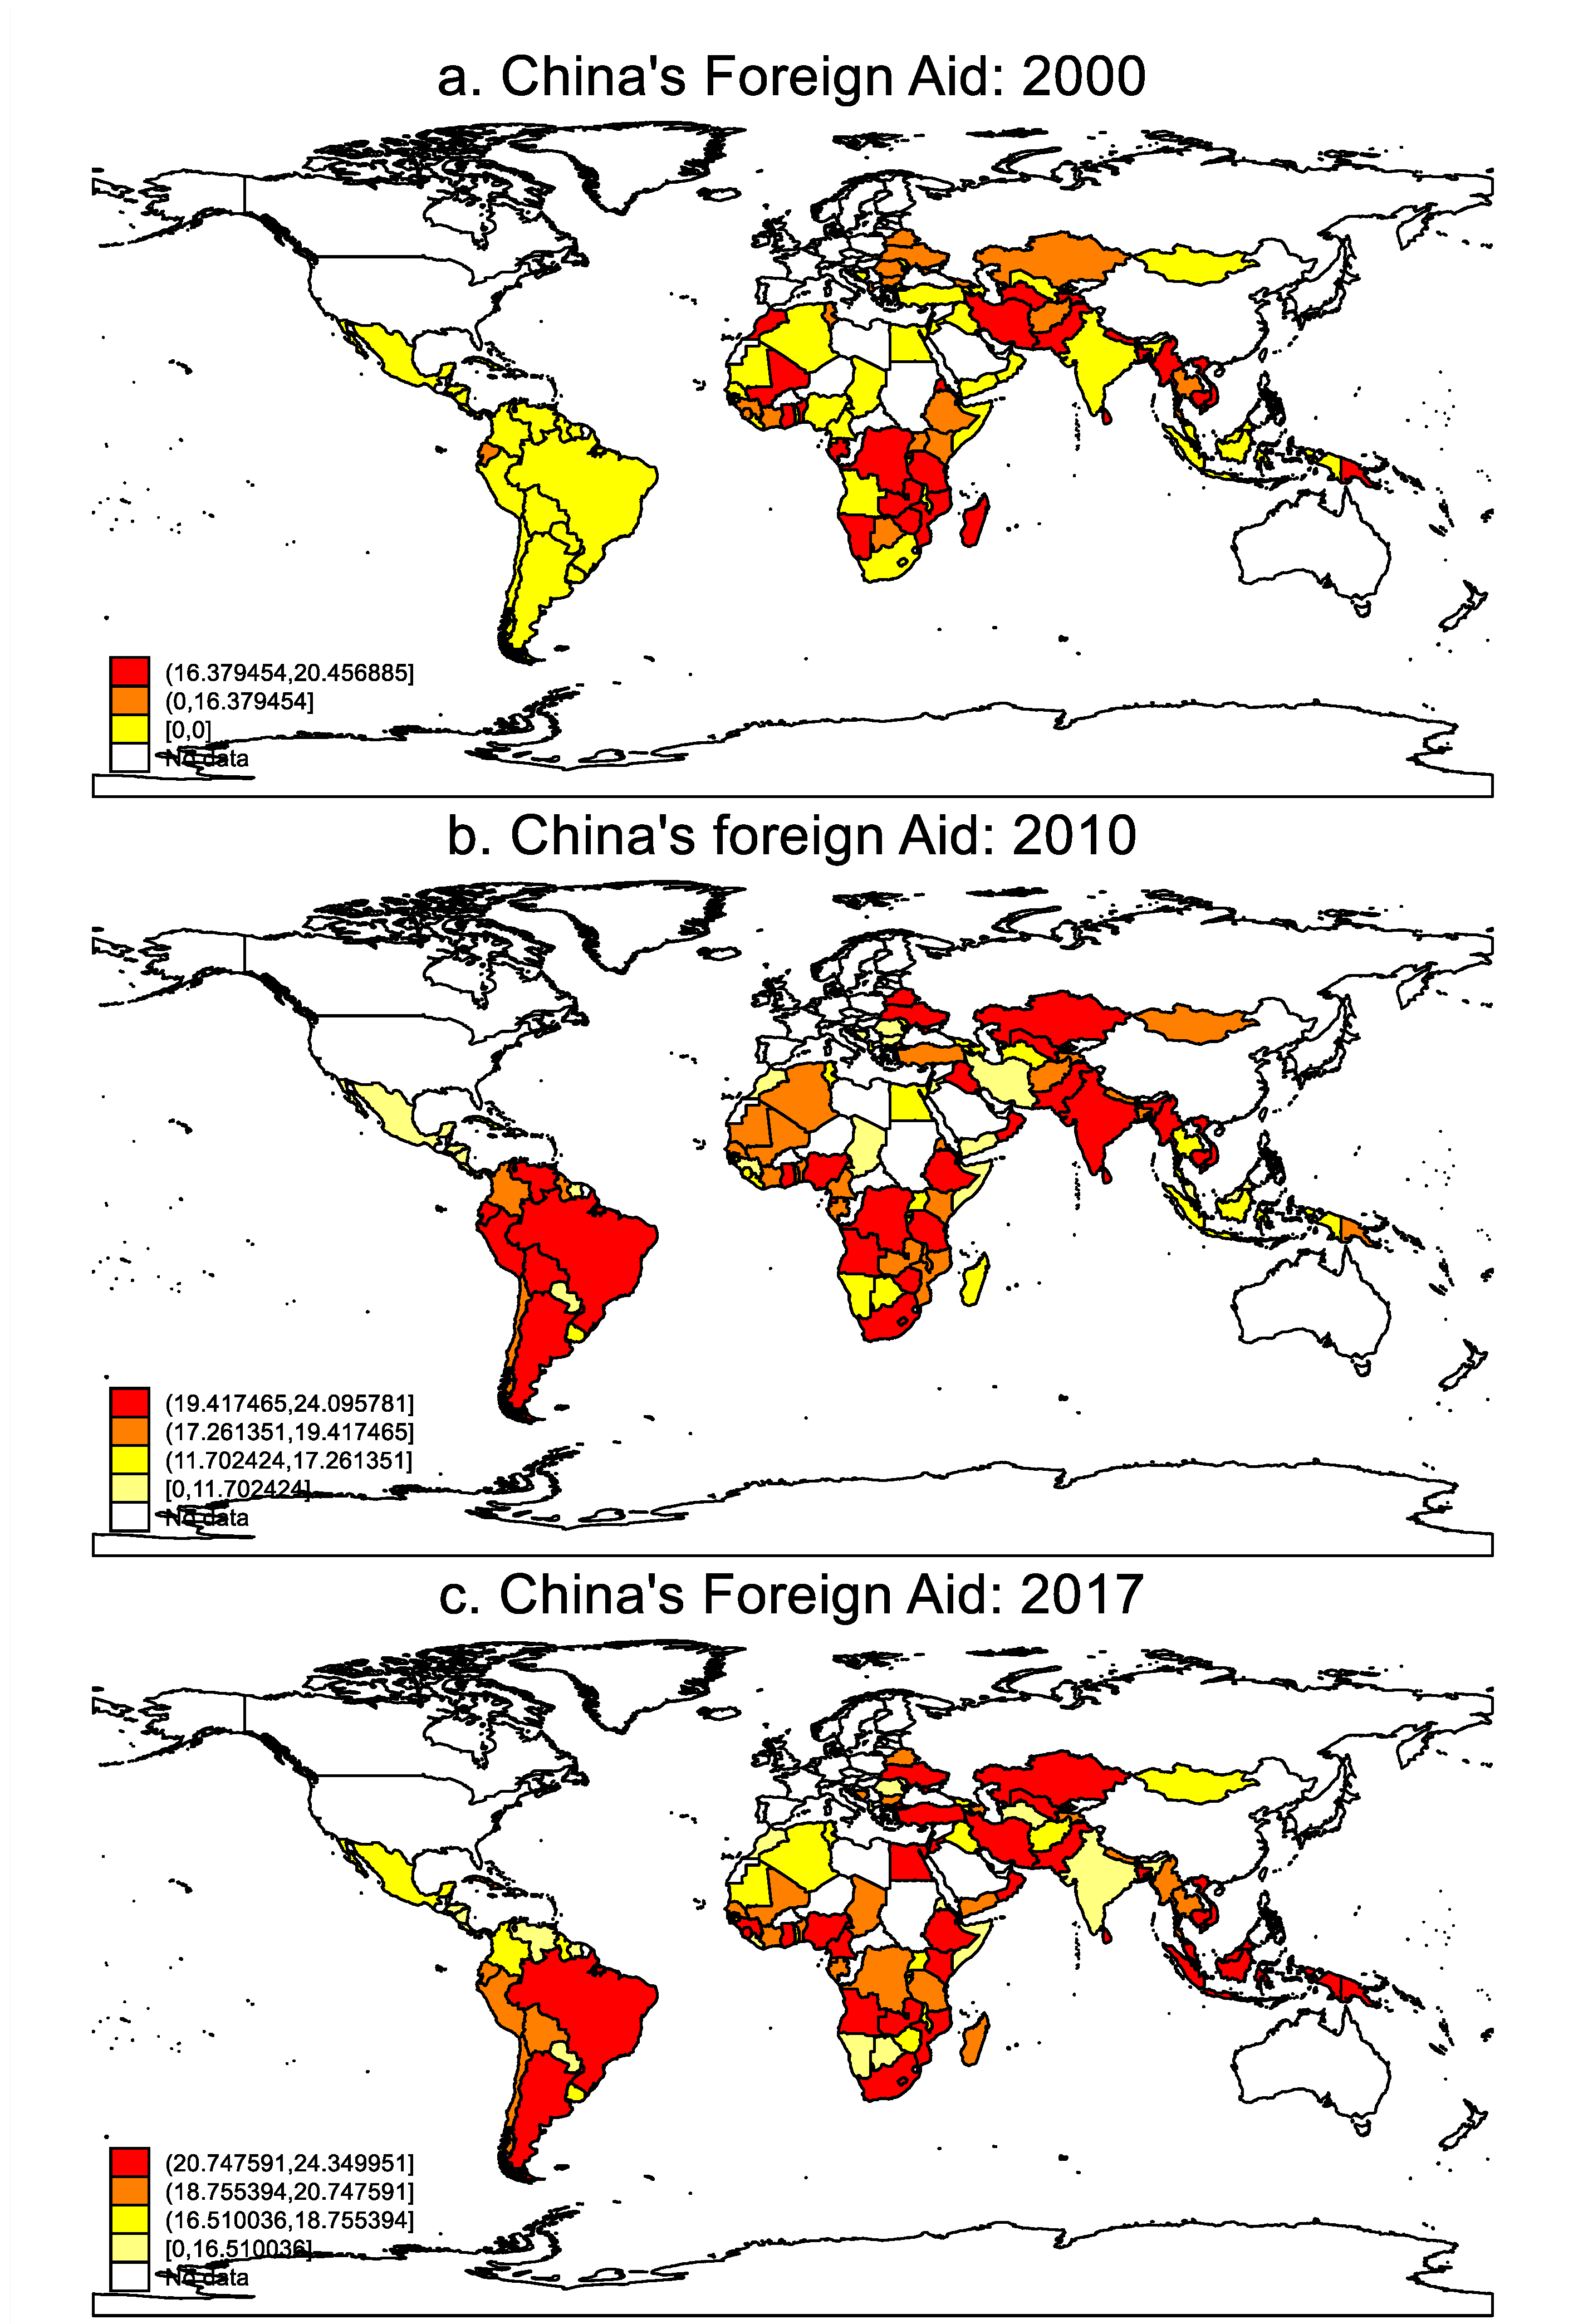
Figure 3 depicts the spatial distribution of recipient countries and the evolution of China’s aid scale. Asia, Africa, and Latin America are the three regions where beneficiaries are most concentrated. China’s aid to Latin American and African countries has expanded dramatically since the 21st century in terms of the aid scales.
5. Empirical Analysis
The empirical analysis consists of three components. First, we examine and compare the global impact of China’s foreign aid on the economic growth of recipient countries with and without the endogenous problem in mind. Additionally, the threshold and lag effects are examined. Second, we examine the heterogeneity of China’s foreign assistance from three perspectives: economic development level, geographical location, and recipients’ reliance on China’s foreign assistance. Third, we analyze the channels through which China’s foreign aid affects the economic growth of recipient countries from three perspectives: factor mobility, international trade, and FDI.
5.1. Foreign Aid and Growth
5.1.1. Foreign Aid and Growth: Endogeneity Not Tested
We introduce the square term and lag term of the aid size to determine if China’s aid size has a threshold effect on growth and if there is a lag effect.
Table 4 presents the results of the regression analysis.
Consistent with Dreher et al.’s [
8] earlier conclusion, Column (1) indicates that China’s aid has a significant positive impact on fostering growth. According to estimated coefficients, a 1 percent increase in total aid increases the per capita GDP by 0.003 percent. Meanwhile,
ODA has a significant positive effect on the recipient countries’ GDP per capita. China’s foreign aid and ODA from DAC members can both stimulate economic growth in recipient countries. Regarding the control variables, government efficiency, FDI, international trade, and the ratio of the labor force are all positively associated with the GDP per capita of recipients.
There is a “U-shaped” relationship between China’s total aid size and the economic growth of recipient countries, as
lnAid and
(lnAid)2 have significant negative and positive effects on the recipient countries’ GDP per capita, respectively. The preceding result suggests that the impact of China’s foreign aid has a threshold, and only beyond this threshold can recipient countries’ growth be promoted more effectively. In addition, the estimations of control variables are comparable to those in Column (1), indicating that the effect of control variables on recipient countries’ GDP per capita is stable. In line with [
11,
58], Column (3) reveals that the lag term of China’s total aid size is significantly positive for both recipient countries’ GDP per capita, indicating that the economic impact of China’s aid takes time to materialize.
We further analyze the impact of China’s aid structure on growth, as shown in
Table 5. The aid structure comprises development aid (
lnGA) and welfare aid (
lnWA). Column (1) shows that both growth aid and welfare aid can significantly increase the recipient countries’ GDP, but the marginal effect of growth aid (0.004) is greater than that of welfare aid (0.002) when controlling for time and individual fixed effects. Then, we introduce the square term of growth aid and welfare aid and discover that growth aid has a U-shaped effect on the recipient countries’ GDP levels. This indicates that growth aid is the cause of the U-shaped relationship between total aid and economic growth in recipient countries. One possible explanation is that growth aid has a threshold effect; it can only promote growth above this threshold. Column (4) demonstrates that the effect of growth aid on economic growth is delayed, implying that China’s foreign aid contribution is sustainable to some extent.
5.1.2. Foreign Aid and Growth: Endogeneity Tested
There may be an endogeneity problem with regard to the reciprocal causality between foreign aid and the economic growth of recipient countries. While the amount and structure of China’s aid may affect the growth of recipient countries, the level of development of different recipients may also influence the amount and structure of the Chinese government’s foreign aid policy decisions. Following [
8,
34,
60], we use the interaction term of China’s steel output
(CHN_Steel) and the frequency of the recipient countries receiving China’s aid in
t – 1 period as the instrument. In particular, we develop three IV estimators,
CHN_Steel × Aid_times,
CHN_Steel × GA_times, and
CHN_Steel × WA_times, to solve the endogeneity problem of China’s total aid, the growth aid, and the welfare aid, respectively. The rationale is that the steel industry is an advantageous industry in China, so the degree of overcapacity depends mainly on the domestic industrial layout and economic cycle. This will impact the size and composition of China’s foreign aid, but probably not the economic growth of recipient countries [
8].
Table 6 displays the results of the regression using an instrumental variable. As shown in
Table 6, the first stage F values are generally greater than the rule of thumb (usually 10), indicating that the instrumental variable can effectively address the endogeneity issue. Columns (1) and (2) demonstrate that although the marginal effect of China’s aid size decreases when control variables are introduced, China’s foreign aid size plays a significant role in promoting the economic growth of recipient countries regardless of whether or not control variables are included. In Columns (3) and (4), the positive effects of growth aid on the economic growth of recipients are substantial. Also significant in Columns (5) and (6) are the positive effects of welfare aid on the economic growth of recipients. When endogenous problems are addressed, the contribution of foreign aid to economic growth in recipient countries remains present and robust. Compared to OLS estimates (see
Table 4 and
Table 5), the marginal effects of
lnAid,
lnGA, and
lnWA on recipient countries’ GDP per capita are greater. This suggests that if the endogeneity issue is not addressed, the contribution of China’s foreign aid to the economic growth of recipient countries will be understated.
5.2. Heterogeneity Analysis
We investigate further the heterogeneity of the effect, including whether or not the recipient countries are African or low-income, and whether or not their dependence on foreign aid is excessive. The results are shown in
Table 7,
Table 8 and
Table 9.
Table 7 displays similarities and differences between the effects of China’s aid on African and non-African countries. Total aid size, growth aid, and welfare aid all have a significant positive impact on the growth of African and non-African countries. Although welfare aid has a significant positive impact on both African and non-African countries, its marginal impact on African countries is greater.
Table 8 displays the differences in the impact of China’s foreign aid based on the income level of the recipient country. We divide the samples using the UN standard for LDCs and the sample mean of GDP per capita. In 2017, the UN defined an LDC as a country with fewer than 75 million inhabitants and an annual GDP per capita of less than 900 dollars.
Table 8 demonstrates that, based on this criterion, growth aid and welfare aid have a positive impact on both non-LDCs and LDCs, with the marginal effect of LDCs being greater than that of non-LDCs. In addition, we divide the sample into two groups based on the sample mean of GDP per capita. It is demonstrated that the size of growth aid and welfare aid are both positive and significant for recipients with low and high incomes. The marginal effect of growth aid on recipients with high incomes is smaller than on recipients with low incomes. We conclude that, for recipient countries with relatively high income levels, growth aid promotes economic growth more effectively than welfare aid. However, for countries with relatively low income levels, both growth aid and welfare aid have a significant impact on economic growth.
As shown in
Table 9, we also investigate the relationship between the degree of aid dependence and the economic growth of recipient countries. The greater the aid-to-GDP ratio, the greater the recipients’ reliance on China’s foreign aid.
As shown in Columns (1), (3), and (5) of
Table 9,
Aid/GDP,
GA/GDP, and
WA/GDP all have a positive impact on the economic growth of recipient countries. Nonetheless, (
Aid/GDP)2, (
GA/GDP)2, and (
WA/GDP)2 all have substantial negative effects. This result suggests that the recipient country’s reliance on foreign aid follows an “inverted U” pattern. Therefore, a moderate reliance on foreign aid is beneficial to the economic growth of recipient countries, whereas excessive reliance is detrimental to economic growth.
5.3. Mechanism Analysis
China’s foreign aid not only influences the economic growth of recipient countries directly but also affects the economic growth indirectly. First, foreign aid contributes to the urbanization of economic development by luring rural populations to urban centers. Second, foreign aid in infrastructure reduces logistic costs, thereby accelerating the circulation of commodities and facilitating international trade. Thirdly, growth aid focuses primarily on infrastructure and reduces transportation costs, whereas welfare aid enhances the general business environment, both of which are essential for attracting FDI.
Table 10 displays the empirical findings that China’s foreign aid influences the economic growth of recipient countries via factor mobility. As shown in Column (1), China’s foreign assistance has significantly increased the urbanization rate in recipient countries. A possible explanation is that foreign aid drives industrialization, thereby attracting rural labor to urban areas. As indicated in Column (2), an increase in foreign aid and a rise in urbanization are both positive for the economic growth of recipient countries. The results in Columns (3) and (6) are comparable. Both growth aid and welfare aid have substantially increased the urbanization rate of recipient countries and boosted their economic growth. However, only the positive effect of
GA on
lnGDPm is significant, while the effect of
WA is not. This implies that the mechanism of urbanization is mostly reflected in growth aid. In conclusion, by increasing factor mobility, China’s foreign aid can promote the economic growth of the recipients.
The empirical findings presented in
Table 11 indicate that China’s foreign aid influences the economic growth of recipient countries through international trade. As shown in Columns (1) and (2), China’s foreign aid has a tremendously positive effect on the international trade of recipient countries. Incorporating both international trade and foreign aid, the impact remains substantial. Similarly, both growth aid and welfare aid can significantly boost recipient countries’ international trade. The result that only the positive effect of
GA on
lnTrade is significant implies that the mechanism of international trade is also mostly reflected in growth aid. The result indicates that there is an influence channel for foreign aid to stimulate the economic growth of recipient countries by promoting international trade. This is due to the fact that foreign aid can help recipient countries build infrastructure, reduce logistical costs, promote commodity circulation and international trade, and stimulate economic growth.
Through FDI, China’s foreign aid affects the economic growth of recipient countries, as demonstrated in
Table 12. As demonstrated in Columns (1), (3), and (5), both growth aid and welfare aid have a substantial positive effect on FDI in recipient countries. The marginal effect of growth aid on foreign direct investment is greater than that of welfare aid. As demonstrated in Columns (2), (4), and (6), both foreign aid and FDI have a positive effect on the actual per capita GDP of recipient countries. The results indicate that there are avenues for foreign aid to influence the economic growth of recipient countries by boosting FDI, especially for growth aid.
6. Conclusions
After the development of the UN’s Millennium Development Goals, the goal of foreign aid became not only to help underdeveloped countries eliminate poverty but also to promote the mutual development of countries at different stages of economic development. Donor countries have adopted various new forms of foreign aid. To understand from the perspective of public expenditure, we classify China’s foreign aid into welfare aid for public service and growth aid for public investment. By means of an empirical analysis of the foreign aid that China provided to 121 countries between 2000 and 2017, we analyze in depth the impact of China’s foreign aid on the economic growth of recipient countries in terms of endogeneity, heterogeneity, and mechanism channels. Summarizing the whole paper, the following main conclusions can be obtained.
First, we find that Chinese aid has a threshold influence on recipient countries’ economic growth. China’s aid and economic growth have a “U-shaped” relationship, and growth aid is mostly to account for this threshold effect.
Second, both growth aid and welfare aid exhibit an “inverted U-shaped” relationship between recipient countries’ economic development and their dependence on Chinese assistance.
Furthermore, we discover that there is substantial heterogeneity in the effects of China’s foreign aid on economic growth and that the contribution of China’s help is understated if the endogeneity issue is not taken into consideration.
Finally, we find that China’s aid, especially growth aid, boosts recipient countries’ economies through the channels of factor mobility, FDI, and international trade.
Our conclusions have a number of significant ramifications for practitioners and policymakers. First, donor countries like China should think carefully about the quantity of their aid and should avoid making it too small because there is a threshold in the impact of foreign aid on recipient countries’ economic growth. Second, when delivering their foreign aid programs, donor countries must consider the economic development levels of the receiving countries, as recipients at various stages of development require various kinds of help. Last but not least, recipient countries should carefully assess and select the most appropriate foreign aid programs, rather than accepting all available proposals from the international aid system, given their “inverted U-shaped” dependence on foreignaid.
Author Contributions
Conceptualization, Y.C. and Y.W.; methodology, Y.W.; software, Y.W.; validation, Y.W.; formal analysis, Y.W.; investigation, Y.W.; resources, Y.W.; data curation, Y.W.; writing—original draft preparation, Y.W.; writing—review and editing, Y.W.; visualization, Y.W.; supervision, Y.C.; project administration, Y.W.; funding acquisition, Y.C. All authors have read and agreed to the published version of the manuscript.
Funding
This research was funded by Sun Yat-sen University Education Development Foundation (Guangdong).
Institutional Review Board Statement
Not applicable.
Data Availability Statement
Acknowledgments
We would like to thank Yuke Zhang for the assistance in manually classifying the data.
Conflicts of Interest
The authors declare no conflict of interest.
Appendix A
Table A1.
The multi-sector/cross-cutting category and the corresponding foreign aid types.
Table A1.
The multi-sector/cross-cutting category and the corresponding foreign aid types.
| CRS Code | Description | Foreign Aid Type |
|---|
| 410 | | General Environment Protection | |
| | 41010 | Environmental policy and administrative management | Growth aid |
| | 41020 | Biosphere protection | Welfare aid |
| | 41030 | Biodiversity | Welfare aid |
| | 41040 | Site preservation | Welfare aid |
| | 41081 | Environmental education/training | Welfare aid |
| | 41082 | Environmental research | Growth aid |
| 430 | | Other Multisector | |
| | 43010 | Multisector aid | Manually classified. Data available on request. |
| | 43030 | Urban development and management | Growth aid |
| | 43040 | Urban land policy and management | Growth aid |
| | 43050 | Urban development | Welfare aid |
| | 43060 | Rural development | Welfare aid |
| | 43071 | Rural land policy and management | Welfare aid |
| | 43072 | Rural development | Welfare aid |
| | 43073 | Non-agricultural alternative development | Welfare aid |
| | 43081 | Disaster Risk Reduction | Welfare aid |
| | 43082 | Food security policy and administrative management | Welfare aid |
Table A2.
The unallocated/unspecified category and the corresponding foreign aid types.
Table A2.
The unallocated/unspecified category and the corresponding foreign aid types.
| CRS Code | Description | Foreign Aid Type |
|---|
| 998 | | Unallocated/Unspecified | |
| | 99810 | Sectors not specified | Manually classified. Data available on request. |
| | 99820 | Promotion of development awareness (non-sector allocable) | Welfare aid |
References
- The State Council Information Office of the People’s Republic of China. China’s International Development Cooperation in the New Era; The State Council of the People’s Republic of China: Beijing, China, 2021.
- Qu, C. The development, inheritance and innovation of new China’s concept of foreign aid in the past 70 years. J. United Front. Sci. 2019, 3, 95–105. [Google Scholar]
- Foster, V. BuilDing Bridges: China’s Growing Role as Infrastructure Financier for Sub-Saharan Africa; World Bank Publications: Washington, DC, USA, 2009. [Google Scholar]
- Copper, J.F. China’s foreign aid and investment diplomacy in Southeast Asia. In China’s Foreign Aid and Investment Diplomacy; Volume II: History and Practice in Asia, 1950-Present; Palgrave Macmillan US: New York, NY, USA, 2016; pp. 1–47. [Google Scholar]
- Gill, I.S.; Karakulah, K. Is China Helping Africa? Growth and Public Debt Effects of the Subcontinent’s Biggest Investor; No. 2019/03; Duke University: Durham, NC, USA, 2019. [Google Scholar]
- Isaksson, A.-S.; Kotsadam, A. Chinese aid and local corruption. J. Public Econ. 2018, 159, 146–159. [Google Scholar] [CrossRef]
- Hurley, J.; Morris, S.; Portelance, G. Examining the debt implications of the Belt and Road Initiative from a policy perspective. J. Infrastruct. Policy Dev. 2019, 3, 139–175. [Google Scholar] [CrossRef]
- Dreher, A.; Fuchs, A.; Parks, B.; Strange, A.; Tierney, M.J. Aid, China, and growth: Evidence from a new global development finance dataset. Am. Econ. J. Econ. Policy 2021, 13, 135–174. [Google Scholar] [CrossRef]
- Whalley, J.; Weisbrod, A. The contribution of Chinese FDI to Africa’s pre crisis growth surge. Glob. Econ. J. 2012, 12, 1–28. [Google Scholar] [CrossRef]
- Yan, B.; Xie, X.D.; Wen, B. China’s foreign aid and economic growth of recipient countries: Analysis of the mediating effect of infrastructure. World Econ. Stud. 2021, 3–18+134. [Google Scholar] [CrossRef]
- Hansen, H.; Tarp, F. Aid and growth regressions. J. Dev. Econ. 2000, 64, 547–570. [Google Scholar] [CrossRef]
- Easterly, W. Can foreign aid buy growth? J. Econ. Perspect. 2003, 17, 23–48. [Google Scholar] [CrossRef]
- Dalgaard, C.J.; Hansen, H.; Tarp, F. On the empirics of foreign aid and growth. Econ. J. 2004, 114, F191–F216. [Google Scholar] [CrossRef]
- Papanek, G.F. The effect of aid and other resource transfers on savings and growth in less developed countries. Econ. J. 1972, 82, 934–950. [Google Scholar] [CrossRef]
- Papanek, G.F. Aid, foreign private investment, savings, and growth in less developed countries. J. Polit. Econ. 1973, 81, 120–130. [Google Scholar] [CrossRef]
- Gulati, U.C. Effect of capital imports on savings and growth in less developed countries. Econ. Inq. 1978, 16, 563–569. [Google Scholar] [CrossRef]
- Clemens, M.A.; Radelet, S.; Bhavnani, R.R.; Bazzi, S. Counting chickens when they hatch: Timing and the effects of aid on growth. Econ. J. 2012, 122, 590–617. [Google Scholar] [CrossRef]
- Galiani, S.; Knack, S.; Xu, L.C.; Zou, B. The effect of aid on growth: Evidence from a Quasi-Experiment. J. Econ. Growth 2017, 22, 1–33. [Google Scholar] [CrossRef]
- Friedman, M. Foreign economic aid: Means and objectives. Yale Rev. 1995, 47, 16. [Google Scholar]
- Jepma, C. On the Effectiveness of Development Aid; World Bank: Washington, DC, USA, 1997. [Google Scholar]
- Arndt, C.; Jones, S.; Tarp, F. What is the aggregate economic rate of return to foreign aid? World Bank Econ. Rev. 2016, 30, 446–474. [Google Scholar] [CrossRef]
- Rajan, R.G.; Subramanian, A. Aid and growth: What does the cross-Country evidence really show? Rev. Econ. Stat. 2008, 90, 643–665. [Google Scholar] [CrossRef]
- Taylor, I. China’s oil diplomacy in Africa. Int. Aff. 2006, 82, 937–959. [Google Scholar] [CrossRef]
- Oh, Y.A. China’s Development Finance to Asia: Characteristics and Implications; Working Papers 16-12; Korea Institute for International Economic Policy: Sejong-si, Korea, 2016. [Google Scholar]
- Crouigneau, F.; Hiault, R. Wolfowitz Slams China Banks on Africa Lending. 2006. Available online: https://www.ft.com/content/ea6cd650-62d8-11db-8faa-0000779e2340 (accessed on 14 July 2022).
- Bräutigam, D. The Dragon’s Gift: The Real Story of China in Africa; Oxford University Press: Oxford, UK, 2009. [Google Scholar]
- Christiansen, L.; Prati, A.; Ricci, L.A.; Tressel, T. External Balance in Low-Income Countries. NBER Int. Semin. Macroecon. 2010, 6, 265–322. [Google Scholar] [CrossRef]
- Brazys, S.; Elkink, J.A.; Kelly, G. Bad neighbors? How co-Located Chinese and World Bank development projects impact local corruption in Tanzania. Rev. Int. Organ. 2017, 12, 227–253. [Google Scholar] [CrossRef]
- Sautman, B.; Hairong, Y. Friends and interests: China’s distinctive links with Africa. Afr. Stud. Rev. 2007, 50, 75–114. [Google Scholar] [CrossRef]
- Lin, J.Y.; Wang, Y. Going Beyond Aid: Development Cooperation for Structural Transformation; Cambridge Books: Cambridge, UK, 2017. [Google Scholar]
- Liu, A.; Tang, B. US and China aid to Africa: Impact on the donor-Recipient trade relations. China Econ. Rev. 2018, 48, 46–65. [Google Scholar] [CrossRef] [Green Version]
- Wang, X.; Ozanne, A.; Hao, X. The West’s aid dilemma and the Chinese solution? J. Chin. Econ. Bus. Stud. 2014, 12, 47–61. [Google Scholar] [CrossRef]
- Strange, A.M.; Dreher, A.; Fuchs, A.; Parks, B.; Tierney, M.J. Tracking underreported financial flows: China’s development finance and the aid–Conflict nexus revisited. J. Confl. Resolut. 2015, 61, 935–963. [Google Scholar] [CrossRef]
- Li, J.; Long, X.; Jiang, Q. Aid and conflict: Evidence from Chinese aid. China Econ. Q. 2021, 21, 1123–1146. [Google Scholar] [CrossRef]
- Barro, R.J. Government spending in a simple model of endogeneous growth. J. Polit. Econ. 1990, 98, S103–S125. [Google Scholar] [CrossRef]
- Futagami, K.; Morita, Y.; Shibata, A. Dynamic analysis of an endogenous growth model with public capital. Scand. J. Econ. 1993, 95, 607–625. [Google Scholar] [CrossRef]
- Turnovsky, S.J. Fiscal policy in a growing economy with public capital. Macroecon. Dynam. 1997, 1, 615–639. [Google Scholar] [CrossRef]
- Devarajan, S.; Swaroop, V.; Zou, H.-F. The composition of public expenditure and economic growth. J. Monet. Econ. 1996, 37, 313–344. [Google Scholar] [CrossRef]
- Ghosh, S.; Roy, U. Fiscal policy, long-Run growth, and welfare in a stock-Flow model of public goods. Can. J. Econ. 2004, 37, 742–756. [Google Scholar] [CrossRef]
- Chatterjee, S.; Turnovsky, S.J. Substitutability of capital, investment costs, and foreign aid. In Economic Growth and Macroeconomic Dynamics: Recent Developments in Economic Theory; Dowrick, S., Pitchford, R., Turnovsky, S.J., Eds.; Cambridge University Press: Cambridge, UK, 2004; pp. 138–170. [Google Scholar]
- Agénor, P.R.; Bayraktar, N.; El Aynaoui, K. Roads out of poverty? Assessing the links between aid, public investment, growth, and poverty reduction. J. Dev. Econ. 2008, 86, 277–295. [Google Scholar] [CrossRef]
- Chatterjee, S.; Giuliano, P.; Kaya, I. Where has all the money gone? Foreign aid and the composition of government spending. B.E. J. Macroecon. 2014, 12, e2458. [Google Scholar] [CrossRef]
- Duggal, V.G.; Saltzman, C.; Klein, L.R. Infrastructure and productivity: A nonlinear approach. J. Econom. 1999, 92, 47–74. [Google Scholar] [CrossRef]
- Banerjee, A.; Duflo, E.; Qian, N. On the road: Access to transportation infrastructure and economic growth in China. J. Dev. Econ. 2020, 145, 102442. [Google Scholar] [CrossRef]
- Cohen, J.P.; Paul, C.J.M. Public Infrastructure Investment, Interstate Spatial Spillovers, and Manufacturing Costs. Rev. Econ. Stat. 2004, 86, 551–560. [Google Scholar] [CrossRef]
- Gao, T.; Ivolga, A.; Erokhin, V. Sustainable rural development in northern China: Caught in a vice between poverty, urban attractions, and migration. Sustainability 2018, 10, 1467. [Google Scholar] [CrossRef]
- Heshmati, A.; Rashidghalam, M. Measurement and analysis of urban infrastructure and its effects on urbanization in China. J. Infrastruct. Syst. 2020, 26, 04019030. [Google Scholar] [CrossRef]
- Agénor, P.R.; Neanidis, K.C. The allocation of public expenditure and economic growth. Manch. Sch. 2011, 79, 899–931. [Google Scholar] [CrossRef]
- Li, W.; Huang, J.; Wang, K.; Mao, X.; Chen, F. Education assistance to Africa: We can do more and better. Transit. Stud. Rev. 2010, 17, 280–296. [Google Scholar] [CrossRef]
- Asiedu, E.; Jin, Y.; Nandwa, B. Does foreign aid mitigate the adverse effect of expropriation risk on foreign direct investment? J. Int. Econ. 2009, 78, 268–275. [Google Scholar] [CrossRef]
- Sun, C.R.; He, R.; Liu, Y.Y. Aid to Africa and Outward FDI of Chinese Enterprises. Chin. Ind. Econ. 2022, 3, 99–117. [Google Scholar] [CrossRef]
- Zhu, D.D.; Huang, M.B. Impacts of China’s foreign aid on recipients’ trade costs. World Econ. Stud. 2015, 2, 100–107. [Google Scholar]
- Wan, Y.; Chen, Y. Reclassification of foreign aid and its heterogeneous effect on recipient countries’ economic growth. S. China J. Econ. 2022, 63–77. [Google Scholar] [CrossRef]
- Chen, Y. The Dual-Entity of Market Competition: Establishment and Development of Mezzoeconomics; Routledge: London, UK, 2021. [Google Scholar]
- OECD. DAC and CRS Code Lists. Available online: https://www.oecd.org/dac/financing-sustainable-development/development-finance-standards/dacandcrscodelists.htm (accessed on 24 May 2022).
- Zhu, D.; Huang, M. Does China’s foreign aid enhance recipients’ economic growth: Effectiveness of “aid for trade”. China Econ. Stud. 2018, 2, 24–33. [Google Scholar]
- Lu, C.; Zhang, S. Is China’s foreign aid a substitution to the traditional foreign aid? From the viewpoint of the growth effect of international aid. Int. Bus. Res. 2021, 42, 51–64. [Google Scholar]
- Zhang, Y. Poverty reduction effect of Chinese aid and OFDI in “the Belt and Road”. Financ. Trade Econ. 2018, 39, 111–125. [Google Scholar]
- Wen, Z.L.; Ye, B.J. Analyses of mediating effects: The development of methods and models. Adv. Psychol. Sci. 2014, 22, 731–745. [Google Scholar] [CrossRef]
- Nunn, N.; Qian, N. US food aid and civil conflict. Am. Econ. Rev. 2014, 104, 1630–1666. [Google Scholar] [CrossRef] [Green Version]
| Publisher’s Note: MDPI stays neutral with regard to jurisdictional claims in published maps and institutional affiliations. |
© 2022 by the authors. Licensee MDPI, Basel, Switzerland. This article is an open access article distributed under the terms and conditions of the Creative Commons Attribution (CC BY) license (https://creativecommons.org/licenses/by/4.0/).


