

Reservoir Units Optimization in Pneumatic Spray Delivery-Based Fixed Spray System for Large-Scale Commercial Adaptation

 ,
,  ,
, 

Abstract
:1. Introduction
- Design modification of the reservoir unit in the PSD sub-system of SSCDS for larger volumetric capacity deliveries from each unit and minimize the post-spray ground losses;
- Laboratory and field evaluation of different PSD-based SSCDS configurations for the realization of an optimal system for apple orchards trained in a tall spindle training architecture.
2. Materials and Methods
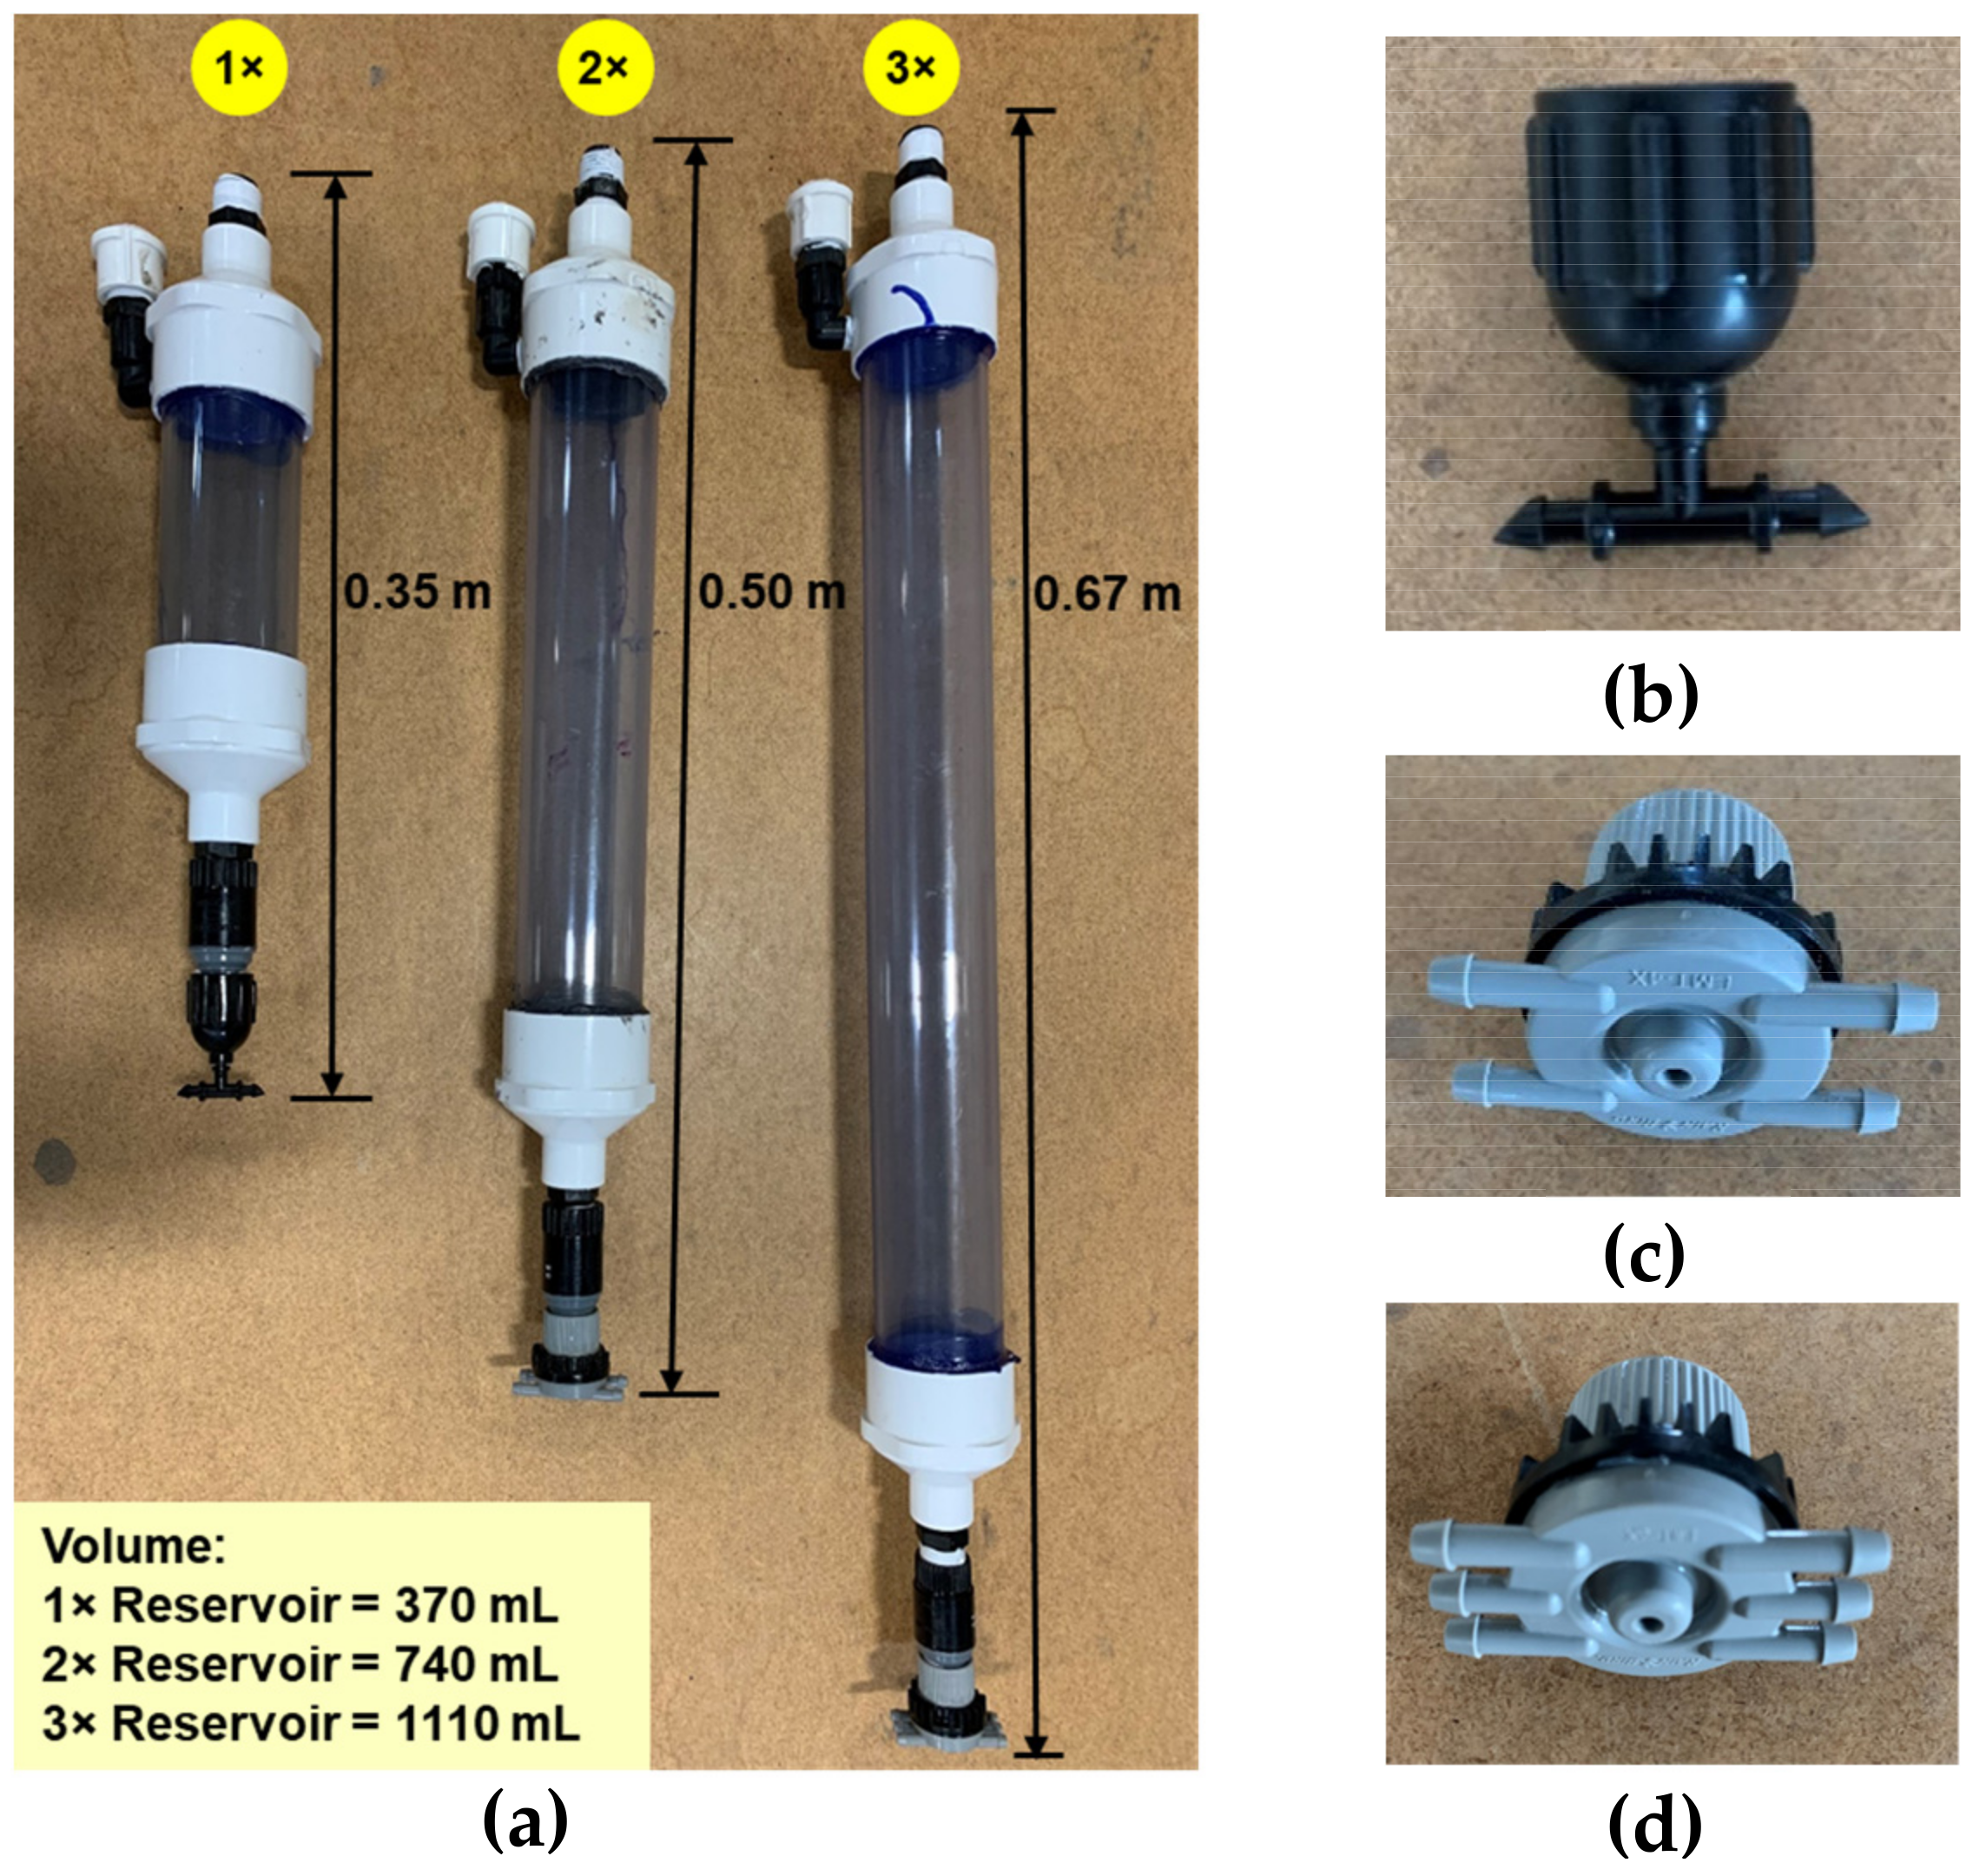
2.1. Reservoir Modification
2.2. Configuration Optimization
Laboratory Trials
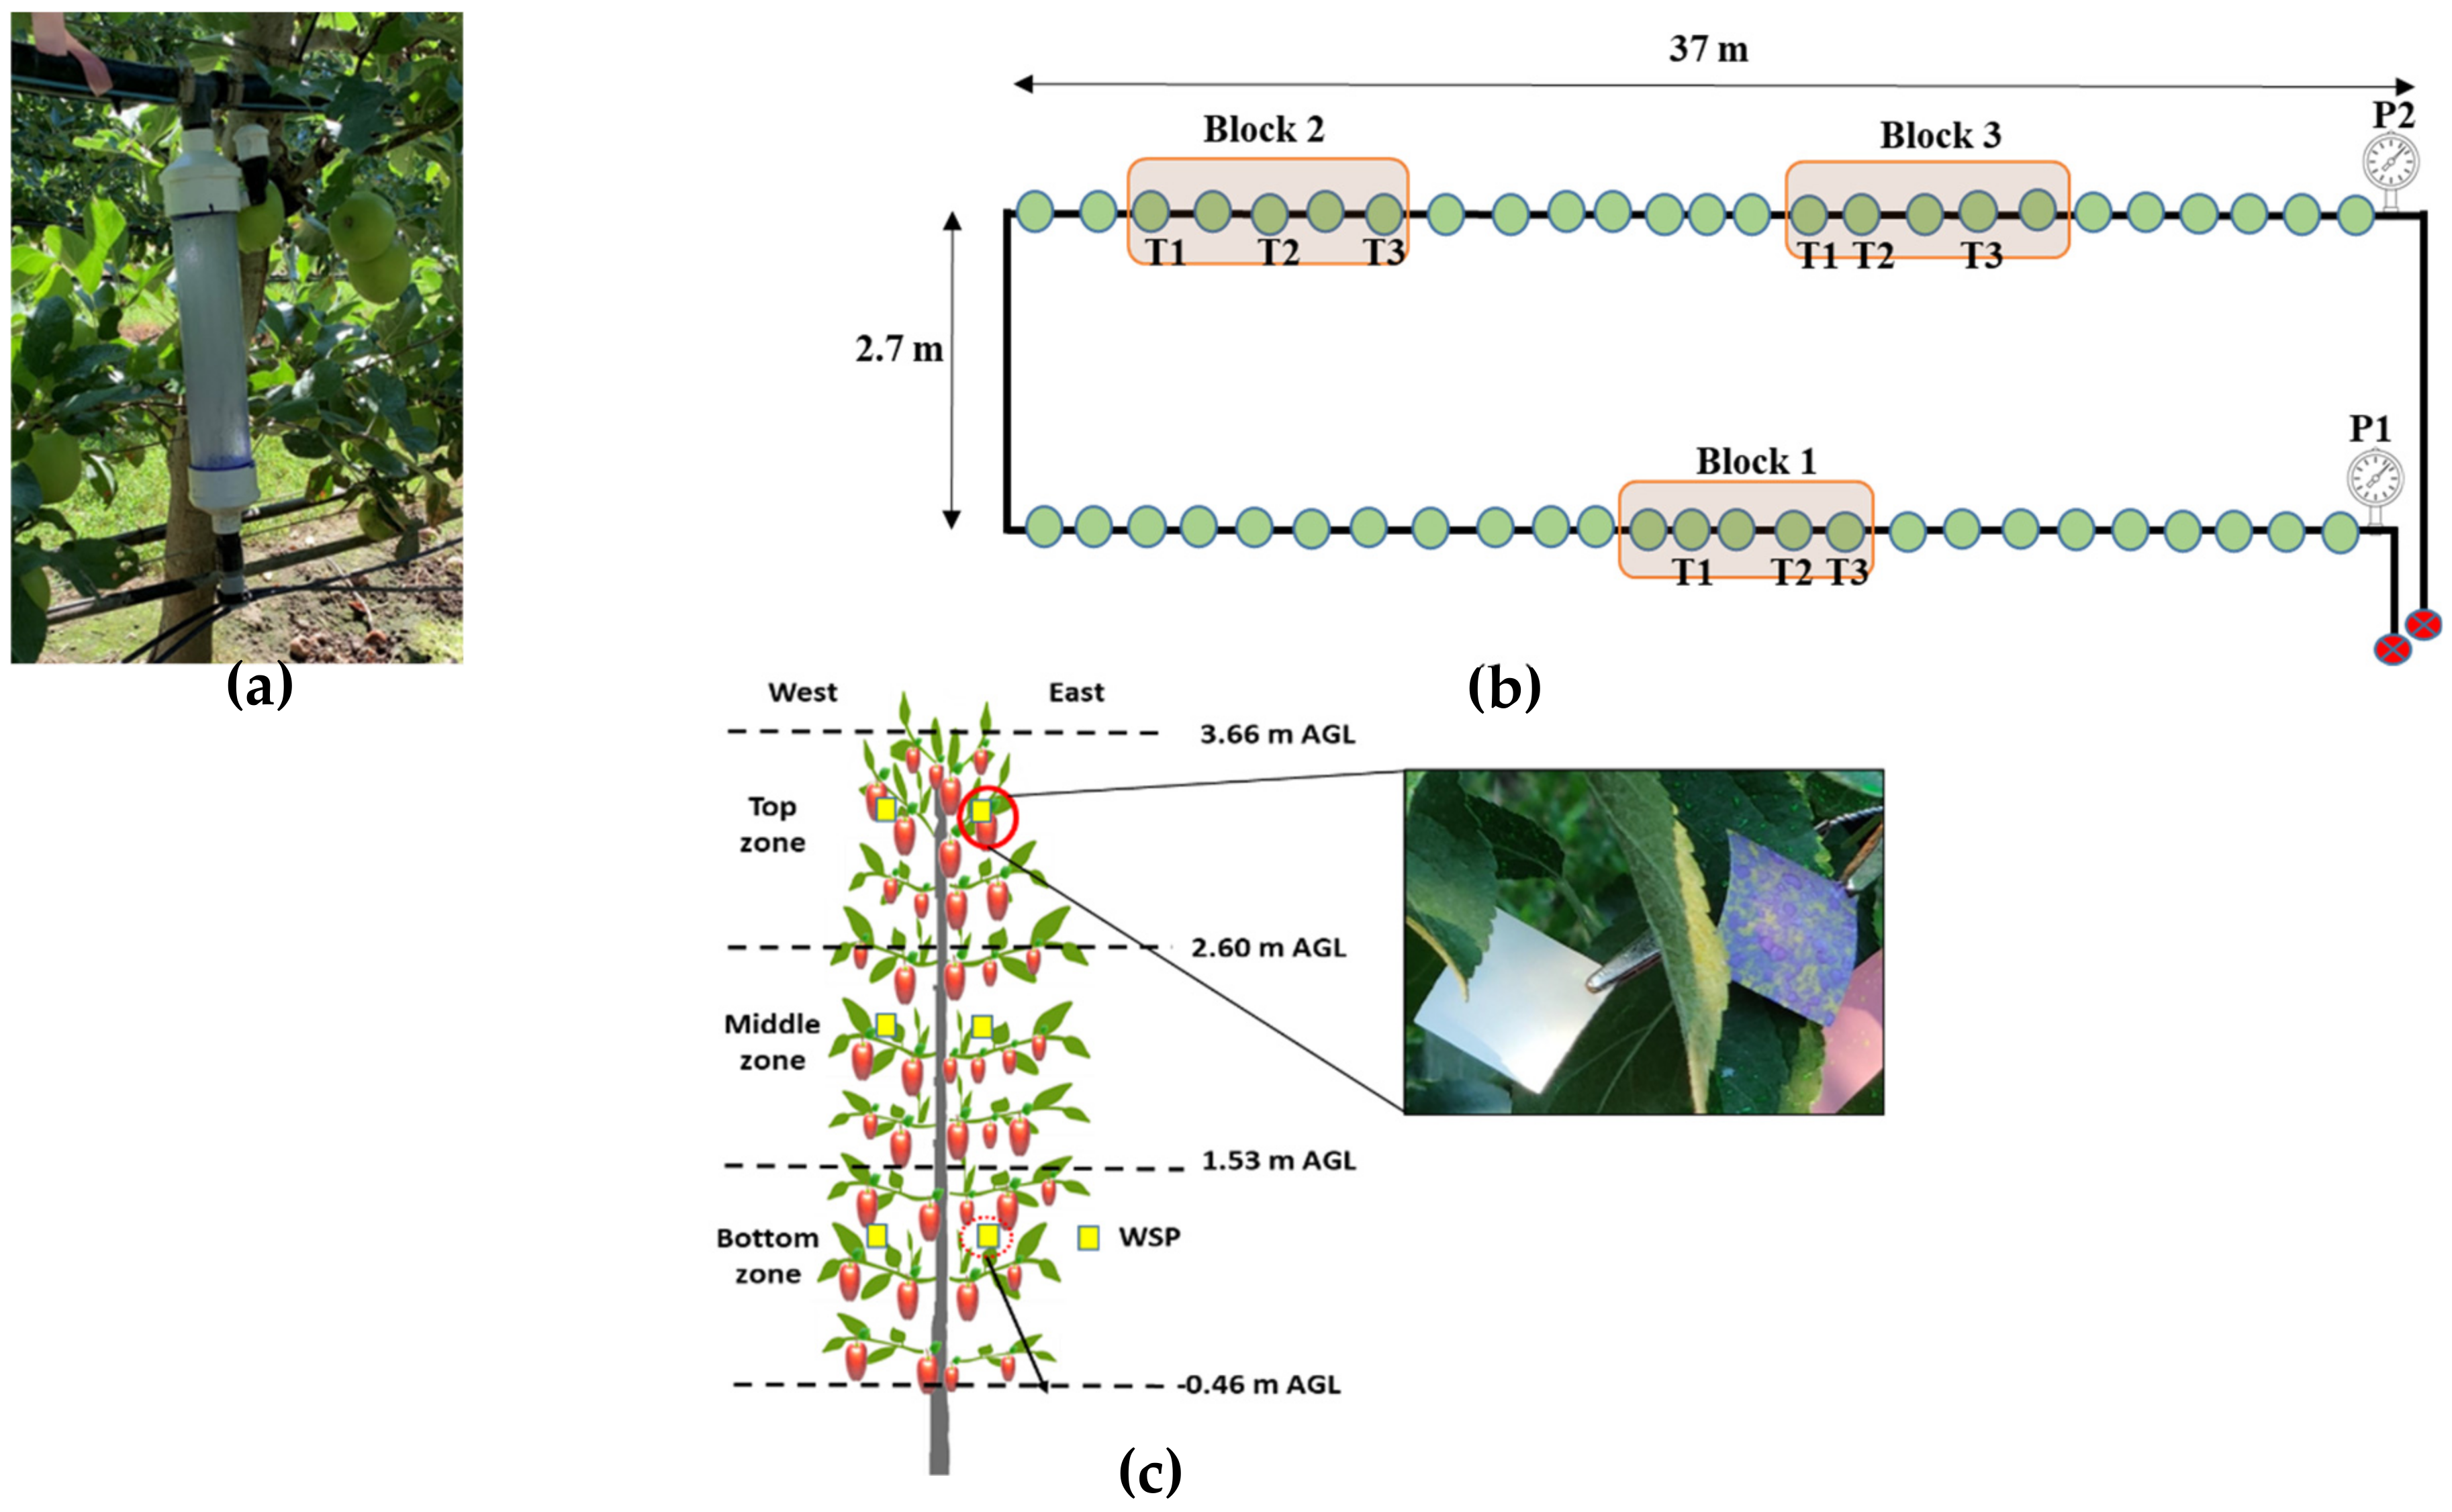
2.3. Field Trials
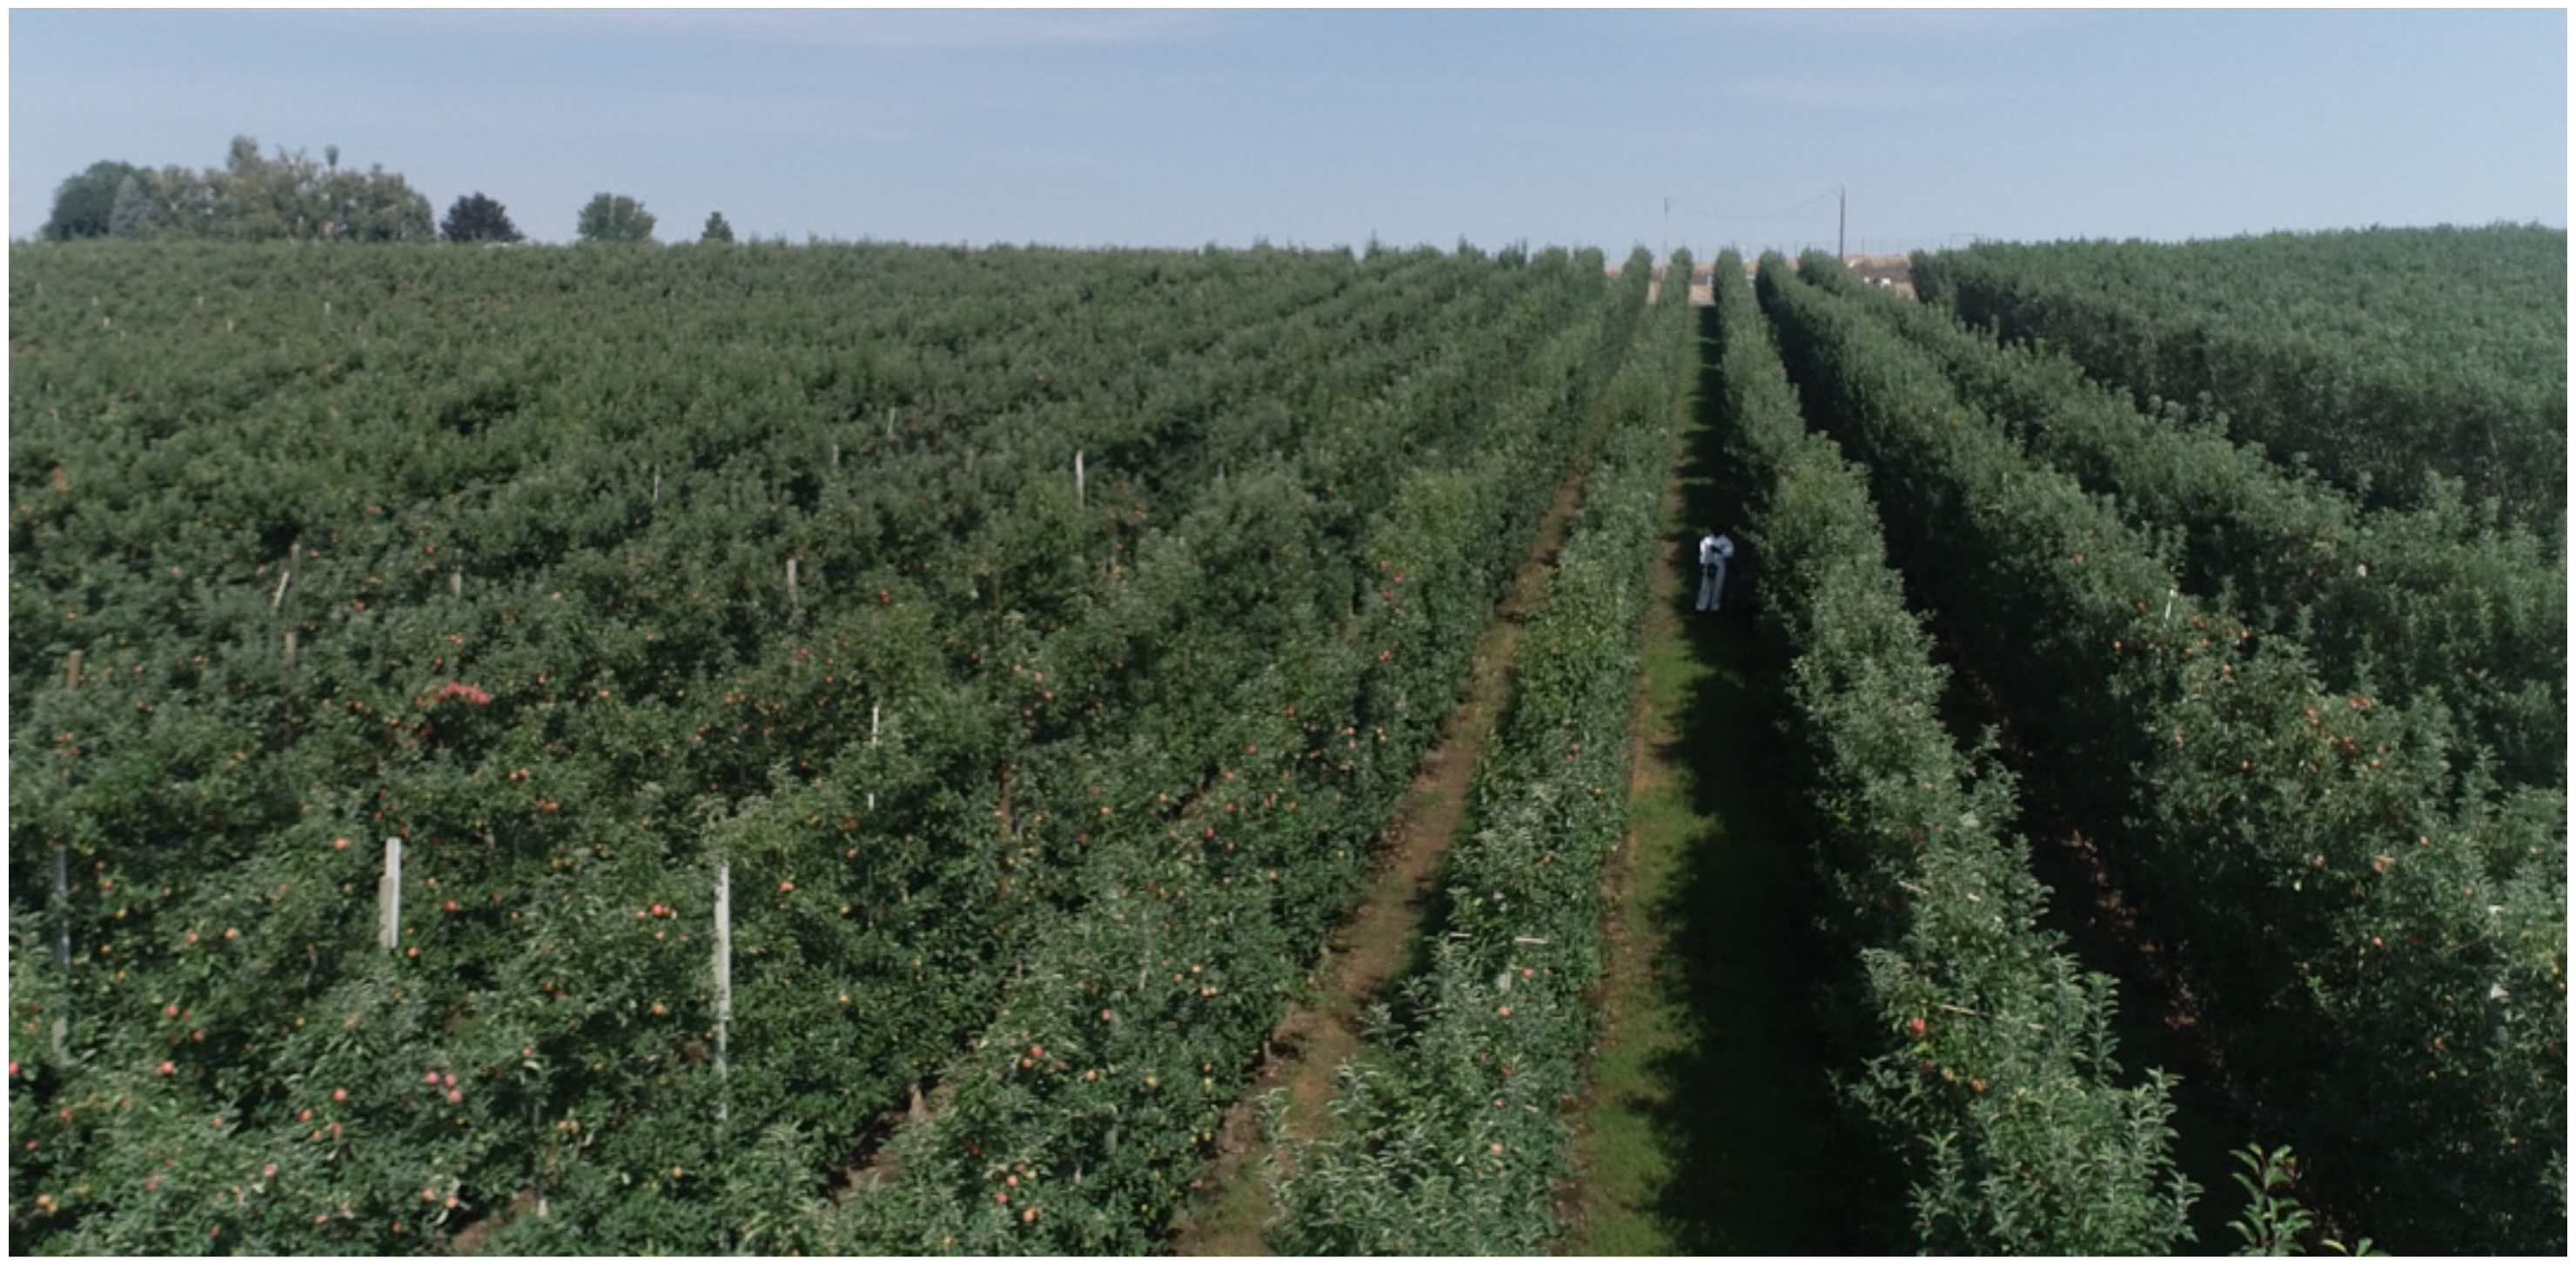
2.3.1. Study Site
2.3.2. Emitter Configuration Modification
2.3.3. Spray Application System
2.3.4. Experimental Design
2.3.5. Meteorological and System Performance Data Collection
2.4. Data Analysis
3. Results
3.1. Laboratory Results
3.1.1. Discharge Deviation
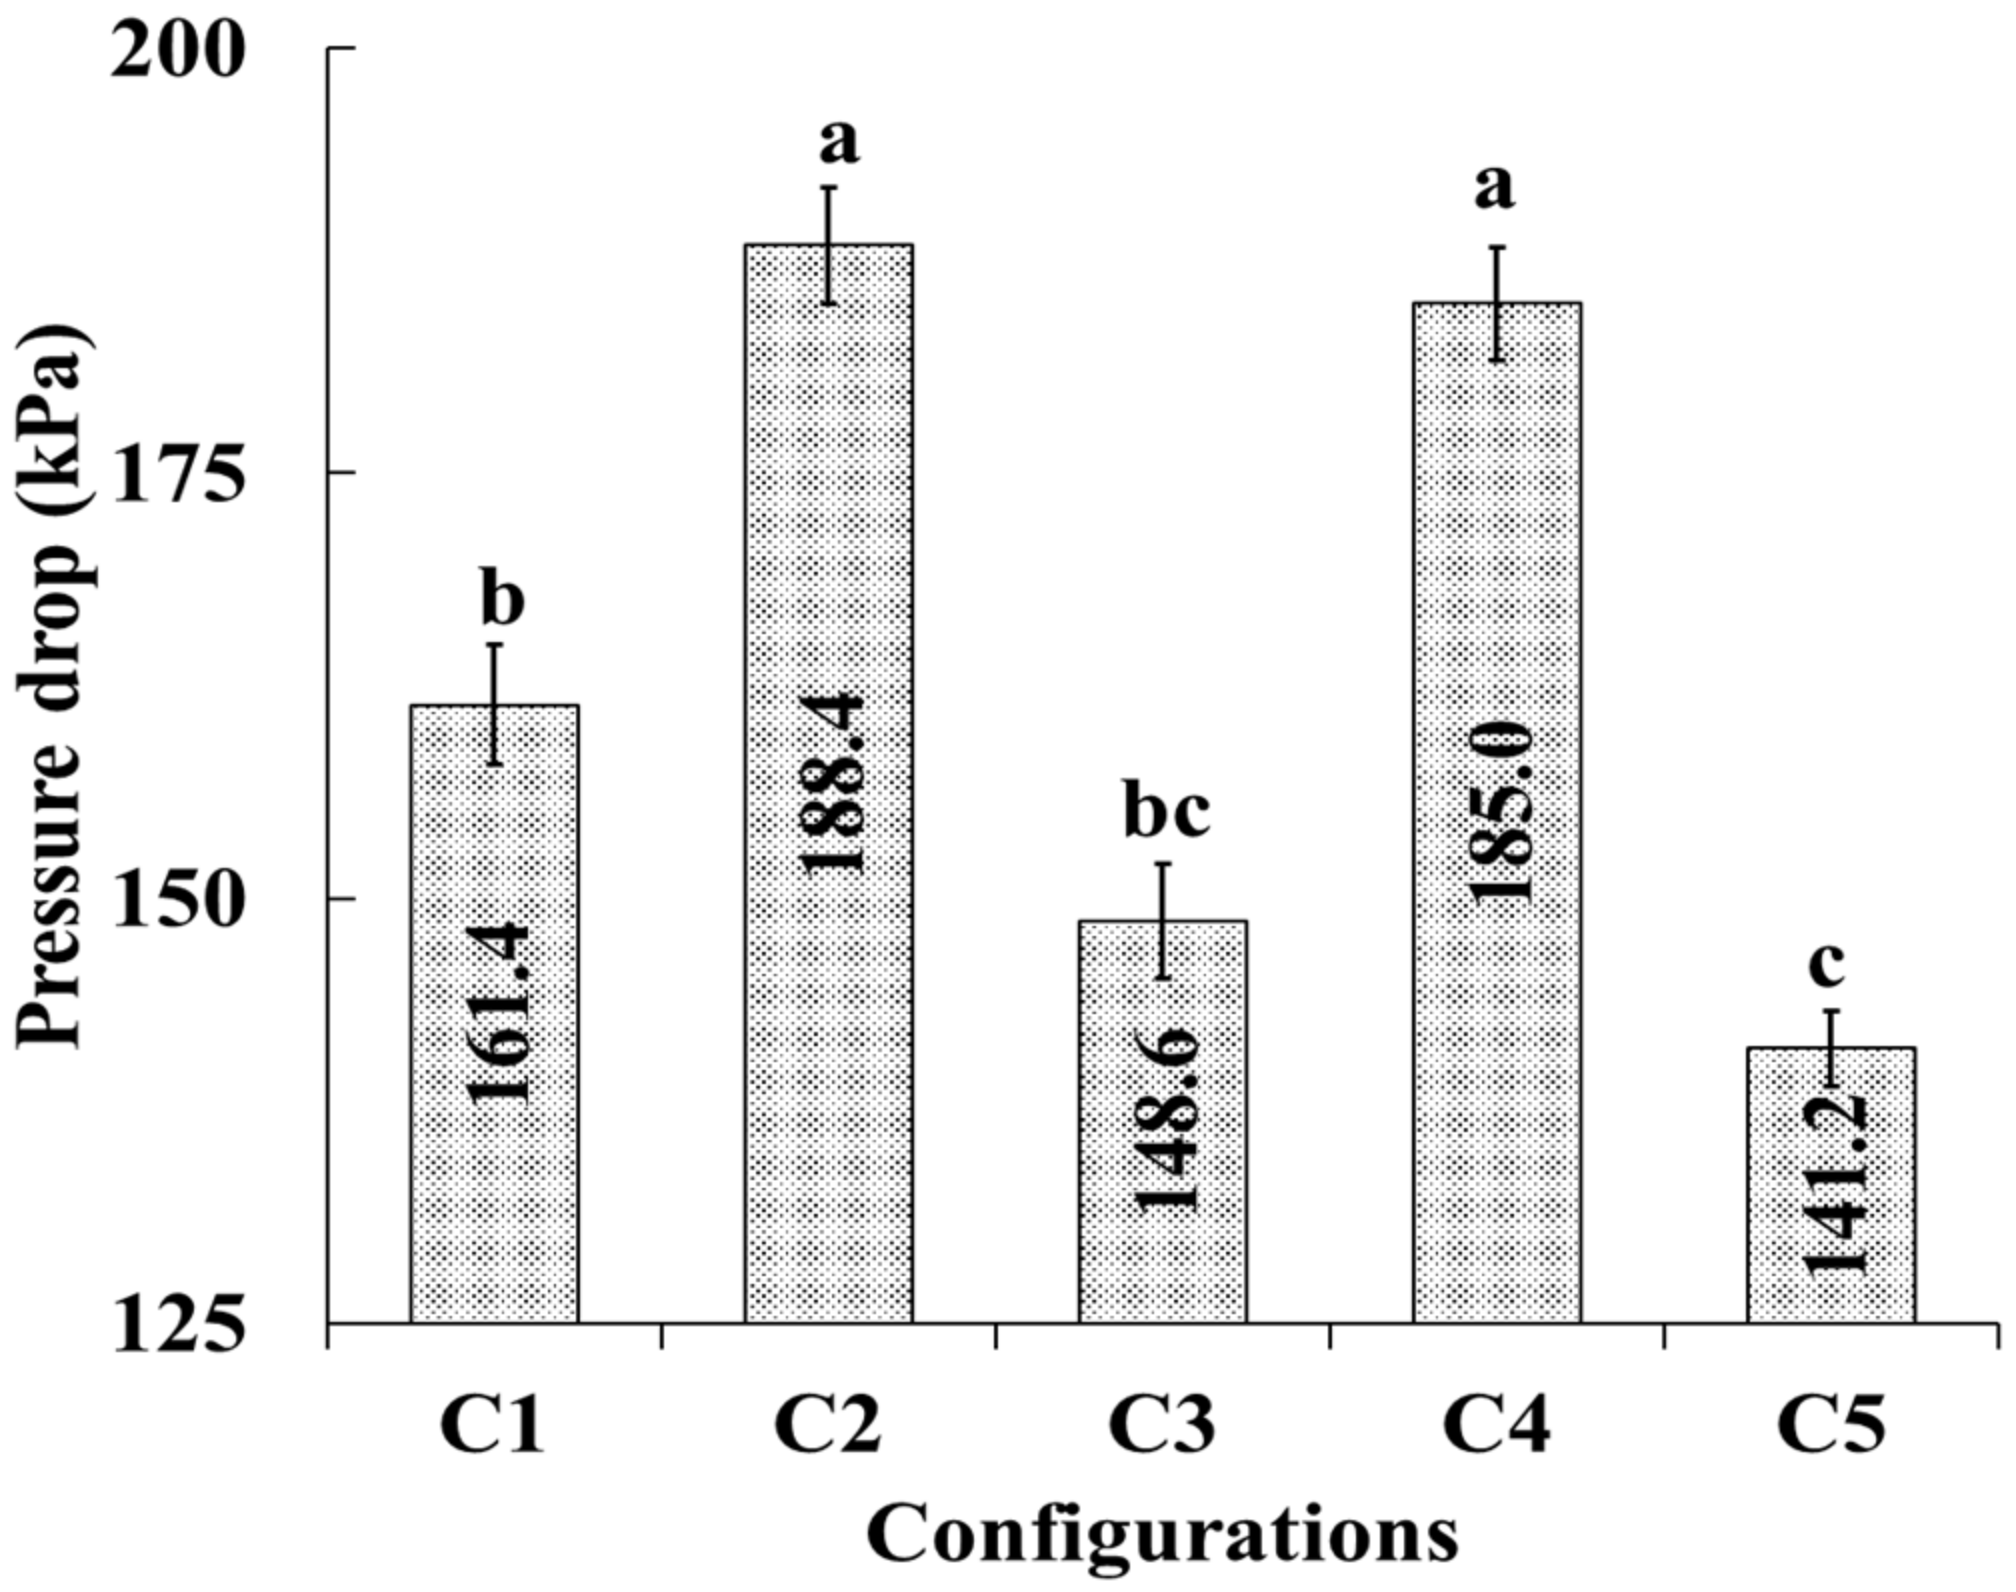
3.1.2. Pressure Drop
3.2. Field Trial Results
3.2.1. Coverage within Canopy Zone
3.2.2. Coverage on Leaf Surfaces
4. Discussion
5. Conclusions
- The reservoir modification retrofitted PSD-based SSCDS successfully eliminated the post-spray chemical losses associated with the prior design. The reservoir with the separate outlet configurations performed better in terms of spray uniformity as compared to the common outlet configurations.
- The three-tier PSD-based SSCDS configured with a large volumetric capacity reservoir (740 mL or 1110 mL) provided more even zonal coverage as compared to the systems configured with the 370 mL reservoirs. Using such a configuration will thus aid in the substantial reduction of the system installation and maintenance costs.
Author Contributions
Funding
Institutional Review Board Statement
Informed Consent Statement
Data Availability Statement
Acknowledgments
Conflicts of Interest
References
- USDA NASS. Press Release, National Agricultural Statistics Service Dated 08.10.20. 2020. Available online: https://www.nass.usda.gov/Statistics_by_State/Washington/Publications/Current_News_Release/2020/VOP_WA.pdf (accessed on 20 September 2021).
- Herrington, P.J.; Mapother, H.R.; Stringer, A. Spray retention and distribution on apple trees. Pestic. Sci. 1981, 12, 515–520. [Google Scholar] [CrossRef]
- Cross, J.V. Deposits on apple leaves from medium volume, low volume and very low volume spray applications with an axial fan sprayer. BCPC Monogr. 1991, 46, 263–268. [Google Scholar]
- Cross, J.V.; Walklate, P.J.; Murray, R.A.; Richardson, G.M. Spray deposits and losses in different sized apple trees from an axial fan orchard sprayer: 1. Effects of spray liquid flow rate. Crop Prot. 2001, 20, 13–30. [Google Scholar] [CrossRef]
- Cross, J.V.; Walklate, P.J.; Murray, R.A.; Richardson, G.M. Spray deposits and losses in different sized apple trees from axial fan orchard sprayers: 2. Effects of spray quality. Crop Prot. 2001, 20, 333–343. [Google Scholar] [CrossRef]
- Grieshop, M.J.; Emling, J.; Ledebuhr, M. Re-envisioning agrichemical input delivery: Solid set delivery systems for high density fruit production, Impacts on off-target deposition. In Proceedings of the 2018 ASABE Annual International Meeting, Detroit, MI, USA, 29 July–1 August 2018; pp. 2–9. [Google Scholar]
- Gil, Y.; Sinfort, C. Emission of pesticides to the air during sprayer application: A bibliographic review. Atmos. Environ. 2005, 39, 5183–5193. [Google Scholar] [CrossRef]
- Tsai, M.Y.; Elgethun, K.; Ramaprasad, J.; Yost, M.G.; Felsot, A.S.; Hebert, V.R.; Fenske, R.A. The Washington aerial spray drift study: Modeling pesticide spray drift deposition from an aerial application. Atmos. Environ. 2005, 39, 6194–6203. [Google Scholar] [CrossRef]
- Ford, D.; Dunn, M.; Morrison, J.; Willis, C. Human Exposure to Pesticide Drift: Washington State Report 2017. Available online: https://columbialegal.org/wp-content/uploads/2018/11/PesticideReportFINALWeb.pdf (accessed on 20 September 2021).
- Håkansson, I.; Voorhees, W.B.; Riley, H. Vehicle and wheel factors influencing soil compaction and crop response in different traffic regimes. Soil Tillage Res. 1988, 11, 239–282. [Google Scholar] [CrossRef]
- Vogeler, I.; Cichota, R.; Sivakumaran, S.; Deurer, M.; McIvor, I. Soil assessment of apple orchards under conventional and organic management. Aust. J. Soil Res. 2006, 44, 745–752. [Google Scholar] [CrossRef]
- Maraseni, T.N.; Cockfield, G.; Apan, A. A comparison of greenhouse gas emissions from inputs into farm enterprises in Southeast Queensland, Australia. J. Environ. Sci. Health A 2007, 42, 11–18. [Google Scholar] [CrossRef]
- Agnello, A.; Landers, A.J. Current progress in development of a fixed spray pesticide application system for high-density apple plantings. N. Y. Fruit Q. 2006, 14, 22–26. [Google Scholar]
- Grieshop, M.; Gut, L.; Wise, J.; Smith, P.O.; Sundin, G.; Miller, S.; Flore, J.; Lang, G.; Perry, R. Development of solid set delivery systems for high density apples. N. Y. Fruit Q. 2015, 23, 16–20. [Google Scholar]
- Sharda, A.; Karkee, M.; Zhang, Q.; Ewlanow, I.; Adameit, U.; Brunner, J. Effect of emitter type and mounting configuration on spray coverage for solid set canopy delivery system. Comput. Electron. Agric. 2015, 112, 184–192. [Google Scholar] [CrossRef]
- Sharda, A.; Karkee, M.; Hoheisel, G.; Zhang, Q.; Mangus, D. Design and Evaluation of Solid Set Canopy Delivery System for Spray Application in High-density Apple Orchards. Appl. Eng. Agric. 2019, 35, 751–757. [Google Scholar] [CrossRef]
- Verpont, F.; Favareille, J.; Zavagli, F. Fixed spraying system: A future potential way to apply pesticides in an apple orchard? Julius-Kühn-Archiv 2015, 448, 53–54. [Google Scholar]
- Niemann, S.M.; Whiting, M.D.; Hanrahan, I. Efficacy of a solid set canopy delivery system (SSCDS) in sweet cherry and apple. In Proceedings of the XXIX International Horticultural Congress on Horticulture: Sustaining Lives, Livelihoods and Landscapes, Brisbane, Australia, 17 August 2016; Volume 1130, pp. 145–150. [Google Scholar]
- Otto, S.; Loddo, D.; Schmid, A.; Roschatt, C.; Venturelli, M.; Innerebner, G. Droplets deposition pattern from a prototype of a fixed spraying system in a sloping vineyard. Sci. Total Environ. 2018, 639, 92–99. [Google Scholar] [CrossRef]
- Owen-Smith, P.; Perry, R.; Wise, J.; Jamil, R.Z.R.; Gut, L.; Sundin, G.; Grieshop, M.J. Spray coverage and pest management efficacy of a solid set canopy delivery system in high density apples. Pest Manag. Sci. 2019, 75, 3050–3059. [Google Scholar] [CrossRef]
- Owen-Smith, P.; Wise, J.; Grieshop, M.J. Season long pest management efficacy and spray characteristics of a solid set canopy delivery system in high density apples. Insects 2019, 10, 193. [Google Scholar] [CrossRef]
- Sinha, R.; Ranjan, R.; Bahlol, H.Y.; Khot, L.R.; Hoheisel, G.A.; Grieshop, M.J. Development and performance evaluation of a pneumatic spray delivery based solid set canopy delivery system for spray application in a high–density apple orchard. Trans. ASABE 2020, 63, 37–48. [Google Scholar] [CrossRef]
- Sinha, R.; Khot, L.R.; Hoheisel, G.A.; Grieshop, M.J. Field performance of a solid set canopy delivery system configured for high-density tall spindle architecture trained apple canopies. Trans. ASABE 2021, 64, 1735–1745. [Google Scholar] [CrossRef]
- Innerebner, G.; Roschatt, C.; Schmid, A. Efficacy of fungicide treatments on grapevines using a fixed spraying system. Crop Prot. 2020, 138, 105324. [Google Scholar] [CrossRef]
- Imperatore, G.; Ghirardelli, A.; Strinna, L.; Baldoin, C.; Pozzebon, A.; Zanin, G.; Otto, S. Evaluation of a fixed spraying system for phytosanitary treatments in heroic viticulture in north-eastern Italy. Agriculture 2021, 11, 833. [Google Scholar] [CrossRef]
- Ranjan, R.; Sinha, R.; Khot, L.R.; Hoheisel, G.A.; Grieshop, M.; Ledebuhr, M. Spatial distribution of spray from a solid set canopy delivery system in a high-density apple orchard retrofitted with modified emitters. Appl. Sci. 2021, 11, 709. [Google Scholar] [CrossRef]
- Ranjan, R.; Sinha, R.; Khot, L.R.; Hoheisel, G.A.; Grieshop, M.; Ledebuhr, M. Effect of emitter modifications on spray performance of a solid set canopy delivery system in a high-density apple orchard. Sustainability 2021, 13, 13248. [Google Scholar] [CrossRef]
- Panneton, B.; Philion, V.; Chouinard, G. Spray deposition with conventional nozzles, low-drift nozzles, or permanent sprinklers for controlling apple orchard pests. Trans. ASABE 2015, 58, 607–619. [Google Scholar]
- Sharda, A.; Karkee, M.; Zhang, Q. Fluid dynamics of a solid set canopy spray delivery system for orchard applications. In 2013 ASABE Annual Meeting; Paper No. 131620688; ASABE: St. Joseph, MI, USA, 2013. [Google Scholar]
- EPA. Safe Disposal of Pesticides 2021. Available online: https://www.epa.gov/safepestcontrol/safe-disposal-pesticides (accessed on 28 April 2022).
- R Studio, R Core Team. R: A Language and Environment for Statistical Computing; R Foundation for Statistical Computing: Vienna, Austria, 2021; Available online: http://www.R-project.org/ (accessed on 25 January 2022).
- ISO 22522:2007 (E); Crop Protection Equipment—Field Measurement of Spray Distribution in Tree and Bush Crops. ISO: Geneva, Switzerland, 2007.
- ASABE, S561.1; Procedure for Measuring Drift Deposits from Ground, Orchard, and Aerial Sprayers. ASABE: St. Joseph, MI, USA, 2004.
- Tepper, G. Weather Essentials for Pesticide Application; Grains Research & Development Corporation: Barton, Australia, 2017. [Google Scholar]
- Chaim, A.; Pessoa, M.C.P.Y.; Camargo Neto, J.; Hermes, L.C. Comparison of microscopic method and computational program for pesticide deposition evaluation of spraying. Pesqui. Agropecu. Bras. 2002, 37, 493–496. [Google Scholar] [CrossRef]

 represents pressure measurement point (dimension not drawn to scale).
represents pressure measurement point (dimension not drawn to scale).
represents pressure measurement point (dimension not drawn to scale).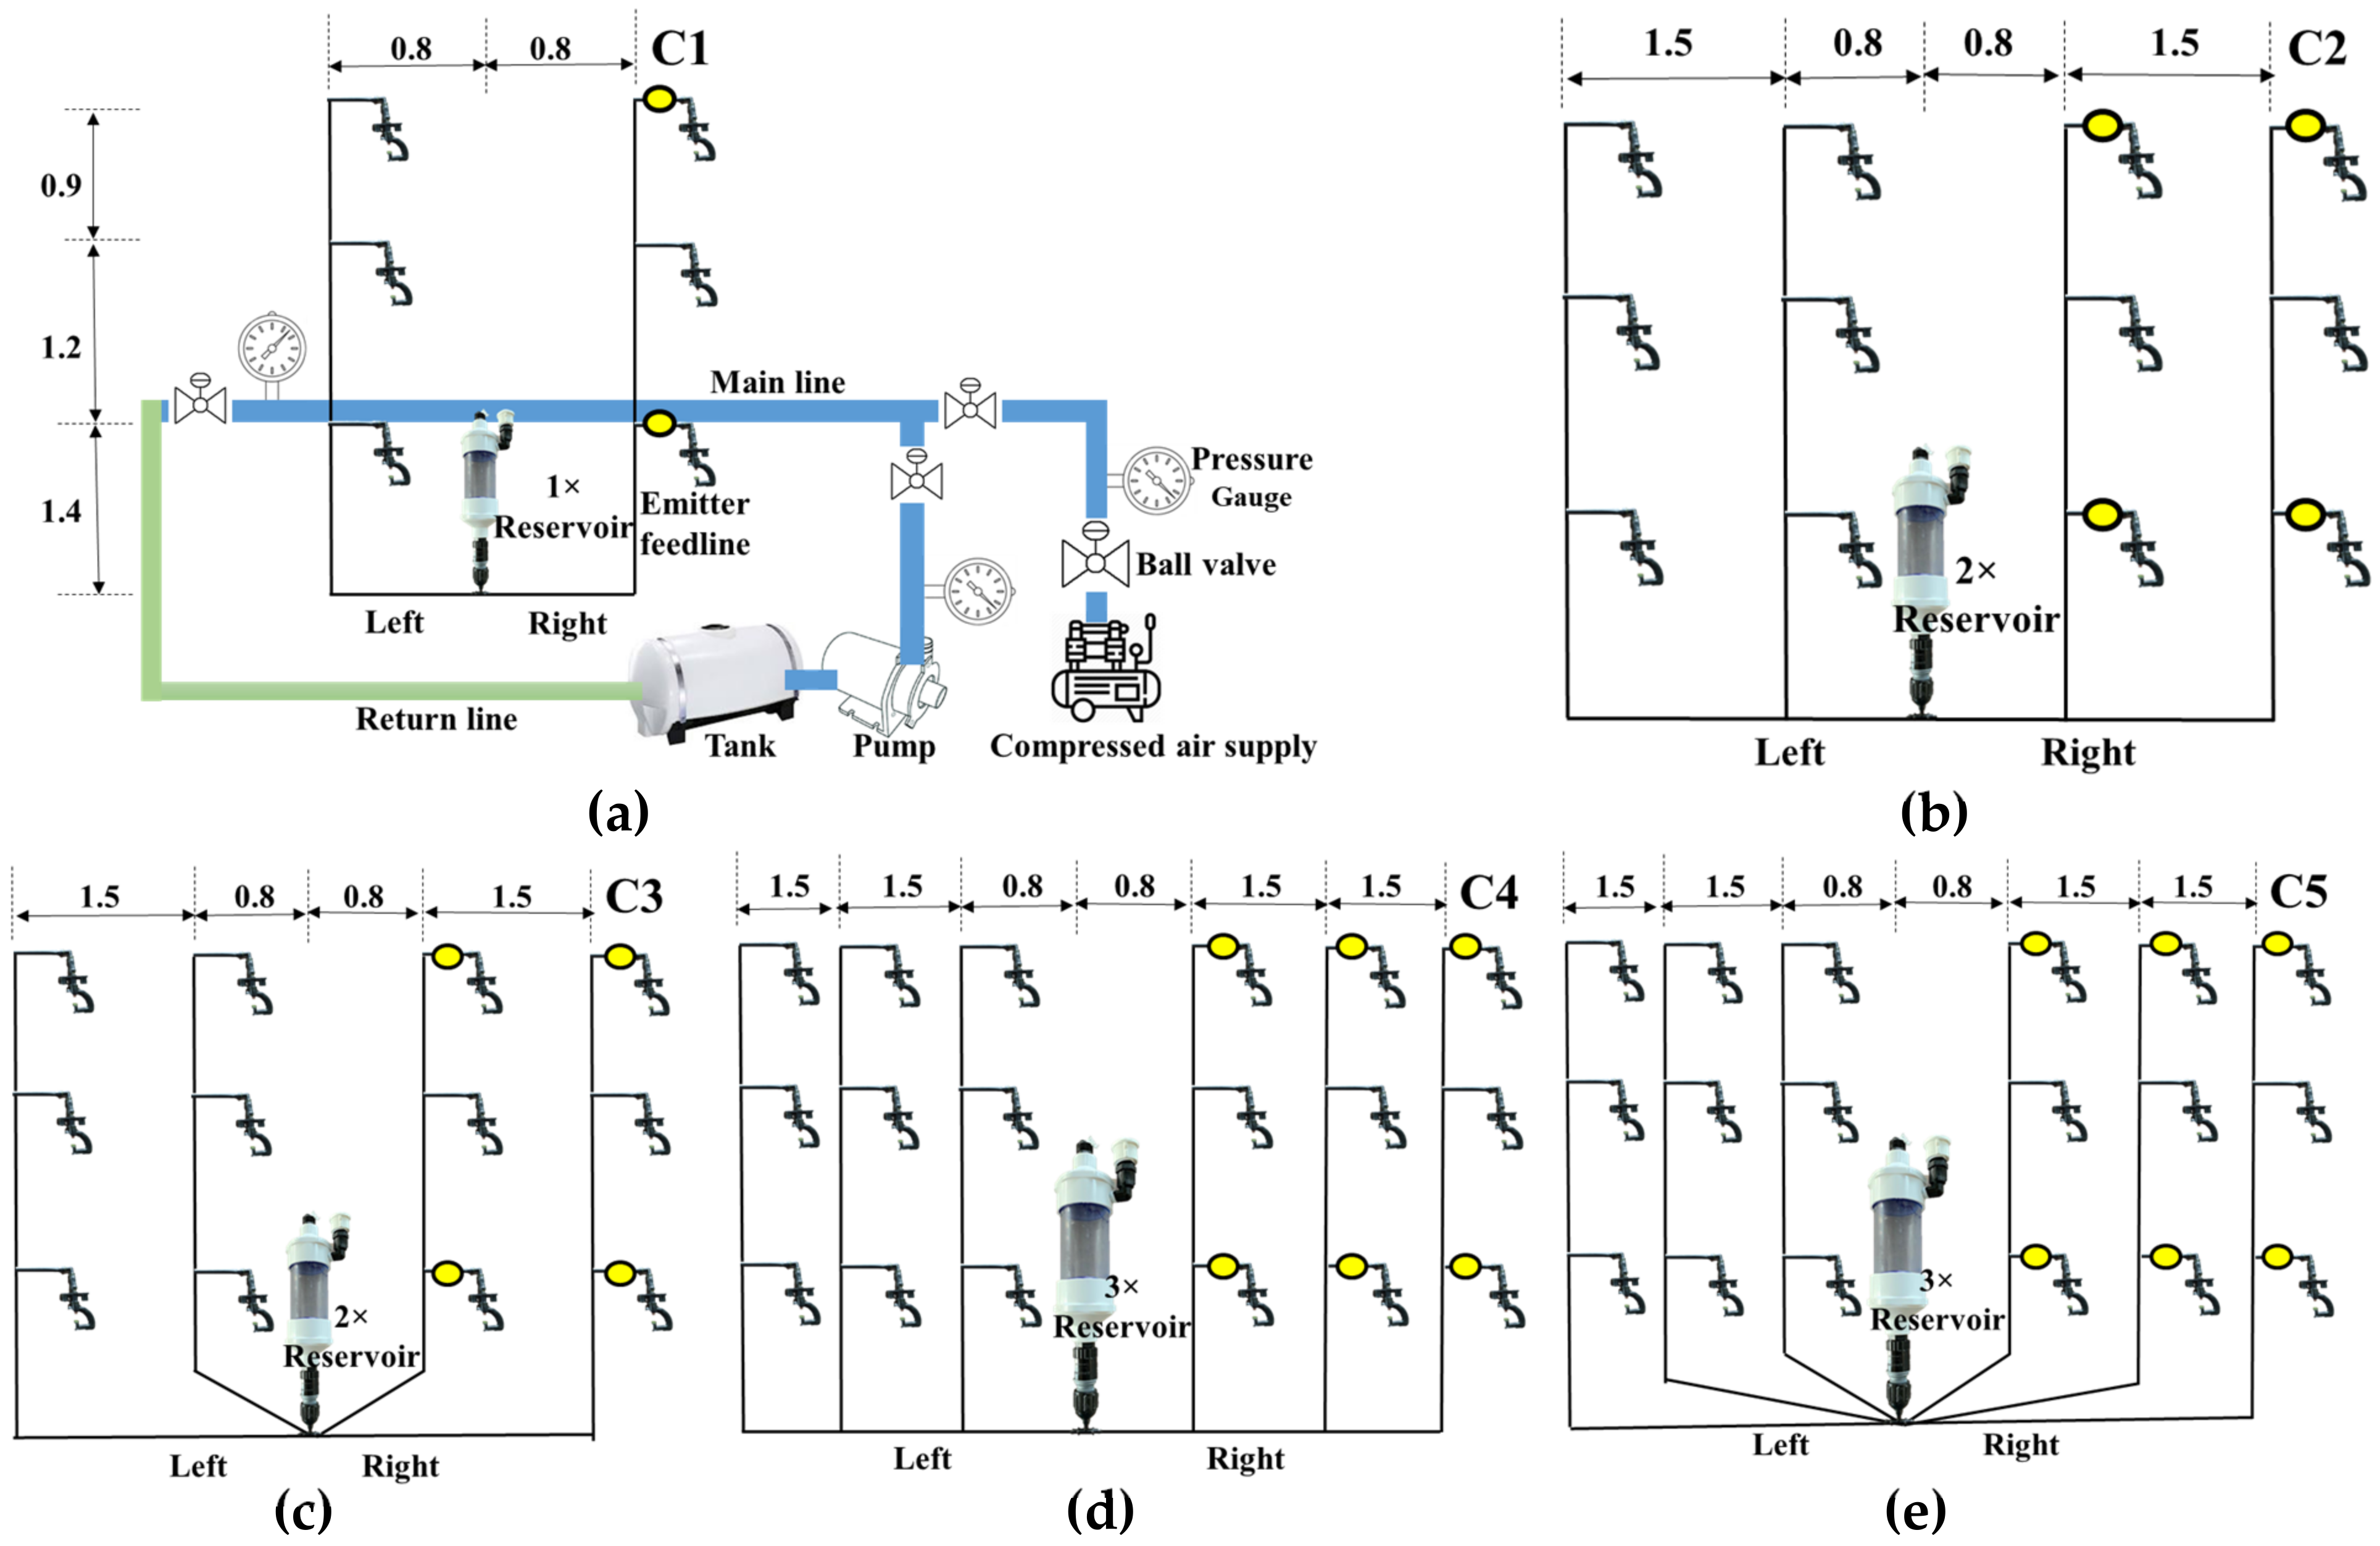


| Configuration Type | Configuration | Reservoir Capacity | Number of Emitter Feedlines | Spray Span (m) |
|---|---|---|---|---|
| Separate | C1 | 1× * | 2 | 3.0 |
| C3 | 2× | 4 | 6.1 | |
| C5 | 3× | 6 | 9.1 | |
| Common | C2 | 2× | 4 | 6.1 |
| C4 | 3× | 6 | 9.1 |
| Treatment (Reservoir) | Wind Speed (mean ± SD, m s−1) | Wind Direction (a) (mean ± SD, °) | Air Temperature (mean ± SD, °C) | Relative Humidity (mean ± SD, %) |
|---|---|---|---|---|
| 1× | 1.0 ± 0.4 | 15.5 ± 23.5 | 13.1 ± 0.3 | 49.1 ± 1.0 |
| 2× | 1.2 ± 0.4 | 21.0 ± 32.2 | 18.2 ± 0.6 | 38.0 ± 1.2 |
| 3× | 1.0 ± 0.4 | 23.2 ± 21.0 | 15.8 ± 0.3 | 42.9 ± 0.8 |
| Variables | df | MS | F | p |
|---|---|---|---|---|
| Main Plot | ||||
| Block | 2 | 1.26 | ||
| Treatment | 2 | 0.09 | 0.13 | 0.88 |
| Error (a) | 2 | 0.39 | ||
| Canopy Zone | 2 | 3.11 | 4.28 | 0.01 |
| Leaf surface | 1 | 59.61 | 82.03 | 2 × 10⁻¹⁶ |
| Treatment × Canopy Zone | 4 | 0.07 | 0.09 | 0.98 |
| Treatment × Leaf Surface | 2 | 0.49 | 0.67 | 0.51 |
| Canopy Zone × Leaf Surface | 2 | 1.43 | 1.97 | 0.14 |
| Treatment × Canopy Zone × Leaf Surface | 4 | 0.1 | 0.14 | 0.97 |
| Errors (b) | 284 | 0.73 |
Publisher’s Note: MDPI stays neutral with regard to jurisdictional claims in published maps and institutional affiliations. |
© 2022 by the authors. Licensee MDPI, Basel, Switzerland. This article is an open access article distributed under the terms and conditions of the Creative Commons Attribution (CC BY) license (https://creativecommons.org/licenses/by/4.0/).
Share and Cite
Sahni, R.K.; Ranjan, R.; Khot, L.R.; Hoheisel, G.-A.; Grieshop, M.J. Reservoir Units Optimization in Pneumatic Spray Delivery-Based Fixed Spray System for Large-Scale Commercial Adaptation. Sustainability 2022, 14, 10843. https://doi.org/10.3390/su141710843
Sahni RK, Ranjan R, Khot LR, Hoheisel G-A, Grieshop MJ. Reservoir Units Optimization in Pneumatic Spray Delivery-Based Fixed Spray System for Large-Scale Commercial Adaptation. Sustainability. 2022; 14(17):10843. https://doi.org/10.3390/su141710843
Chicago/Turabian StyleSahni, Ramesh K., Rakesh Ranjan, Lav R. Khot, Gwen-Alyn Hoheisel, and Matthew J. Grieshop. 2022. "Reservoir Units Optimization in Pneumatic Spray Delivery-Based Fixed Spray System for Large-Scale Commercial Adaptation" Sustainability 14, no. 17: 10843. https://doi.org/10.3390/su141710843
APA StyleSahni, R. K., Ranjan, R., Khot, L. R., Hoheisel, G.-A., & Grieshop, M. J. (2022). Reservoir Units Optimization in Pneumatic Spray Delivery-Based Fixed Spray System for Large-Scale Commercial Adaptation. Sustainability, 14(17), 10843. https://doi.org/10.3390/su141710843