
Experimental Study of Phase Change Microcapsule Suspensions Applied in BIPV Construction
 ,
,
Abstract
:1. Introduction
2. Preparation of Suspensions
2.1. Material Selection
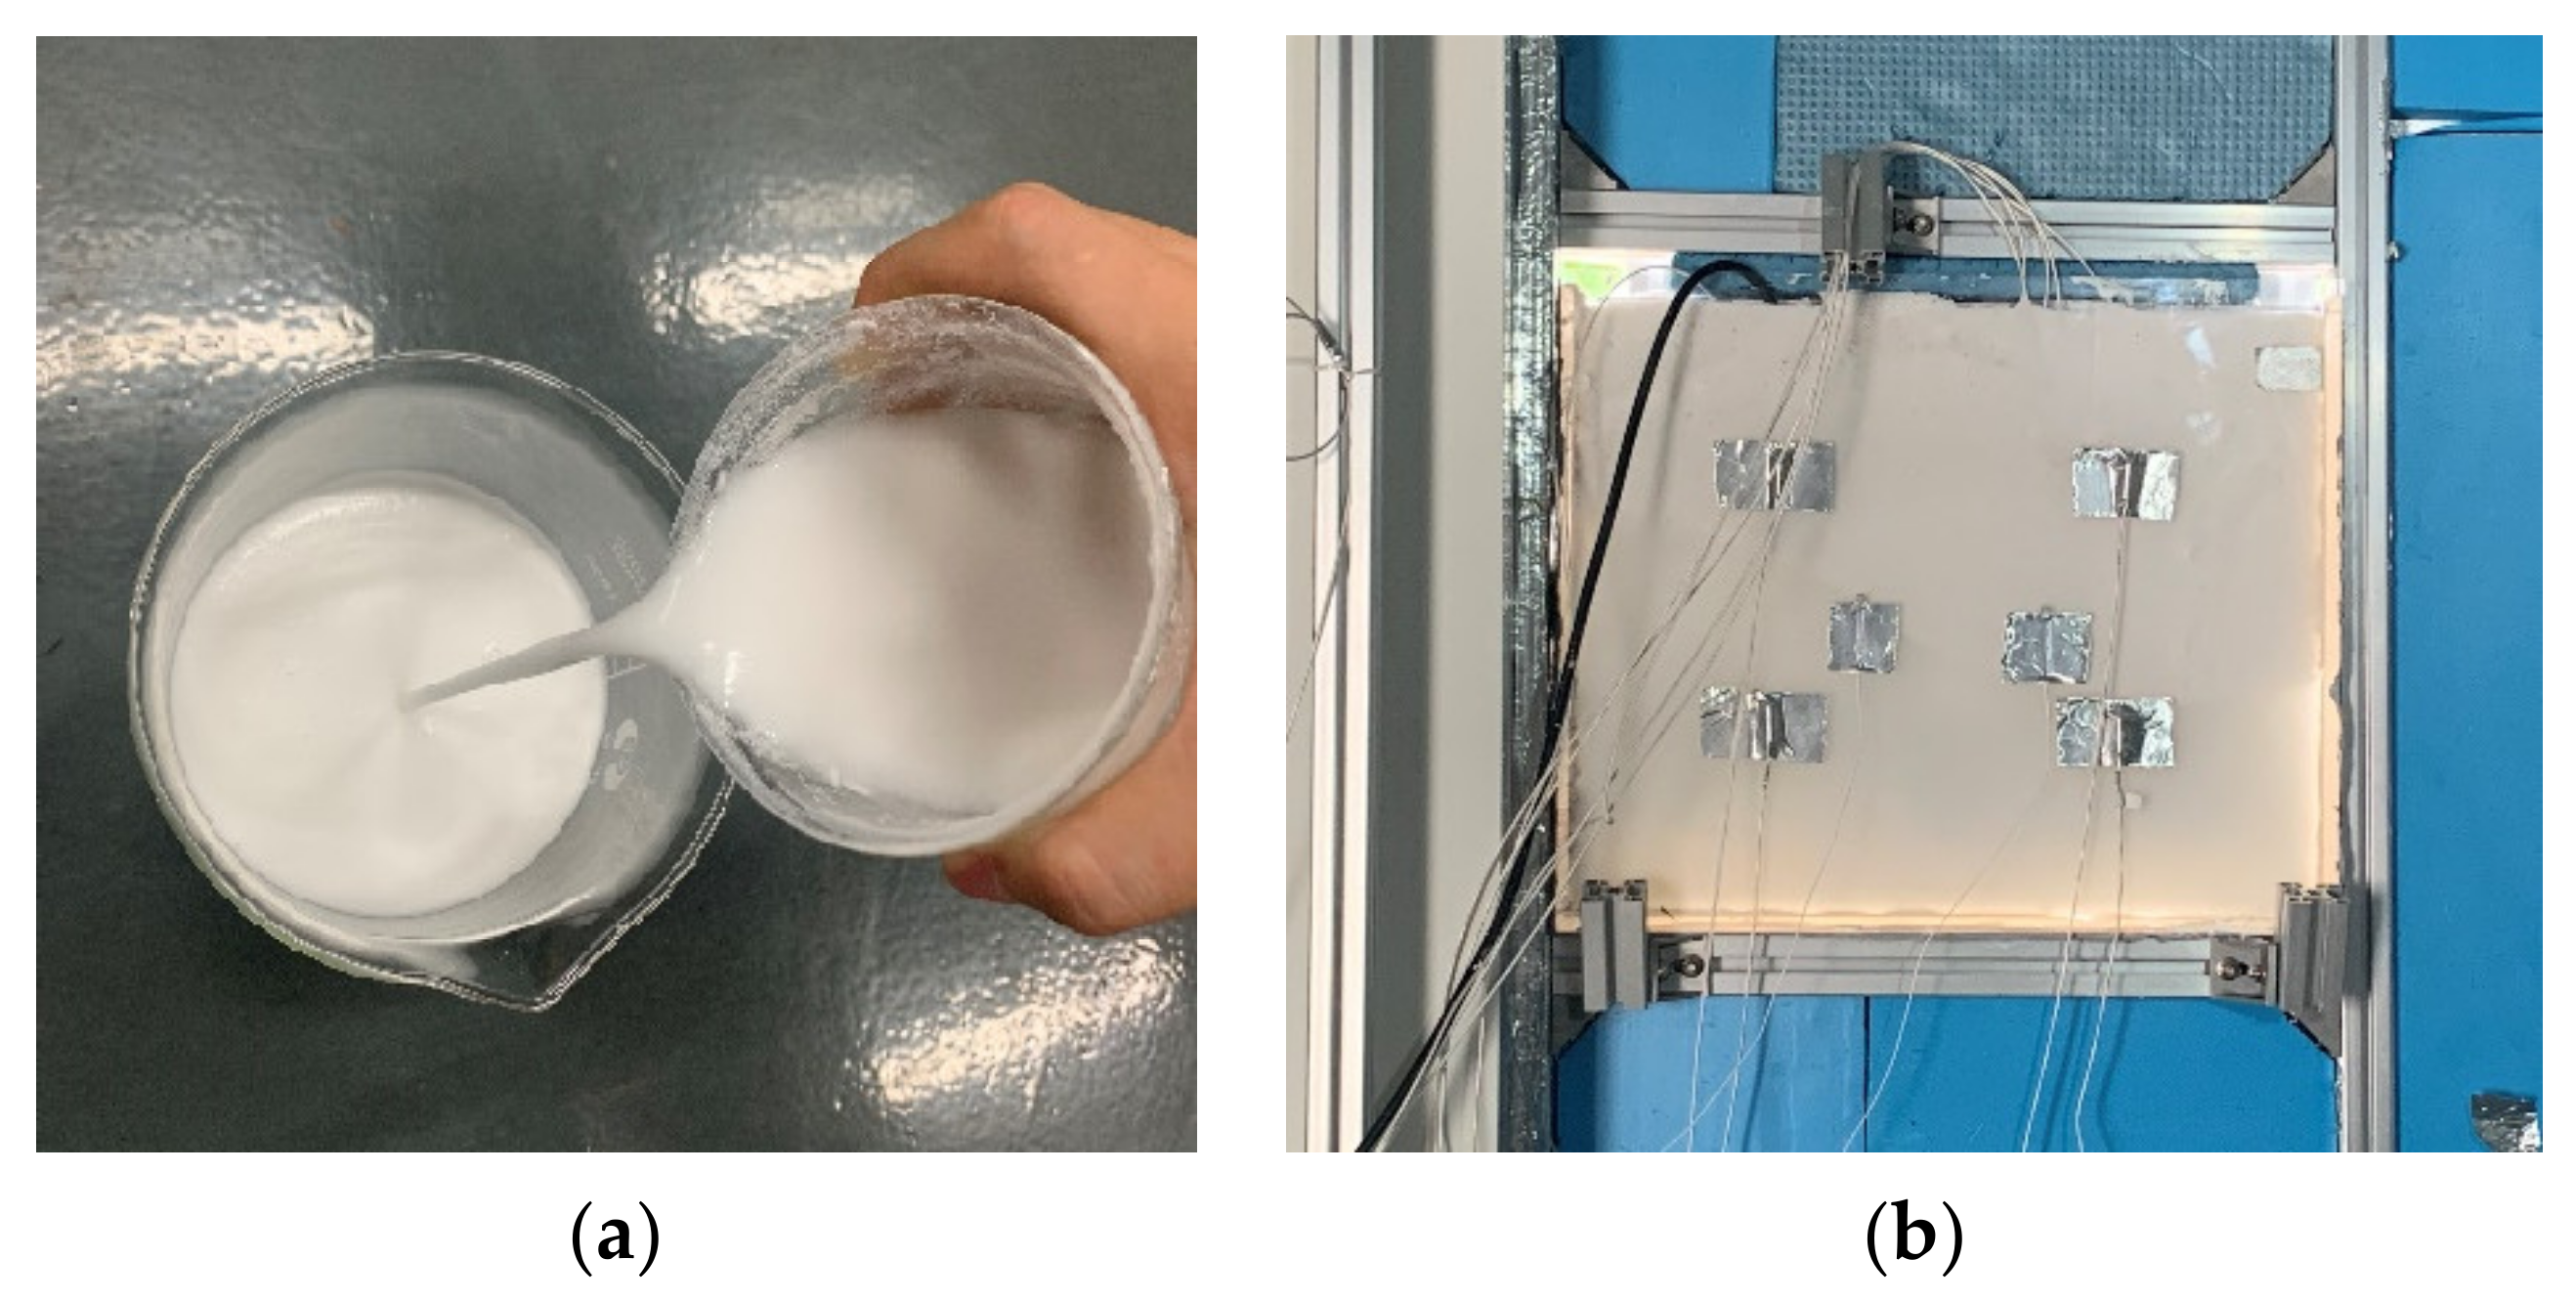
2.2. Preparation Methods
- (1)
- According to the amount of the base solution and the mass fraction of the suspension to be prepared, the mass of the required microcapsule particles was calculated. The dried microcapsule particles were weighed with the FA2004 electronic balance and placed in the beaker.
- (2)
- According to the quality of microcapsule particles and the mass fraction of the suspension, the quality of deionized water was calculated. The beaker quantity was put in the jar, and DF101S constant temperature magnetic stirrer was used for low-speed stirring 20 min.
- (3)
- 0.2% mass fraction of xanthan gum was added to the solution and stirred vigorously for 30 min.
- (4)
- The stirred microcapsule suspension was put into an ultrasonic oscillator model KQ2200 F and oscillated at a constant temperature of 40 °C with a frequency of 37 kHz for 20 min.
- (5)
- We let it stand and observed whether the suspension appeared to be stratified.
3. Analysis of Experimental Results
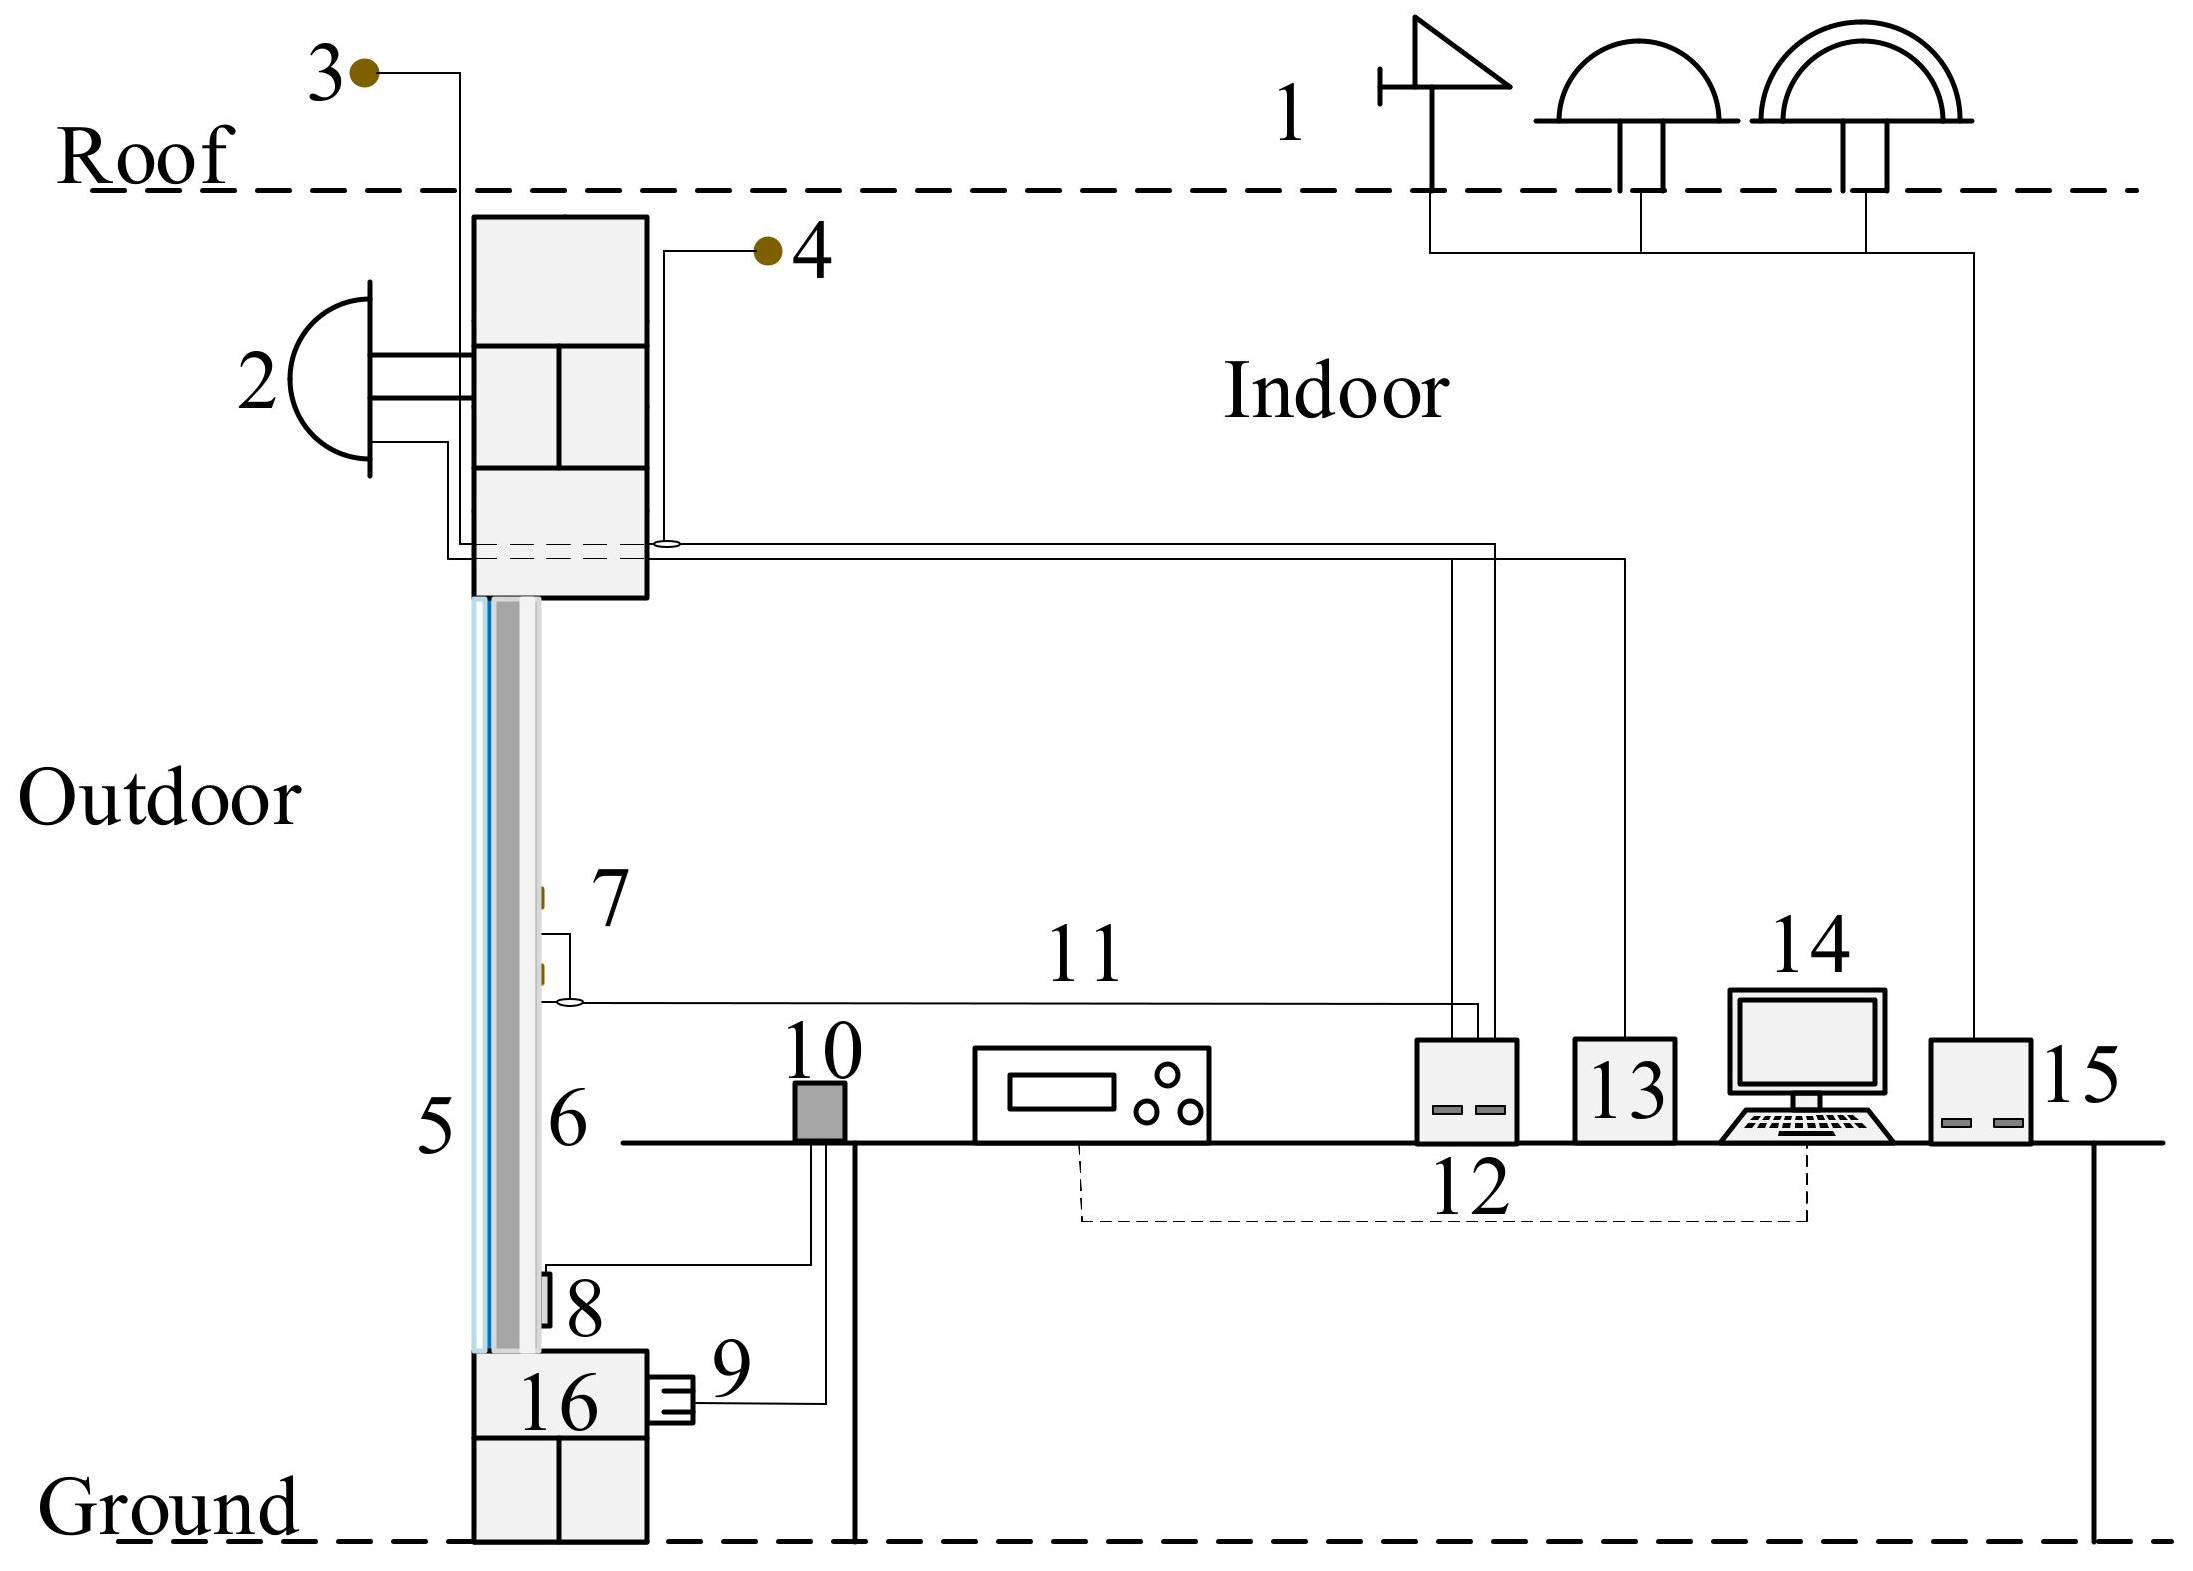
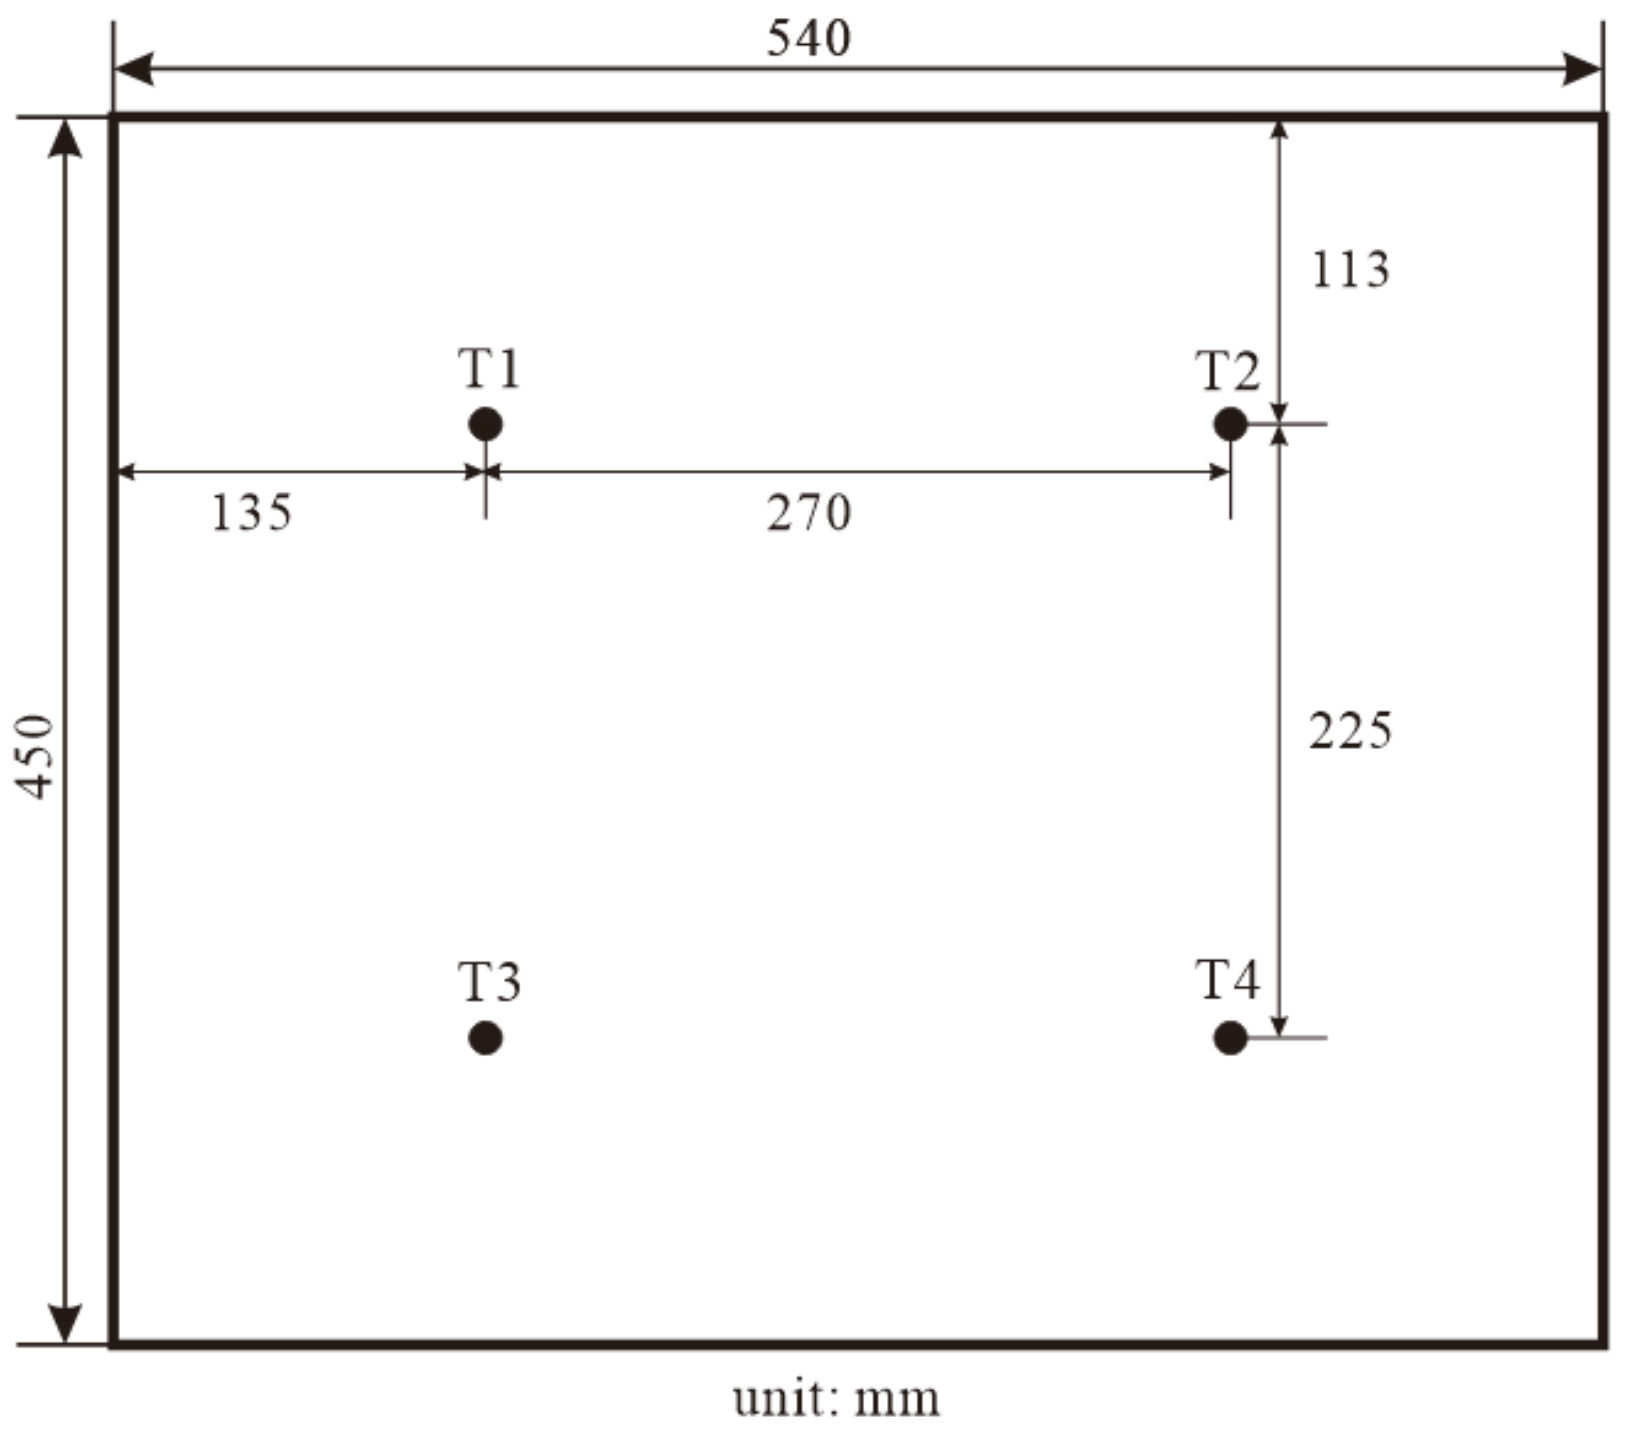
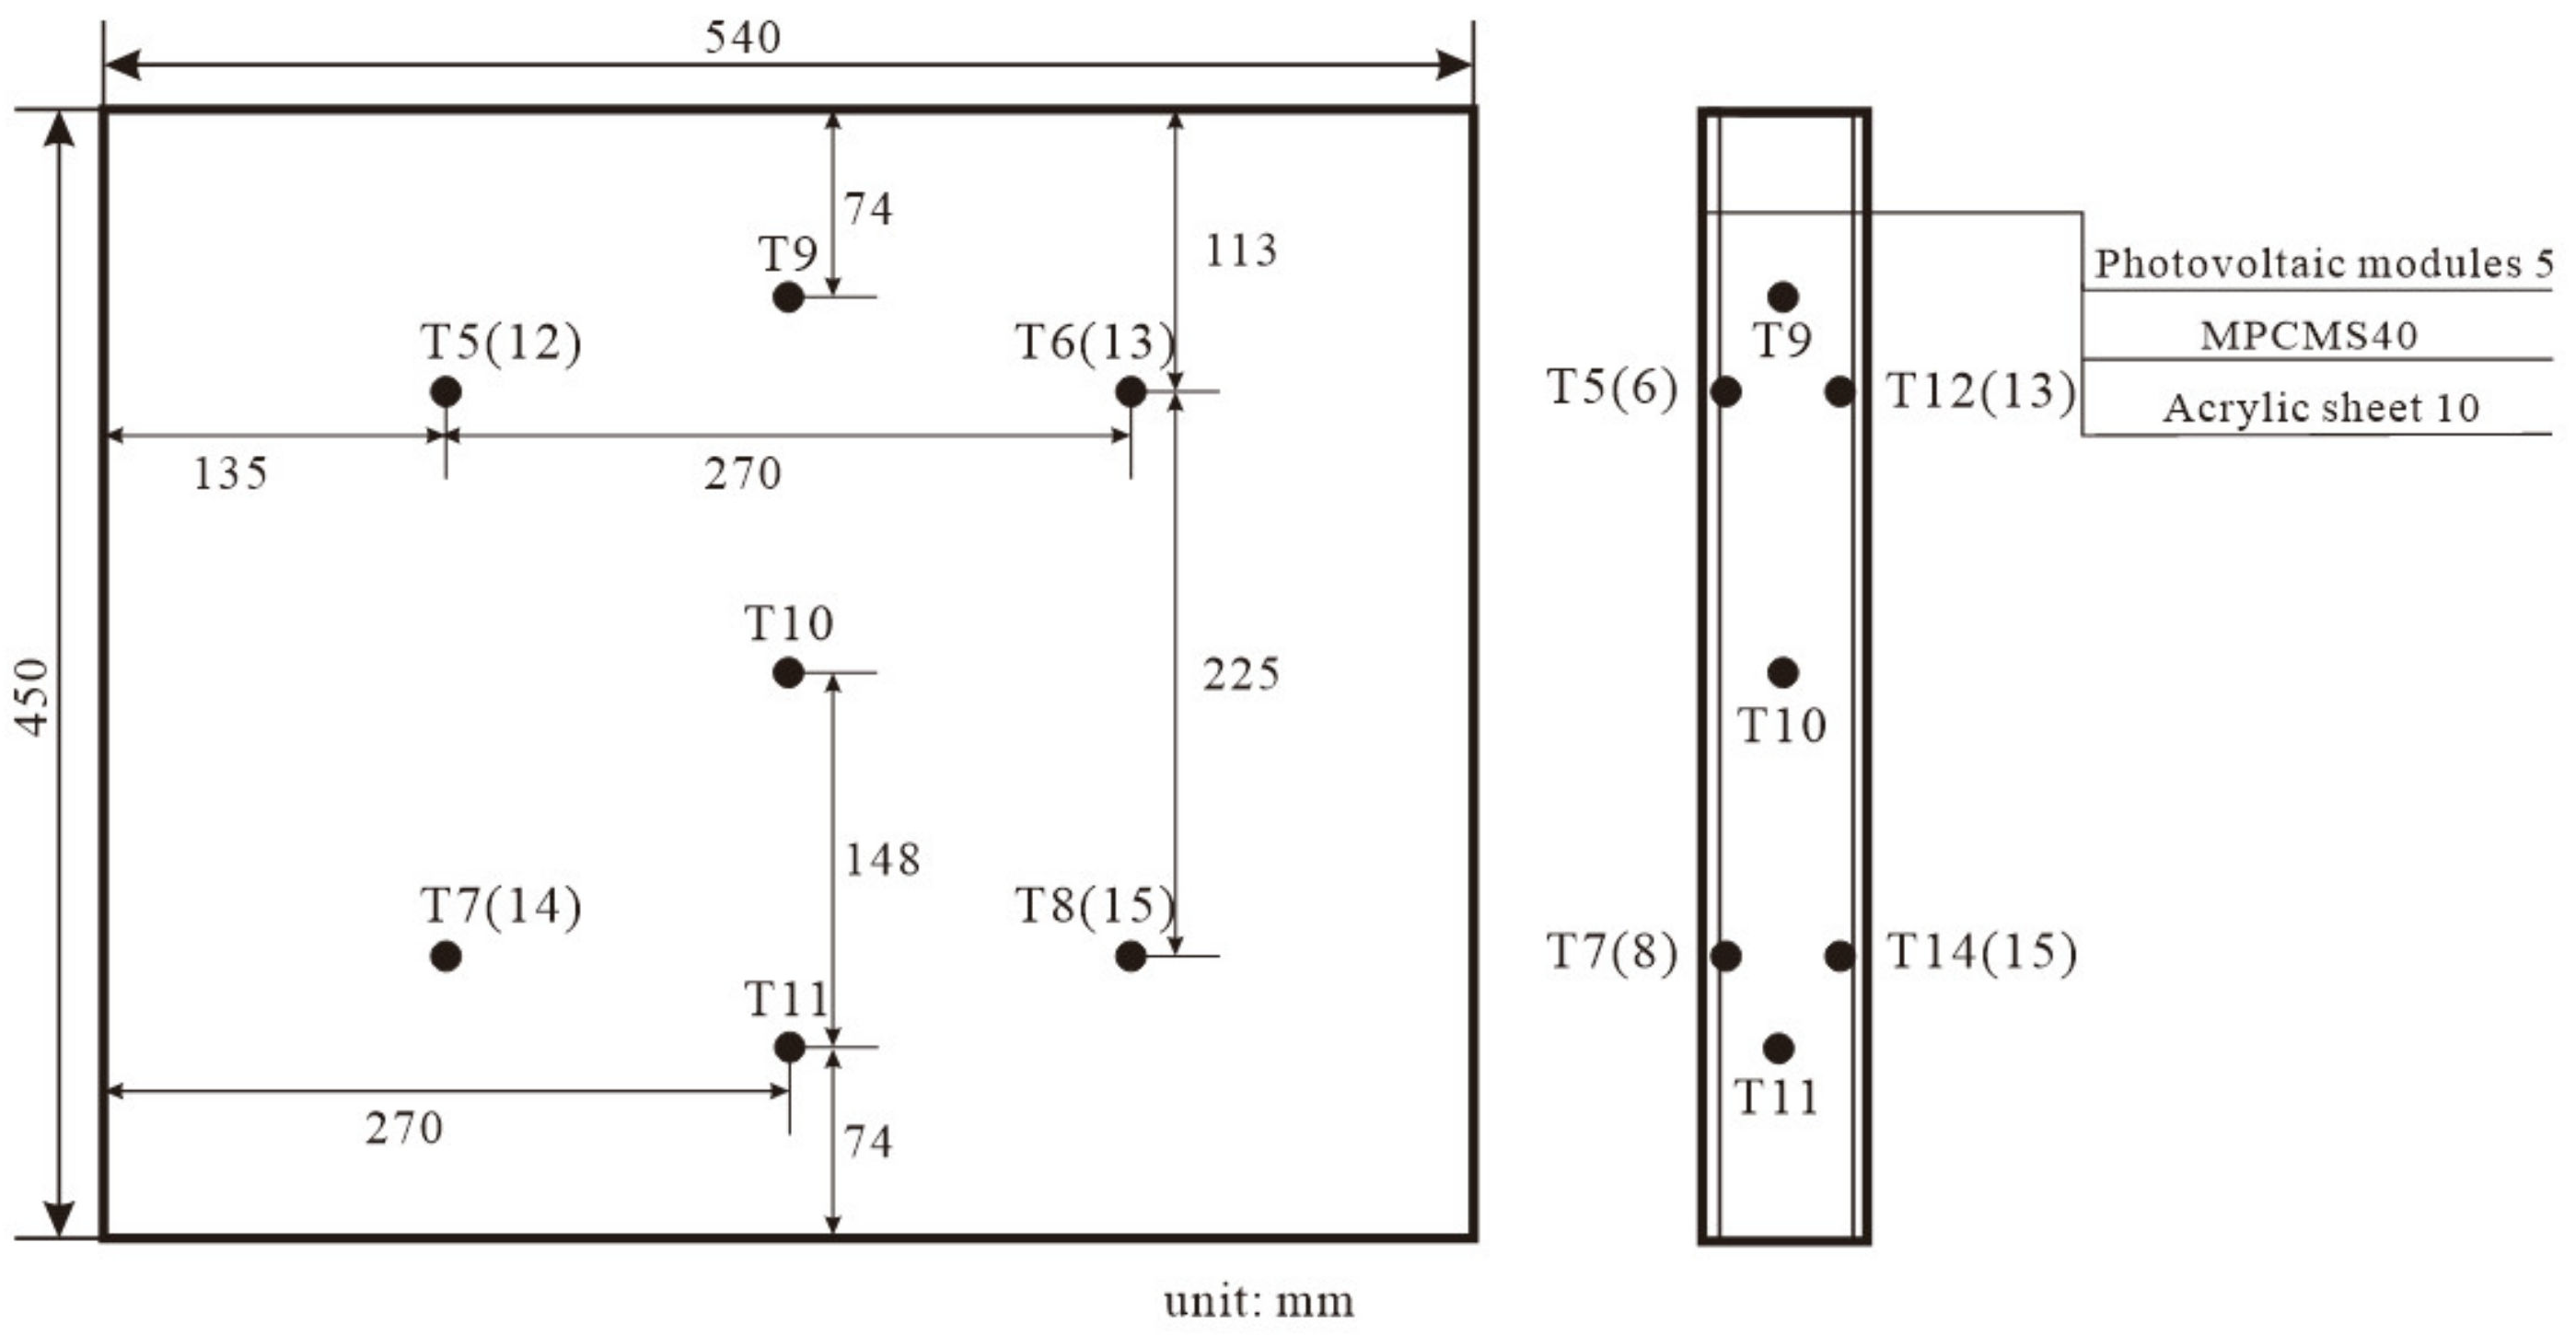
3.1. Experimental Bench Construction
- (1)
- Temperature acquisition system
- (2)
- Power acquisition system
3.2. Experimental Results and Analysis
4. Energy Consumption Simulation
5. Conclusions
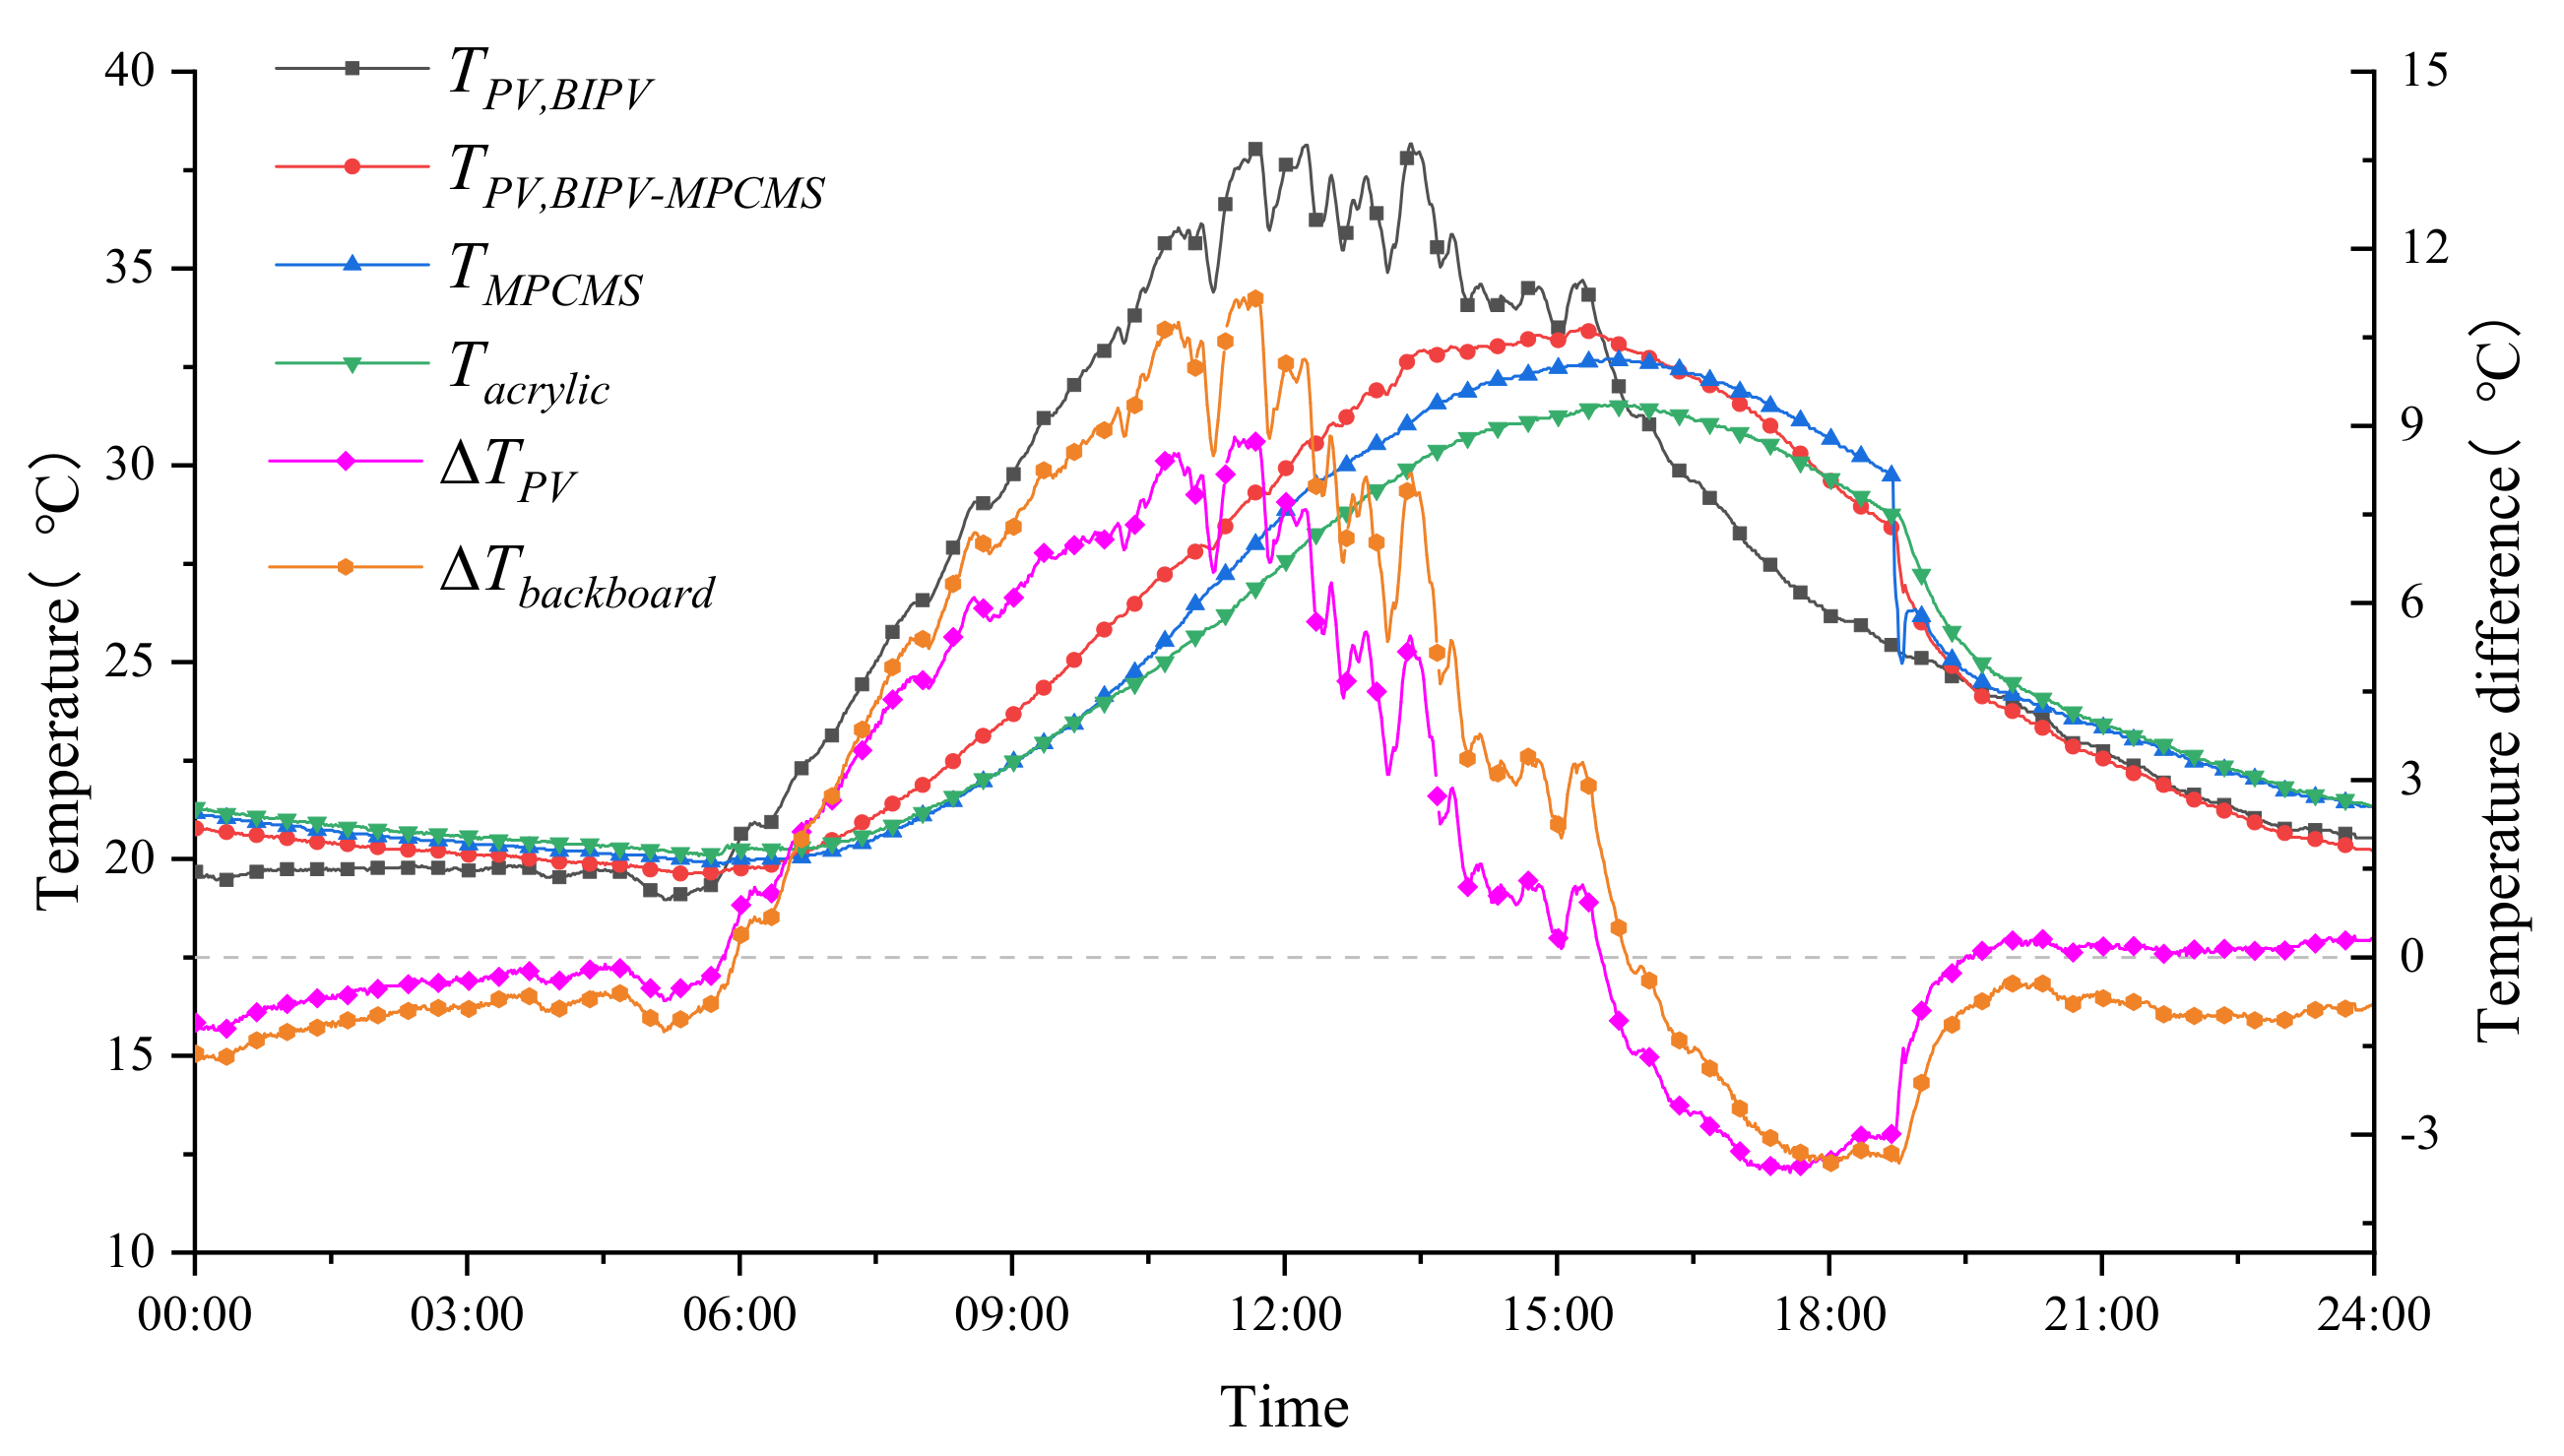
- (1)
- The presence of suspension causes the module temperature and backboard temperature of the BIPV-MPCMS system to be reduced compared with the BIPV system. The maximum is 8.8 °C, and the maximum temperature of the backboard can be reduced by 11.1 °C. The optimization time of the operating temperature of the photovoltaic module can reach 9.5 h, and the control of the backplane temperature can reach 9.75 h. The suspension can also delay the peak temperature of the system. Compared with the blank BIPV system, the peak operating temperature of the components in the BIPV-MPCMS system was delayed by 114 min, and the peak temperature of the backboard was delayed by 125 min, delaying the peak temperature from noon to afternoon.
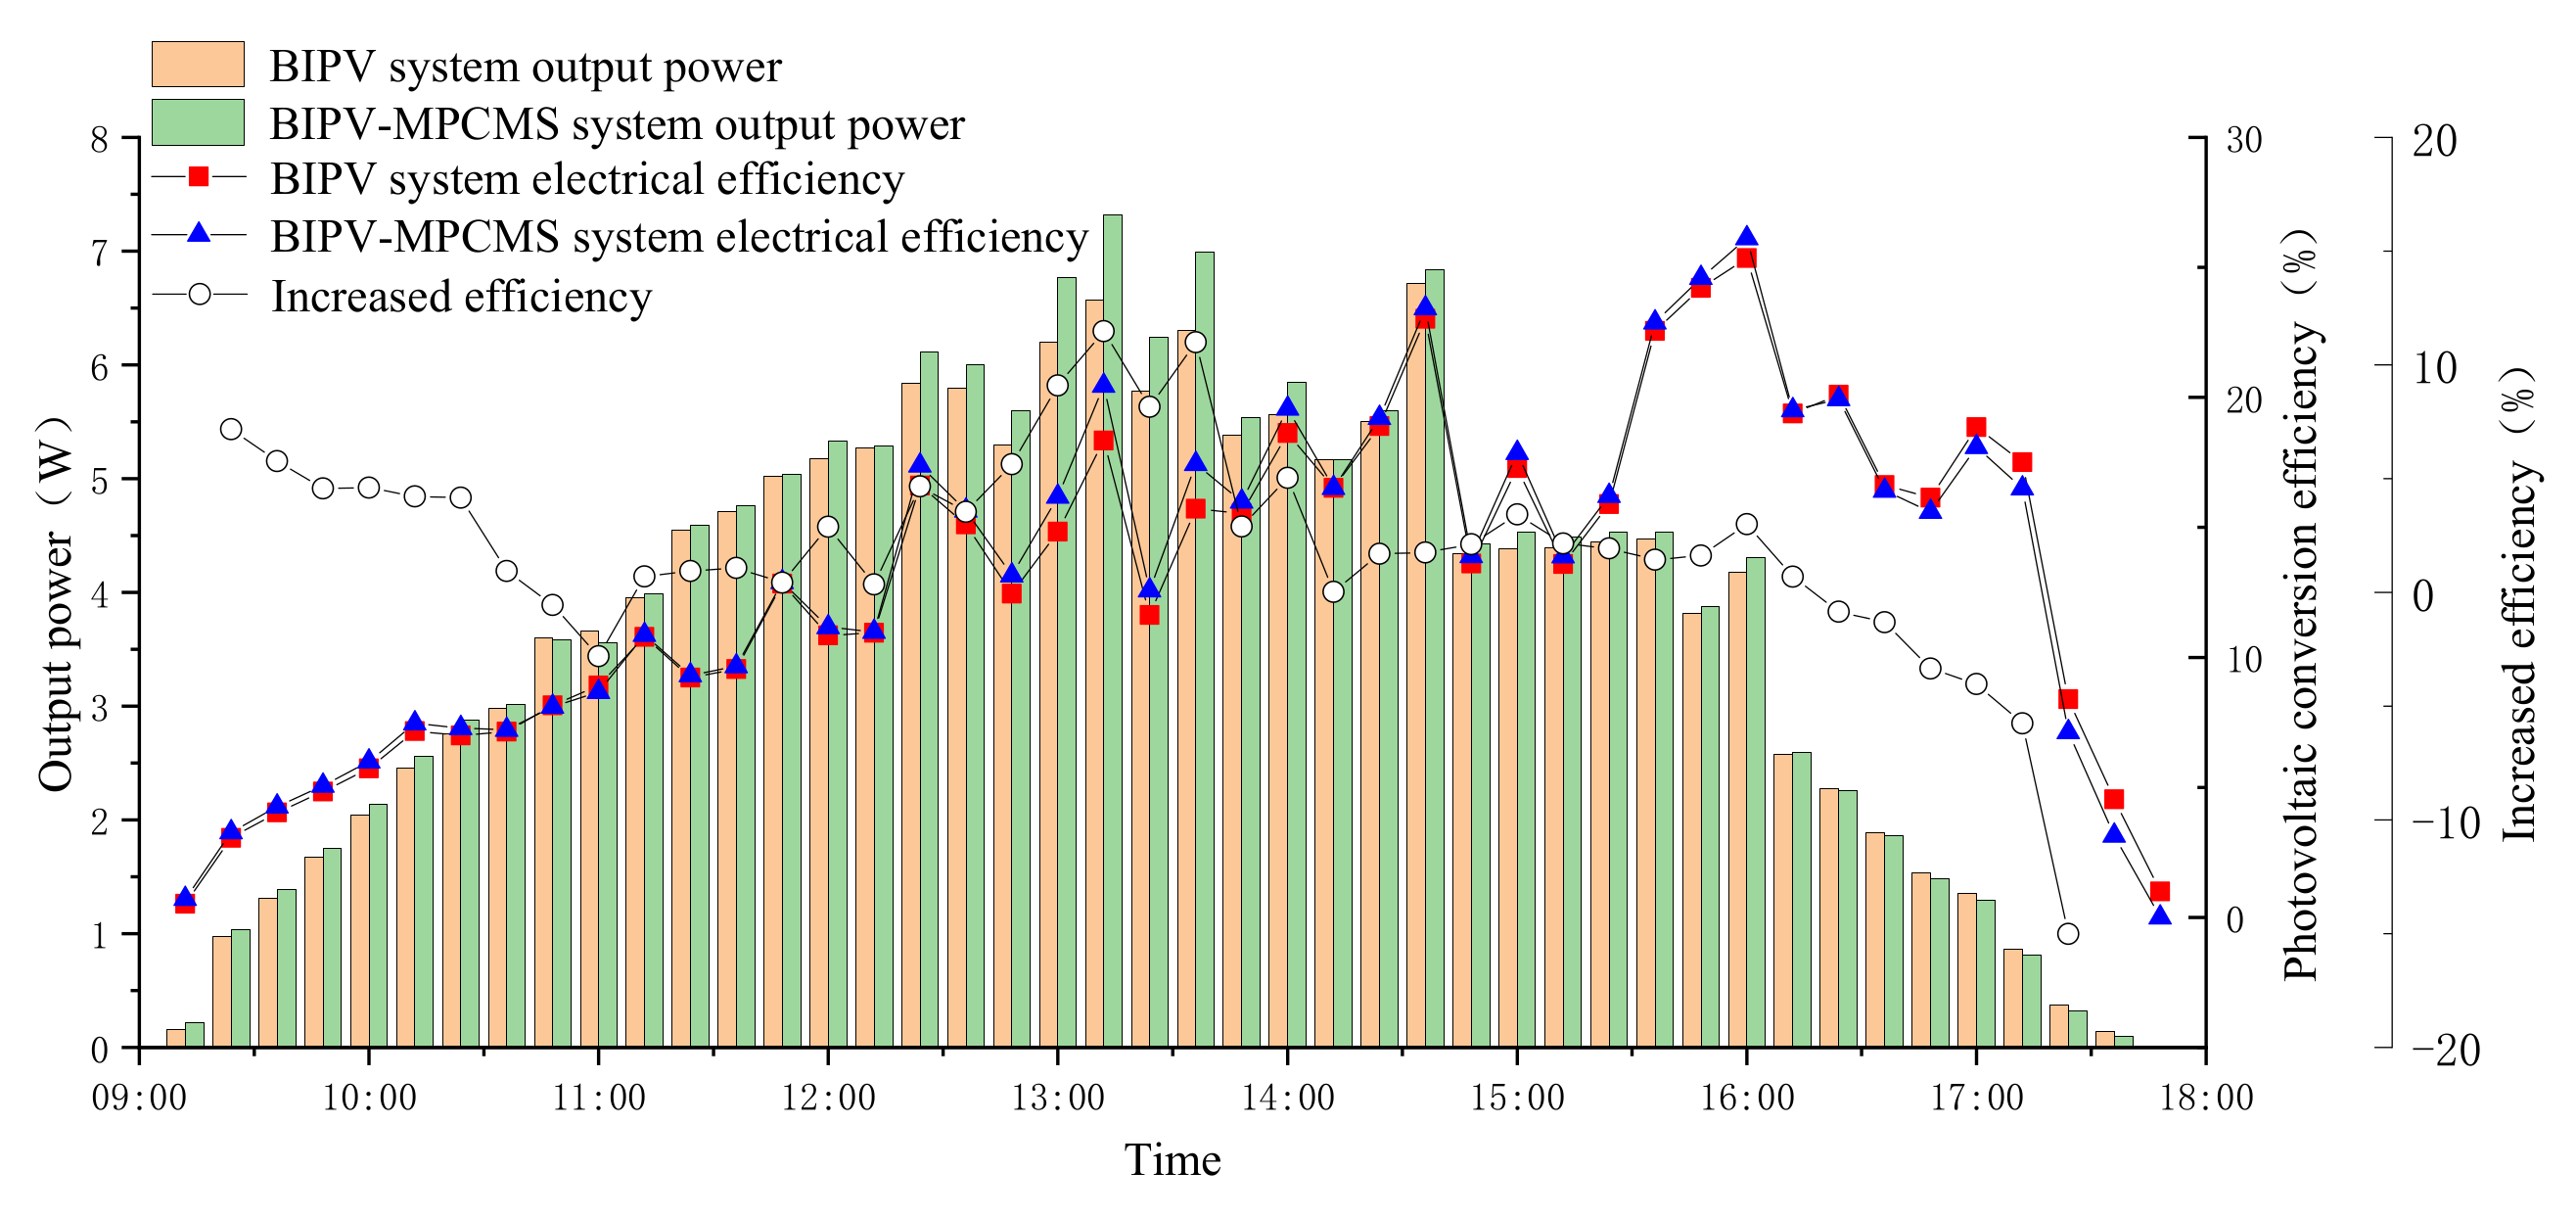
- (2)
- In addition to the thermal performance, MPCMS25 has a certain optimization effect on the power generation capacity of BIPV. The PCE of the BIPV system on that day ranged from 10.89% to 15.52%, while the efficiency of the BIPV-MPCMS system was between 9.8% to 15.81%. The solar irradiation intensity peaked at around 13:00, and the output power values of the two systems reached a maximum at 12:36. The maximum output power of the BIPV system was 6.92 W, with a PCE of 14.8%, and the maximum output power of the BIPV-MPCMS system was 7.23 W, with a PCE of 15.5%, an efficiency improvement of 4.8%. After 15:36, the power generation capacity of the BIPV-MPCMS system starts to be weaker than that of the BIPV system, but at this time, the solar irradiation intensity is smaller and the power generation capacity of PV modules is weaker, so the difference in output power is also relatively small.
- (3)
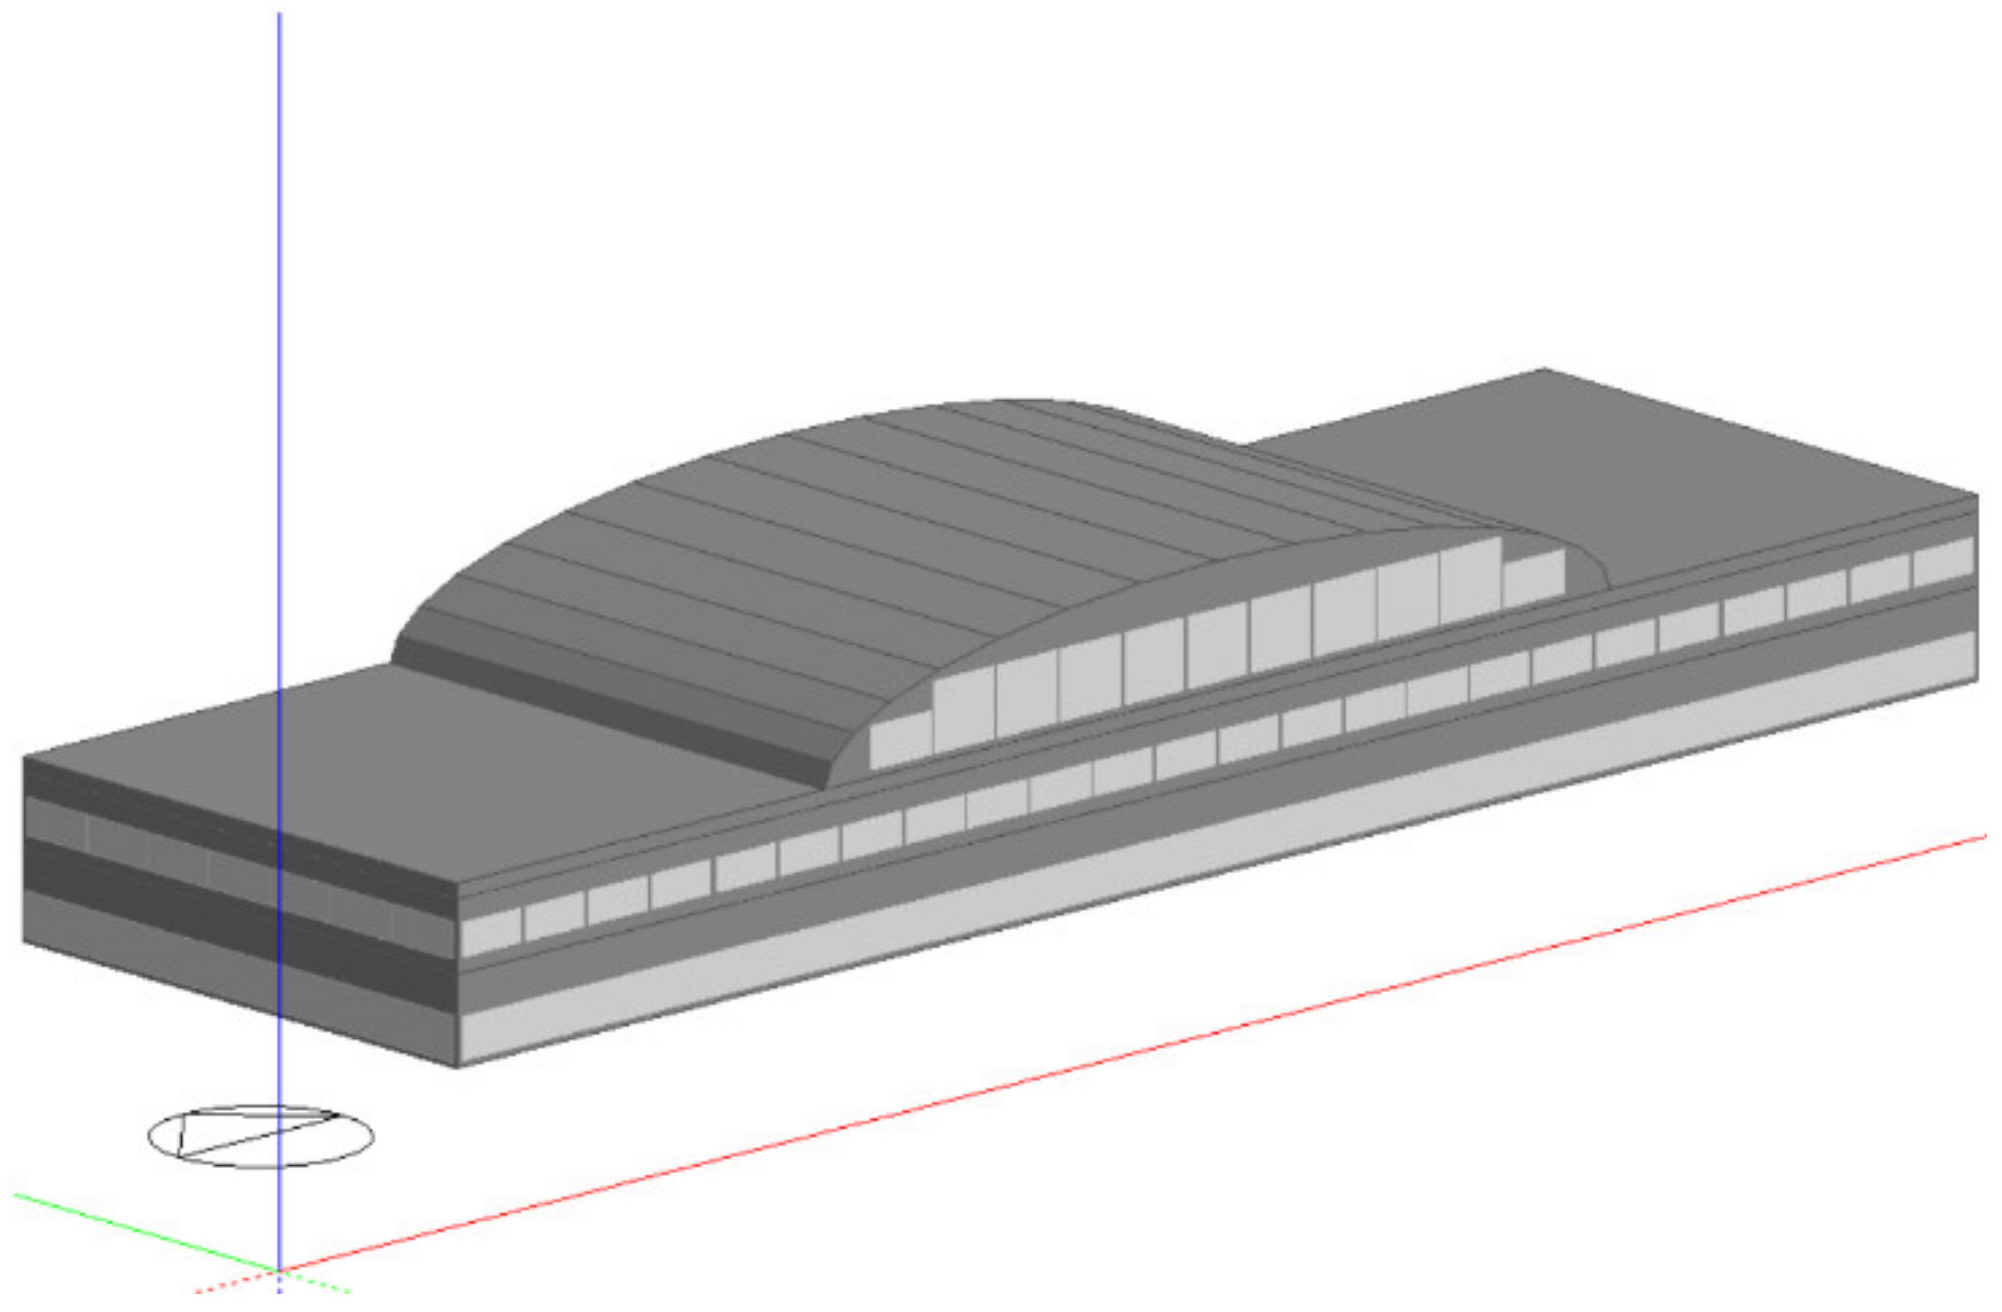
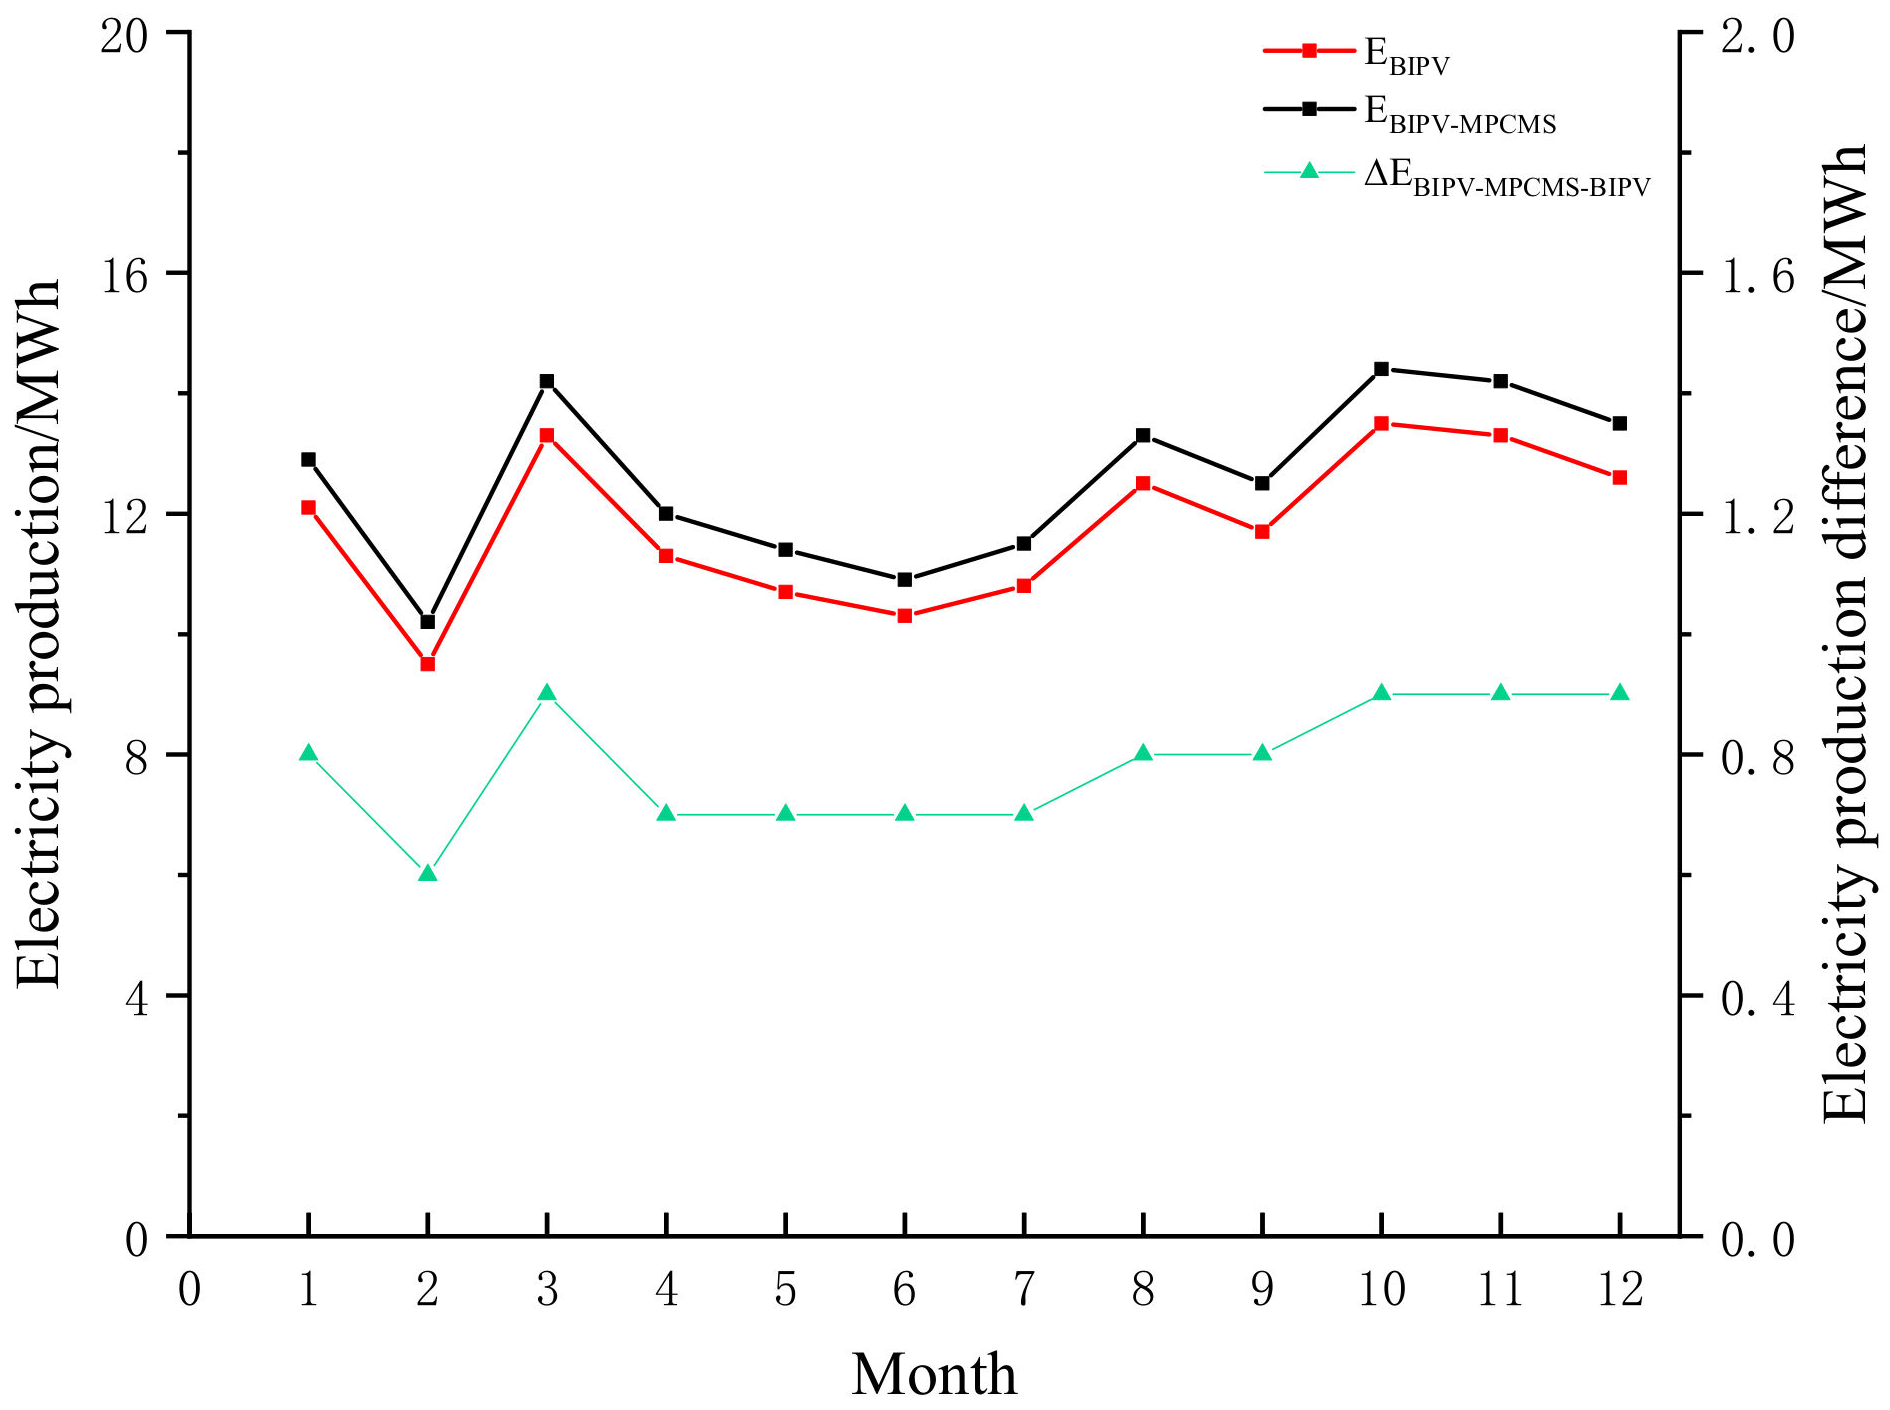
- Using the BIPV-MPCMS system as the outer envelope of some buildings can have an effective energy-saving effect. Compared with ordinary curtain walls, BIPV-MPCMS system curtain walls can reduce the annual cooling energy consumption of buildings by 12.1% and heating energy consumption by 7.8%. Considering that the BIPV-MPCMS system has higher PCE than the BIPV system, the annual power yield of buildings can be greatly improved. Buildings installed with BIPV-MPCMS system curtain walls can achieve a total energy saving rate of 8.5%.
Author Contributions
Funding
Informed Consent Statement
Conflicts of Interest
References
- Rahman, M.M.; Hasanuzzaman, M.; Rahim, N.A. Effects of various parameters on PV-module power and efficiency. Energy Convers. Manag. 2015, 103, 348–358. [Google Scholar] [CrossRef]
- Hasan, A.; McCormack, S.J.; Huang, M.J.; Norton, B. Evaluation of phase change materials for thermal regulation enhancement of building integrated photovoltaics. Sol. Energy 2010, 84, 1601–1612. [Google Scholar] [CrossRef]
- Radziemska, E.; Klugmann, E. Thermally affected parameters of the current–voltage characteristics of silicon photocell. Energy Convers. Manag. 2002, 43, 1889–1900. [Google Scholar] [CrossRef]
- Radziemska, E. The effect of temperature on the power drop in crystalline silicon solar cells. Renew. Energy 2003, 28, 1–12. [Google Scholar] [CrossRef]
- Martín-Chivelet, N.; Polo, J.; Sanz-Saiz, C.; Núñez Benítez, L.T.; Alonso-Abella, M.; Cuenca, J. Assessment of PV Module Temperature Models for Building-Integrated Photovoltaics (BIPV). Sustainability 2022, 14, 1500. [Google Scholar] [CrossRef]
- Teo, H.G.; Lee, P.S.; Hawlader, M.N.A. An active cooling system for photovoltaic modules. Appl. Energy 2012, 90, 309–315. [Google Scholar] [CrossRef]
- Schiro, F.; Benato, A.; Stoppato, A.; Destro, N. Improving photovoltaics efficiency by water cooling: Modelling and experimental approach. Energy 2017, 137, 798–810. [Google Scholar] [CrossRef]
- Bahaidarah, H.M.S.; Baloch, A.A.B.; Gandhidasan, P. Uniform cooling of photovoltaic panels: A review. Renew. Sustain. Energy Rev. 2016, 57, 1520–1544. [Google Scholar] [CrossRef]
- Peng, G.; Dou, G.; Hu, Y.; Sun, Y.; Chen, Z. Phase change material (PCM) microcapsules for thermal energy storage. Adv. Polym. Technol. 2020, 2020, 9490873. [Google Scholar] [CrossRef]
- Awad, M.M.; Ahmed, O.K.; Ali, O.M.; Alwan, N.T.; Yaqoob, S.J.; Nayyar, A.; Abouhawwash, M.; Alrasheedi, A.F. Photovoltaic Thermal Collectors Integrated with Phase Change Materials: A Comprehensive Analysis. Electronics 2022, 11, 337. [Google Scholar] [CrossRef]
- Huang, M.J.; Eames, P.C.; Norton, B. Phase change materials for limiting temperature rise in building integrated photovoltaics. Sol. Energy 2006, 80, 1121–1130. [Google Scholar] [CrossRef]
- Aelenei, L.; Pereira, R.; Gonçalves, H.; Athienitis, A. Thermal Performance of a Hybrid BIPV-PCM: Modeling, Design and Experimental Investigation. Energy Procedia 2014, 48, 474–483. [Google Scholar] [CrossRef]
- Huang, M.J.; Eames, P.C.; Norton, B. Thermal regulation of building-integrated photovoltaics using phase change materials. Int. J. Heat Mass Transf. 2004, 47, 2715–2733. [Google Scholar] [CrossRef]
- Huang, M.J.; Eames, P.C.; Hewitt, N.J. The application of a validated numerical model to predict the energy conservation potential of using phase change materials in the fabric of a building. Sol. Energy Mater. Sol. Cells 2006, 90, 1951–1960. [Google Scholar] [CrossRef]
- Kibria, M.A.; Saidur, R.; Al-Sulaiman, F.A.; Aziz, M.M.A. Development of a thermal model for a hybrid photovoltaic module and phase change materials storage integrated in buildings. Sol. Energy 2016, 124, 114–123. [Google Scholar] [CrossRef]
- Atkin, P.; Farid, M.M. Improving the efficiency of photovoltaic cells using PCM infused graphite and aluminium fins. Sol. Energy 2015, 114, 217–228. [Google Scholar] [CrossRef]
- Hasan, A.; McCormack, S.J.; Huang, M.J.; Norton, B. Characterization of phase change materials for thermal control of photovoltaics using Differential Scanning Calorimetry and Temperature History Method. Energy Convers. Manag. 2014, 81, 322–329. [Google Scholar] [CrossRef]
- Chen, Z.; Fang, G. Preparation and heat transfer characteristics of microencapsulated phase change material slurry: A review. Renew. Sustain. Energy Rev. 2011, 15, 4624–4632. [Google Scholar] [CrossRef]
- Huang, L.; Petermann, M.; Doetsch, C. Evaluation of paraffin/water emulsion as a phase change slurry for cooling applications. Energy 2009, 34, 1145–1155. [Google Scholar] [CrossRef]
- Zhao, C.Y.; Zhang, G.H. Review on microencapsulated phase change materials (MEPCMs): Fabrication, characterization and applications. Renew. Sustain. Energy Rev. 2011, 15, 3813–3832. [Google Scholar] [CrossRef]
- Zhang, P.; Ma, Z.W.; Wang, R.Z. An overview of phase change material slurries: MPCS and CHS. Renew. Sustain. Energy Rev. 2010, 14, 598–614. [Google Scholar] [CrossRef]


| Name | Specification |
|---|---|
| Material Type | TH-ME25 |
| Phase Change Temperature Range/°C | 25 |
| Thermal Conductivity/[W·(m2·K)−1] | 0.2 |
| True Density/(g·cm–3) | 1.1 |
| Latent Heat of Phase Change/(J·g−1) | 71.7 |
| Specific Heat Capacity/(J·g−1) | 5.514 |
| Core Material | Paraffin wax |
| Shell Material | Melamine resin |
| Material Cladding Ratio | >60% |
| Name | Specification |
|---|---|
| Size/mm | 540 × 450 × 18 |
| Daylighting area/m2 | 0.2 |
| Front cover glass | Highly transparent tempered glass |
| Peak power (Pmax)/W | 30 |
| Peak voltage (Vpm)/V | 18 |
| Peak current (Ipm)/A | 1.67 |
| Open-circuit voltage (Voc)/V | 21.6 |
| Short-circuit current (Isc)/A | 1.83 |
| PCE/% | 20 |
| temperature coefficients/(%·K−1) | −0.4 |
| Thermal Conductivity of Window/[W·(m2·K)−1] | Thermal Conductivity of Wall/[W·(m2·K)−1] | Personnel Density/ (people·m−2) | Power Density of Illuminance/ (W·m−2) | Power Density of Office Equipment/(W·m−2) |
|---|---|---|---|---|
| 1.98 | 0.55 | 0.18 | 30 | 30 |
Publisher’s Note: MDPI stays neutral with regard to jurisdictional claims in published maps and institutional affiliations. |
© 2022 by the authors. Licensee MDPI, Basel, Switzerland. This article is an open access article distributed under the terms and conditions of the Creative Commons Attribution (CC BY) license (https://creativecommons.org/licenses/by/4.0/).
Share and Cite
Zheng, Y.; Li, X.; Zhang, W.; Wang, K.; Han, F.; Li, X.; Zhao, Y. Experimental Study of Phase Change Microcapsule Suspensions Applied in BIPV Construction. Sustainability 2022, 14, 10819. https://doi.org/10.3390/su141710819
Zheng Y, Li X, Zhang W, Wang K, Han F, Li X, Zhao Y. Experimental Study of Phase Change Microcapsule Suspensions Applied in BIPV Construction. Sustainability. 2022; 14(17):10819. https://doi.org/10.3390/su141710819
Chicago/Turabian StyleZheng, Yu, Xiaoming Li, Wenjie Zhang, Kuan Wang, Feng Han, Xiaoge Li, and Yuqiang Zhao. 2022. "Experimental Study of Phase Change Microcapsule Suspensions Applied in BIPV Construction" Sustainability 14, no. 17: 10819. https://doi.org/10.3390/su141710819
APA StyleZheng, Y., Li, X., Zhang, W., Wang, K., Han, F., Li, X., & Zhao, Y. (2022). Experimental Study of Phase Change Microcapsule Suspensions Applied in BIPV Construction. Sustainability, 14(17), 10819. https://doi.org/10.3390/su141710819