Strategies to Reduce Ride-Hailing Fuel Consumption Caused by Pick-Up Trips: A Mathematical Model under Uncertainty


Abstract
:1. Introduction
2. Fuzzy Approach for Handling Uncertainty Parameters
3. Mathematical Modeling
3.1. Assignment Model
3.1.1. Parameters
3.1.2. Variables
3.1.3. Objectives
3.1.4. Constraints
3.2. Assignment Model with Fuzzy Travel Delay
4. Numerical Simulation
4.1. Case Study
4.2. Numerical Simulation Results
5. Discussion
6. Conclusions
Author Contributions
Funding
Institutional Review Board Statement
Informed Consent Statement
Data Availability Statement
Acknowledgments
Conflicts of Interest
References
- Sun, S.; Ertz, M. Environmental impact of mutualized mobility: Evidence from a life cycle perspective. Sci. Total Environ. 2021, 772, 145014. [Google Scholar] [CrossRef] [PubMed]
- Scott, V.; Geden, O. The challenge of carbon dioxide removal for EU policy-making. Nat. Energy 2018, 3, 350–352. [Google Scholar] [CrossRef]
- Alfasi, B.; Khan, A. Enhancing sustainability in highway infrastructure: Risk analysis modles. In Proceedings of the Annual Conference—Canadian Society for Civil Engineering, Montreal, QC, Canada, 12–15 June 2019. [Google Scholar]
- Jabareen, Y.R. Sustainable urban forms: Their typologies, models, and concepts. J. Plan. Educ. Res. 2006, 26, 38–52. [Google Scholar] [CrossRef]
- Magdolen, M.; von Behren, S.; Burger, L.; Chlond, B. Mobility Styles and Car Ownership—Potentials for a Sustainable Urban Transport. Sustainability 2021, 13, 2968. [Google Scholar] [CrossRef]
- Chapman, L. Transport and climate change: A review. J. Transp. Geogr. 2007, 15, 354–367. [Google Scholar] [CrossRef]
- Yan, C.; Zhu, H.; Korolko, N.; Woodard, D. Dynamic pricing and matching in ride-hailing platforms. Nav. Res. Logist. 2019, 67, 705–724. [Google Scholar] [CrossRef]
- Yang, R.; Lai, M. Multi-level analyses on the nearest-first matching policy of on-demand chauffeured ride-hailing service. Int. J. Sustain. Transp. 2020, 15, 749–767. [Google Scholar] [CrossRef]
- Yu, H.; Shu, J.; Jia, X.; Zhang, H.; Yu, X. LpRide: Lightweight and Privacy-Preserving Ride Matching over Road Networks in Online Ride Hailing Systems. IEEE Trans. Veh. Technol. 2019, 68, 10418–10428. [Google Scholar] [CrossRef]
- Cramer, J.; Krueger, A.B. Disruptive change in the taxi business: The case of uber. Am. Econ. Rev. 2016, 106, 177–182. [Google Scholar] [CrossRef]
- Yu, H.; Jia, X.; Zhang, H.; Shu, J. Efficient and Privacy-Preserving Ride Matching Using Exact Road Distance in Online Ride Hailing Services. IEEE Trans. Serv. Comput. 2020, 15, 1841–1854. [Google Scholar] [CrossRef]
- Yang, H.; Qin, X.; Ke, J.; Ye, J. Optimizing matching time interval and matching radius in on-demand ride-sourcing markets. Transp. Res. Part B Methodol. 2020, 131, 84–105. [Google Scholar] [CrossRef]
- Qin, X.; Yang, H.; Wu, Y.; Zhu, H. Multi-party ride-matching problem in the ride-hailing market with bundled option services. Transp. Res. Part C Emerg. Technol. 2021, 131, 103287. [Google Scholar] [CrossRef]
- Henao, A.; Marshall, W.E. The impact of ride-hailing on vehicle miles traveled. Transportation 2019, 46, 2173–2194. [Google Scholar] [CrossRef]
- Luo, Y.; Jia, X.; Fu, S.; Xu, M. PRide: Privacy-Preserving Ride Matching over Road Networks for Online Ride-Hailing Service. IEEE Trans. Inf. Forensics Secur. 2019, 14, 1791–1802. [Google Scholar] [CrossRef]
- Do, M.; Byun, W.; Shin, D.K.; Jin, H. Factors Influencing Matching of Ride-Hailing Service Using Machine Learning Method. Sustainability 2019, 11, 5615. [Google Scholar] [CrossRef]
- Xu, Y.; Wang, W.; Xiong, G.; Liu, X.; Wu, W.; Liu, K. Network-Flow-Based Efficient Vehicle Dispatch for City-Scale Ride-Hailing Systems. IEEE Trans. Intell. Transp. Syst. 2021, 23, 5526–5538. [Google Scholar] [CrossRef]
- Sunitiyoso, Y.; Rahayu, W.A.; Nuraeni, S.; Nurdayat, I.F.; Pambudi, N.F.; Hadiansyah, F. Role of ride-hailing in multimodal commuting. Case Stud. Transp. Policy 2022, 10, 1283–1298. [Google Scholar] [CrossRef]
- Sui, Y.; Zhang, H.; Song, X.; Shao, F.; Yu, X.; Shibasaki, R.; Sun, R.; Yuan, M.; Wang, C.; Li, S.; et al. GPS data in urban online ride-hailing: A comparative analysis on fuel consumption and emissions. J. Clean. Prod. 2019, 227, 495–505. [Google Scholar] [CrossRef]
- Wenzel, T.; Rames, C.; Kontou, E.; Henao, A. Travel and energy implications of ridesourcing service in Austin, Texas. Transp. Res. Part D Transp. Environ. 2019, 70, 18–34. [Google Scholar] [CrossRef]
- Jin, J.; Zhou, M.; Zhang, W.; Li, M.; Guo, Z.; Qin, Z.; Jiao, Y.; Tang, X.; Wang, C.; Wang, J.; et al. CoRide: Joint Order Dispatching and Fleet Management for Multi-Scale Ride-Hailing Platforms. In Proceedings of the 28th ACM International Conference on Information and Knowledge Management, Beijing, China, 3–7 November 2019. [Google Scholar]
- Housni, O.E.; Goyal, V.; Hanguir, O.; Stein, C. Matching drivers to riders: A two-stage robust approach. Leibniz Int. Proc. Inform. LIPIcs 2021, 207, 12:1–12:22. [Google Scholar] [CrossRef]
- Qin, G.; Luo, Q.; Yin, Y.; Sun, J.; Ye, J. Optimizing matching time intervals for ride-hailing services using reinforcement learning. Transp. Res. Part C Emerg. Technol. 2011, 129, 103239. [Google Scholar] [CrossRef]
- Guo, X.; Caros, N.S.; Zhao, J. Robust matching-integrated vehicle rebalancing in ride-hailing system with uncertain demand. Transp. Res. Part B Methodol. 2021, 150, 161–189. [Google Scholar] [CrossRef]
- Castillo, J.C.; Knoepfle, D.; Weyl, G. Surge Pricing Solves the Wild Goose Chase. In Proceedings of the 2017 ACM Conference on Economics and Computation, Cambridge, MA, USA, 26–30 June 2017; pp. 241–242. [Google Scholar] [CrossRef]
- Zha, L.; Yin, Y.; Xu, Z. Geometric matching and spatial pricing in ride-sourcing markets. Transp. Res. Part C Emerg. Technol. 2018, 92, 58–75. [Google Scholar] [CrossRef]
- Uber. Uber Marketplace Matching. 2020. Available online: https://www.uber.com/us/en/marketplace/matching/ (accessed on 31 May 2021).
- Feng, Y.; Niazadeh, R.; Saberi, A. Two-stage Matching and Pricing with Applications to Ride Hailing. SSRN Electron. J. 2020, 20–28. [Google Scholar] [CrossRef]
- Brown, T. Matchmaking in Lyft Line—Part 1. In Lyft Engineering. 2016. Available online: https://eng.lyft.com/matchmaking-in-lyft-line-9c2635fe62c4 (accessed on 31 May 2021).
- Tafreshian, A.; Masoud, N.; Yin, Y. Frontiers in service science: Ride matching for peer-to-peer ride sharing: A review and future directions. Serv. Sci. 2020, 12, 40–60. [Google Scholar] [CrossRef]
- Li, Y.; Liu, Y. Optimizing flexible one-to-two matching in ride-hailing systems with boundedly rational users. Transp. Res. Part E Logist. Transp. Rev. 2021, 150, 102329. [Google Scholar] [CrossRef]
- Alonso-Mora, J.; Samaranayake, S.; Wallar, A.; Frazzoli, E.; Rus, D. On-demand high-capacity ride-sharing via dynamic trip-vehicle assignment. Proc. Natl. Acad. Sci. USA 2017, 114, 462–467. [Google Scholar] [CrossRef] [PubMed]
- Lv, J.; Zhou, N.; Yao, S. Big Data-Driven Stable Task Allocation in Ride-Hailing Services; Springer: Berlin/Heidelberg, Germany, 2022; Volume 13248. [Google Scholar]
- Jiao, Y.; Tang, X.; Qin, Z.; Li, S.; Zhang, F.; Zhu, H.; Ye, J. Real-world ride-hailing vehicle repositioning using deep reinforcement learning. Transp. Res. Part C Emerg. Technol. 2021, 130, 103289. [Google Scholar] [CrossRef]
- Agatz, N.A.H.; Erera, A.L.; Savelsbergh, M.W.P.; Wang, X. Dynamic ride-sharing: A simulation study in metro Atlanta. Transp. Res. Part B Methodol. 2011, 45, 1450–1464. [Google Scholar] [CrossRef]
- Chen, X.M.; Zheng, H.; Ke, J.; Yang, H. Dynamic optimization strategies for on-demand ride services platform: Surge pricing, commission rate, and incentives. Transp. Res. Part B Methodol. 2020, 138, 23–45. [Google Scholar] [CrossRef]
- Bertsimas, D.; Jaillet, P.; Martin, S. Online Vehicle Routing: The Edge of Optimization in Large-Scale Applications. Oper. Res. 2019, 67, 143–162. [Google Scholar] [CrossRef]
- Dickerson, J.P.; Srinivasan, A.; Sankararaman, K.A.; Xu, P. Allocation problems in ride-sharing platforms: Online matching with offline reusable resources. In Proceedings of the 32nd AAAI Conference on Artificial Intelligence, AAAI 2018, New Orleans, LA, USA, 2–7 February 2018; pp. 1007–1014. [Google Scholar]
- Chanas, S.; Kuchta, D. Fuzzy integer transportation problem. Fuzzy Sets Syst. 1998, 98, 291–298. [Google Scholar] [CrossRef]
- Heilpern, S. The expected value of a fuzzy number. Fuzzy Sets Syst. 1992, 47, 81–86. [Google Scholar] [CrossRef]
- Jiménez, M.; Arenas, M.; Bilbao, A.; Rodríguez, M.V. Linear programming with fuzzy parameters: An interactive method resolution. Eur. J. Oper. Res. 2007, 177, 1599–1609. [Google Scholar] [CrossRef]
- Jiménez, M. Ranking fuzzy numbers through the comparison of its expected intervals. Int. J. Uncertain. Fuzziness Knowlege-Based Syst. 1996, 4, 379–388. [Google Scholar] [CrossRef]
- Zimmermann, H.-J. Fuzzy programming and linear programming with several objective functions. Fuzzy Sets Syst. 1978, 1, 45–55. [Google Scholar] [CrossRef]
- Bojadziev, G.; Bojadziev, M.; Zadeh, L.A. Decision-Making in a Fuzzy Environment. Manag. Sci. 1970, 17, B141–B164. [Google Scholar] [CrossRef]
- Ghanbari, R.; Ghorbani-Moghadam, K.; Mahdavi-Amiri, N.; de Baets, B. Fuzzy linear programming problems: Models and solutions. Soft Comput. 2020, 24, 10043–10073. [Google Scholar] [CrossRef]
- Chanas, S.; Kołodziejczyk, W.; Machaj, A. A fuzzy approach to the transportation problem. Fuzzy Sets Syst. 1984, 13, 211–221. [Google Scholar] [CrossRef]
- Donovan, B.; Work, D. New York City Taxi Trip Data (2010–2013); University of Illinois at Urbana-Champaign: Champaign, IL, USA, 2016. [Google Scholar] [CrossRef]
- Boeing, G. OSMnx: New methods for acquiring, constructing, analyzing, and visualizing complex street networks. Comput. Environ. Urban Syst. 2017, 65, 126–139. [Google Scholar] [CrossRef]
- Wang, H.; Yang, H. Ridesourcing systems: A framework and review. Transp. Res. Part B Methodol. 2019, 129, 122–155. [Google Scholar] [CrossRef]
- Wallar, A.; Van Der Zee, M.; Alonso-Mora, J.; Rus, D. Vehicle Rebalancing for Mobility-on-Demand Systems with Ride-Sharing. In Proceedings of the 2018 IEEE/RSJ International Conference on Intelligent Robots and Systems (IROS), Madrid, Spain, 1–5 October 2018; pp. 4539–4546. [Google Scholar] [CrossRef] [Green Version]


| Descriptions | Crisp Parameter | General Fuzzy Parameter | Trapezoidal Fuzzy Parameter |
|---|---|---|---|
| Objectives | (25), (26) | (25), (39) | (25), (39) |
| Constraints | (27), (28), (29), (30), (31), (32) | (27), (28), (29), (31), (32), (34), (37) | (27), (28), (29), (31), (32), (44), (45) |
| Decision Variables | (24) | (24), (38) | (24), (38) |
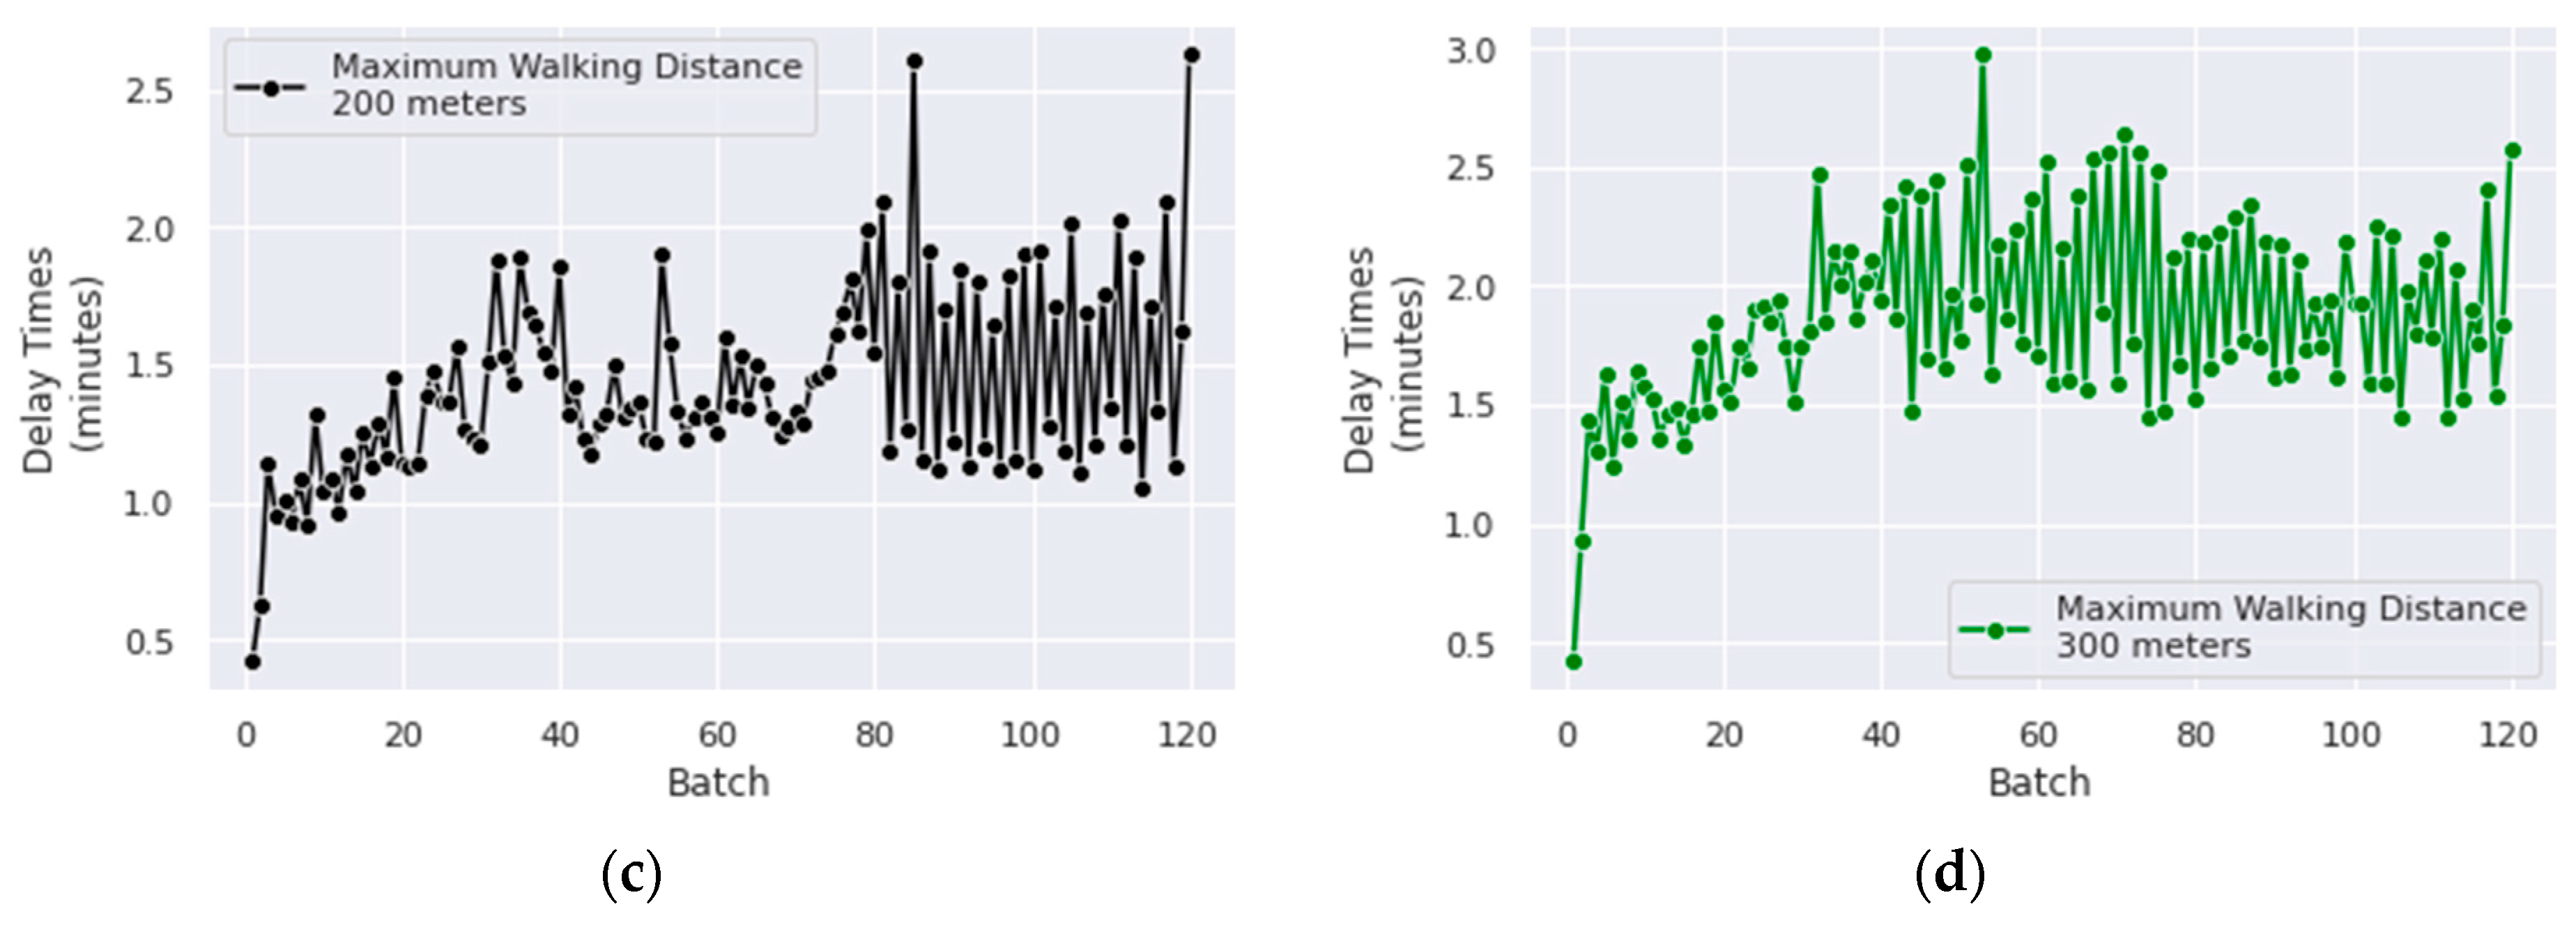
| Walk Readiness | Serviced Requests (%) | Average of The Pessimistic Travel Delay (min) | Average of The Most Possible Travel Delay (min) | Average of The Optimistic Travel Delay (min) |
|---|---|---|---|---|
| Not at all | 94.36% | 1.723712 | 1.101740 | 0.564525 |
| 100 m | 94.46% | 1.751536 | 1.165116 | 0.658548 |
| 200 m | 93.86% | 1.973035 | 1.394026 | 0.893963 |
| 300 m | 92.04% | 2.397733 | 1.838633 | 1.355686 |
Publisher’s Note: MDPI stays neutral with regard to jurisdictional claims in published maps and institutional affiliations. |
© 2022 by the authors. Licensee MDPI, Basel, Switzerland. This article is an open access article distributed under the terms and conditions of the Creative Commons Attribution (CC BY) license (https://creativecommons.org/licenses/by/4.0/).
Share and Cite
Megantara, T.R.; Supian, S.; Chaerani, D. Strategies to Reduce Ride-Hailing Fuel Consumption Caused by Pick-Up Trips: A Mathematical Model under Uncertainty. Sustainability 2022, 14, 10648. https://doi.org/10.3390/su141710648
Megantara TR, Supian S, Chaerani D. Strategies to Reduce Ride-Hailing Fuel Consumption Caused by Pick-Up Trips: A Mathematical Model under Uncertainty. Sustainability. 2022; 14(17):10648. https://doi.org/10.3390/su141710648
Chicago/Turabian StyleMegantara, Tubagus Robbi, Sudradjat Supian, and Diah Chaerani. 2022. "Strategies to Reduce Ride-Hailing Fuel Consumption Caused by Pick-Up Trips: A Mathematical Model under Uncertainty" Sustainability 14, no. 17: 10648. https://doi.org/10.3390/su141710648
APA StyleMegantara, T. R., Supian, S., & Chaerani, D. (2022). Strategies to Reduce Ride-Hailing Fuel Consumption Caused by Pick-Up Trips: A Mathematical Model under Uncertainty. Sustainability, 14(17), 10648. https://doi.org/10.3390/su141710648