Article

An Integrated Fuzzy-Based Sustainability Framework for Post-Secondary Educational Buildings: A User-Perspective Approach

by
Ghasan Alfalah
1,
Abobakr Al-Sakkaf
2,3,*,
Eslam Mohammed Abdelkader
4 and
Tarek Zayed
5
1
Department of Architecture and Building Science, College of Architecture and Planning, King Saud University, Riyadh 145111, Saudi Arabia
2
Department of Building, Civil and Environmental Engineering, Concordia University, Montréal, QC H3G 1M8, Canada
3
Department of Architecture & Environmental Planning, College of Engineering & Petroleum, Hadhramout University, Mukalla 50512, Yemen
4
Structural Engineering Department, Faculty of Engineering, Cairo University, Giza 12613, Egypt
5
Department of Building and Real Estate (BRE), Faculty of Construction and Environment (FCE), The Hong Kong Polytechnic University, ZN716 Block Z Phase 8 Hung Hom, Kowloon 999077, Hong Kong
*
Author to whom correspondence should be addressed.
Sustainability 2022, 14(16), 9955; https://doi.org/10.3390/su14169955
Submission received: 30 June 2022 / Revised: 1 August 2022 / Accepted: 9 August 2022 / Published: 11 August 2022
(This article belongs to the Special Issue Sustainable Development of Construction Engineering)

Abstract

:
Decreasing the impact of educational buildings on the environment is a primary concern of the sustainable building movement. However, limited research has centered on improving educational building sustainability from users’ perspectives. This study aims to determine an overall user perspective satisfaction scale (OUPS) for post-secondary educational buildings, determine the factors and sub-factors that affect users’ perspectives, and create a building sustainability platform for evaluating user satisfaction. The main goal of the developed model is to offer facility managers the current users’ perspectives on post-secondary educational buildings to improve sustainability from users’ perspectives. The results revealed a significant influence of thermal comfort (40%) and aesthetics (22%) on users’ perspectives. The developed model was validated by experts working in the facility management field and they acknowledged it as having good potential. This work first utilized the Fuzzy Analytic Network Process (FANP) modelling technique to determine weights for each factor and sub-factor and then employed the fuzzy expert system to develop an OUPS. Questionnaire responses and interviews with facility managers and users were used to develop these models for a case study of the M.B. building at Concordia University in Montreal, Quebec.

1. Introduction

Engineers, architects, and facility managers are becoming increasingly concerned with sustainability, especially since the United States Green Building Council [1] reported that buildings account for 40% of the energy consumption, 72% of the electricity consumption, 39% of the carbon footprint, and 13% of the water consumption in the United States. In addition, sustainability issues are imperative as a typical building expends a greater amount of resources and energy than should be expected, which adversely affects the environment and produces large amounts of waste [2]. Sustainable work-environment systems have been largely driven by governmental organizations, for example, the United States Environmental Protection Agency, the General Services Administration Workplace Management Division, the National Institute of Standards and Technology, and the United States Green Building Council. Furthermore, a building and its segmented parts are expected to last longer than other building components [3,4]. Sustainable development has been defined as “development that meets the needs of the present without compromising the ability of future generations to meet their own needs” [5].
Sustainable facilities management (SFM) expands the facility management role and how it encompasses and impacts multiple aspects, such as energy and water efficiency, waste avoidance and minimization, ecological conservation, conservation of building materials, users’ perspectives, indoor air quality enhancement, and strategic management [6]. As for educational buildings, SFM incorporates work that guarantees the usefulness of these structures by coordinating individuals, place, process, and innovation to manage the desired conditions, utilities, items, qualities, and administrations from long-term and environmental perspectives [7,8]. SFM in educational buildings can be executed by utilizing vitality productive lighting to control and decrease energy use and reduce ozone-harming substance emanations, which may in turn reduce operation and upkeep costs for the office [9,10]. Similarly, SFM practices may include low-stream plumbing apparatuses to decrease water usage and incorporating reused and privately sourced building materials. Overall, SFM plays an important role in influencing user perspective in educational buildings. According to Shafie et al. [11] and Aleixo et al. [12], facility management (FM) in educational buildings plays an important role in minimizing dissatisfaction among building users. Therefore, regarding SFM, the user’s perspective is considered the most important factor in the success of sustainable educational building design [13,14].
In view of the above, the ultimate objective of the present research study is to develop a framework for facility managers that provides comprehensive guidelines for updating a conventional post-secondary educational building into a sustainable one while considering users’ perspectives towards the facility. The following sub-objectives have been identified to achieve the main goal of this research:
  • Identify and assess the factors and sub-factors that affect user perspective in post-secondary educational buildings.
  • Develop an OUPS for post-secondary educational buildings using a fuzzy expert system.
  • Create a user perspective index to evaluate user satisfaction in sustainable post-secondary educational buildings.

2. Literature Review

Several research studies are reported in the literature that have opted to evaluate sustainability measures for buildings. One branch of studies has dealt with proposing passive architecture designs for improving the sustainability performance of buildings. Al-Sakkaf et al. [15] studied ten passive architecture design scenarios for enhancing energy consumption and thermal comfort in heritage buildings. Among them were double low-E-glass and double wall with thermal insulation, double reflected glass and double wall with thermal insulation, and double reflected glass and double wall with sprayed foam insulation. Analytical results manifested that implementing double low-E-glass and double wall with polystyrene thermal insulation could increase thermal comfort and decrease CO2 emissions by 17% and 9%, respectively. Mahmoud et al. [16] compared the energy performance of conventional and passive design in administrative buildings. The features of passive design comprised cross ventilation, shading devices, double walled envelope, and courtyards. Simulation results showed that the proposed passive design could lessen the annual energy consumption by 11%.
Another branch of research works has focused on individual building elements or materials. Abediniangerabi et al. [17] introduced a deep learning model for predicting the energy savings of façade designs at an early stage. Different simulations were carried out using Energyplus for two façade systems of conventional panels and ultra-high-performance fiber-reinforced concrete. The input features encompassed building design parameters and weather-related parameters, and the target variables were heating energy savings, cooling energy savings, and total site energy savings. Results showed that the developed deep neural network model could outperform random forest, generalized linear regression, and gradient boosting, achieving mean absolute error and root mean squared error in total site energy savings of 1.59 and 3.48, respectively. In predicting cooling loads, deep neural network produced mean absolute error and root mean squared error in total site energy savings of 0.2 and 0.39, respectively. As for the heating loads, deep neural network yielded mean absolute error and root mean squared error in total site energy savings of 1.17 and 2.32, respectively. This demonstrated the higher capability of deep neural network in quantifying energy savings for building façade systems. Kim et al. [18] analyzed the energy savings of a photovoltaic green roof system using a simulation approach. Agent-based simulation was used to estimate energy costs and benefits of the green roof system. Sensors were utilized to gather information pertinent to electricity consumption and real-time temperature. Results demonstrated that the proposed solution managed to significantly decrease the energy costs of heating, ventilation, and air conditioning.
Jalali et al. [19] optimized façade design to improve the sustainability performance of office buildings. Parametric modeling was carried out using Grasshopper software, and Energyplus was used for environmental impact assessment. A genetic algorithm was implemented to find the optimum architectural design that resulted in improvement in natural light, thermal loads, and usable space. It was inferred that the rate of opening could minimize cooling loads, heating loads, and useful daylight illuminance by 8%, 21%, and 37%, respectively. Habibi et al. [20] proposed a re-roofing solution for improving the energy savings of buildings. They also studied the applicability of the integration of photovoltaic panels in roofing systems. Using simulation methodology, it was found that a three-layer roofing system of a photovoltaic panel, insulation layer, and Ethylene Propylene Diene Monomer (EDPM) membrane could improve energy performance by values ranging from 13.89% to 15.22% when compared with the current roofing solution.
A third branch of studies has capitalized on current rating systems to improve the sustainability performance of buildings. Abdallah [21] developed a multi-objective optimization model to identify the most sustainable upgrade measures for large existing buildings. The design building upgrade measures included ones related to specific plans or fixtures, and they encompassed sustainable cleaning equipment, custodial effectiveness assessment, storm water quantity control, controllability of systems lighting, etc. A genetic algorithm was exploited to find the optimum upgrade measures minimizing the total upgrade cost and maximizing the total number of Leadership in Energy and Environmental Design (LEED) credit points. Jalaei et al. [22] merged the benefits of building information modeling and the LEED rating system to compute the credit points of the buildings at an early stage. They included factors relating to water efficiency, materials and resources, indoor environmental quality, sustainable sites, etc. In this regard, the missing credits were calculated using the K-nearest neighbors algorithm.
A fourth branch of research efforts has emphasized sustainability-based condition assessment models. Eweda et al. [23] created a building’s condition assessment model for indoor environment. Each space in the building was characterized by four indoor environmental quality factors: indoor air quality, thermal quality, lighting quality, and acoustics quality. In this regard, analytical hierarchy process was implemented to find the relative importance weights of each building space and indoor environmental quality factors. Multi-attribute utility theory was applied to establish the overall environmental condition of the building. It was found that the environmental condition of the building significantly affects the overall condition of the building. Faqih and Zayed [24] developed an integrated model for appraising the physical and environmental condition of a building. The physical condition targeted safety, significance, function, and appearance, while the environmental condition considered indoor air quality, thermal comfort, lighting, and acoustics. Analytical network process was deployed to find the relative weighting for the physical and environmental factors, and evidential reasoning was utilized to interpret the overall condition of the building. It was deduced that the reported model could facilitate taking appropriate remedial actions based on the overall condition.
In the light of previous research studies, however, it can be observed that there is a lack of models that focus on facility management in sustainable buildings from the user’s perspective, such as considering user satisfaction indicators, user needs, and variation in user needs. In this context, most of the reported evaluation models tackled sustainability from economic, operational, and organizational perspectives and excluded user perspective in their analysis. Considering user needs at an early design stage is essential to ensure effective collaboration between facility managers and designers [25]. In addition to that, failure to incorporate user needs could result in excessive maintenance costs, redundant natural resource consumption, and high energy costs [26,27]. In this regard, the incorporation of user needs is a complex process that depends on the type of building, its physical characteristics, number of occupants, and the type of sustainability indicator [28,29,30]. Thus, a dynamic platform needs to be customized to address user satisfaction indicators and relevant variations. It is also noticed that existing rating systems do not consider users’ needs or satisfaction in their assessment frameworks; and that several condition assessment models analyze their influencing factors utilizing questionnaire methods without considering the uncertainty associated with the different interpretations of respondents, or the accuracy and/or reliability of their responses.

3. Research Framework

The primary aim of this research is to develop a framework for facility managers that provides comprehensive guidelines for updating the sustainability of green buildings, for upgrading a conventional building into a sustainable one, and to do both from the users’ perspectives. 
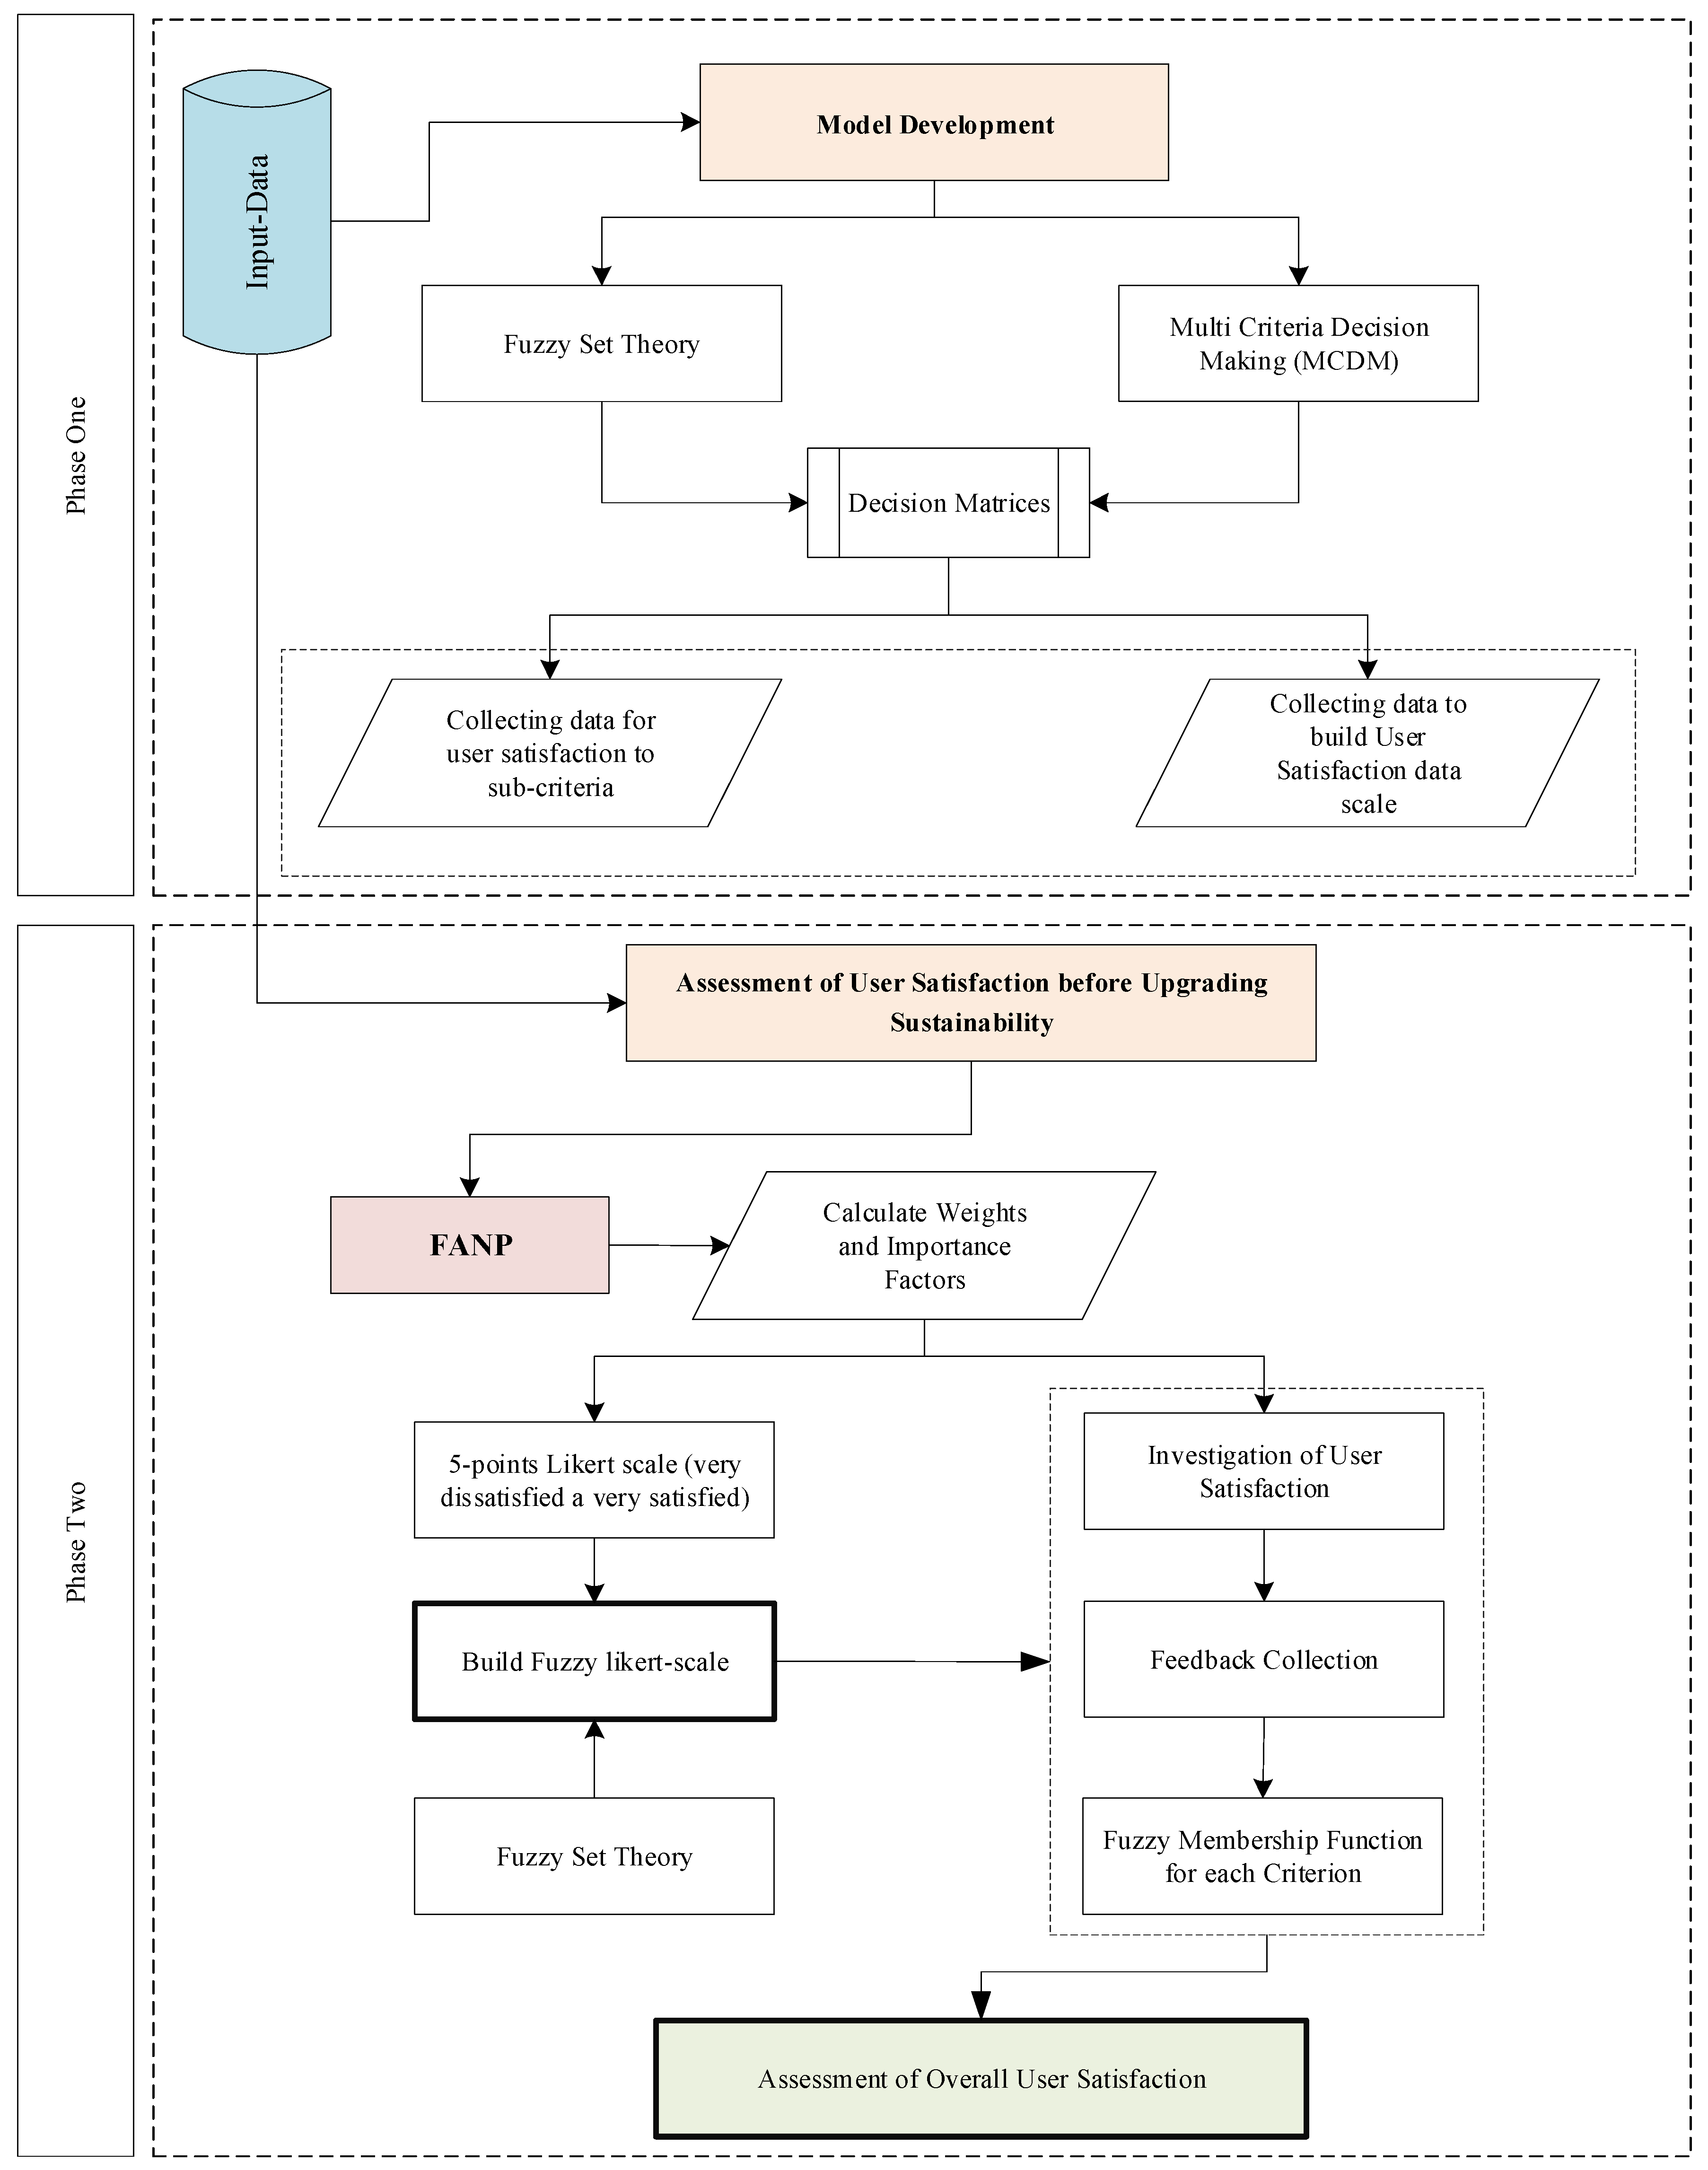
Figure 1 explains the development methodology which encompasses the following two stages: model development and assessment of user perspective. The model development stage evaluates the importance level of each criterion and sub-criterion with respect to the user’s perspective. In addition, the model development stage gathers responses in relation to assessing the user perspective satisfaction levels in four different types of sustainable buildings (educational, commercial, industrial, and residential). The first step in this stage is conducting a comprehensive literature review analysis, where a set of factors are defined which exhibit a significant influence on users’ perspective in sustainable buildings. In this regard, these factors were selected to highlight some of the (generally) overlooked attributes, and to ensure inclusion of the most crucial ones that affect overall users’ perspectives on sustainable buildings. The appended factors encompass: (1) thermal comfort and air quality; (2) aesthetics, amenities and upkeep; (3) design and flexibility; and (4) lighting and acoustics. Each sub-criterion comprises a factor used to subdivide and assess each criterion in different aspects.
Pairwise comparisons between criteria and sub-criteria are then conducted and used to calculate their relative importance using fuzzy analytic network process (FANP). Fuzzy set theory was first introduced by Zadeh [31] to incorporate the imprecision and vagueness associated with data in addition to incomplete information. In this context, fuzzy set theory was successfully implemented to handle subjective assessments and lack of information in several asset management practices [32,33,34]. In addition, analytic network process was selected because it enables modelling of the interrelations and interdependencies of criteria and the users’ feedback, and it has the ability to decrease the gap between the model and reality [35,36]. Based on the interrelations and the feedback, the ANP allows the calculation of the overall importance of criteria and the overall perspective level of every sub-factor [37,
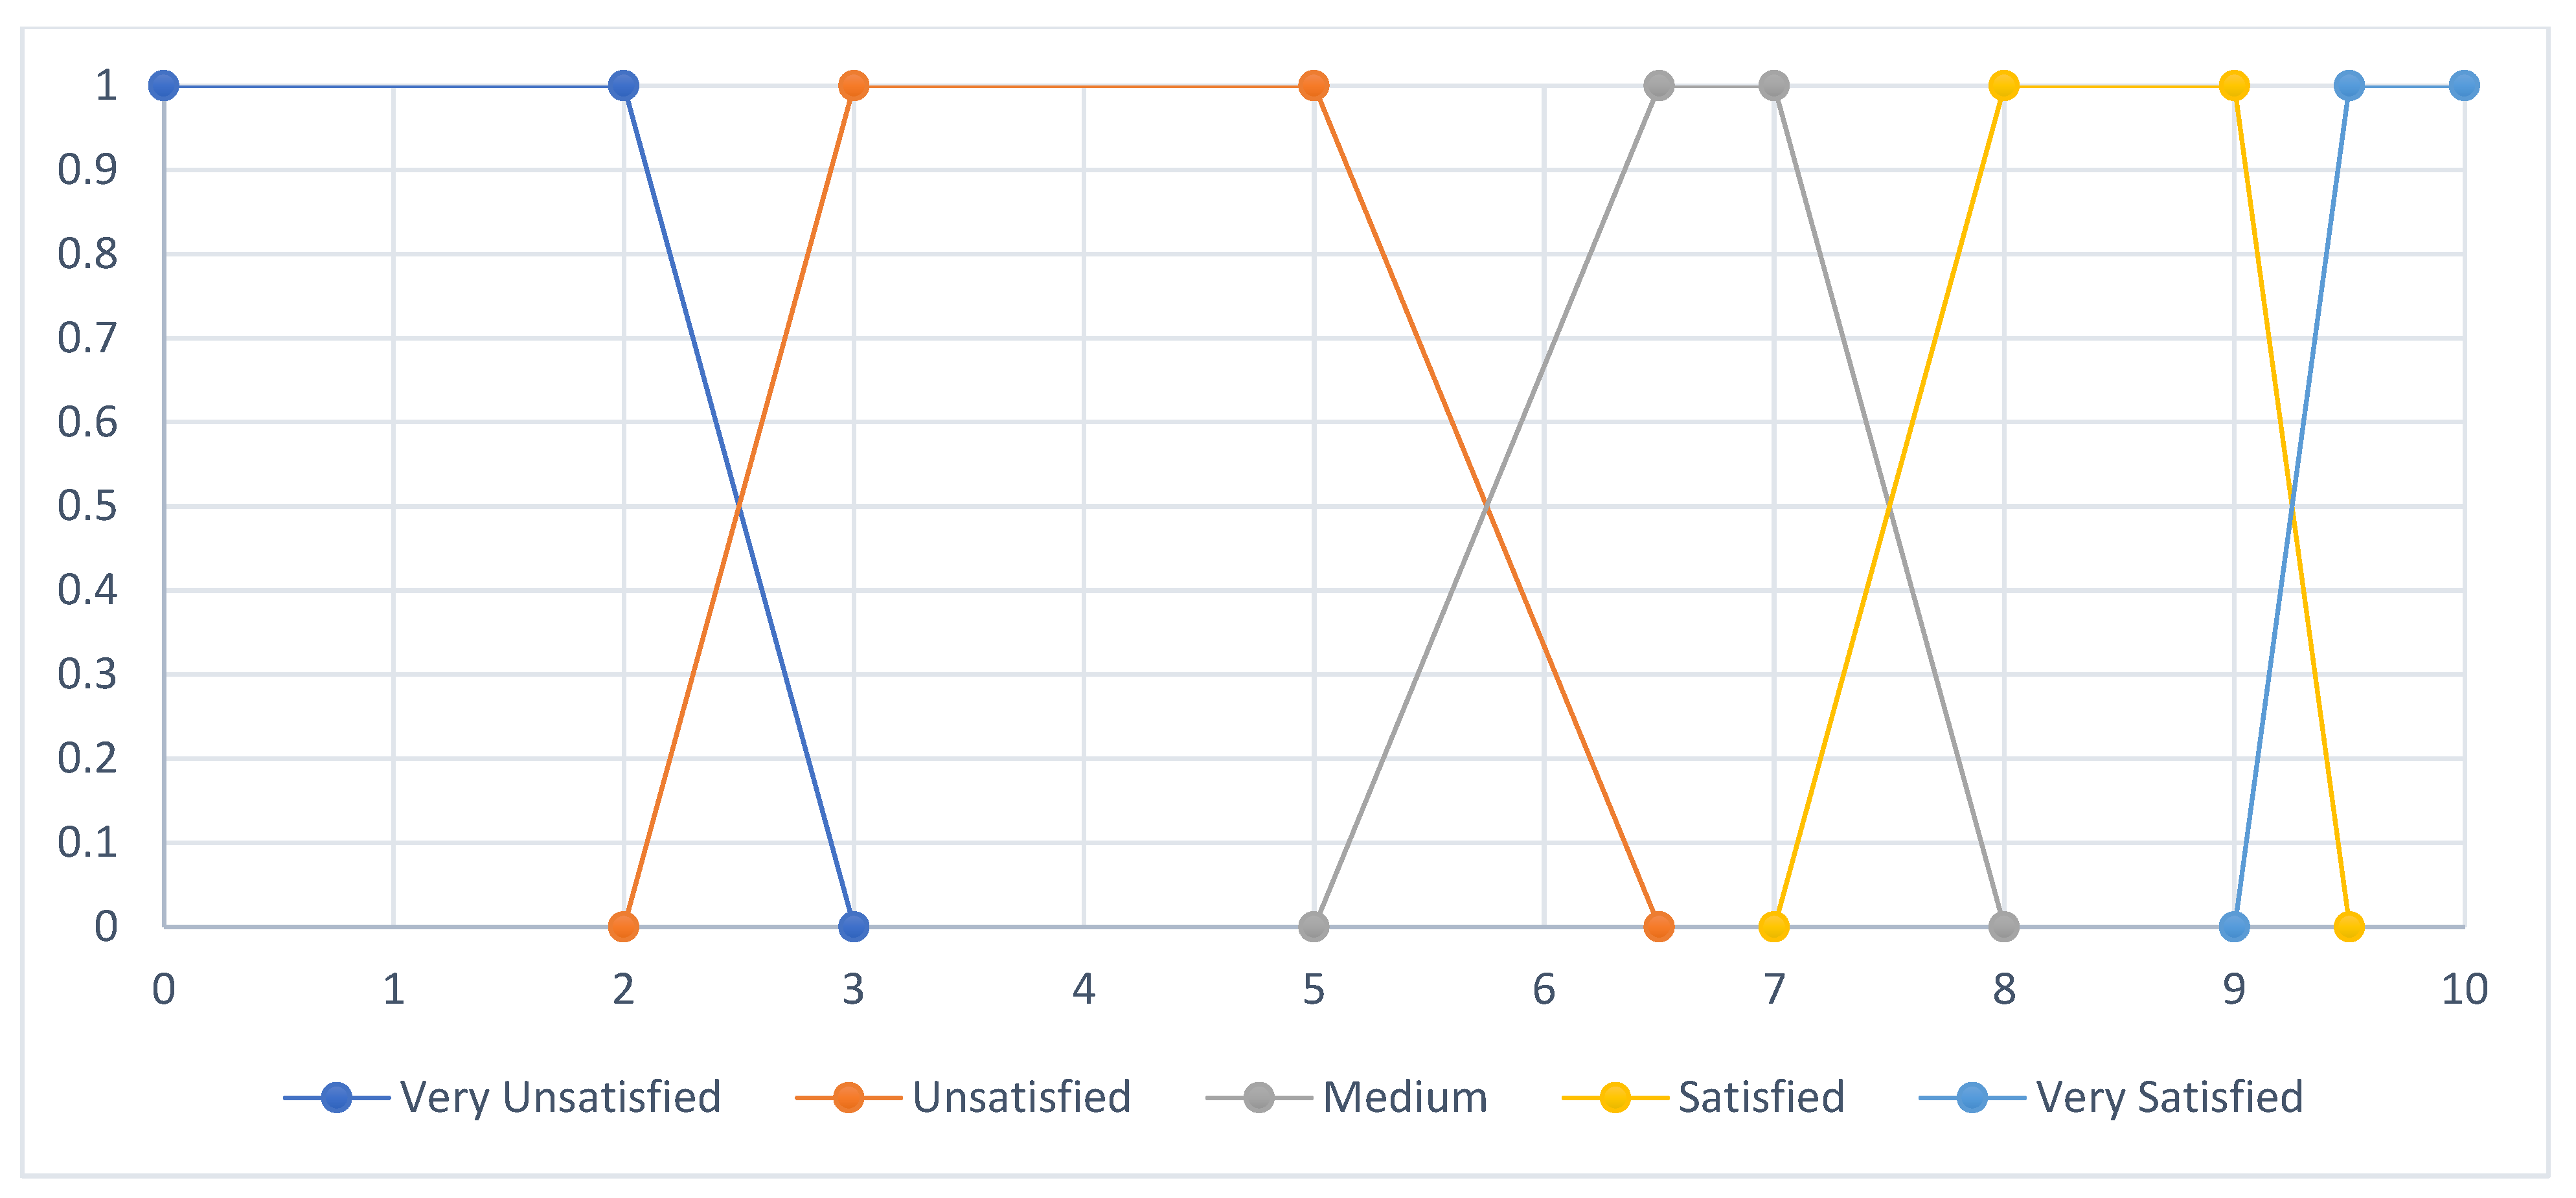
38]. The final step involves evaluating the user perspective level for a sustainable building using the user responses collected on a 5-point Likert scale: very dissatisfied, dissatisfied, medium, satisfied, and very satisfied [39,40,41]. In this regard, the users’ perspective levels are demonstrated in the form of fuzzy membership functions to simulate the uncertainties linked with experts’ judgements. The second phase of the framework aims to aggregate the weights of the user perspective attributes alongside the user perspective levels to calculate the overall perspective of users in the sustainable building being considered. This stage also includes creating an overall user’s perspective scale for each designated type of building. In this scale, measuring the user’s perspective assessment paves the way for implementing strategies to amplify the user’s assessment, if needed.

4. Model Development

This section reviews the user’s perspective assessment attributes considered by the developed mode in addition to the basic procedures necessary to build it.

4.1. User’s Perspective Attributes

The identification of the user’s perspective assessment attributes (factors and sub-factors) was based on reviewing many different studies [42,43,44,45,46,47,48,49,50,51,52] that have dealt with developing users’ satisfaction and efficient FM in various regional contexts. This review made it possible to identify some limitations and advantages. Based on these limitations, and lacking some of the important attributes, a list of attributes was assembled that were considered to have a significant impact on the users’ perspective in SFM and that can help to assess the users’ perspective based on the three pillars of sustainability. Furthermore, different interviews and questionnaires were conducted based on the developed list of attributes. This step contributed to forming a hierarchy with which to make the final modifications, resulting in the final list of attributes.
Many of the factors and sub-factors of sustainable buildings are linked to energy conservation, especially in terms of burning fuel for electricity with its associated greenhouse gas emissions and their influence on climate change and global warming. Sustainable building design makes it possible to reduce energy consumption by proper building orientation and siting, as well as by the sizing and placement of appropriate windows to reduce excessive solar gain during summer months and heat loss during the winter months. Operational energy consumption is extremely important, as a sustainable building may be occupied for many years before any adaptations are made, and operational energy can substantially exceed the construction energy and embodied energy levels. Specifying the use of building materials that have low embodied energy and that do not include deleterious materials, such as volatile organic compounds (VOCs) or formaldehydes, is key to both reducing the overall energy consumption and for human comfort. These particular building materials can adversely affect human health through allergic and sensitivity reactions, causing eye, skin, and respiratory problems [53].
Furthermore, the factors and sub-factors should take into consideration the operational phase of a sustainable building; thus, there is an emphasis on maintenance practices to ensure that the principles of sustainability are routinely incorporated. Building services and IEQ are important aspects of sustainable buildings due to their role in operational energy consumption; for example, increased importance is being placed on adopting natural ventilation over air conditioning systems. An important theme in the uptake of sustainability in sustainable buildings is to maintain and increase sustainability while maintaining and enhancing the comfort levels of the buildings’ users. Finally, transport-related emissions should also be considered. For example, transport emissions typically account for one-quarter of Australia’s total greenhouse gas emissions, and therefore any reduction in these emissions would be a significant contribution to Australia’s total emission levels [54]. Sustainable buildings can encourage occupants to use public transit systems such as trains, subways, trams, or buses, as credited under the rating tools, and they can encourage active transport such as cycling by incorporating amenities including showers and secure, weather-protected bike racks. In summary, a number of factors affect FM in sustainable buildings. The first challenge is to identify all the factors and sub-factors that affect the assessment procedure of FM from the users’ perspective. Table 1 presents the factors and sub-factors of FM assessment from a user’s perspective, where twenty-six sub-criteria have been identified and grouped into four groups:
  • Thermal comfort and air quality.
  • Aesthetics, amenities, and upkeep.
  • Design and flexibility.
  • Lighting and acoustics.
Table 1. The four main factors and their sub-factors in user’s perspective assessment.
FactorsSub-Factors
Thermal comfort and air qualityA heating/cooling system responding
Functions at a comfortable humidity
Feels well ventilated
How much control users have over their environment
Functions at a comfortable temperature
Aesthetics, amenities, and upkeepThe flexibility of the spaces
Conversational privacy in the office
The circulation of the building
Interaction with different colleagues
Ability to meet needs
Openness and views to outside
Design and flexibilityVisually appealing
Tidy in appearance
Containing up-to-date IT services
Having good quality common amenities
Having enough storage at their desk for personal items
Degree of noise
Lighting and acousticsGood distribution of sound to all the space
Proper reverberation times throughout all frequencies
Natural sound diffusion and envelopment
A sense of intimacy for the audience
Brightness
Contrast
Glare
Diffusion
Color

4.1.1. Thermal Comfort and Air Quality

Thermal comfort is a condition of mind that expresses satisfaction with the local thermal environment. Due to its subjectivity, thermal comfort is different for every individual; it is maintained as the heat generated by a body’s metabolism is allowed to dissipate at a rate that maintains thermal equilibrium within the body. Any heat gain or loss beyond this equilibrium leads to substantial discomfort. Essentially, to maintain thermal comfort, heat produced must equal heat lost. It has been long recognized that the sensation of feeling hot or cold is dependent on more than just air temperature [28]. It embraces five sub-factors as follows: First, a responsive heating/cooling system (RHCS) that provides a control framework should regulate the operation of the warming/ventilating framework. Second, how well an area is maintained at a comfortable humidity (CH) level, which can be defined as the water vapor portion of air that can be used for condensation, communicated as a rate. Third, how well ventilated (WV) does the air seem, i.e., are users provided with adequate ventilation while preventing the amassing of critical amounts of vapor–air mixtures over one-fourth of the easily combustible limit. Fourth, how much control do users have over their environment (CU), i.e., to what degree has a method been designed so that that an individual can manipulate and adjust appliances within their work or living spaces. Fifth, to what degree can a comfortable temperature (CT) be maintained, which can be determined as a maximum of 78 °F (summer), a minimum of 68 °F (winter), and relative humidity (RH) of 30–60%. Ideal conditions are temperatures between 68–78 °F and 45% RH year-round.

4.1.2. Aesthetics

Excellence and taste are philosophical concepts. These can be closely identified with theories about art, and as such are concerned with how symbolization and ideas translate into expectations [55]. It is very important that aesthetics be considered as one of the sustainability factors. Due to this, sustainability warrants an aesthetic philosophy and such a theory must be comprehended with respect to how facility management is planned, and it should be made with a specific end goal to accomplish the execution results that are the premise of manageability. Setting up manageability as tasteful inspiration driving building configuration will be the premise of another worldview for facility management.
Aesthetics embraces six sub-factors as follows. First, the flexibility of the spaces (FA), which means that there is a method for innovative organizational improvement, including allowing freelancers to plan the use of such spaces. Bringing adaptability into physical space management could allow them to shrink or expand according to work needs [56]. Second, assuring conversational privacy (CP) in the office is a key aspect that offers users a feeling of security. This CP is often linked to a defined physical space. Third, building circulation (BC), which refers to how people move throughout a building, including how BC allows for more interaction and cooperation. Fourth, the conditions for interaction with different colleagues (IDC), which refers to how the design plan helps to create opportunities for realistic interaction among a variety of colleagues. These can include work and break times, socializing and eating areas, and even recreational and physical training facilities. Fifth, there is a measure of a building’s ability to meet needs (AMN). The last factor is the degree of openness and access to outside views (OV), which rates the openness of the spaces in terms of natural light as well as fresh air.

4.1.3. Design and Flexibility

Design and flexibility are utilized to implement different qualities in building frameworks. In the field of designing frameworks, this addresses all the plans that might need to be adjusted when outer progressions happen [57]. It is a very important factor to be considered as one of the sustainability factors that affect a user’s perspective because of the role of the adaptability of buildings in facilitating a realistic response to the challenges of the user’s perspective. A building has flexible design in order to respond to changes of user perspective so that it can better reflect their perspective and so that it will make the building interact more with users.
It embraces six sub-factors as follows: First, is it visually appealing (VA), which is a rating based on the reasons for a user’s interest in, and alternately gravitation towards, utilization of the separate spaces. Second, is it tidy in appearance (TA), which emphasizes the need to offer simple, serene, and systematic spatial courses of action, made easier by uncluttered spaces. This aspect also includes rearrangements of the inner portions for a purpose that makes it possible to achieve some crucial quality, and to avoid lavishness. Third, does it contain up-to-date IT services (CITS), which can be considered as the degree of being dependent upon the dates of all the provisions from claiming office to overseeing the economy. This aspect also refers to protecting various structures in the management and streamlining areas. CITS may further imply keeping attackers from claiming or having access to the majority of the data and fabrication procedures. Fourth, does it have good quality (GQ) common amenities that help users in many ways, such as library resources or sports facilities offered for users’ convenience, enjoyment, and sometimes for personal solace. Fifth, is there enough storage (S), which means that users have enough personal storage at their desk (either below their desk’s mobile cabinet or in below-desk storage for personal emergencies) and in lockers (on-floor lockers for personal items and storage, nearby shower facilities and storage for clothing and personal hygiene items); on-floor team storage (lockable cabinets, shared high-density storage); and central in-building storage (central file and records storage for the agency, often managed by a records team, as well as on-site storage of archive material, records, and files).

4.1.4. Lighting and Acoustics

Lightning and acoustics are the science and engineering aspects of achieving good sound and lighting within a building [58]. These embrace seven sub-factors which are listed below. First, assuring good distribution of sound to all of a space (GDS), defined as a system that office administrators undertake after enriching the caliber of sound dissemination inside diverse spaces in structures. Second, proper reverberation times (PRT) throughout all frequencies, which is part of the study of room acoustics/resonation influences and for which the best approach is via space resonance. A helter-skelter resonation time could result in a space that is noisy and/or not conducive to normal conversation. In a room full of reverberation, a helter-skelter resonation occurs, making reasonable discourse difficult and muted. Rooms intended for discourse are therefore commonly designed for low resonation time: ≤1 s. Third, natural sound diffusion and envelopment (NSDE), which we understand as a measure of how individuals should experience indoor sounds. This aspect begins with the configuration plan (architectural determinism), as social sciences have been used to evaluate how humans are profoundly affected by their surrounding spaces. The fourth aspect is brightness (B), based on visual observation and which evaluates how well light is reflected and perceived, inspired by the luminance of a visual target, but not in direct proportion to luminance. Fifth, contrast (CON), which is the distinction over luminance or color that makes an item (or its representation in a picture or display) recognizable. The sixth aspect is glare (G), a phenomenon that makes it difficult for people to perceive their desired views, often under strong light for example, such as reflected daylight or the light from auto headlamps at night. Diffusion (D) indicates the level of light dispersion (light diffusion), essentially diminishing glare. The eighth and last aspect is color (COL), which not only indicates the color but also includes how each color influences human temperament. Light treatment investigations have discovered that distinctive light shades influence moods and heart rates and even circadian rhythms.

4.2. Weight Interpretation

In this step, N number of criteria “i” and “ni” number of sub-criteria “k” associated with each sub-criterion were identified from previous research and interviews with sustainability experts and FM personnel. Questionnaires were not distributed to users to determine the criteria or to determine their degree of importance, because often the user does not have enough experience to determine what he wants accurately, which will make it more difficult to determine these criteria. In contrast to the experienced managers of educational facilities, who have considerable experience through contact with the users, Paul [59] concluded that if users do not live with designs, which would allow them to understand sufficient detail of any design, their comments on those designs may not be in depth and cannot be built upon due to their lack of experience with them. This is unlike specialists in facility management, who have sufficient experience to read and analyze user behaviors in systematic and scientific ways to try to understand the problems and behaviors. Thereafter, two sets of fuzzy-based questionnaires were distributed among experts in sustainability and in the FM perspective. To determine the importance of each factor, each expert “j” was asked to evaluate the importance of each sub-criterion with respect to its parent criterion using a fuzzy, set-based pairwise comparison on a three-state importance scale: less important (LI), equally important (EI), or more important (MI). Each state is represented by a fuzzy membership function. Figure 2 shows an example of this 3-state fuzzy membership function that can be used to evaluate the relative importance of each sub-criterion with respect to their parent criteria.
It should be noted that the fuzzy expert system (FES) is organization-dependent, which means that each organization builds their own FES based on their sustainability practices. Pairwise comparisons were made by experts and FM practitioners to evaluate the importance of criteria with respect to the users’ perspectives. After the pairwise comparison, a set of matrices that reflect the experts’ opinions regarding the criteria and sub-criteria were generated, as shown in Equation (1):
  A ˜ = ( c 11 ˜ c 1 m ˜ c m 1 ˜ c mm ˜ )
The fuzzy analytic network process (FANP) is then used to calculate the fuzzy importance factor (IFc) of each criterion (c) and the weight (Wsc) of each sub-criterion (sc). After each of the matrices has been resolved, the output of this step are two vectors that represent the fuzzy importance factors and the fuzzy weights of the criteria and sub-criteria, respectively. These importance factors and weight vectors are represented by Equations (2) and (3), respectively:
  C ˜ = [ IF ˜ c 1 IF ˜ cN ]
SC ˜ i = [   W ˜ Sc , 1   W ˜ Sc , n i ]
where C represents the vector of importance factor (IF) of criteria (c), Sci represents the vector of sub-criteria weights with respect to the criterion “i”, N represents the number of criteria, and ni represents the number of sub-criteria with respect to criterion “i”.

4.3. Evaluation of Criteria and Sub-Criteria

In this step, fuzzy systems were generated using the opinions of experts and FM practitioners to represent the user perspective criteria with respect to each criterion and sub-criterion. In other words, this process determined the circumstances in which a user will be considered satisfied with each criterion. The data were collected using a questionnaire that investigates user perspective regarding each criterion and sub-criterion. Each user evaluates their own perspective on the sustainability attributes of the building. Their evaluations are based on a five-point Likert scale with the following responses: (1) Very Unsatisfied (VU); (2) Unsatisfied (U); (3) Medium (M); (4) Satisfied (S); (5) Very Satisfied (VS). Similarly, an overall user perspective scale is generated to represent the user’s perspective regarding the sustainability of a building. The OUPS is useful for evaluating the sustainability of a building based on its set of criteria and sub-criteria. It should be noted that an OUPS must be generated for each type of building (e.g., commercial, educational, etc.). Figure 3 shows an example of a 5-state fuzzy system that reflects temperature comfort and indicates how the generated fuzzy systems represent the user’s perspective with respect to each criterion and sub-criterion. Similarly, an overall user perspective scale is generated to represent the user’s perspective with respect to the sustainability of the building being considered. The OUPS is useful for evaluating the sustainability of each building based on its respective set of criteria and sub-criteria. Figure 4 shows an example of an OUPS that represents the overall perspective scale in industrial buildings. It should again be noted that an OUPS needs to be generated for each type of building (e.g., commercial, educational etc.). Table 2 records the thresholds of the overall user perspective scale for industrial buildings. Figure 5 depicts the OUPS for commercial buildings. It is demonstrated that the OUPS of industrial buildings is very different from the one for commercial buildings.

4.4. User Perspective Index

A model database was generated to store the data input of the weights for each criterion and sub-criterion, as well as the fuzzy systems representing the user perspective regarding each criterion and sub-criterion. After the database was generated, the model was ready to be implemented for evaluating the user perspective regarding a specific type of building (i.e., residential, commercial, educational, etc.). However, since the criteria of user perspective regarding sustainability largely depend upon a building’s type, a similar model development procedure will be used to generate the data input for each type of building to be stored in the model database.
The assessment process starts first with the perspectives of users regarding each sub-criterion. The linguistic evaluations of users collected in the first step were converted into numeric fuzzy membership functions using the scheme designed by experts and FM practitioners in the previous phase. Each sub-criterion (sc) received N numeric fuzzy memberships ( f sc ˜ ) i evaluated by the users (i = 1 …, N users) of the building. The user perspective regarding the sub-criteria being considered was calculated using fuzzy arithmetic, as presented in Equation (4).
f sc ˜ = i = 1 i = N users ( f sc ˜ ) i
where f sc ˜ represents the fuzzy membership function of sub-criteria (sc), ( f sc ˜ ) i represents the fuzzy membership function of sub-criteria evaluated by users “i”, and N represents the number of users who participated in the evaluation process.
The second step is the assessment of user perspective with respect to criteria. A fuzzy membership function that represents the evaluation of each criterion was generated using the fuzzy evaluations and fuzzy weights of its respective sub-criteria, as presented in Equation (5).
f c ˜ = j = 1 j = N sc   W ˜ sc × f sc ˜  
where   W ˜ sc represents the weight of sub-criterion “sc” with respect to criteria “c”, f c ˜ denotes the fuzzy memberships of user perspective regarding criterion “c”, and N sc is the number of sub-criteria (sc) affecting the criterion “c”.
The third step is the assessment of user perspective with respect to building sustainability (BS) and it is calculated as the sum of all the fuzzy memberships of sustainability criteria ( f c ˜ ) multiplied by their respective fuzzy importance factors ( IF ˜ c ). The fuzzy membership function that represents the user perspective with respect to BS is calculated using Equation (6).
BS = k = 1 k = N c IF ˜ c × f c ˜
where N c is the number of criteria affecting the building sustainability.
After calculating the fuzzy building score (BS), the agreement indices (AI) for each state of the overall perspective scale of this type of building are calculated using Equation (7).
AI ( BS ˜ , OUPS m ˜ ) = Area ( BS ˜ OUPS m ˜ ) Area ( OUPS m ˜ ) ,   m = VU , U , M , S , VS
where BS ˜ is the fuzzy membership of the building’s score, OSS m ˜ is the state m in the overall perspective scale, and VU, U, M, S, and VS represent the five states of the OUPS.
The user perspective sustainability level (SL) is determined as the OUPS state (m) that has the maximum agreement index with the BS score, as presented in Equation (8).
SL k = { Very Unsatisfied , if m = 1 m = 5 AI ( BS , OSS m ) = AI VU Unsatisfied , if m = 1 m = 5 AI ( BS , OSS m ) = AI U Medium , if m = 1 m = 5 AI ( BS , OSS m ) = AI M Satisfied , if m = 1 m = 5 AI ( BS , OSS m ) = AI S Very Satisfied , if m = 1 m = 5 AI ( BS , OSS m ) = AI VS
where SL k represents the perspectives of users regarding sustainability at level “k”. The perspective level can be measured at the sub-criteria (k = sc), criteria (k = c), and building (k = b) levels. If SL k ∈ {medium, satisfied, very satisfied} then the sustainability of the building being considered satisfies the user sustainability level (SL) and there is no need to upgrade that building’s sustainability. Otherwise, the sustainability of the building being considered needs to be upgraded using one or more sustainable technologies.

5. Data Collection

There are a considerable number of specialists in the FM field in Canada. Be that as it may, the correct number of those FM specialists is difficult to determine. Along these lines, when the sample size is to be chosen, two components ought to be mulled over: degree of confidence and margin of error. The degree of confidence speaks to the level of correct outcomes that will be acquired from the questionnaire survey. If the degree of confidence is 90%, this implies the genuine outcomes of various examples. The margin of error speaks to the passable errors that can be obtained from the sample results. Hence, the greater the margin of error, the less confidence there is in the experiment or in the results out of the sample. The population size of facility management experts was assumed to be 150 and the sample size was selected to be 100 [60].
A questionnaire survey was designed to find the relative importance weights of factors and sub-factors. In the first part, the respondents were asked to enter some general information that indicates his/her profession and years of experience, which helps in assessing the reliability of the answers. The second part of the questionnaire requests a pairwise comparison of the various factors and sub-factors. 
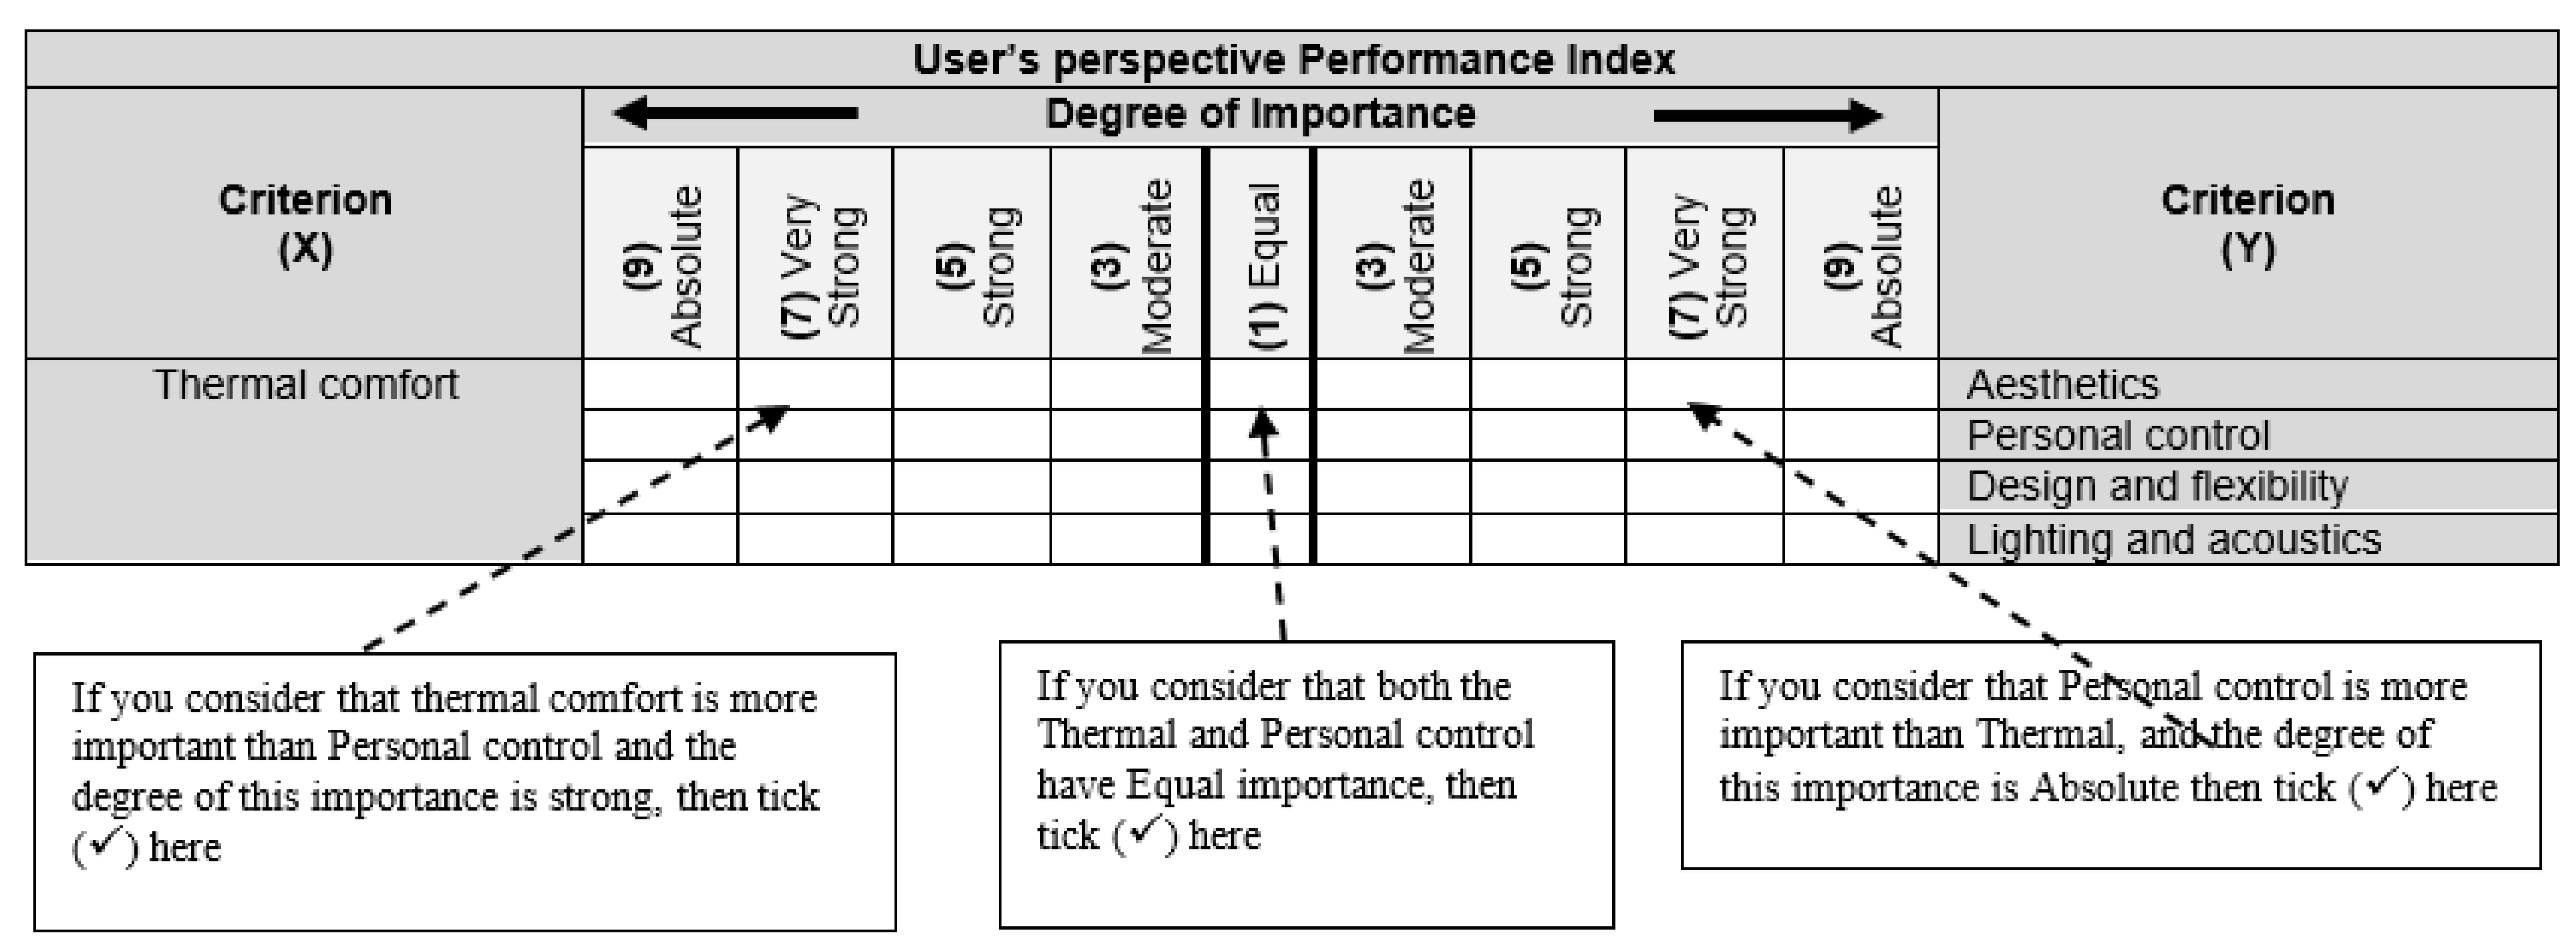
Figure 6 shows how these respondents are asked to indicate the degree of importance of each of the four criteria with respect to the overall assessment of the users’ perspective. In the same part of the questionnaire, the respondents are also asked to enter the degree of importance of each sub-factor concerning the criterion it represents, based on their own experience in the field. The pairwise comparison matrices were carried out based on a nine-point preference scale [61]. The mean of the responses was then calculated to estimate the conversion scale utilized to transform the data from a linguistic scale into a triangular fuzzy number. A total of 100 specialists with experience in building, construction, and sustainability fields, along with 120 sustainable building users, were reached by email and asked to fill out the survey. We received the following numbers of completed surveys: 25 respondents among the FM experts (25 %), and 40 respondents who were building users (33%). 
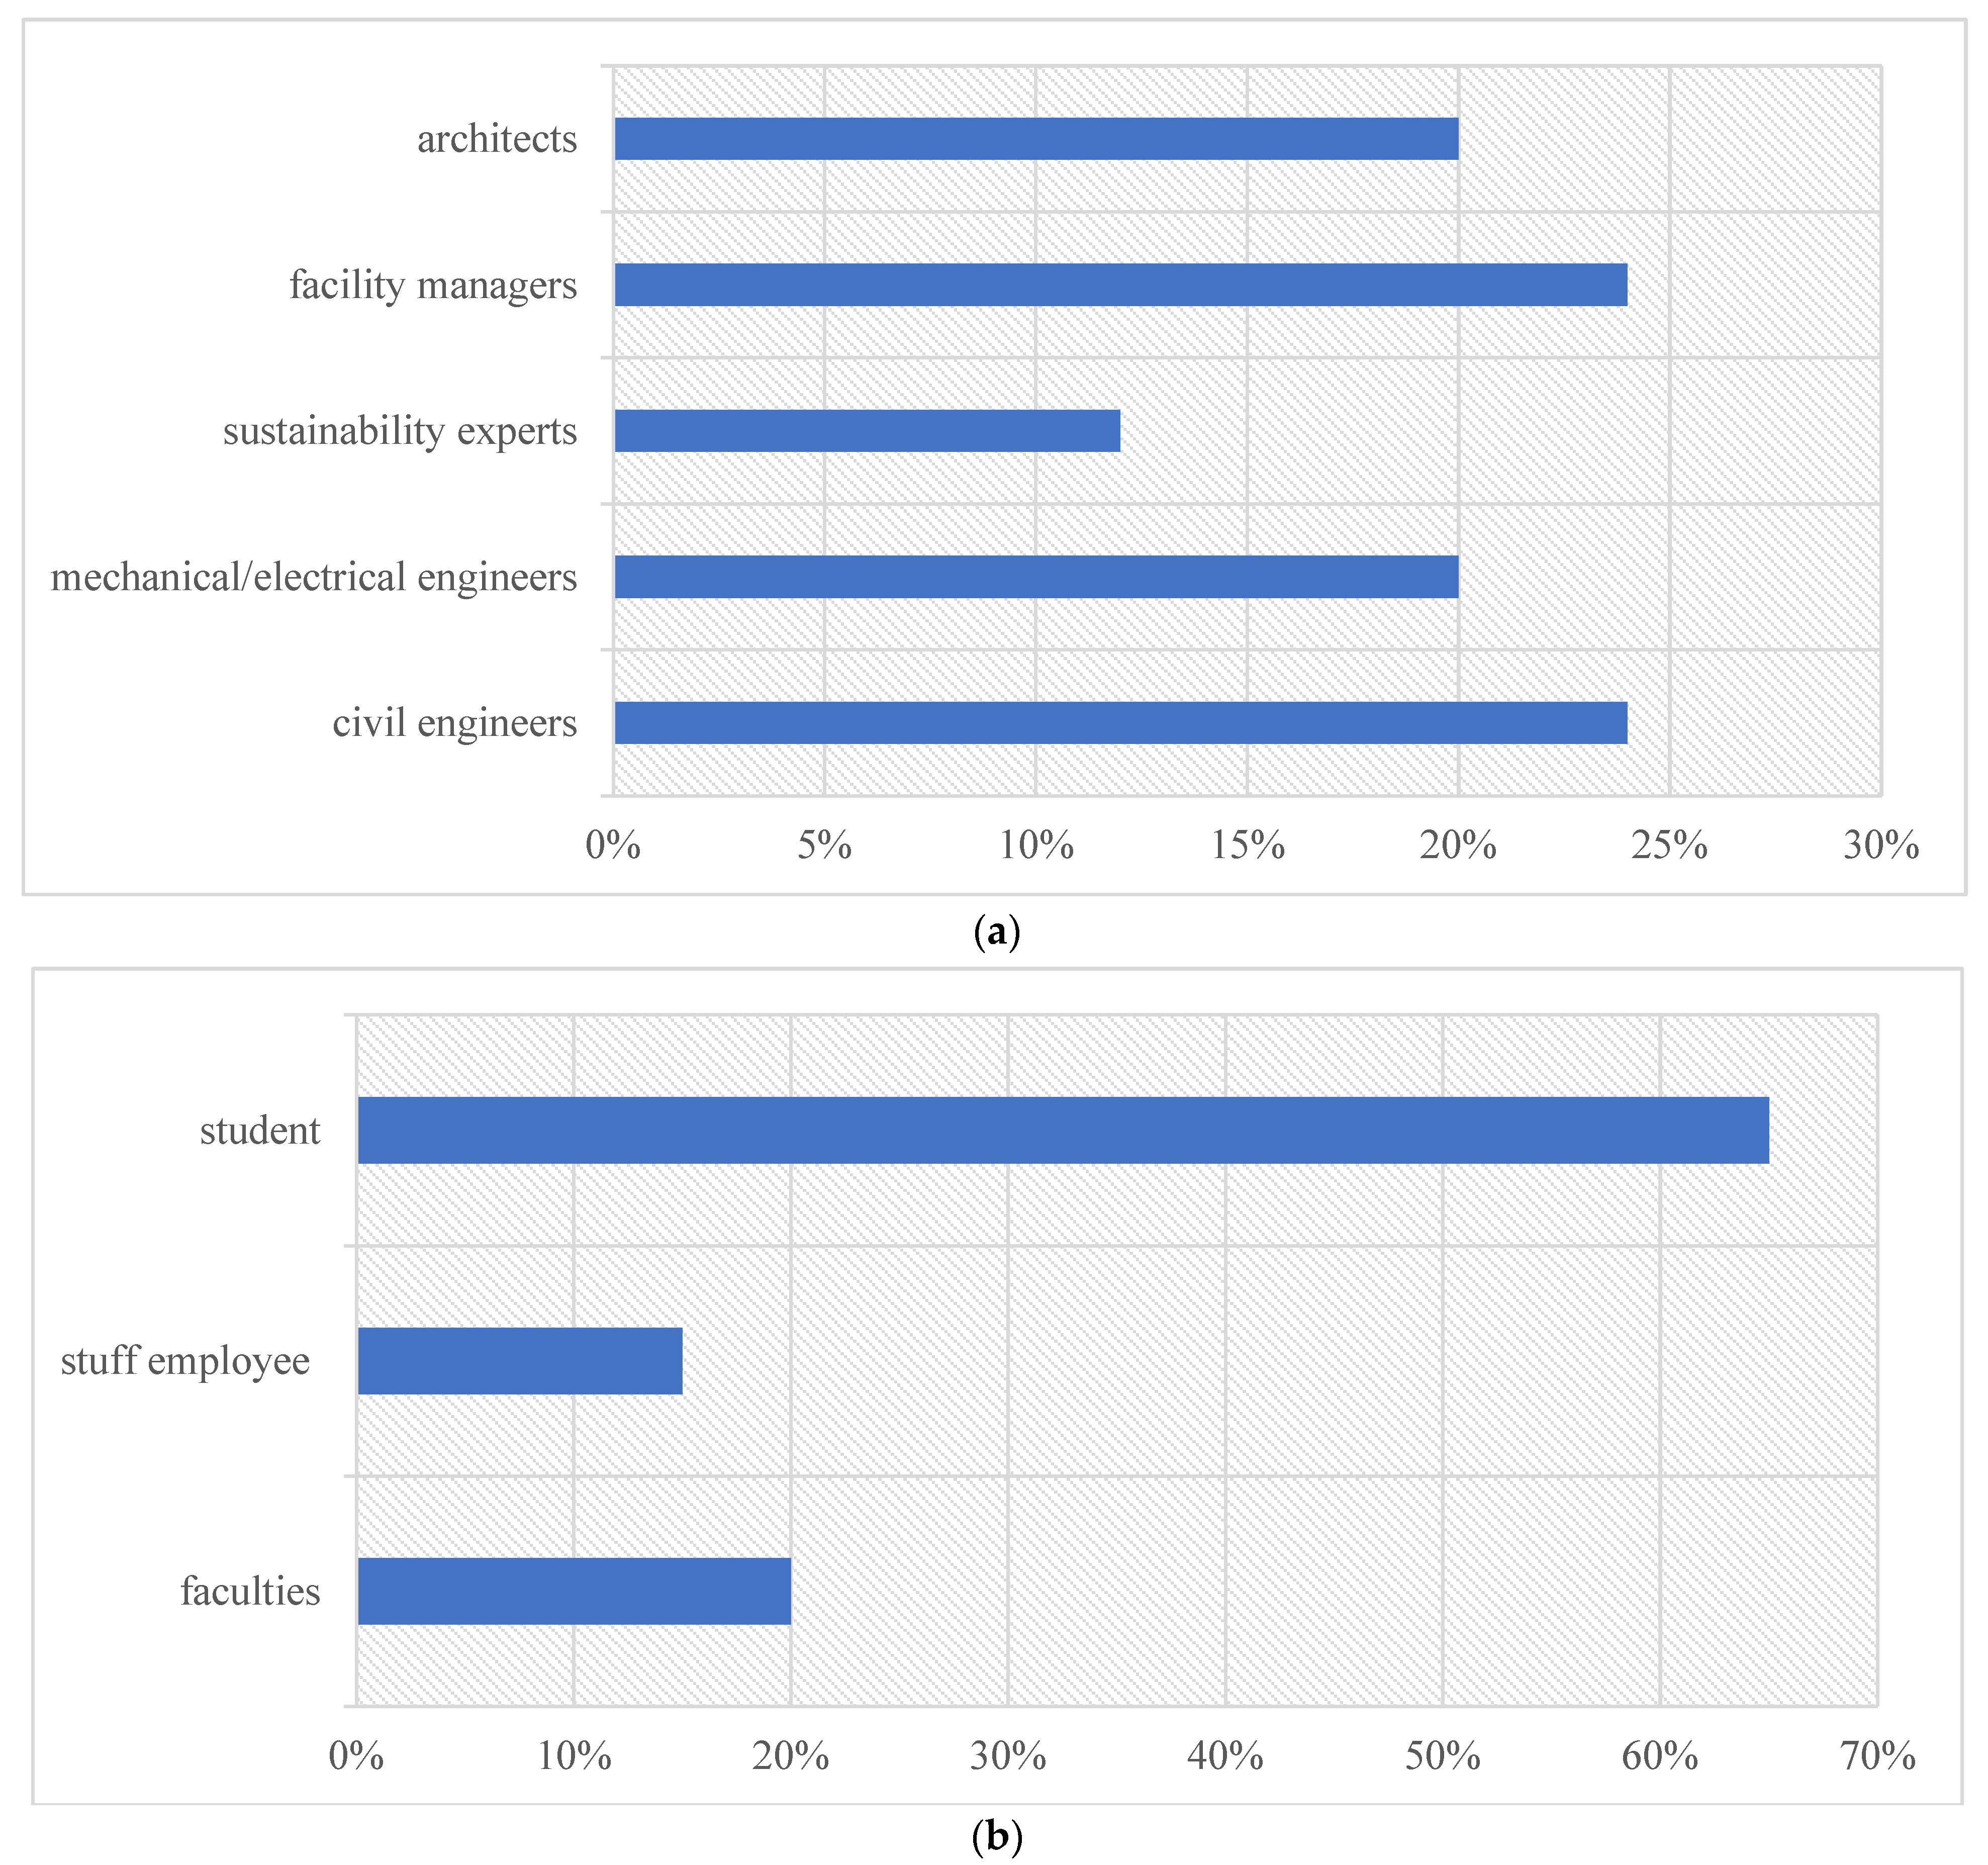
Figure 7 shows the diversity of respondents for both groups of the study sample, the building experts and the users of the building case study.
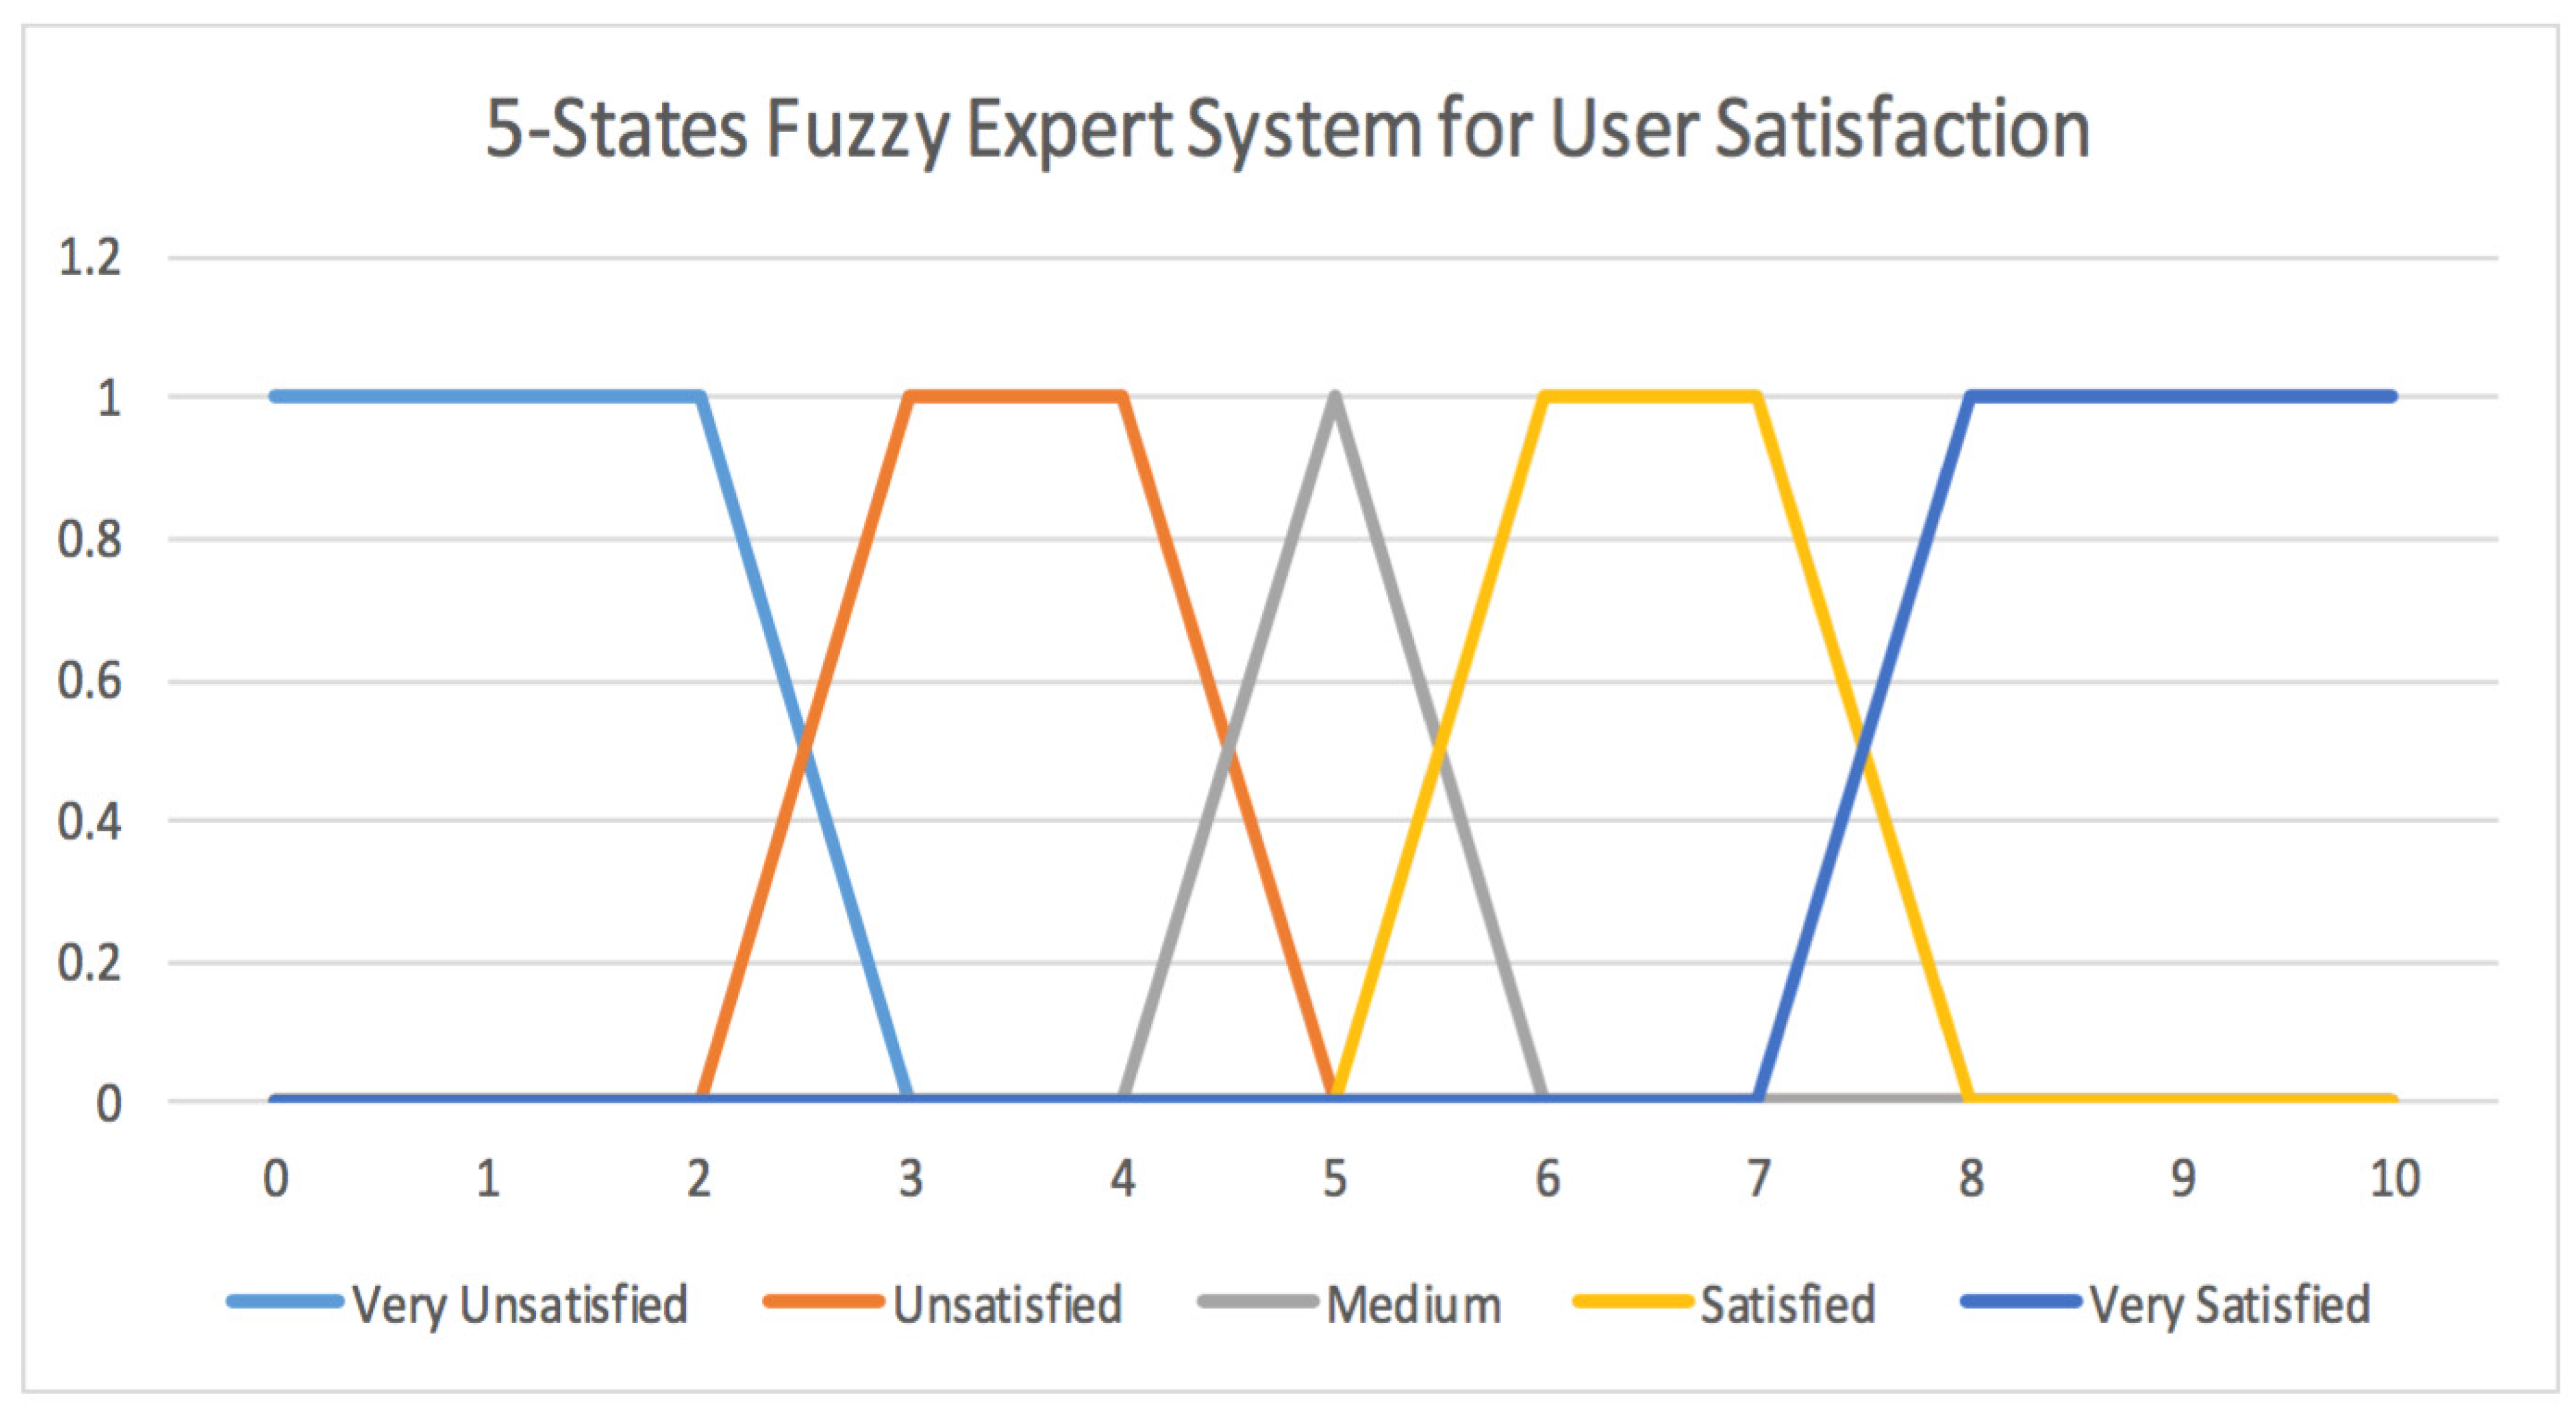
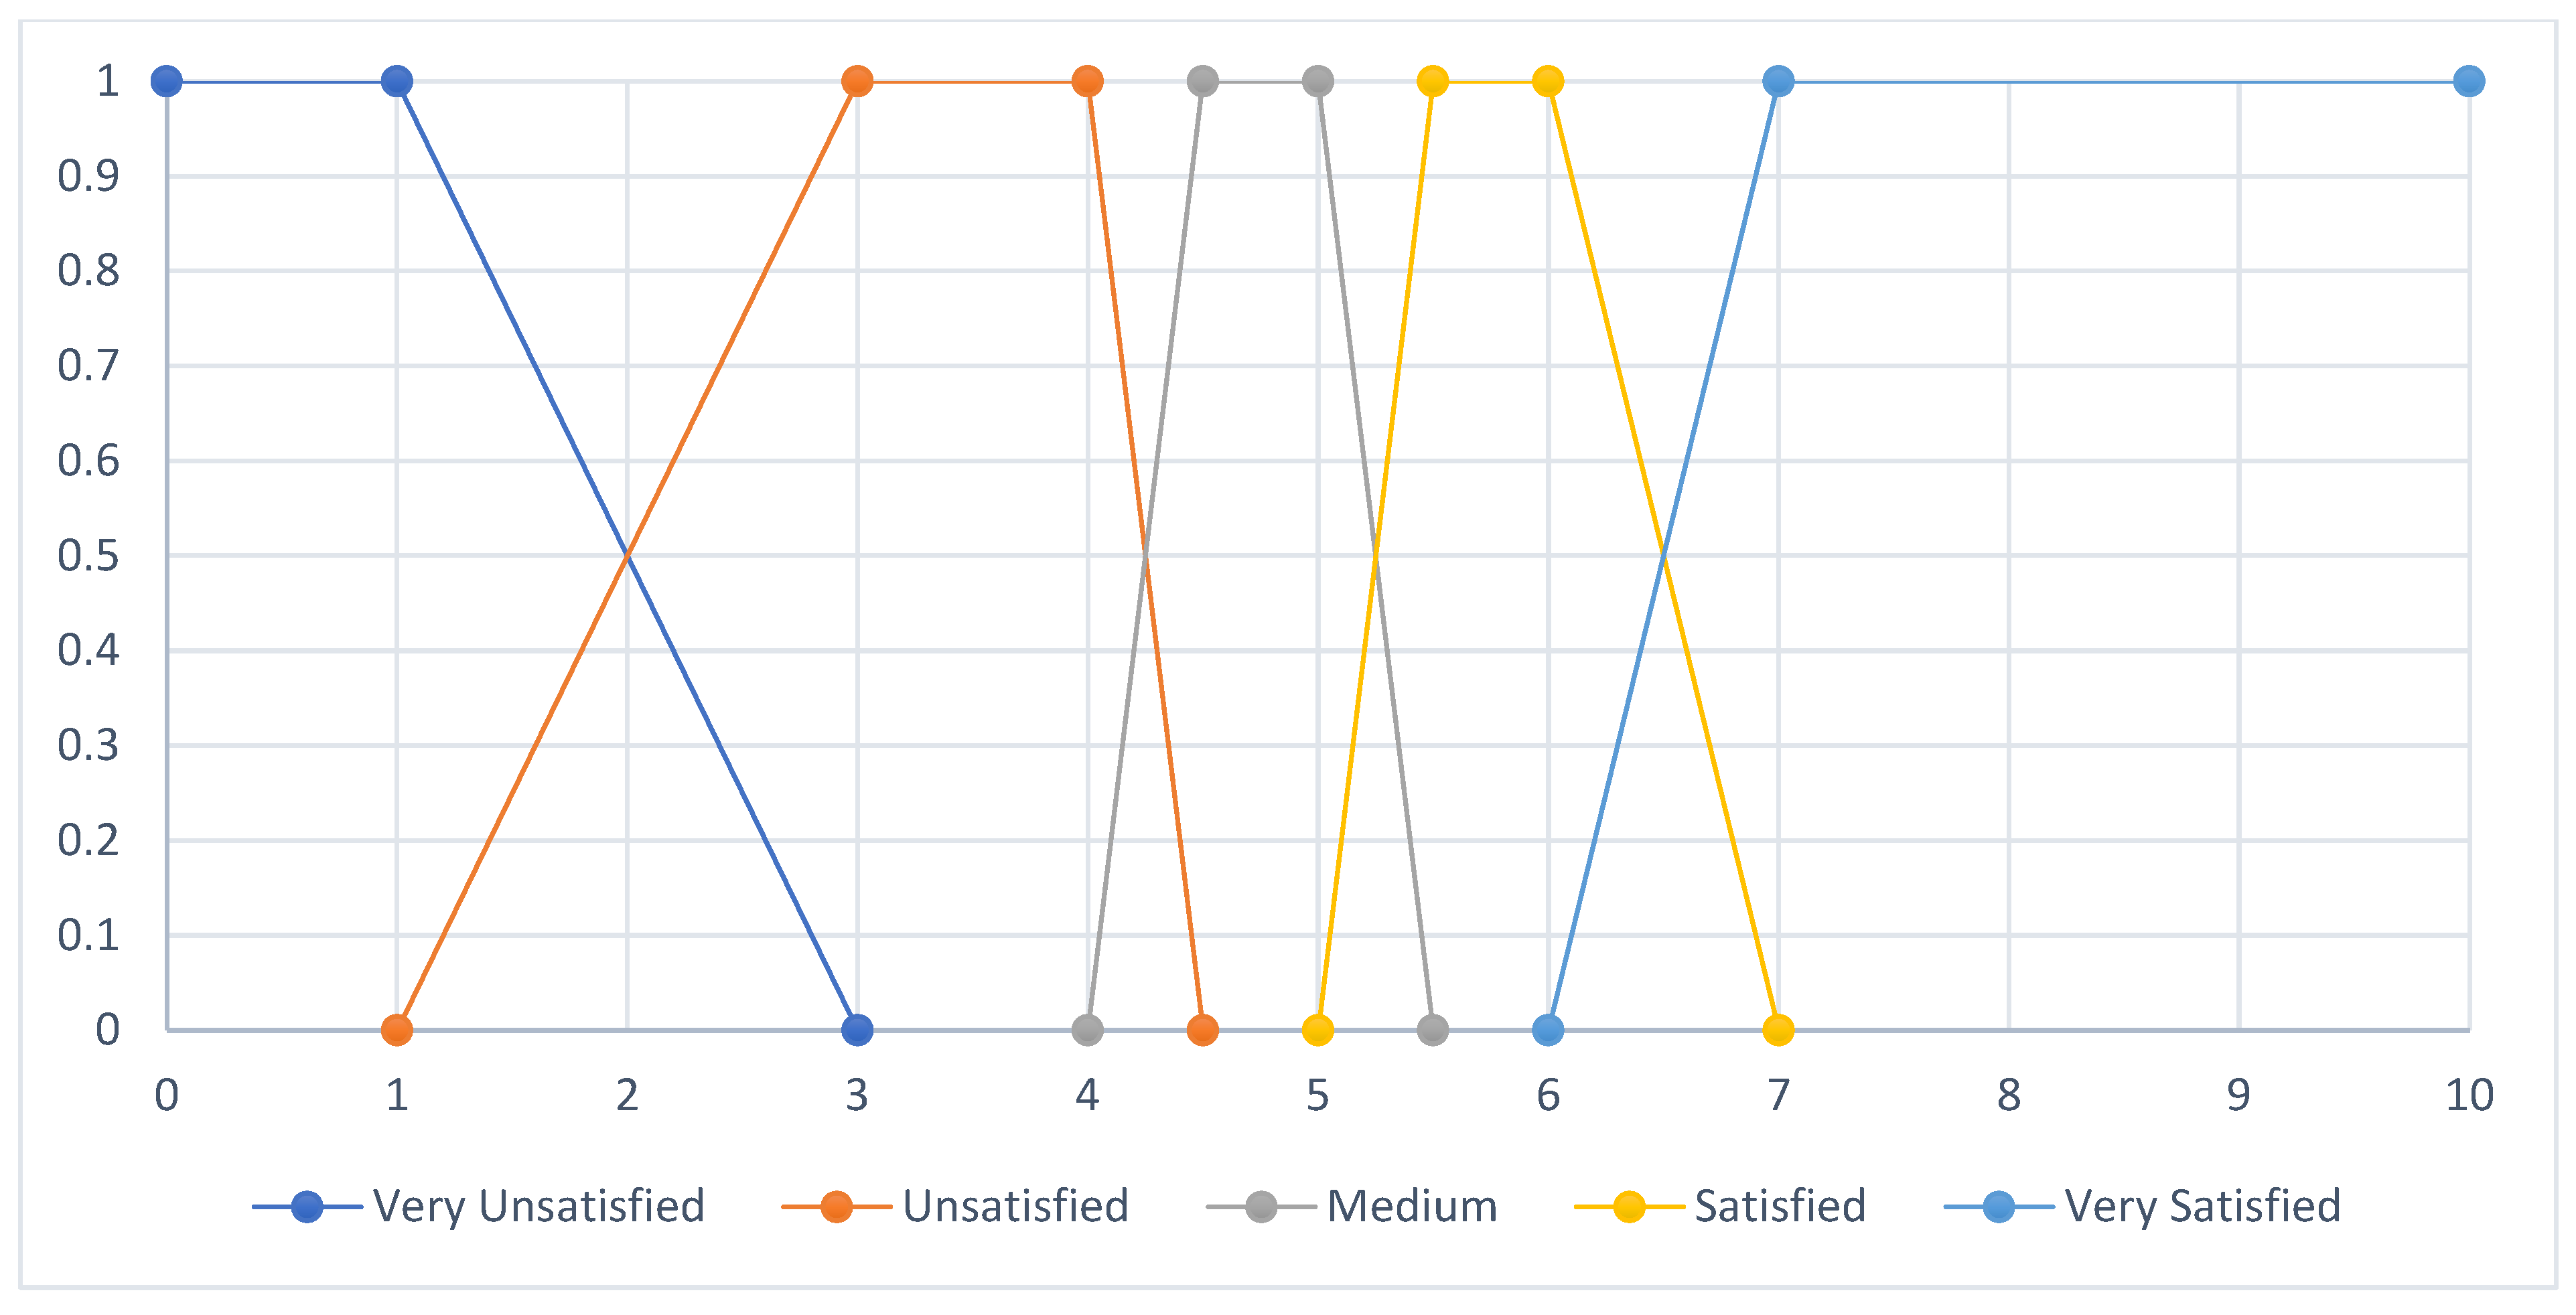
With regards to developing the OUPS, its questionnaire underwent many modifications to modify the time required to respond so that it can be taken in 10 to 15 min. In addition, how the questions were developed in the questionnaire was adjusted several times to achieve the optimal clarity, directness, and reliability. One hundred experts in the FM, construction, and sustainability fields were contacted by email with 25 for each type of building (commercial, residential, industrial, and educational) and asked to fill in the questionnaire. The survey requests that the FM experts suggest ways to update buildings to become sustainable buildings and to develop an OSS for FM with which to assess and enhance the sustainability of existing buildings from the user’s perspective in commercial, residential and industrial buildings. These 100 FM experts had different levels of experience in updating buildings from conventional to sustainable, with randomly selected participants for each type of building. The experts were asked to identify the OUPS from the user’s perspective on the basis of a five-point Likert scale: Very Unsatisfied, Unsatisfied, Medium, Satisfied and Very Satisfied [from 1 (very dissatisfied) to 5 (very satisfied)] as shown in Figure 8. The average OUPSs using the five-point Likert scale were calculated for each type of building. Respondents were categorized into one of the following three main groups on the basis of their number of years of experience (less than 5 years, between 5 and 15, or more than 15), their level of education (Bachelor, Masters, or PhD), and whether they had upgraded a sustainable rating system (LEED, Green Globes, or BREEAM).

6. Model Implementation

The John Molson School of Business Building (MB) was selected as a certified LEED building to validate the developed user perspective assessment model. It is one of the major buildings at Concordia University in Montréal, Quebec, Canada. It was awarded silver level certification by the Canada Green Building Council. It is a 37,000-square-meter, 15-story building boasting a unique design that incorporates splendid atriums, up-to-date classrooms, a few systems administration spaces, a 300-seat auditorium, six amphitheaters, and two storm cellar levels connecting it with neighboring structures, as well as access to the metro network [62]. The building’s southwest sidewall is considered one of the first solar walls in the world. This solar wall allows the building to create more than 25 kW of electricity and 75 kW of heat. This amount of energy is sufficient to turn on 1250 CFL light bulbs and provide heat for seven Canadian homes for one year [62].
Table 3 displays categorization for the 25 respondents entitled to assess the OUPS in educational buildings. It reports their years of experience, education level, and the sustainable rating system according to which each expert updates the buildings they assess. 
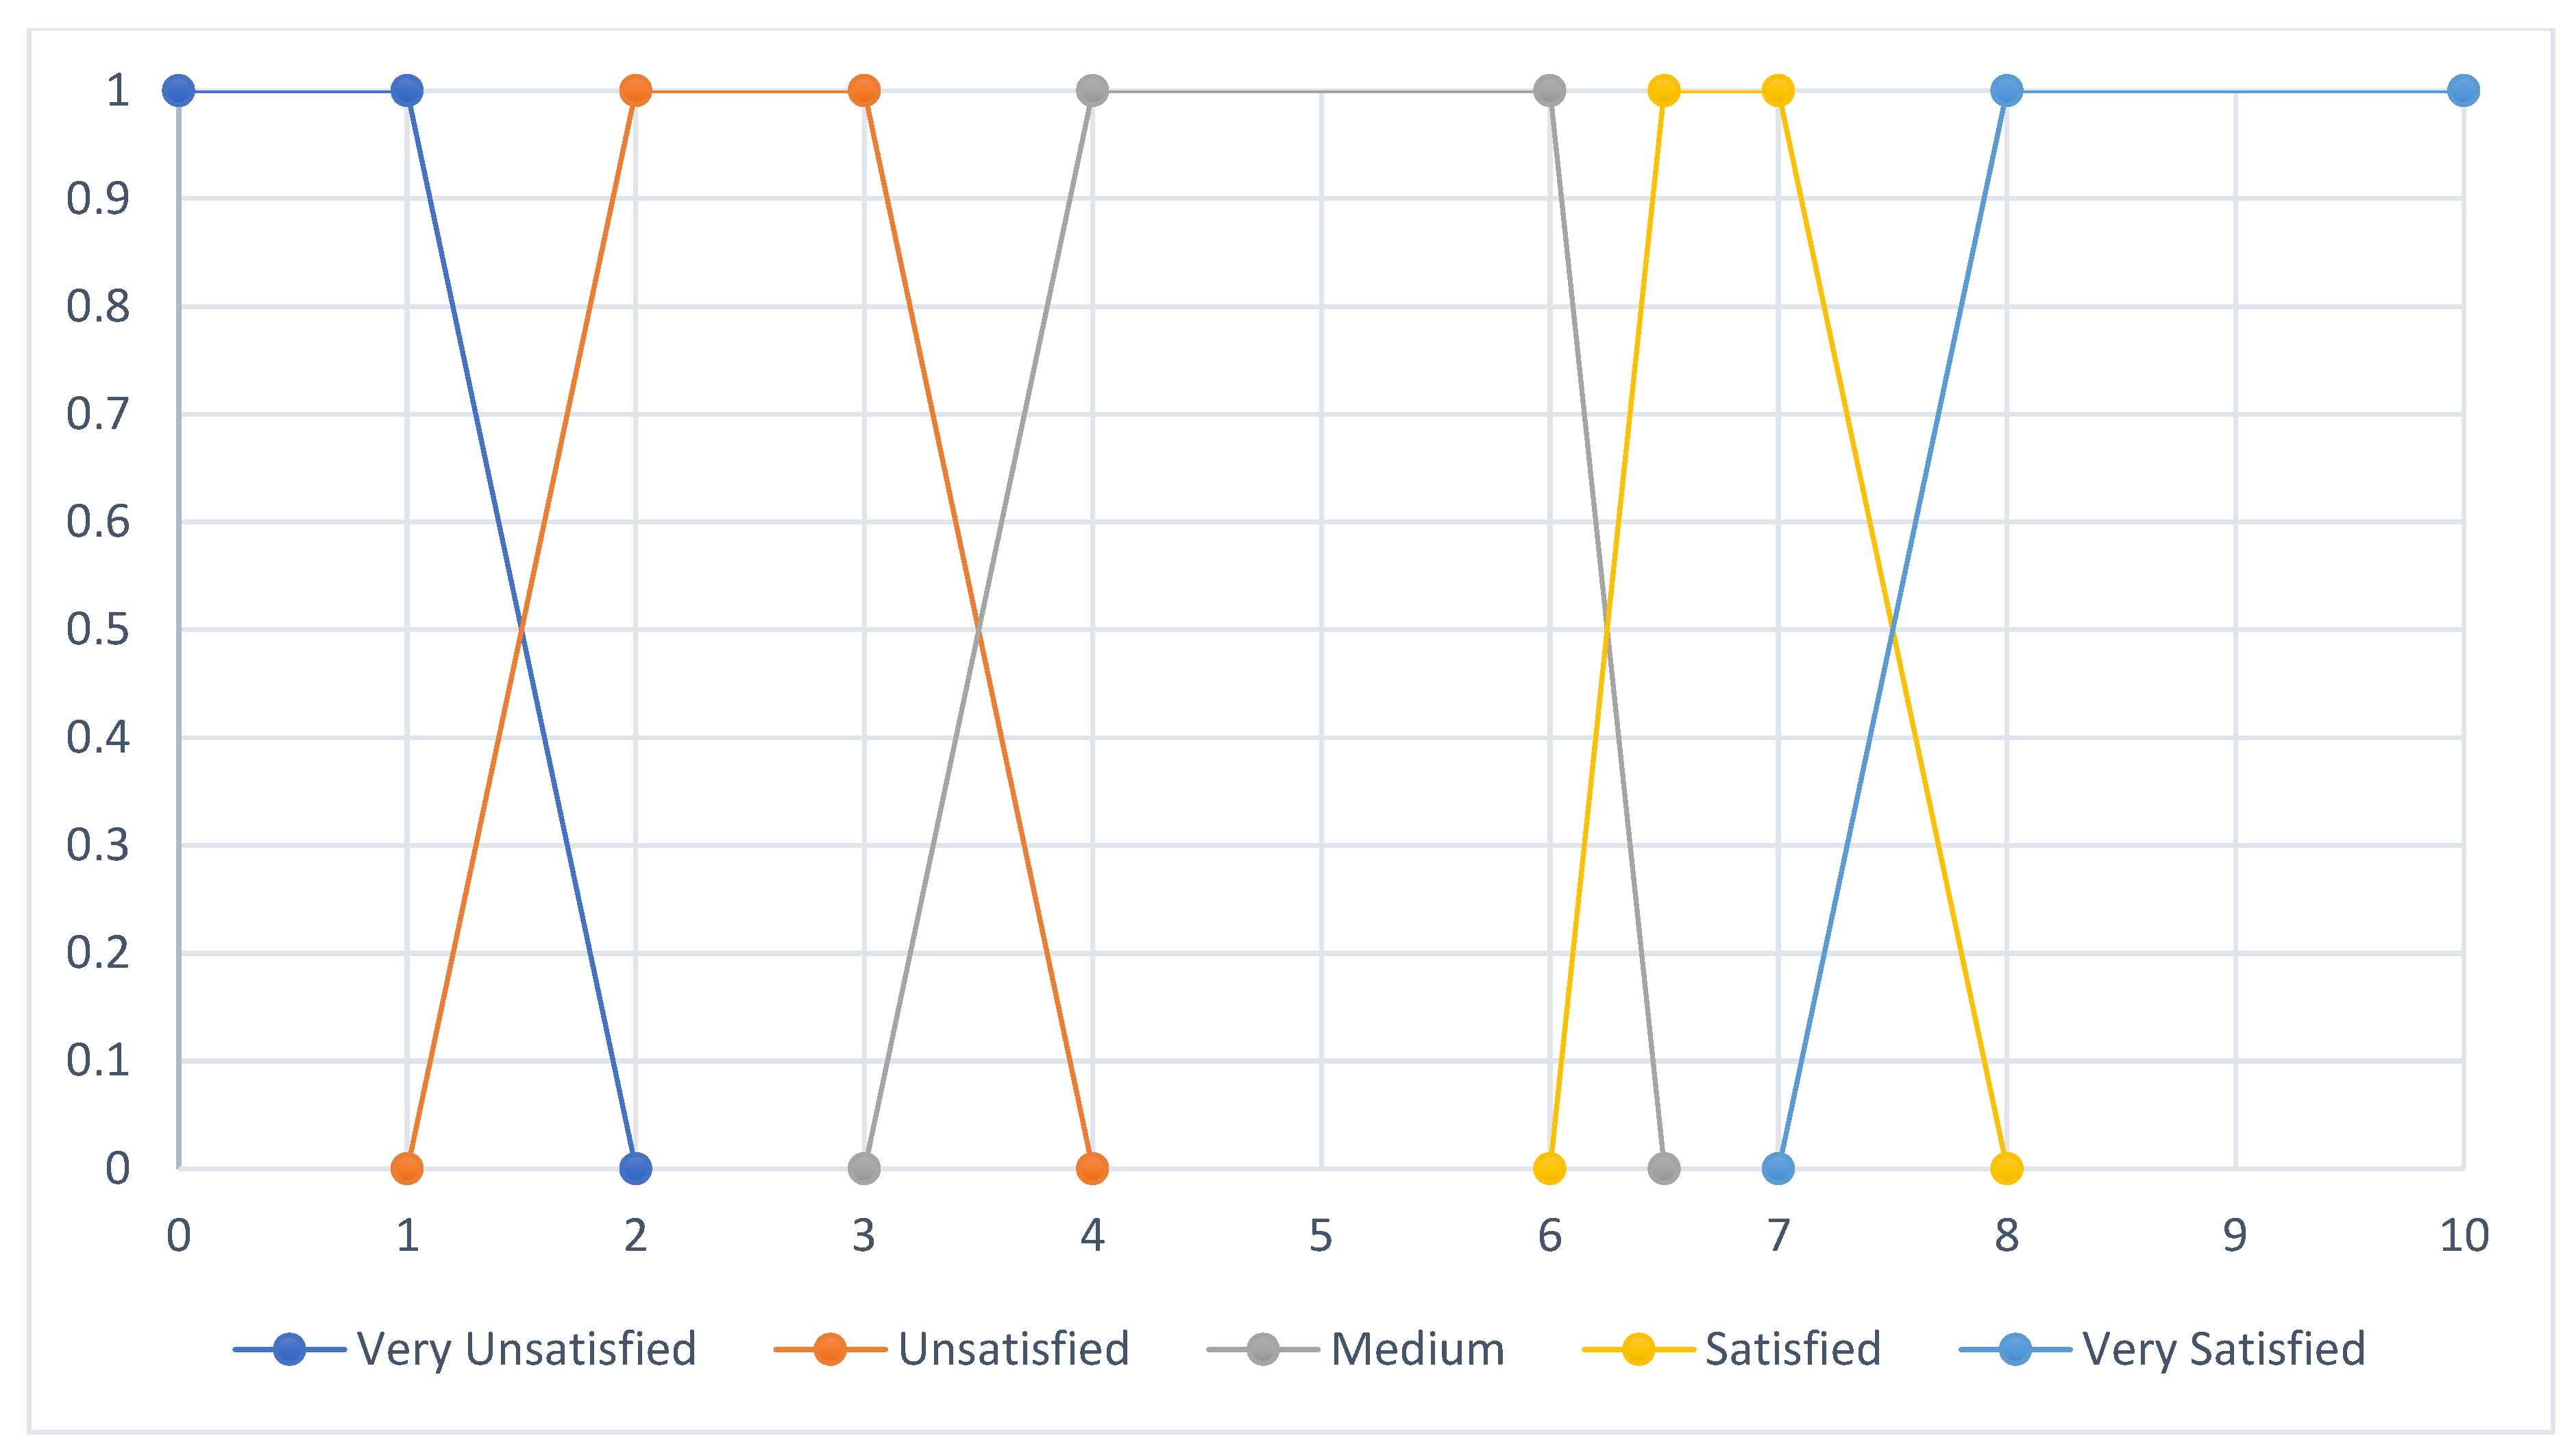
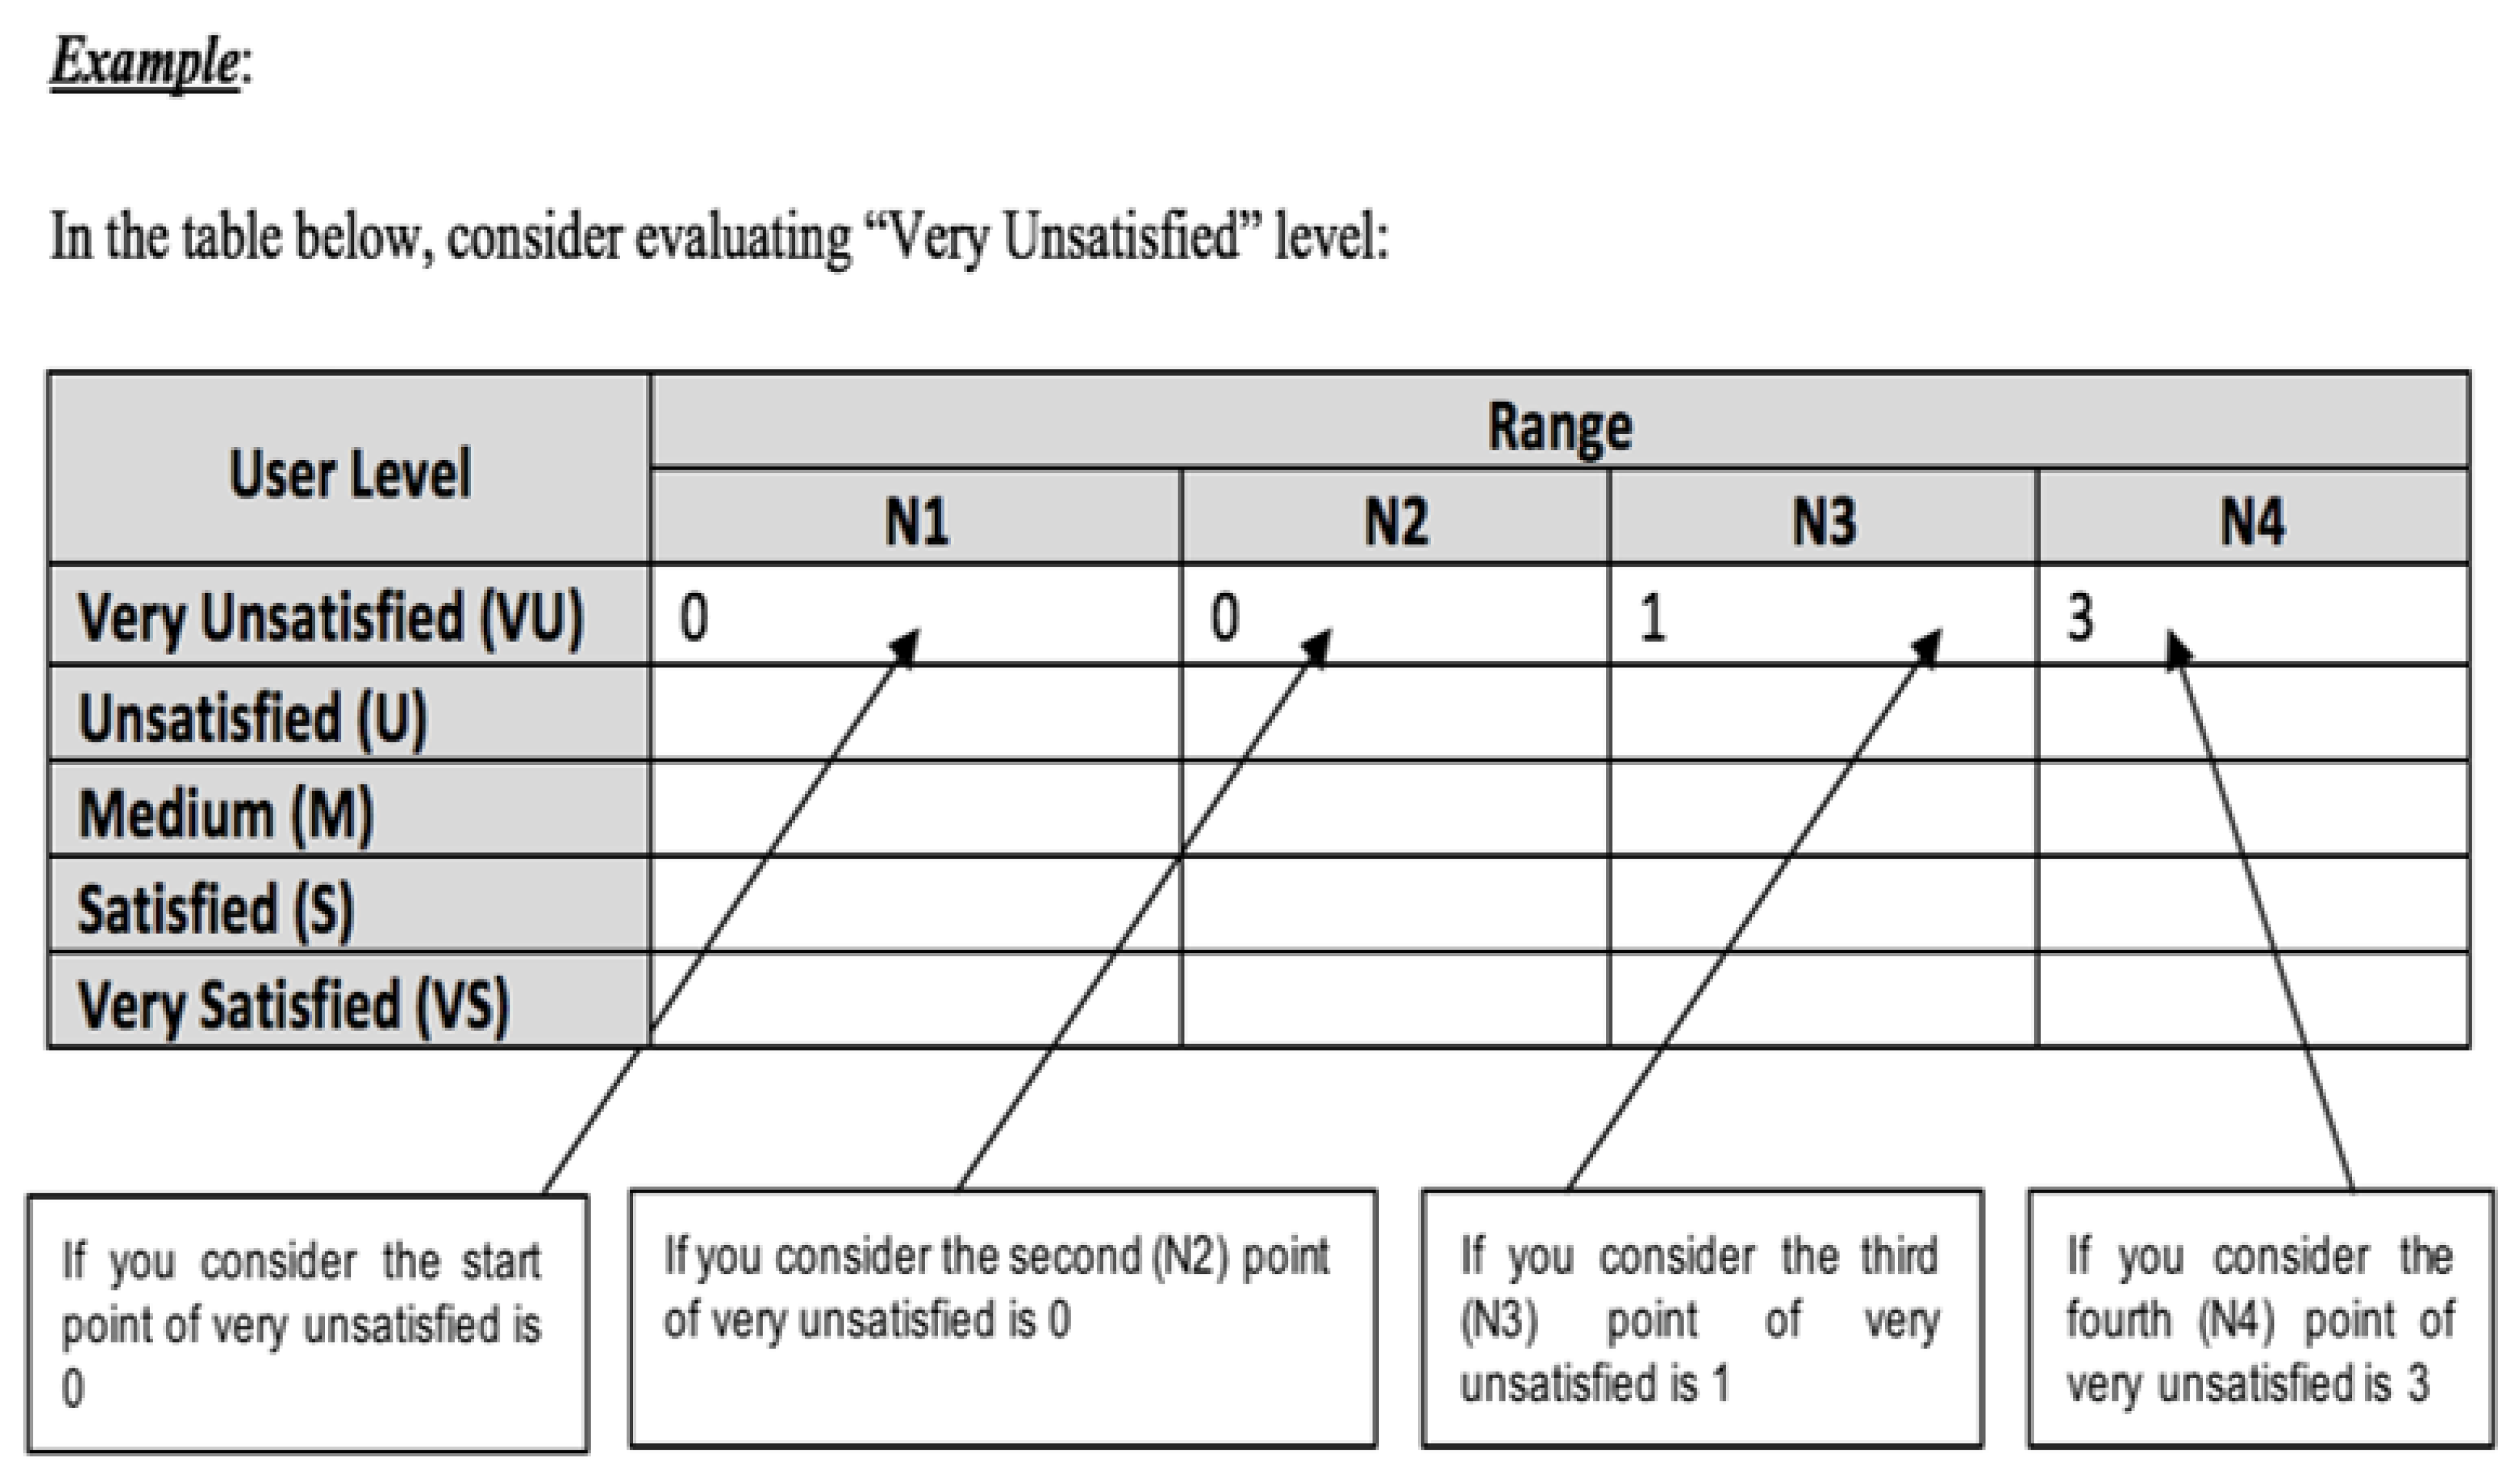
Figure 9 shows a representation of the triangular fuzzy number of the OUPS. Table 4 reports the boundaries and significance of each respective range in the OUPS. If the overall user perspective index is less than 2.5, this corresponds to the “Very Unsatisfied” level. If it is between 2.5 and 5.75, this corresponds to the “Unsatisfied” level. “Medium” satisfaction occurs when the user perspective index is between 5.75 and 7.5, while the “Satisfied “category takes place when the user index is between 7.5 and 9.25. The users are very satisfied when the user perspective index is more than 9.25. It was found that 60% of the FM experts said that, if the overall user perspective scale scores are in the unsatisfied level or below, then the building is considered an unsatisfactory building from the user’s perspective. However, 24% and 16% of the FM experts said that the medium and satisfied levels, respectively, indicate that a building is considered unsatisfactory from the user’s perspective. As a result, the unsatisfied level and lower is considered the minimum level of user satisfaction in educational buildings that requires an update.
Cronbach’s alpha test [63] was applied to scrutinize the internal consistency and reliability among the relative importance responses provided by the experts. Table 5 reports the results of the reliability analysis based on Cronbach’s alpha test. It can be noticed that all the values of Cronbach’s alpha are above 0.7, thus the data collected from the pairwise comparison entries is considered as reliable [64,65]. Meanwhile, computing the relative importance weights of criteria and sub-criteria, the limited matrix was calculated by raising the weighted super matrix to a large power in a continuous process, until one output matrix equals the one preceding it. This limited matrix calculation process was performed using Microsoft Excel, which multiplied the weighted super matrix up to 256 times by itself until the numbers started to be stable. In terms of thermal comfort, Table 6 shows the relative importance weights of factors and sub-factors. It is indicated that thermal comfort (41%) is the most important factor, followed by aesthetics (22%), and then design and flexibility (21%), while the factor of lighting and acoustics (16%) had the least relative importance. At the level of sub-factors, it can be noted that the sub-factor of functions at comfortable humidity (14%) exhibited the highest level of importance, followed by responsive heating/cooling system (11%) and then feeling well-ventilated (7%), followed by degree of noise, ability to meet needs, openness and views to outside, brightness, contrast, glare, diffusion and color (1%). Table 7 shows the decision scores for the factors and sub-factors and indicates that when a factor or sub-factor is scored at level “U” or less, it is considered to be unsatisfactory. Table 6 indicates that within the thermal comfort category, three sub-factors were unsatisfactory according to the users’ perspectives: a responsive heating/cooling system, feeling well-ventilated, and how much control users have over their environment. However, in the lighting and acoustics category, most sub-factors were unsatisfactory from the users’ perspectives except for proper reverberation times throughout all frequencies, brightness, and colors. The user perspective index is computed capitalizing on the integration of the weights of the factors and sub-factors alongside the scores obtained for the building for each factor and sub-factor. It was found that the John Molson School of Business Building obtained an overall user index of 5.718, which corresponds to an unsatisfactory level of satisfaction, which implies the necessity of taking corrective actions.
In the absence of an integrated user’s perspective assessment tool that assesses the user’s perspective of buildings, the procedures generated by Eweda [66] were utilized as a validation tool for the proposed research methodology. Eweda’s [
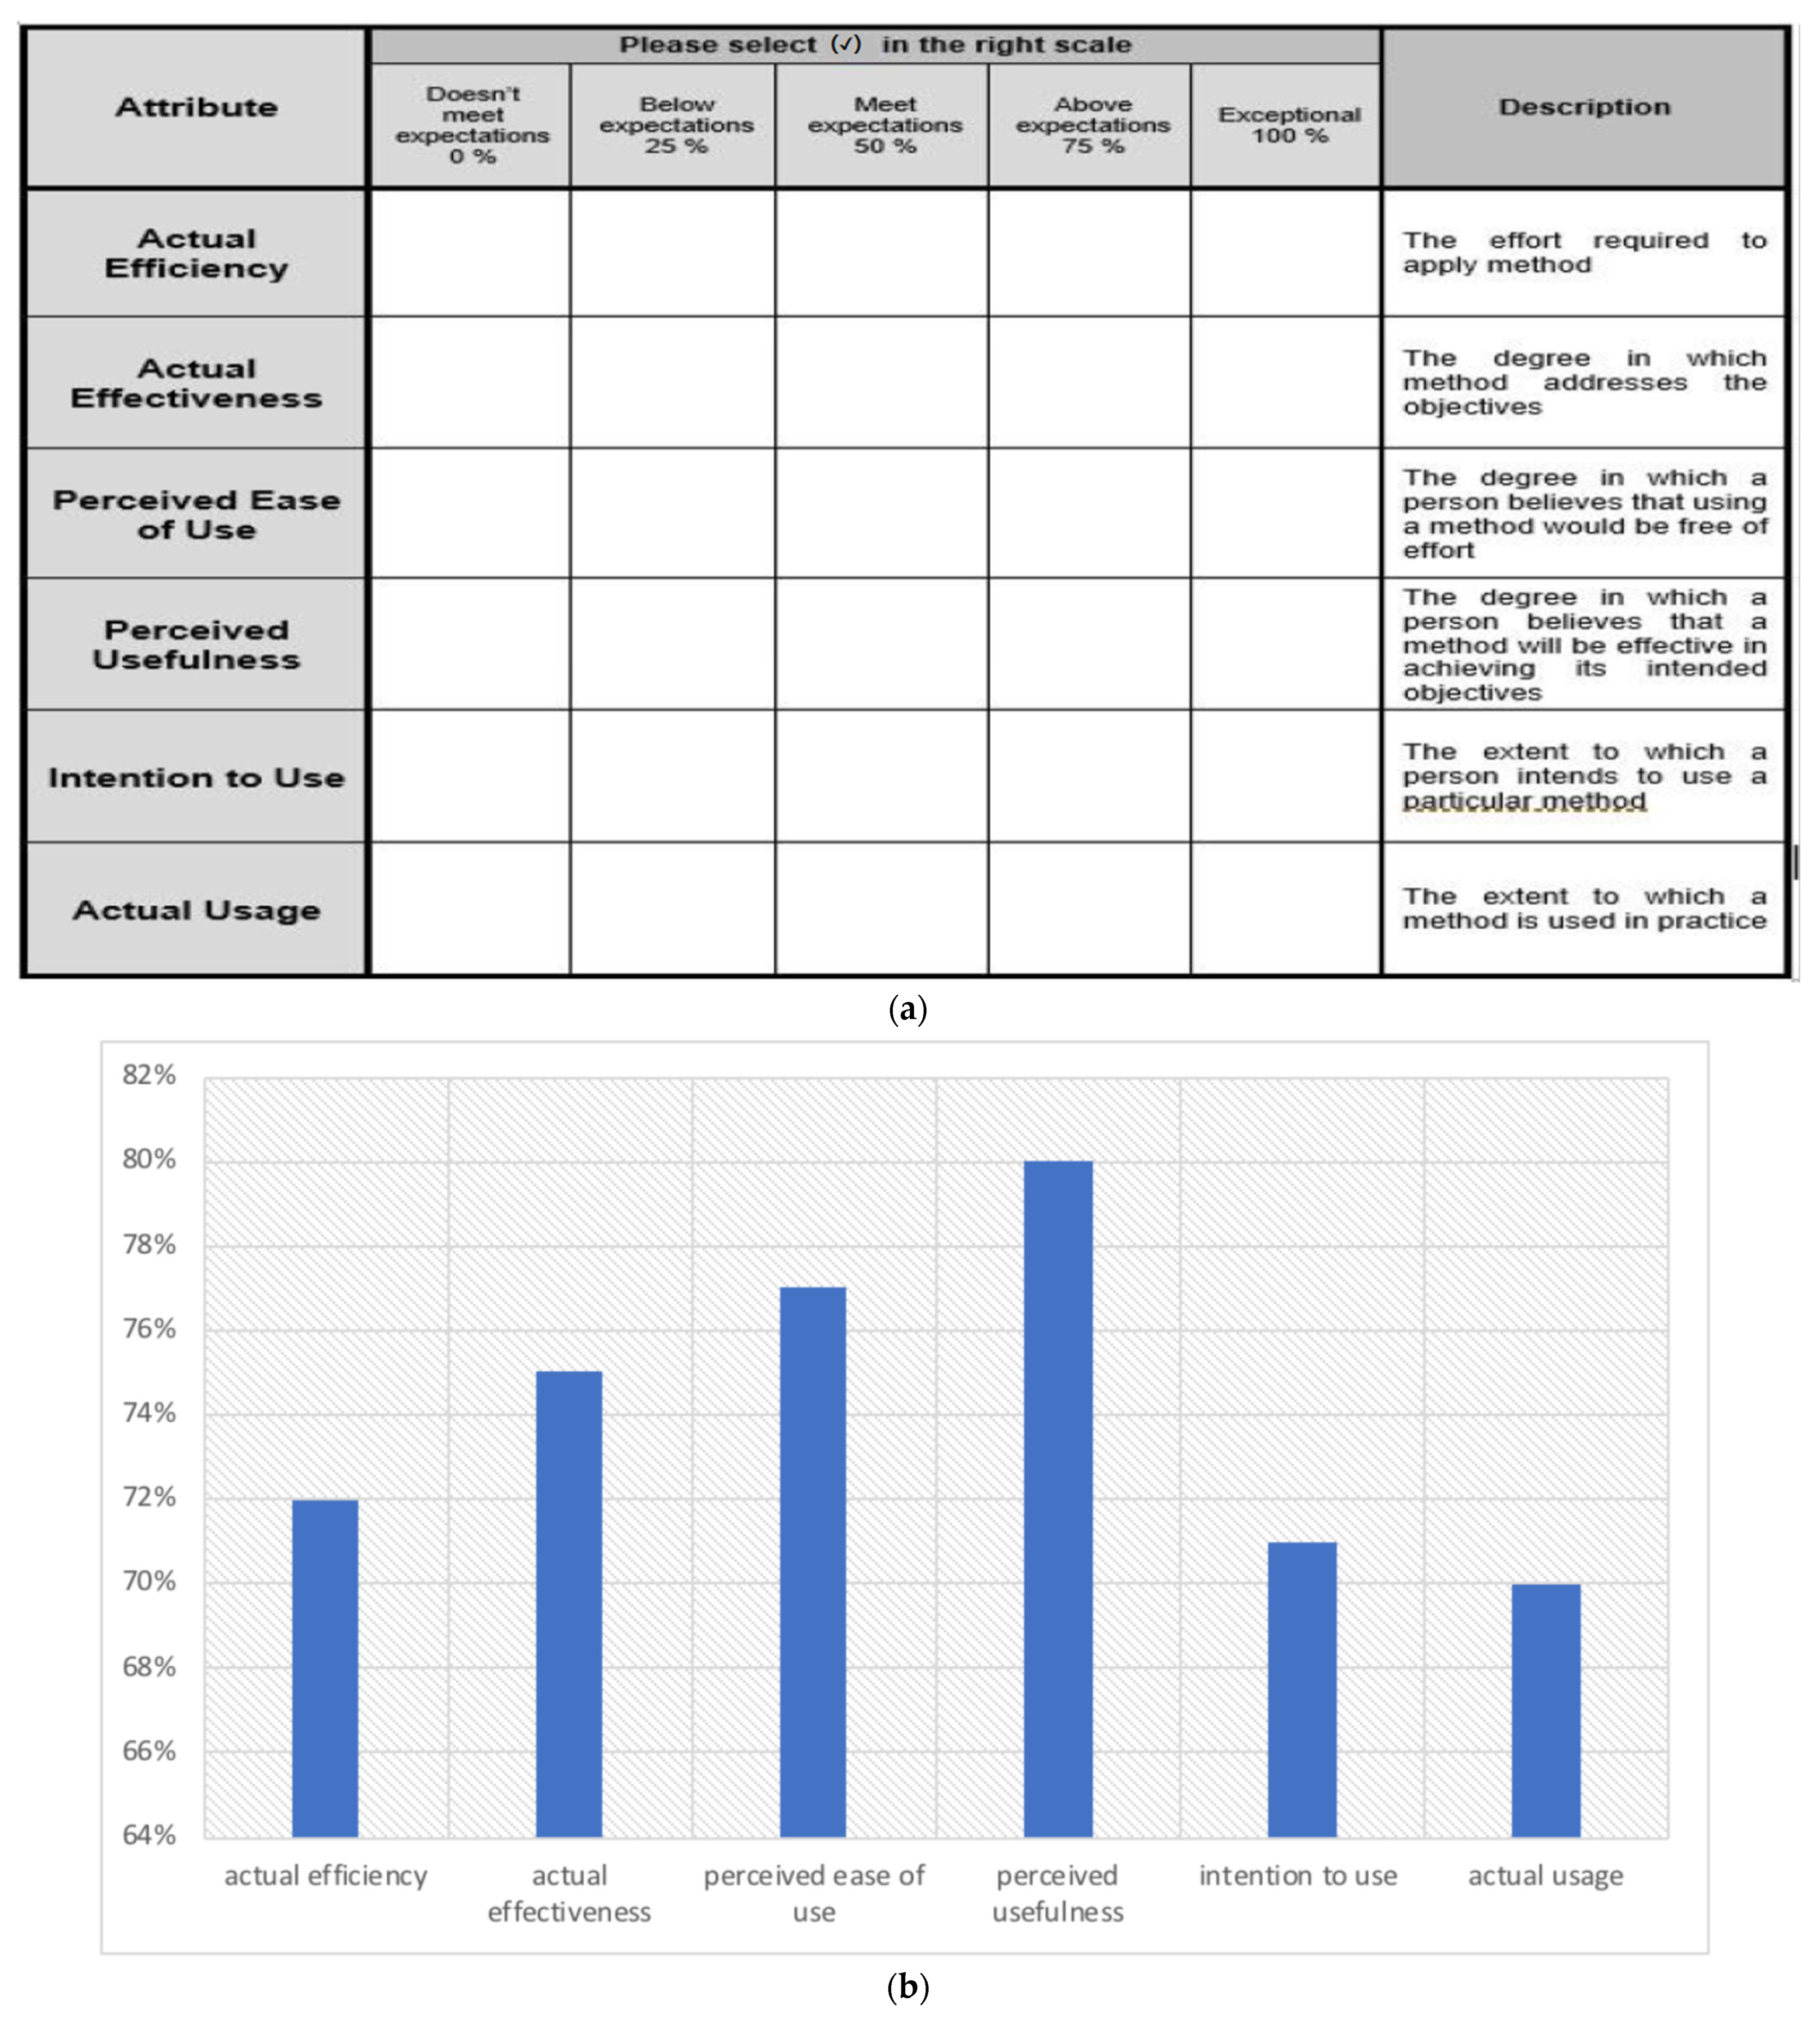
66] validation tool can be classified into six categories, as shown in Moody et al. [67] and as shown in Figure 10a. The validation was performed via a meeting with university facilities management staff and sustainability specialists. From the sample that was selected, 10 of them had participated in the previous evaluations and 11 of them had not participated, to ensure impartiality, as Figure 11 shows. Considering this chosen approach, it ensures impartiality and also shows if there are any differences in the validation results between the two groups. The reason that users do not participate in the model validation survey is that they often have difficulty deciding what to choose, especially since it needs professionals with great experience and practice to determine this. The meeting began with an introduction outlining the goals of the investigation, including the user perspective assessment tool and the calculation of its output. The introduction was followed by a question period where the FMs asked about the inputs and yields of the user’s perspective evaluation. All the information needed to evaluate the model was presented to the FM directors to obtain their feedback on this proposed evaluation technique, as well as to show the model’s performance (outlined in Figure 10). The FM reviewers made their assessments based on six quality terms, from “doesn’t meet expectations” to “exceptional”. The information collected from these managers was analyzed to assess the technique and its potential for future use. After its implementation, all six criteria scores obtained a score of at least 70%, and the model’s “perceived usefulness” achieved the highest score at 80% (as shown in Figure 10).

7. Analysis and Discussion

The findings of this study are discussed here, addressing the previously raised questions: (1) Is it necessarily true that if a building is considered sustainable, its users will be satisfied? and (2) How can the user perspective in sustainable buildings be assessed? A conceptual framework is presented to highlight the important issues regarding SFM and to discuss the usefulness of a structured methodological framework in analyzing a specific aspect of SFM. To answer question 1, the theoretical focus of this study was to explore and develop a model to determine the kinds of attributes that influence users’ satisfaction in sustainable post-secondary educational buildings. When the methodology was applied to a sustainable educational building (The John Molson School of Business Building, which has a LEED silver level certification), the data collection revealed that the economic and environmental aspects of SFM were strong predictors of the perceived importance of SFM. However, the findings showed that while the building had been recognized as a sustainable building, it did not achieve users’ perspective approval. The results revealed an MB user perspective index of 5.718, with thermal comfort and lighting and acoustics receiving 44% and 16%, respectively, as thesatisfaction levels. Therefore, it cannot be assumed that if a building is considered sustainable, its users will be satisfied. Owens and Legere [68] and White [69] have concluded that the understanding of what is a sustainable building is still unclear and has to be investigated from different perspectives. Evidence for this is that there is a wide range of definitions of sustainability [70,71,72,73] which has made many researchers face a lot of confusion and uncertainty with the term sustainability [74,75]. The activities of users inside buildings are very important and should be given considerable attention by FMs, especially by incorporating the more complex behaviors of users when upgrading. SFM requires more than the effective use of natural resources within an economic framework. It must also include supporting users’ satisfaction so that the “human resources” can contribute to rather than impede a building’s sustainability [76,77,78,79,80,81,82].
As for question 2, the criteria discussed earlier in the data collection section were assessed for their importance for educational buildings’ user perspective [42,43,44,45,83,84]. Thermal comfort and air quality, aesthetics, design and flexibility, and lighting and acoustics were ranked as being the top five problem areas from the educational building-related user perspective [85], and some of these are also connected to building-related illnesses. Failure to achieve users’ thermal comfort in educational buildings is a serious problem that could lead to employee absenteeism and lower productivity. The OUPS can vary according to a building’s function. Based on the OUPS for educational buildings, 60 % of the FM expert respondents stated that if the OUPS scores are at the unsatisfied level (U) or below, then the building is considered unsatisfactory according to the users’ perspectives. However, these scores might be acceptable in other types of buildings, such as commercial, industrial, and residential buildings. Consequently, it appears worthwhile to evaluate the different levels of OUPS according to building type in order to represent the user perspective with respect to the sustainability of the building being considered, i.e., to determine under which circumstances should the user perspective be considered as satisfied with respect to each criterion. The OUPS is a useful tool for evaluating the sustainability of each type of building based on its respective set of criteria and sub-criteria that reflect the users’ perspective.

8. Conclusions

This work developed an integrated sustainable assessment for post-secondary educational buildings based on a user perception scale and index. This framework considers the factors and sub-factors that affect user perspective, in particular: (1) thermal comfort and air quality; (2) aesthetics, amenities and upkeep; (3) design and flexibility; and (4) lighting and acoustics. A case study of the John Molson building at Concordia University in Montreal, Quebec was used to implement the proposed model. The building’s data was gathered and presented to FM experts and professionals with relevant FM knowledge. The MB building was assessed to determine the impact of weighting and local context on user perspective assessment. The weighting method was generated using the fuzzy ANP. This research revealed the differences in the weights for each user’s perception assessment attribute (i.e., the factors and sub-factors) for each type of building, in this case, 40 % for thermal comfort, 22 % for aesthetics, 21 % for design and flexibility, and 16 % for lighting and acoustics. Using these weights, we were able to calculate the second tier, or the building index. For our case study involving a sustainable post-secondary educational buildings, the user perspective building index was 5.7, which reveals that the building is located in the unsatisfactory zone. Therefore, the building requires an upgrade. The BS will assist facility management to highlight the weaknesses and strengths of their buildings based on specific factors and sub-factors, and to identify the aspects to upgrade (or not) from the users’ perspectives. The model thus allows FMs to assess users’ perspectives on sustainable buildings by considering the four factors and their sub-factors via the introduced weighting scheme. In order to do the upgrade, an optimization process with respect to budget and time should be performed to optimize such allocation in order to achieve the best increased satisfaction of users. The primary contributions of the present research study lie in the following: (1) identification of the users’ perspective attributes that have a direct influence on the users’ perspective in existing buildings, and (2) development of a comprehensive weight-based user’s perspective model, which can be tailored to the building type (educational, commercial, industrial, or residential) of the assessed building through the weight determination of each design attribute.
For future study, it will be better to expand the size of the samples used for both users and FM experts. Also, it could include some other factors and sub-factors in order to have comprehensive factors for everything related to users in sustainable educational building. In addition, it will be better to suggest upgrade alternatives and associate them with cost and time. The factors that cause user dissatisfaction should be identified, and each factor or sub-factor that has a perspective level lower than medium should be considered for upgrade. Dissatisfaction factors should link with a set of possible solutions to evaluate and rank those solutions and select the highest ranked options. Two new terminologies were introduced, the OUPS and the BS. These new terminologies express the relativity of such assessments, that is, that the score of a building is based on a user perspective assessment ratio that lies between the BS and the OUPS. This ratio provides a way to integrate the entire user perspective assessment with the user perspective factors and their sub-factors, combined with the maximum available dedicated score for each building type. Combining the OUPS and the BS will give FMs the opportunity to customize the model based on building type. This feature will help FMs to make better-informed decisions when upgrading buildings, as it will allow them to compare the user perspective in their sustainable upgrade with the desired user perspective for that building type.

Author Contributions

G.A. and A.A.-S. developed the methodology and concept. E.M.A. aided in developing the methodology and concept. G.A., A.A.-S. and E.M.A. analyzed the findings and the results of the models and aided in writing the article. T.Z. supervised this study. All authors have read and agreed to the published version of the manuscript.

Funding

This research received no external funding.

Institutional Review Board Statement

Not applicable.

Informed Consent Statement

Not applicable.

Data Availability Statement

The data presented in this study are available on request from the corresponding author.

Conflicts of Interest

The authors declare no conflict of interest.

References

  1. United States Green Building Council. About USGBC. 2012. Available online: https://www.usgbc.org/about/mission-vision (accessed on 1 March 2016).
  2. United States Department of Energy. Green Buildings. 2003. Available online: http://www.sustainable.doe.gov/buildings/gbintro.shtml (accessed on 1 December 2017).
  3. Pu, S.; Vosselman, G. Knowledge based reconstruction of building models from terrestrial laser scanning data. ISPRS J. Photogramm. Remote Sens. 2009, 64, 575–584. [Google Scholar] [CrossRef]
  4. Wyatt, D.P.; Sobotka, A.; Rogalska, M. Towards a sustainable practice. Facilities 2000, 18, 76–82. [Google Scholar] [CrossRef]
  5. Schönborn, A.; Junge, R. Redefining ecological engineering in the context of circular economy and sustainable development. Circ. Econ. Sustain. 2021, 1, 375–394. [Google Scholar] [CrossRef]
  6. Fennimore, J.P. Sustainable Facility Management: Operational Strategies for Today; Pearson Education: London, UK, 2014; pp. 1–31. [Google Scholar]
  7. Allab, Y.; Pellegrino, M.; Guo, X.; Nefzaoui, E.; Kindinis, A. Energy and comfort assessment in educational building: Case study in a French university campus. Energy Build. 2017, 143, 202–219. [Google Scholar] [CrossRef]
  8. Ascione, F.; De Masi, R.F.; De Rossi, F.; Ruggiero, S.; Vanoli, G.P. NZEB target for existing buildings: Case study of historical educational building in Mediterranean climate. Energy Procedia 2017, 140, 194–206. [Google Scholar] [CrossRef]
  9. Musgrave, J.; Koukiasa, M. Sustainable facilities management within event venues. Worldw. Hosp. Tour. Themes 2011, 3, 217–228. [Google Scholar] [CrossRef]
  10. Amaral, A.R.; Rodrigues, E.; Gaspar, A.R.; Gomes, Á. Lessons from unsuccessful energy and buildings sustainability actions in university campus operations. J. Clean. Prod. 2021, 297, 126665. [Google Scholar] [CrossRef]
  11. Shafie, F.; Yusoff, W.Z.W.; Pawi, S. Users Satisfaction towards Facilities Management, FM Help Desk in Public Higher Educational Institutions in Malaysia. Adv. Manag. Appl. Econ. 2012, 2, 59–69. [Google Scholar]
  12. Aleixo, A.M.; Leal, S.; Azeiteiro, U.M. Conceptualization of sustainable higher education institutions, roles, barriers, and challenges for sustainability: An exploratory study in Portugal. J. Clean. Prod. 2018, 172, 1664–1673. [Google Scholar] [CrossRef]
  13. Abbaszadeh, S.; Zagreus, L.; Lehrer, D.; Huizenga, D. Occupant satisfaction with indoor environmental quality in green buildings Proceedings. Healthy Build. 2006, 3, 365–370. [Google Scholar]
  14. Chen, C.F.; Yilmaz, S.; Pisello, A.L.; De Simone, M.; Kim, A.; Hong, T.; Bandurski, K.; Bavaresco, M.V.; Liu, P.-L.; Zhu, Y. The impacts of building characteristics, social psychological and cultural factors on indoor environment quality productivity belief. Build. Environ. 2020, 185, 107189. [Google Scholar] [CrossRef]
  15. Al-Sakkaf, A.; Abdelkader, E.M.; Mahmoud, S.; Bagchi, A. Studying energy performance and thermal comfort conditions in heritage buildings: A case study of murabba palace. Sustainability 2021, 13, 12250. [Google Scholar] [CrossRef]
  16. Mahmoud, S.; Fahmy, M.; Mahdy, M.; Elwy, I.; Abdelalim, M. Comparative energy performance simulation for passive and conventional design: A case study in Cairo, Egypt. Energy Rep. 2020, 6, 699–704. [Google Scholar] [CrossRef]
  17. Abediniangerabi, B.; Makhmalbaf, A.; Shahandashti, M. Deep learning for estimating energy savings of early-stage facade design decisions. Energy AI 2021, 5, 100077. [Google Scholar] [CrossRef]
  18. Kim, S.; Aydin, B.; Kim, S. Simulation modeling of a photovoltaic-green roof system for energy cost reduction of a building: Texas case study. Energies 2021, 14, 5443. [Google Scholar] [CrossRef]
  19. Jalali, Z.; Noorzai, E.; Heidari, S. Design and optimization of form and facade of an office building using the genetic algorithm. Sci. Technol. Built Environ. 2020, 26, 128–140. [Google Scholar] [CrossRef]
  20. Habibi, S.; Obonyo, E.A.; Memari, A.M. Design and development of energy efficient re-roofing solutions. Renew. Energy 2020, 151, 1209–1219. [Google Scholar] [CrossRef]
  21. Abdallah, M.; Muddana, L.; Clevenger, C. Upgrading Large Existing Buildings to Maximize Their Sustainability. J. Archit. Eng. 2020, 26, 04019029. [Google Scholar] [CrossRef]
  22. Jalaei, F.; Jalaei, F.; Mohammadi, S. An integrated BIM-LEED application to automate sustainable design assessment framework at the conceptual stage of building projects. Sustain. Cities Soc. 2020, 53, 101979. [Google Scholar] [CrossRef]
  23. Eweda, A.; Al-Sakkaf, A.; Zayed, T.; Alkass, S. Condition assessment model of building indoor environment: A case study on educational buildings. Int. J. Build. Pathol. Adapt. 2021, 1–22. [Google Scholar] [CrossRef]
  24. Faqih, F.; Zayed, T. Defect-based building condition assessment. Build. Environ. 2021, 191, 107575. [Google Scholar] [CrossRef]
  25. Junghans, A.; Olsson, N. Discussion of facilities management as an academic discipline. Facilities 2014, 32, 67–79. [Google Scholar] [CrossRef]
  26. Ventovuori, T.; Lehtonen, T.; Salonen, A.; Nenonen, S. A review and classification of academic research in facilities management. Facilities 2007, 25, 227–237. [Google Scholar] [CrossRef]
  27. Okoli, C.; Schabram, K. A Guide to Conducting a Systematic Literature Review of Information Systems Research. Work. Pap. Inf. Syst. 2010, 10, 10–26. [Google Scholar] [CrossRef]
  28. ASHRAE. Thermal Environmental Conditions for Human Occupancy; American Society of Heating, Refrigerating and Air-Conditioning Engineers, Inc.: Atlanta, GA, USA, 2010; pp. 34–56. [Google Scholar]
  29. Dhaka, S.; Mathur, J.; Wagner, A.; Agarwal, G.D.; Garg, V. Evaluation of thermal environmental conditions and thermal perception at naturally ventilated hostels of undergraduate students in composite climate. Build. Environ. 2013, 66, 42–53. [Google Scholar] [CrossRef]
  30. Lee, J.Y.; Wargocki, P.; Chan, Y.H.; Chen, L.; Tham, K.W. How does indoor environmental quality in green refurbished office buildings compare with the one in new certified buildings? Build. Environ. 2020, 171, 106677. [Google Scholar] [CrossRef]
  31. Zadeh, L. Fuzzy sets. Inf. Control. 1965, 8, 338–353. [Google Scholar] [CrossRef]
  32. Ali, A.; Heneash, U.; Hussein, A.; Eskebi, M. Predicting Pavement Condition Index Using Fuzzy Logic Technique. Infrastructures 2022, 7, 91. [Google Scholar] [CrossRef]
  33. Hawari, A.; Alkadour, F.; Elmasry, M.; Zayed, T. Condition assessment model for sewer pipelines using fuzzy-based evidential reasoning. Aust. J. Civ. Eng. 2018, 16, 23–37. [Google Scholar] [CrossRef]
  34. Mazumder, R.K.; Salman, A.M.; Li, Y.; Yu, X. Asset Management Decision Support Model for Water Distribution Systems: Impact of Water Pipe Failure on Road and Water Networks. J. Water Resour. Plan. Manag. 2021, 147, 04021022. [Google Scholar] [CrossRef]
  35. Wang, Y.; Zhu, G. Analysis of reliability and belief degree for water distribution system based on fuzzy set theory. Urban Water J. 2021, 18, 497–509. [Google Scholar] [CrossRef]
  36. Maués, L.M.F.; do Nascimento, B.D.M.O.; Lu, W.; Xue, F. Estimating construction waste generation in residential buildings: A fuzzy set theory approach in the Brazilian Amazon. J. Clean. Prod. 2020, 265, 121779. [Google Scholar] [CrossRef]
  37. Lai, J.H.K.; Hou, H.; Edwards, D.J.; Yuen, P.L. An analytic network process model for hospital facilities management performance evaluation. Facilities 2022, 40, 333–352. [Google Scholar] [CrossRef]
  38. Ghoddousi, P.; Nasirzadeh, F.; Hashemi, H. Evaluating Highway Construction Projects’ Sustainability Using a Multicriteria Group Decision-Making Model Based on Bootstrap Simulation. J. Constr. Eng. Manag. 2018, 144, 04018092. [Google Scholar] [CrossRef]
  39. KamacI-Karahan, E.; Kemeç, S. Residents’ satisfaction in post-disaster permanent housing: Beneficiaries vs. non-beneficiaries. Int. J. Disaster Risk Reduct. 2022, 73, 102901. [Google Scholar] [CrossRef]
  40. Dodanwala, T.C.; San Santoso, D. The mediating role of job stress on the relationship between job satisfaction facets and turnover intention of the construction professionals. Eng. Constr. Archit. Manag. 2022, 29, 1777–1796. [Google Scholar] [CrossRef]
  41. Skitmore, M.; Xiong, B.; Xia, B.; Masrom, A.; Newton, S. Relationship between contractor satisfaction and project management performance. Constr. Econ. Build. 2020, 20, 1–24. [Google Scholar] [CrossRef]
  42. Heinzerling, D.; Schiavon, S.; Webster, T.; Arens, E. Indoor environmental quality assessment models: A literature review and a proposed weighting and classification scheme Proceedings. Build. Environ. 2013, 70, 210–222. [Google Scholar] [CrossRef]
  43. Zagreus, L.; Huizenga, C.; Arens, E.; Lehrer, D. Listening to the occupants: A Web-based indoor environmental quality survey. Int. J. Indoor Environ. Health 2004, 14, 65–74. [Google Scholar] [CrossRef]
  44. Roulet, C.-A.; Johner, N.; Foradini, F.; Bluyssen, P.; Cox, C.; De Oliveira Fernandes, E.; Müller, B.; Aizlewood, C. Perceived health and comfort in relation to energy use and building characteristics. Build. Res. Inf. 2006, 34, 467–474. [Google Scholar] [CrossRef]
  45. Edwards, B. Benefits of green offices in the UK: Analysis from examples built in the 1990s. Sustain. Dev. 2006, 14, 190–204. [Google Scholar] [CrossRef]
  46. Hebert, P.; Chaney, S. Using end-user surveys to enhance facilities design and management. Facilities 2012, 30, 458–471. [Google Scholar] [CrossRef]
  47. Agnieszka, Z. Parameters contributing to occupants’ satisfaction: Green and conventional residential buildings. Facilities 2014, 32, 411–437. [Google Scholar]
  48. Driza, P.; Park, N. Occupant satisfaction in LEED-certified higher education buildings. Smart Sustain. Built Environ. 2014, 3, 223–236. [Google Scholar] [CrossRef]
  49. Jailani, J.; Reed, R.; James, K. Examining the perception of tenants in sustainable office buildings. Prop. Manag. 2015, 33, 386–404. [Google Scholar] [CrossRef]
  50. Hassanain, M.; Iftikhar, A. Framework model for post-occupancy evaluation of school facilities. Struct. Surv. 2015, 33, 322–336. [Google Scholar] [CrossRef]
  51. Husin, H.; Nawawi, A.; Ismail, F.; Khalil, N. Improving safety performance through post occupancy evaluations (POE): A study of Malaysian low-cost housing. J. Facil. Manag. 2018, 16, 65–86. [Google Scholar] [CrossRef]
  52. Kaushik, A.; Arif, M.; Tumula, P.; Ebohon, O.J. Effect of thermal comfort on occupant productivity in office buildings: Response surface analysis. Build. Environ. 2020, 180, 107021. [Google Scholar] [CrossRef]
  53. Douglas, J. Principles of converting building. In Building Adaptation, 2nd ed.; Butterworth Heineman: Oxford, UK, 2006; pp. 96–141. [Google Scholar]
  54. Davis-Langdon. Opportunities for Existing Buildings. Deep Emission Cuts. In Innovative Thinking; Davis-Langdon: Sydney, Australia, 2008; pp. 25–44. [Google Scholar]
  55. Scruton, R.; Munro, T. Aesthetics. 2017. Available online: https://www.britannica.com/topic/aesthetics (accessed on 1 February 2018).
  56. Tayyebi, A. Harmony with Nature in Urban Space. In Proceedings of the International Seminar on Sustainable Tropical Environmental Design, Selangor, Malaysia, 26–27 November 2012; pp. 1–24. [Google Scholar]
  57. Srivastava, S.; Bansal, S. Measuring and Comparing Volume Flexibility across Indian Firms. Int. J. Bus. Perform. Manag. 2013, 14, 38–51. [Google Scholar] [CrossRef]
  58. Arieff, A. Sound Matters. How to Achieve Acoustic Comfort in the Contemporary Office. GSA Public Buildings Service. 2011. Available online: https://www.wbdg.org/FFC/GSA/gsa_soundmatters.pdf (accessed on 1 February 2018).
  59. Paul, R.J. Why users cannot “get what they want”. ACM SIGOIS Bull. 1993, 14, 8–12. [Google Scholar] [CrossRef]
  60. The Research Advisors. Sample Size Table. 2006. Available online: https://www.research-advisors.com/tools/SampleSize.htm (accessed on 1 February 2018).
  61. Saaty, T.L. Analytic network process. In Encyclopedia of Operations Research and Management Science; Springer: Boston, MA, USA, 2001; Volume 1, pp. 28–35. [Google Scholar]
  62. Athienitis, A.K.; Candanedo, J.A. Building integration of photovoltaic systems in cold climates. In Photonics North 2010; SPIE: Bellingham, WA, USA, 2010. [Google Scholar]
  63. Cronbach, L.J. Coefficient alpha and the internal structure of tests. Psychometrika 1951, 16, 297–334. [Google Scholar] [CrossRef]
  64. Dolphin, W.S.Y.; Alshami, A.A.M.; Tariq, S.; Boadu, V.; Mohandes, S.R.; Ridwan, T.; Zayed, T. Effectiveness of policies and difficulties in improving safety performance of repair, maintenance, minor alteration, and addition works in Hong Kong. Int. J. Constr. Manag. 2021, 1–17. [Google Scholar] [CrossRef]
  65. Madushika, W.H.S.; Perera, B.A.K.S.; Ekanayake, B.J.; Shen, G.Q.P. Key performance indicators of value management in the Sri Lankan construction industry. Int. J. Constr. Manag. 2020, 20, 157–168. [Google Scholar] [CrossRef]
  66. Eweda, A. An Integrated Condition Assessment Model for Educational Buildings Using BIM; Concordia University: Montreal, QC, Canada, 2012. [Google Scholar]
  67. Moody, D.L.; Sindre, G.; Brasethvik, T.; Solvberg, A. Evaluating the quality of information models: Empirical testing of a conceptual model quality framework. In Proceedings of the 25th International Conference on Software Engineering, Portland, OR, USA, 3–10 May 2003; pp. 295–305. [Google Scholar]
  68. Owens, K.A.; Legere, S. What do we say when we talk about sustainability? Analyzing faculty, staff and student definitions of sustainability at one American university. Int. J. Sustain. High. Educ. 2015, 16, 367–384. [Google Scholar] [CrossRef]
  69. White, M.A. Sustainability: I know it when I see it. Ecol. Econ. 2013, 86, 213–217. [Google Scholar] [CrossRef]
  70. Johnston, P.; Everard, M.; Santillo, D.; Robèrt, K.-H. Reclaiming the definition of sustainability. Environ. Sci. Pollut. Res. 2007, 14, 60–66. [Google Scholar]
  71. Filho, W.L. Dealing with misconceptions on the concept of sustainability. Int. J. Sustain. High. Educ. 2000, 1, 9–19. [Google Scholar] [CrossRef]
  72. Brown, B.J.; Hanson, M.E.; Liverman, D.M.; Meredith, R.W., Jr. Global sustainability: Toward definition. Environ. Manag. 1987, 11, 713–719. [Google Scholar] [CrossRef]
  73. Kates, R.W.; Parris, T.M.; Leiserowitz, A.A. What is sustainable development? Environment 2005, 47, 8–21. [Google Scholar]
  74. Marshall, J.D.; Toffel, M.W. Framing the elusive concept of sustainability: A sustainability hierarchy. Environ. Sci. Technol. 2005, 39, 673–682. [Google Scholar] [CrossRef]
  75. Becker, C.U. The meaning of sustainability. In Sustainability Ethics and Sustainability Research; Becker, C.U., Ed.; Springer: Dordrecht, The Netherlands, 2012; pp. 9–15. [Google Scholar]
  76. Shriberg, M. Institutional assessment tools for sustainability in higher education: Strengths, weaknesses, and implications for practice and theory. Int. J. Sustain. High. Educ. 2002, 3, 254–270. [Google Scholar] [CrossRef]
  77. Adler, A.; Armstrong, J.E.; Fuller, S.K.; Kalin, M.; Karolides, A.; Macaluso, J.; Walker, H.A. Green Building: Project Planning and Cost Estimating, 2nd ed.; R.S. Means: Kingston, MA, USA, 2006. [Google Scholar]
  78. Alshuwaikhat, H.M.; Abubakar, I. An integrated approach to achieving campus sustainability: Assessment of the current campus environmental management practices. J. Clean. Prod. 2008, 16, 1777–1785. [Google Scholar] [CrossRef]
  79. Gómez, F. Adaptable Model to Assess Sustainability in Higher Education: Application to Five Chilean Institutions. Master’s Thesis, Pontifical Catholic University of Chile, Santiago, Chile, 2013. [Google Scholar]
  80. Kamal, A.; Asmuss, M. Benchmarking tools for assessing and tracking sustainability in higher education institutions: Identifying an effective tool for University of Saskatchewan. Int. J. Sustain. High. Educ. 2013, 14, 449–465. [Google Scholar]
  81. Gupta, R.; Gregg, M. Empirical evaluation of the energy and environmental performance of a sustainably-designed but under-utilised institutional building in the UK. Energy Build. 2016, 128, 68–80. [Google Scholar] [CrossRef]
  82. Cole, L. Assessing Sustainability on Canadian University Campuses: Development of a Campus Sustainability Assessment Framework; Royal Roads University: Victoria, BC, Canada, 2003. [Google Scholar]
  83. Clements-Croome, D.J. Electromagnetic Environments and Health in Buildings; Routledge: London, UK, 2004. [Google Scholar]
  84. Altomonte, S.; Schiavon, S. Occupant satisfaction in LEED and non-LEED certified buildings. Build. Environ. 2013, 68, 66–76. [Google Scholar] [CrossRef]
  85. Wilkinson, S.; Reed, R. Office building characteristics and the links with carbon emissions. Struct. Surv. 2006, 24, 240–251. [Google Scholar] [CrossRef]
Figure 1. Framework of the developed integrated fuzzy-based assessment model.
Sustainability 14 09955 g001
Figure 2. Representation of a 3-state membership function.
Sustainability 14 09955 g002
Figure 3. Illustration of the user’s perspective with respect to temperature comfort criteria.
Sustainability 14 09955 g003
Figure 4. Five fuzzy linguistic variables for industrial buildings.
Sustainability 14 09955 g004
Figure 5. Five fuzzy linguistic variables for commercial buildings.
Sustainability 14 09955 g005
Figure 6. Pairwise comparison between the user’s perspective attributes.
Sustainability 14 09955 g006
Figure 7. The diversity of respondents among experts and users. (a) Experts’ distribution; (b) Users’ distribution.
Sustainability 14 09955 g007
Figure 8. Definition of the ranges of the OUPS.
Sustainability 14 09955 g008
Figure 9. Five fuzzy linguistic variables for educational buildings.
Sustainability 14 09955 g009
Figure 10. Validation of data collection and results. (a) Validation of data collection; (b) Validation of results.
Sustainability 14 09955 g010
Figure 11. Validation results for each group.
Sustainability 14 09955 g011
Table 2. Description of the OUPS for industrial buildings.
LabelCorrection Action CategoriesUsers Perspective Thresholds
Very UnsatisfiedAbsolutely necessary to take corrective action(s)X ≤ 1.5
UnsatisfiedNecessary to take corrective action(s)1.5 < X ≤ 3.5
MediumHigh priority to take corrective action(s)3.5 < X ≤ 6.25
SatisfiedUnnecessary to take corrective action(s)6.25 < X ≤ 7.5
Very SatisfiedNo corrective action is requiredX > 7.5
Table 3. Categorization of respondents for the educational building questionnaire.
ExpertsExperience (Years)OccupationLevel of EducationSustainable Rating System Feature
18Electrical MasterLEED
24CivilMasterLEED
32Mechanical BachelorGreen Globes
47ArchitectBachelorLEED
56CivilMasterGreen Globes
64Electrical MasterLEED
73Electrical BachelorLEED
82ArchitectBachelorBREEAM
97ArchitectMasterLEED
104MechanicalBachelorBREEAM
1115ArchitectMasterLEED
126CivilMasterGreen Globes
136MechanicalMasterGreen Globes
148ArchitectMasterLEED
154ElectricalMasterGreen Globes
162ArchitectBachelorLEED
1717ArchitectMasterGreen Globes
186ArchitectMasterLEED
193ElectricalBachelorLEED
204ArchitectMasterGreen Globes
217ArchitectBachelorLEED
225MechanicalMasterBREEAM
233CivilBachelorLEED
2416ArchitectMasterLEED
257ElectricalMasterLEED
Table 4. Description of the OUPS for educational buildings.
LabelCorrection Action CategoriesUsers Perspective Thresholds
Very UnsatisfiedAbsolutely necessary to take corrective action(s)X ≤ 2.5
UnsatisfiedNecessary to take corrective action(s)2.5 < X ≤ 5.75
MediumHigh priority to take corrective action(s)5.75 < X ≤ 7.5
SatisfiedUnnecessary to take corrective action(s)7.5 < X ≤ 9.25
Very SatisfiedNo corrective action is requiredX > 9.25
Table 5. Reliability analysis results of user’s perspective attributes.
Main AttributeCronbach’s Alpha
Thermal comfort and air quality0.85
Aesthetics, amenities, and up-keep0.83
Design and flexibility0.86
Lightening and acoustics0.85
Table 6. Description of the OUPS for educational buildings.
FactorsWeightSub-FactorsWeight
Thermal comfort and air quality41%Responsive heating/cooling system 11%
Functions at a comfortable humidity14%
Feels well ventilated7%
How much control users have over their environment 4%
Functions at a comfortable temperature5%
Aesthetics, amenities, and up-keep22%Visually appealing6%
Tidy in appearance5%
Containing up-to-date IT services4%
Having good quality common amenities3%
Having enough storage at their desk for personal items3%
Degree of noise1%
Design and flexibility21%The flexibility of the spaces6%
Conversational privacy in the offices7%
The circulation in the building4%
Interaction with different colleagues2%
Ability to meet needs1%
Openness and views to outside1%
Lighting and acoustics16%Good distribution of sound to all the spaces4%
Proper reverberation times throughout all frequencies3%
Natural sound diffusion and envelopment2%
A sense of intimacy for the audience2%
Brightness1%
Contrast1%
Glare1%
Diffusion1%
Color1%
Table 7. The satisfaction levels of the factors and sub-factors.
#FactorsDecision Score (SL)Sub-FactorsDecision Score (SL)
1Thermal comfort UResponsive heating/cooling system U
Functions at a comfortable humidityM
Feels well ventilatedU
How much control users have over their environment U
Functions at a comfortable temperatureM
2Design and flexibility MVisually appealingS
Tidy in appearanceS
Containing up-to-date IT servicesS
Having good quality common amenitiesS
Having enough storage at their desk for personal itemsS
Degree of noiseS
3Aesthetics MThe flexibility of the spaces S
Conversational privacy in the officesS
The circulation in the buildingS
Interaction with different colleaguesS
Ability to meet needsS
Openness and views to outsideS
4Lighting and acoustics UGood distribution of sound to all the spacesU
Proper reverberation times throughout all frequenciesM
Natural sound diffusion and envelopmentU
A sense of intimacy for the audienceU
BrightnessM
Contrast U
GlareU
Diffusion U
ColorM
Publisher’s Note: MDPI stays neutral with regard to jurisdictional claims in published maps and institutional affiliations.

