Article

An Advanced Multi-Agent Reinforcement Learning Framework of Bridge Maintenance Policy Formulation

1
Department of Civil Engineering, Hefei University of Technology, Hefei 230009, China
2
Department of Civil Engineering, The University of Hong Kong, Pokfulam, Hong Kong, China
*
Author to whom correspondence should be addressed.
Sustainability 2022, 14(16), 10050; https://doi.org/10.3390/su141610050
Submission received: 10 June 2022 / Revised: 22 July 2022 / Accepted: 3 August 2022 / Published: 13 August 2022
(This article belongs to the Special Issue Sustainable Development of Construction Engineering)

Abstract

:
In its long service life, bridge structure will inevitably deteriorate due to coupling effects; thus, bridge maintenance has become a research hotspot. The existing algorithms are mostly based on linear programming and dynamic programming, which have low efficiency and high economic cost and cannot meet the actual needs of maintenance. In this paper, a multi-agent reinforcement learning framework was proposed to predict the deterioration process reasonably and achieve the optimal maintenance policy. Using the regression-based optimization method, the Markov transition matrix can better describe the uncertain transition process of bridge components in the maintenance year and the real-time updating of the matrix can be realized by monitoring and evaluating the performance deterioration of components. Aiming at bridges with a large number of components, the maintenance decision-making framework of multi-agent reinforcement learning can adjust the maintenance policy according to the updated Markov matrix in time, which can better adapt to the dynamic change of bridge performance in service life. Finally, the effectiveness of the framework was verified by taking the simulation data of a simply supported beam bridge and a cable-stayed bridge as examples.

1. Introduction

Bridge structures are affected by environmental erosion, traffic loads, age, and other factors, which will lead to varying degrees of performance deterioration [1,2,3]. Knowing how to maintain bridges of different structural forms to ensure their normal function is a great challenge for engineers if there is no systematic decision-making scheme. Therefore, many countries have developed bridge management systems, such as PONTIS and BRIGIT in the United States, DANBRO in Denmark, SHBMS in South Korea, etc. [4,5,6,7,8], in which deterioration models and decision models are important components [9,10]. The deterioration model predicts the maintenance needs in the life cycle of the structure by evaluating the state distribution of components during the bridge maintenance period; the decision-making model formulates appropriate maintenance plans based on the prediction to maximize the cost effectiveness of the maintenance policy.
In traditional decision-making models, dynamic programming and linear programming algorithms are often used to obtain optimal maintenance policies [11,12,13]. However, for bridges with a large number of components, the solution process is usually expensive and inefficient [14]. Reinforcement learning (RL), as one of machine learning, provides a new idea for the development of maintenance policies in various fields, including bridge structures, because it can solve various tasks with a simple framework and can be applied efficiently without prior knowledge [15,16,17,18]. Based on the time-difference algorithm and Monte Carlo algorithm, the agent has a strong self-learning ability and can optimize policies by interacting with the environment [18,19]. There are two main methods to train the agents. One is the learning strategy function π ; after determining the optimal policy and inputting the current state observation value, the policy function can then output the probability of the corresponding maintenance action. Based on this, the maintenance action can be determined by random sampling. The other one is value learning, after obtaining the action-value function, for any given state, the value function can be used to score the long-term effect of all maintenance actions on the structure and select the action with the highest score.
In order to introduce RL into the decision-making process, it is particularly important to construct deterioration models that can accurately predict component performance changes and adapt to the agent training process. A general solution is to predict the random deterioration process of infrastructure components using Markov chain models [10]. In the model, the bridge component states are expressed in order [20], and the probabilities of Markov transition matrices are used to describe the deterioration process between adjacent states of the components [21,22]. Therefore, the future state of the bridge components can be determined once the transition matrix is determined. However, in many practical applications, the transition probability is estimated only by the relative transition frequency of the components’ state, which is determined based on historical data recorded by multiple visual inspections. The accuracy of the probability estimation cannot be guaranteed without considering the differences in inspection time intervals, environmental conditions, and the structural service life [20]. In this paper, a regression-based optimization method was proposed to estimate Markov transition probability by determining the hazard model of components [22,23], and Bayesian updating was used to improve the prediction accuracy of the deterioration model for component states.
The single-agent deep Q-Network based on RL provides bridge engineers with a systematic maintenance decision-making scheme [19]. The deterioration process of bridge performance is represented by the appropriate deterioration model. However, the number of hidden layers and related parameters of the neural network is very complicated by increasing the nodes of the neural network to cope with the huge number of components of the bridge structure, which requires high data volume. The convergence process is very slow, and the maintenance policy cannot be adjusted in time based on the updated deterioration model. The multi-agent framework is adopted to solve the problem. Researchers in various fields have tried to extend the existing single-agent to multi-agent [24,25,26], such as Modular Q-Learning in which a single agent problem is divided into different subproblems, and each agent solves different subproblems, Ant Q-Learning of which all the agents share reward, and Nash Q-Learning which has greatly improved the efficiency of Q-Learning algorithms [27,28,29]. In this paper, the training process is completed by multi-agent parallel mode, and the optimal maintenance policy of the bridge is output by calculating the return of the whole structure. The bridge components are divided into different structural categories according to the force form, material properties, traffic loads, environmental conditions, and other factors. The deterioration process of components in the same structural category can be predicted by the same deterioration matrix, and the single agent can complete the formulation of maintenance policies for all the components and then make decisions based on the same maintenance plan. The efficient training process can avoid dimensional disaster and the multi-agent framework can optimize the corresponding maintenance policy in real-time according to the changes in the component deterioration process.

2. Methodology

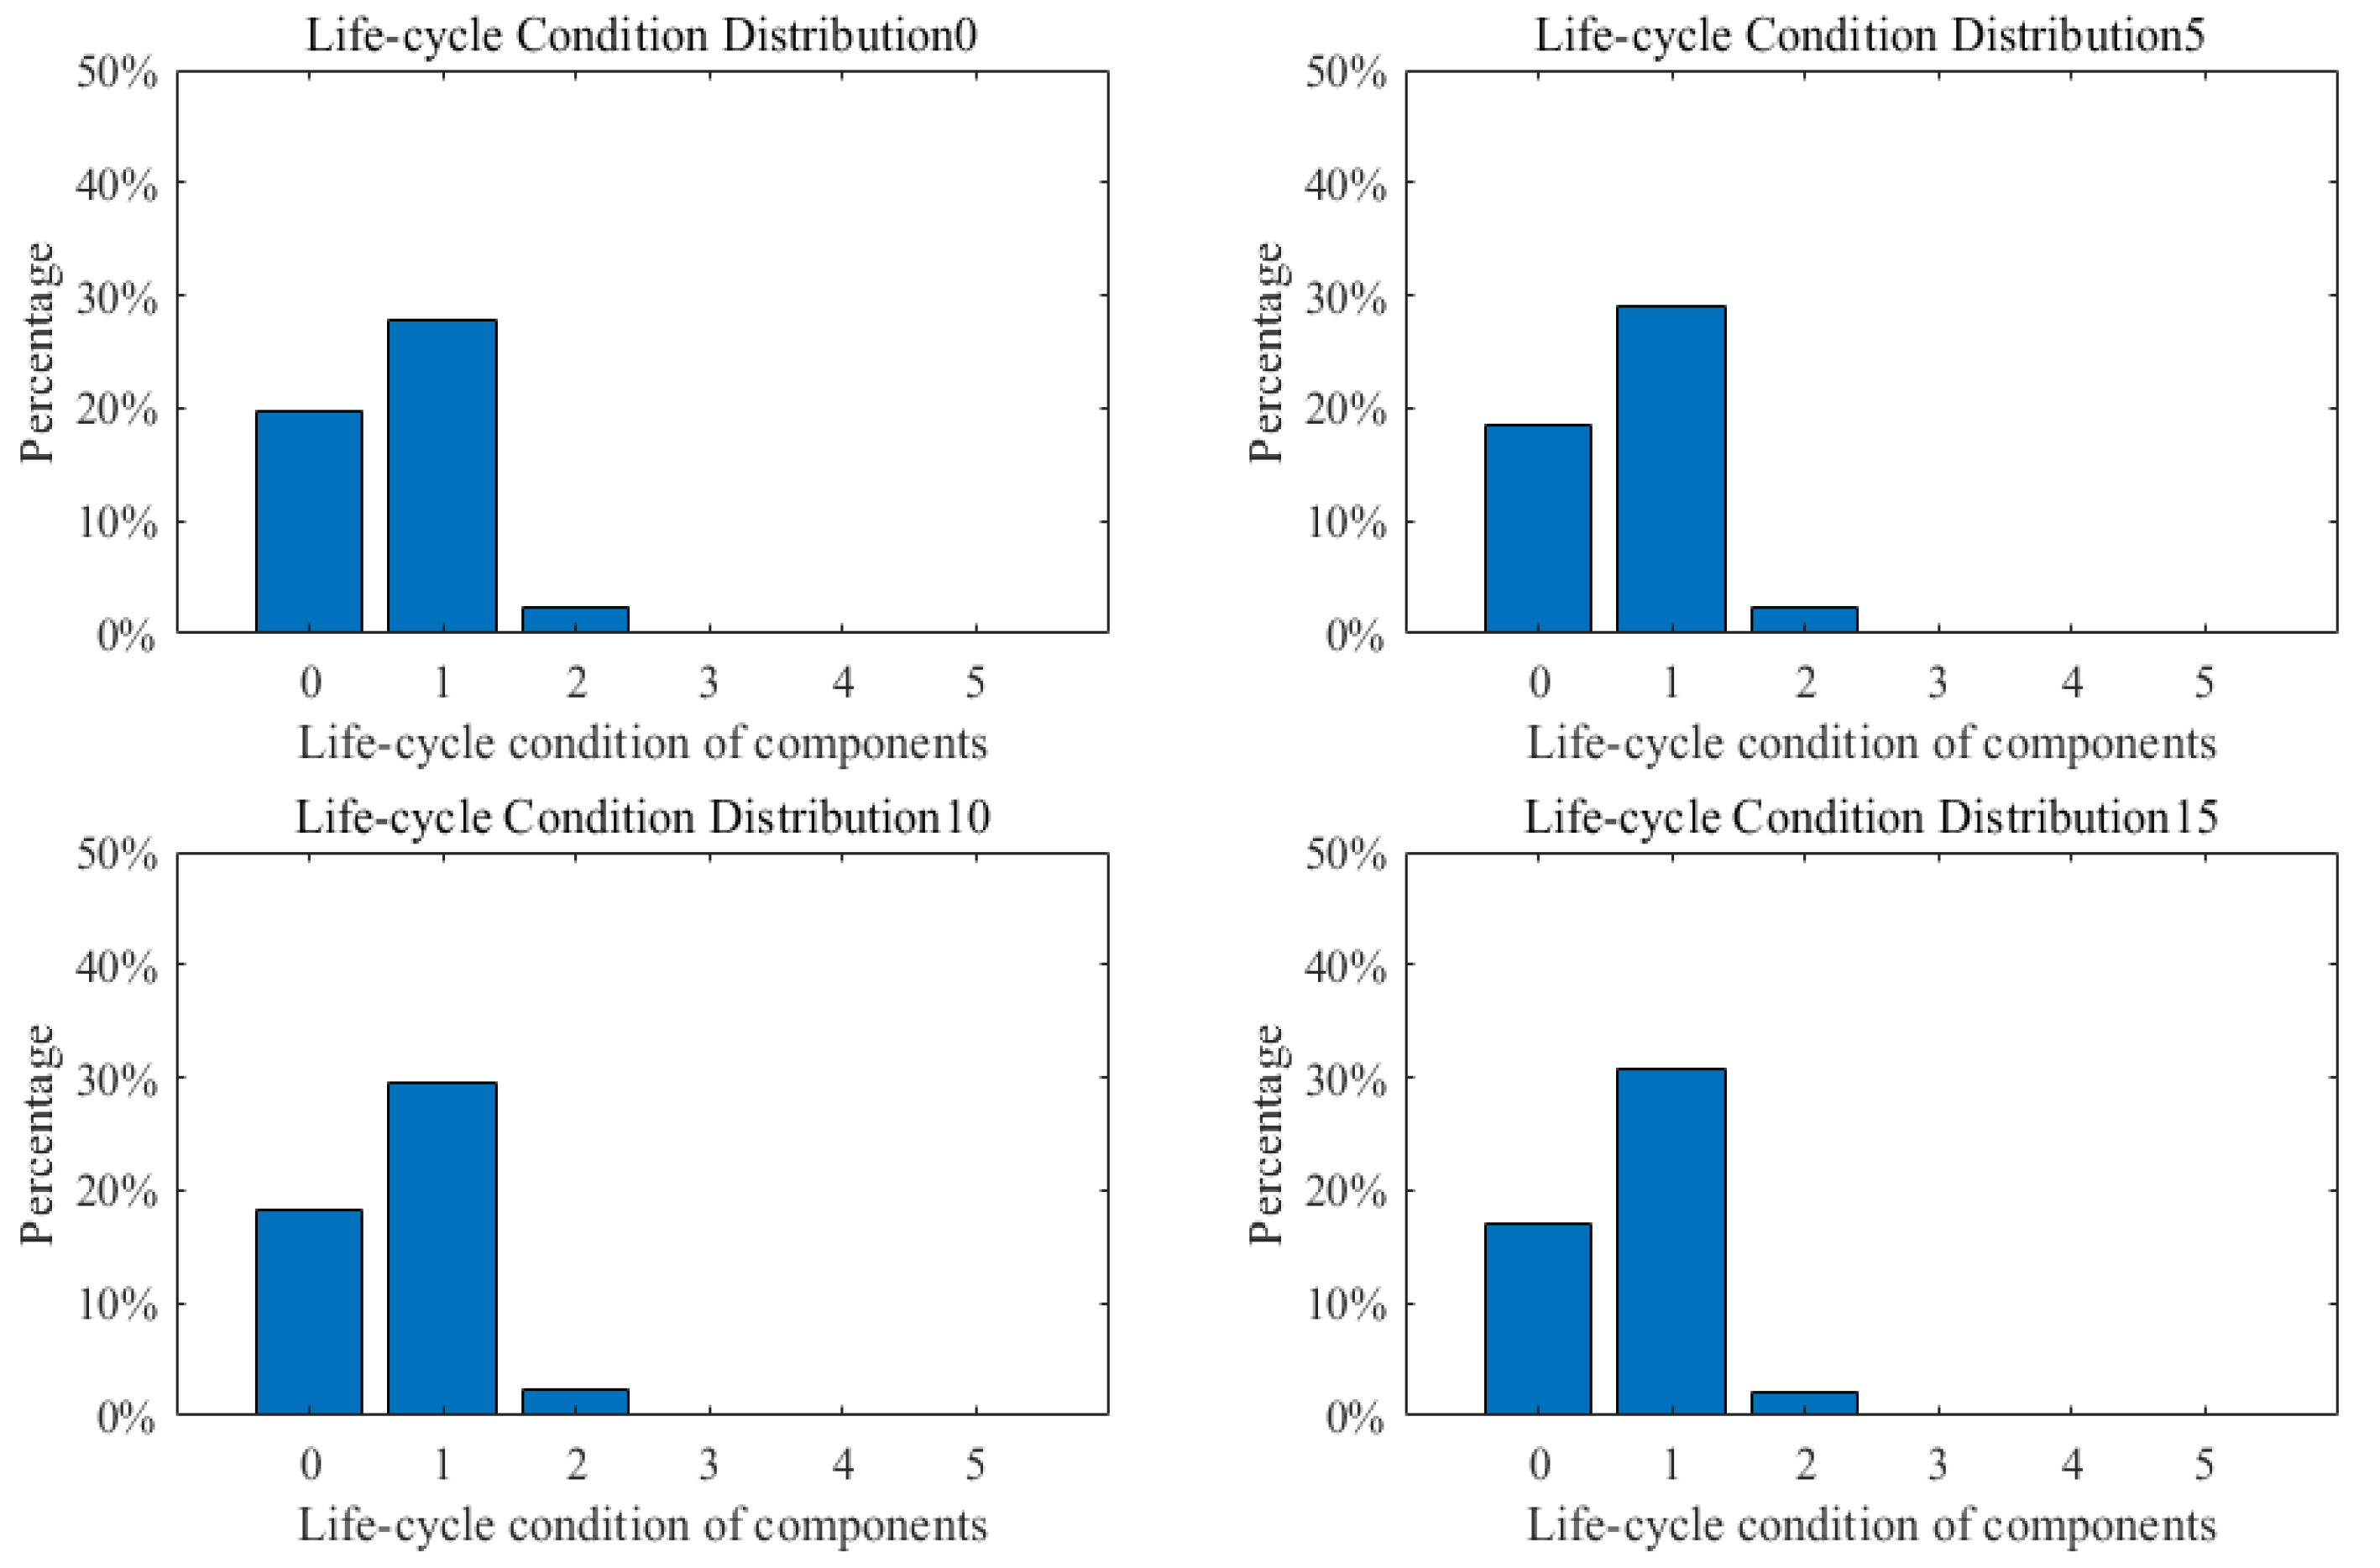
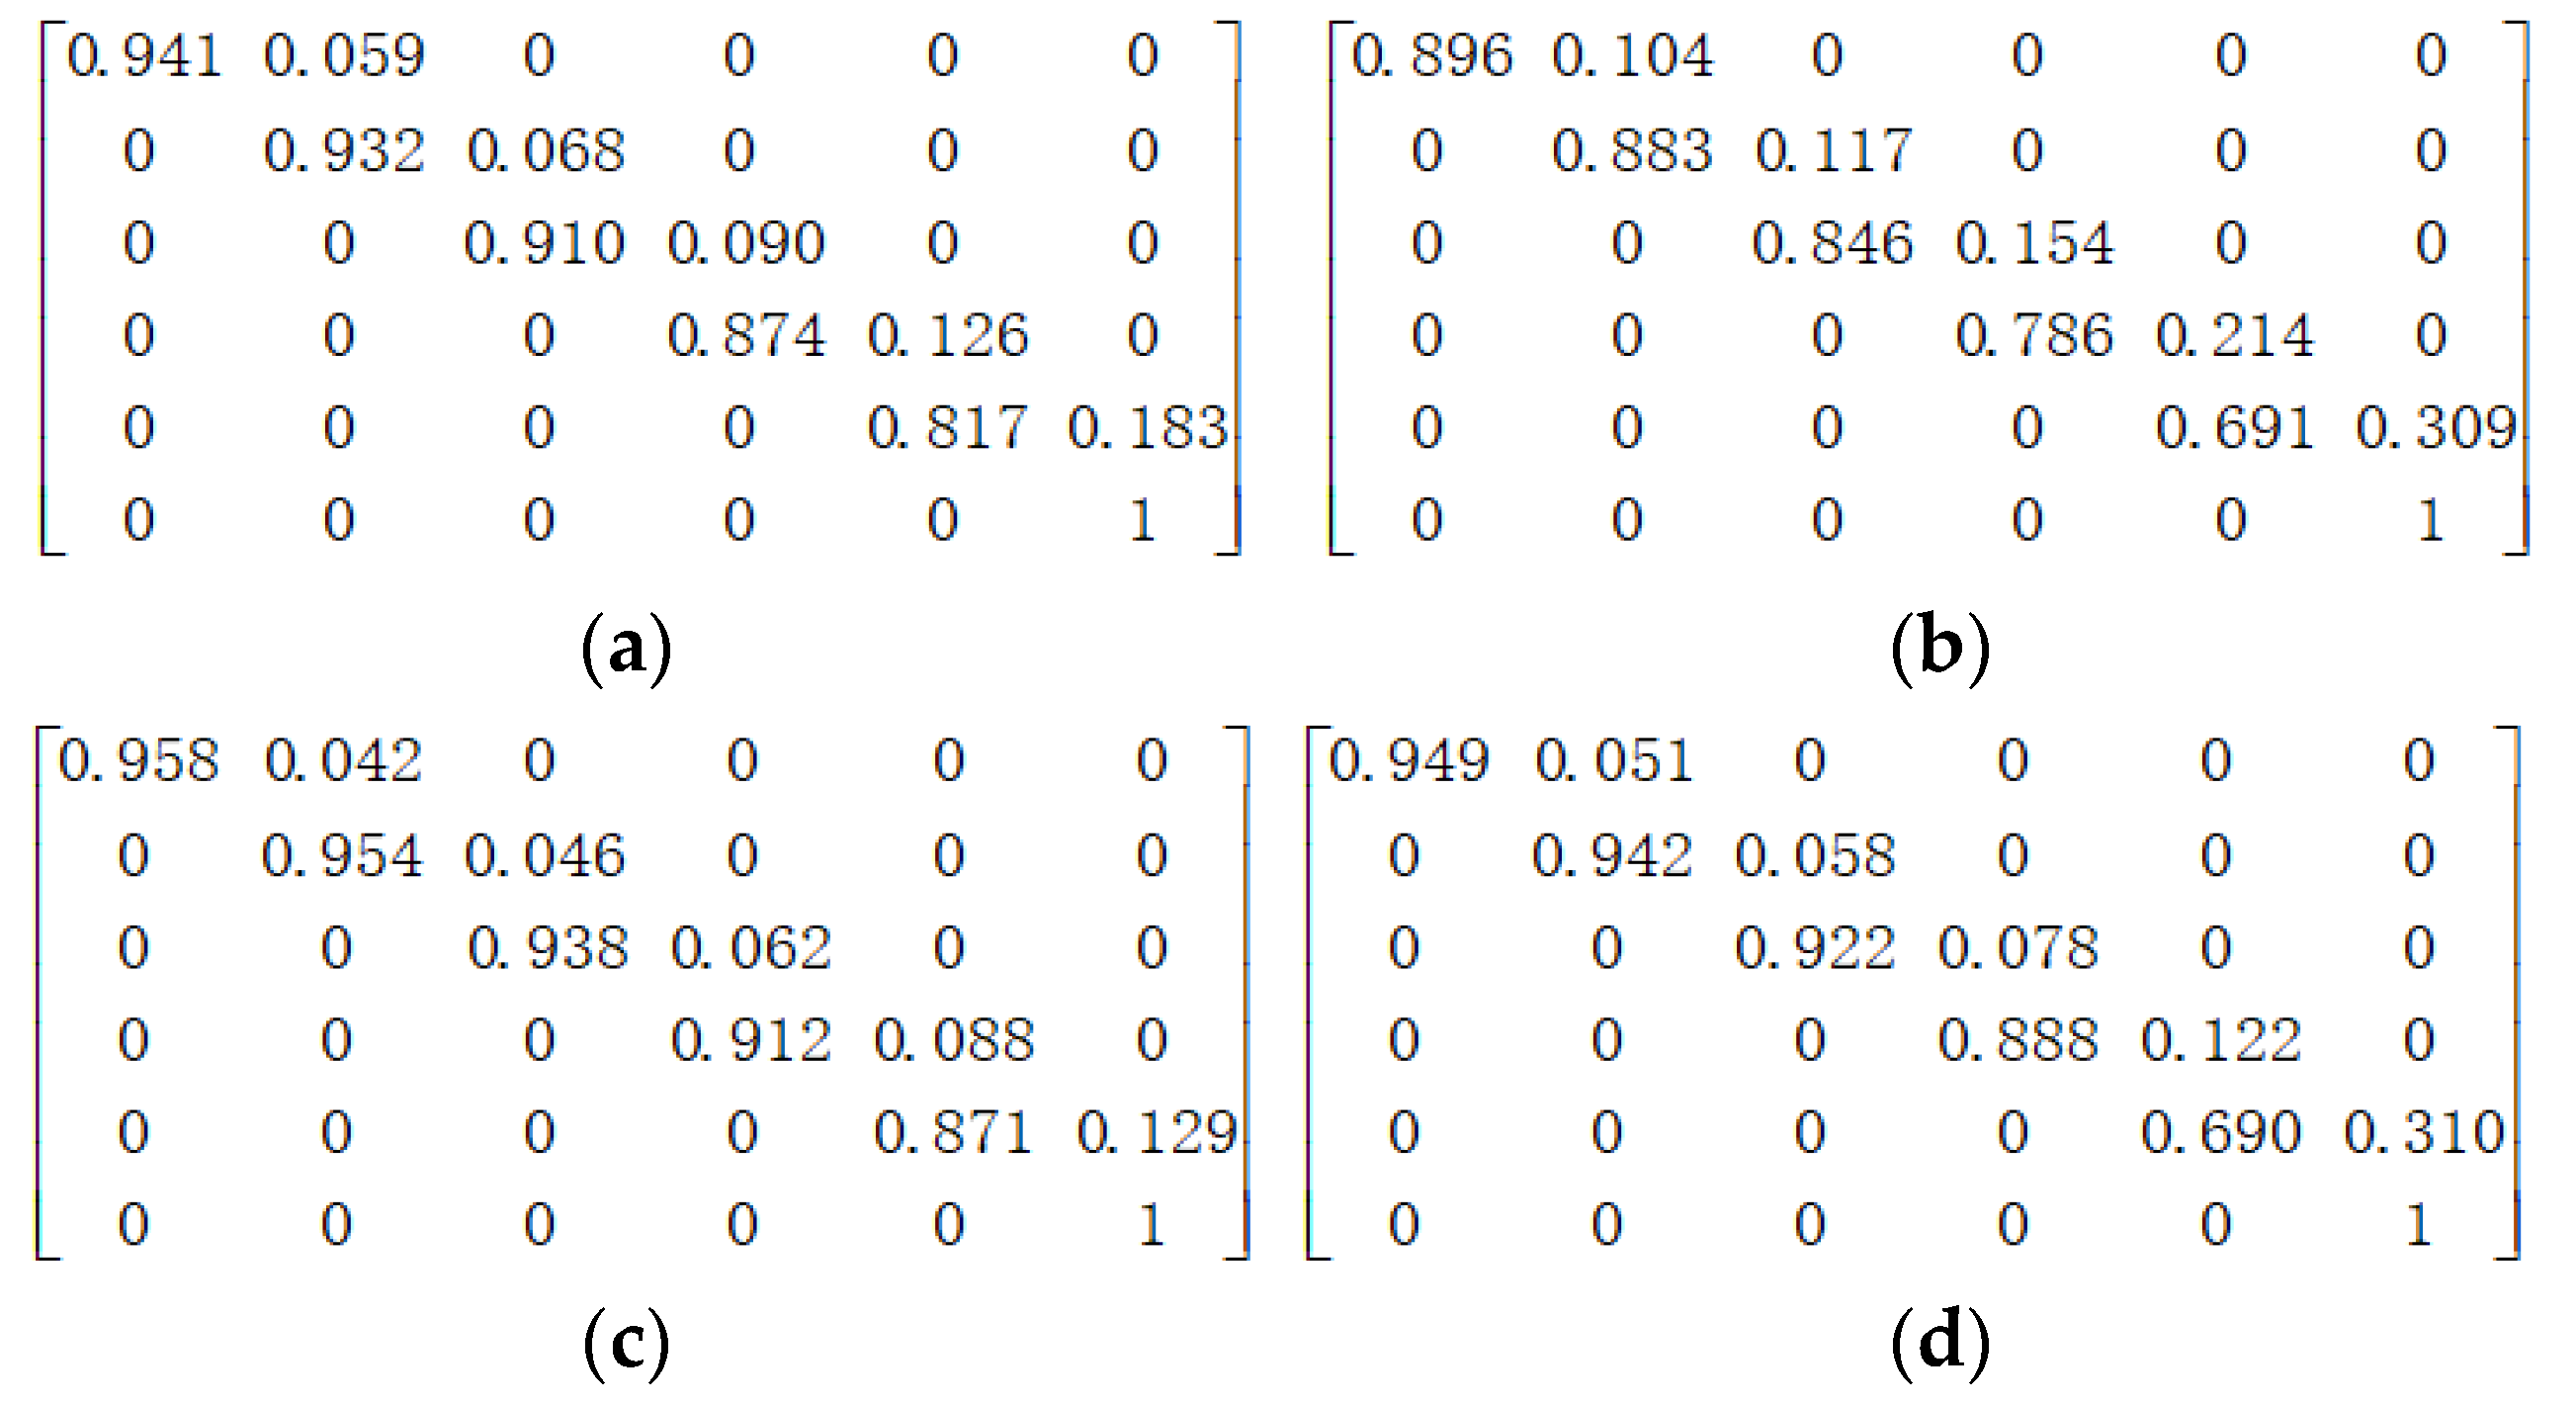
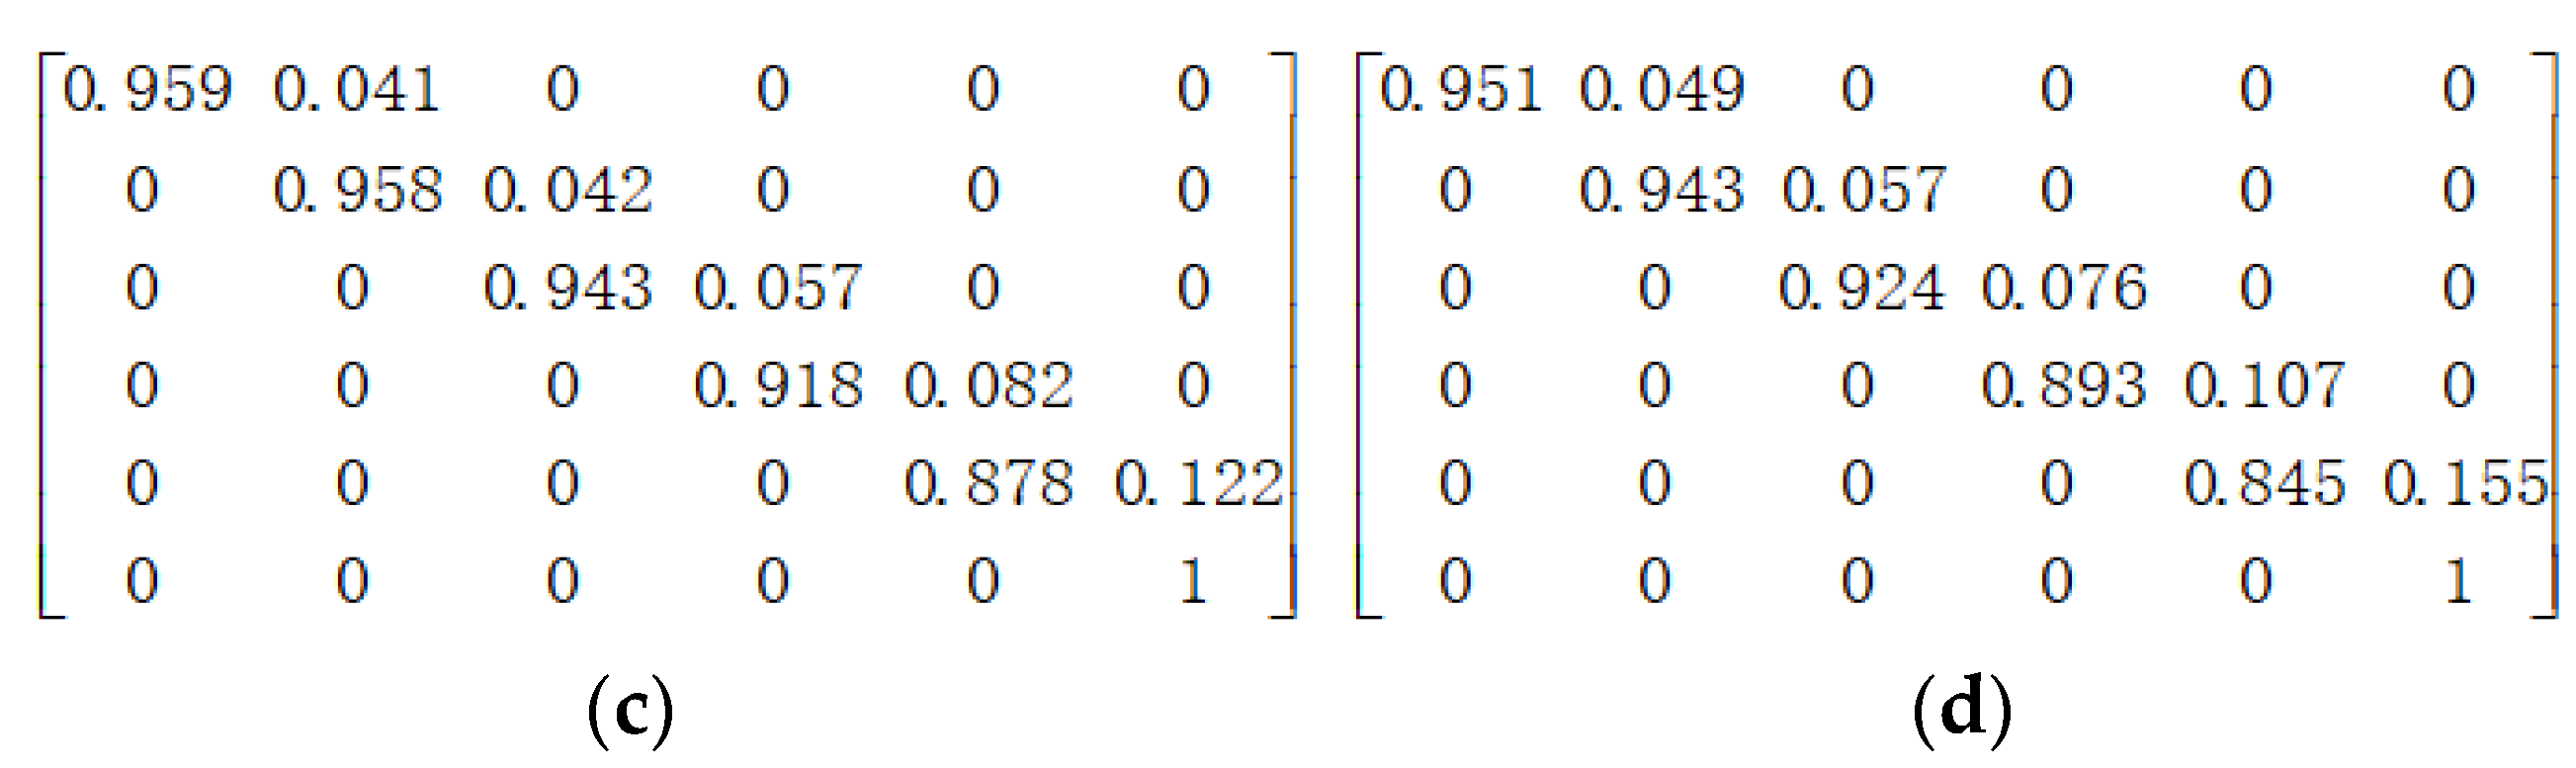
2.1. Deterioration Model

The transition process of bridge components is uncertain and the prediction of future states cannot be conducted in a deterministic manner [30,31]. Markov transition matrix probabilities p g h are used to describe the uncertain deterioration process with a fixed inspection period of component states. p g h represents the probability of a component transferred from state ‘g’ to state ‘h’ at the next inspection time. In this paper, a regression-based optimization approach is used to estimate the deterioration matrix probability with no maintenance actions, by closely mapping the expected state profile of the component given by the Markov model into the regression performance curve, then the transition probability can be estimated after renewing the matrix in time using Bayesian updates. The steps are described as follows:
(1) The performance index PI(i) is a function of the year, also known as the hazard model, which can be obtained by TCR = f(CR) of which CR denotes the component condition rating and TCR denotes the transformed CR with the same time interval. Using the transformed discrete condition rating data in the database, PI(i) can be obtained by regression curve fitting analysis.
(2) Construct the expected performance index function EPI(i), a function of the Markov transition probability matrix Ρ, assuming that the component performance deteriorates by at most one level in the natural environment during an inspection cycle, and the matrix Ρ is expressed as follows:
P = p 0 1 p 0 0 0 0 0 0 p 1 1 p 1 0 0 0                     0 0 0 0 p n 1 1 p n 1 0 0 0 0 0 1
The size of the matrix n + 1 × n + 1 indicates that the components have a total of n + 1 states from state ‘0’ to state ‘n’. p n indicates the probability of the component at state ‘n’ maintaining the current state, and 1 p n is the probability of transferring from state ‘n’ to state ‘n + 1’. If the state and transition matrix of the component at the initial year is known, the expected value of the state of the component during the service life can be calculated.
The probability of the component at   state   0   in   year   i   S 0 i   equals to p 0 i , and the probability of the component at state ‘1’ in year i can be expressed as
S 1 i = p 0 i 1 p 1 0 + p 0 i 2 p 1 1 + p 0 i 3 p 1 2 + + p 0 i k 1 p 1 k + + p 0 0 p 1 i 1 × 1 p 0
Sum the above geometric progression yields its general term as
S 1 i = p 0 i 1 p 1 0 1 p 1 p 0 i 1 p 1 p 0 × 1 p 0
= p 0 i p 1 i p 0 p 1 × 1 p 0
The probability of the component at state x   2 x n in year i is derived as follows. Let T x k + 1 indicate the probability of the component from state ‘x − 1’ to state ‘x’ at year k + 1 (x – 1 < k < i − 1)
T x k + 1 = S x 1 × 1 p x 1 × p x i k 1
Summing over k gives the general term:
S x i = k = x 1 i 1 S x 1 × 1 p x 1 × p x i k 1
where S x i denotes the probability that the component is in state ‘x’ in year i. Then the probability distribution matrix of the component states within the service life is obtained as S = S 0 , S 1 , S 2 , S 3 , S n 1 , S n . Accordingly, the expectation CR of the component during the service life is achieved as follows:
E C R i = 0 × S 0 i + 1 × S 1 i + 2 × S 2 i + 3 × S 3 i + + n 1 × S n 1 i + n × S n i
where S x is a vector of length mx + 1 composed of S x i , m is the component maintenance year and the range of i is [x, m]. To ensure that the vectors S x 0 x n are of equal length, with number of x zeros added before the first element of the vector, then the column vectors of the probability distribution matrix are of equal length (i.e., m + 1).
And it can be obtained
E P I i = f E C R i
(3) The state transition matrix can be estimated by solving the nonlinear optimization problem, the absolute difference between the regression model PI(i) and the expected performance index model EPI(i) is minimized as
m i n i = 0 m E P I i P I i 2
(4) Maintenance managers usually evaluate the performance of bridge components periodically or after major natural disasters, and the maintenance data recorded in the evaluation are used to Bayesian update the performance indices in Step (1). The re-derived transition matrix can make more accurate predictions on the future state of the components, which is used as the basis of maintenance decisions.
The performance of the component will also change after corresponding maintenance action is taken, the state transition matrix is used to describe this process. The two basic assumptions are as follows: firstly, the maintenance effect of the action is only related to the state of the component and is independent of other factors; secondly, the maintenance action eliminates the influence of the environment on the performance of the component during the same period and its state does not deteriorate. The transition matrix probability of the corresponding action can be determined after statistical analysis of the state transition of the component after the adoption of the maintenance action [32]:
p i j = n i j / n i
where n i j is the number of components of a particular type that change from state i to state j after the maintenance action is taken, n i is the number of components of a particular type that are in state i before maintenance.

2.2. Reinforcement Learning

A Markov iterative process can be represented by a tuple S t , A t , P t , R t [1,33]. S t represents the set of possible states of the structure at time t (discrete values according to the structure inspection manual), which is the observation results of the structural components, A t is the set of maintenance actions (action with n different maintenance effects defined in advance), and the maintenance action in the current state is selected based on the rule which is called the policy π . The state transition matrix P t (the probability of transferring from current state s t to s t + 1 after the maintenance action applied to the structure) should be determined considering the environmental deterioration and the bridge service life in addition to the maintenance action effect.   R t   is the reward from the environment to the maintenance action based on the current state, which can be regarded as the reward function.
Because decision-making not only needs to consider the reward of the current environment, but also consider the impact of maintenance policy on the future reward. The cumulative future reward which is called return is introduced, which represents the cumulative sum of the rewards throughout the life cycle of the structure from time t to time T. However, reward is not equivalent for the agent, so the discount factor   γ is used to define the time effect on the reward, and the reward of different time dimensions is discounted accordingly. Then the return at time t is called U t which can be represented as
U t = R t + γ R t + 1 + γ 2 R t + 2 +
The agent should maximize   U t   in the decision-making process, but it is known from the above equation that U t is depended on R t at each time after t, and R t is a random variable in the decision-making process (depending on the current state s t and the adopted maintenance action a t ), so the randomness of U t is related to the policy function π and the state transition matrix P for all the future time starting from t), and the randomness of the future time can be removed by integrating the expectation to obtain the action value function Q π ( s t , a t ) which is only relevant to the current state, the maintenance policy, and the maintenance actions taken by the agent.
Q π s t , a t = E U t | S t = s t , A t = a t
The optimal action value function Q π s t , a t can be found by maximizing Q * with respect to π
Q * = max Q π s t , a t
where Q * depends only on s t and a t , which can score for different maintenance actions at given state s t . There are two methods of RL in formulating the optimal maintenance policy. One is to learn the policy function π , after determining the optimal policy, input the current state observation s t , then the strategy function can output the probability of the corresponding maintenance action, and the maintenance action a t is determined based on random sampling. The other is value learning, when Q * is obtained, it can be used to score all maintenance actions for any given state s t , and the highest score of the action is adopted.

2.3. Q-Learning and Deep Q-Learning

Q-learning algorithm is a value learning method in RL, and the biggest differences from previous algorithms is that it uses an off-policy strategy to separate learning strategy from exploration strategy [34]. The learning strategy obtains the optimal decisions by interacting with the environment, while exploration strategies make use of greedy learning strategies [18,19]. The current optimal policy still explores more possibilities even though it has been found, which is the source of strategy optimization. At the same time, in the process of exploration, the deviation from the optimal strategy will not affect the optimization of the learning strategy, so enough creativity is given to the algorithm while ensuring convergence.
Based on the time-difference algorithm for iteration, the Q-learning algorithm adopts the Monte Carlo sampling method and the bootstrapping method in dynamic programming (the Q   of the current state is estimated using the Q * of the next state). Accordingly, it can well solve the model-free Q-learning algorithm and achieve single-step update, which greatly accelerates the convergence rate. The update equation is as follows:
Q s t , a t = Q s t , a t + α R t + 1 + γ m a x Q s t + 1 , a t Q s t , a t
where   α represents the learning efficiency which can be set as a constant (between 0 and 1) or as a function varying with the iterative process depending on the situation (the effect of changing frequency on convergence should be considered), R is the reward while   γ is the discount return coefficient.
Q(s,a) represents the return that can be obtained by taking action a in the current state s, and Q-value in different states can be updated by the current Q(s,a) and the return reward of the best maintenance action in the current state. Before the beginning of the algorithm, due to the absence of prior knowledge, the agent randomly selects actions, calculates the Q-value of each state and repeats the iterative process until the Q-value converges. The solution process of Q-value is based on the Bellman equation and the formulation of the optimal maintenance strategy depends on the Q table solved (the maintenance action of each state corresponds to a Q-value). It is inefficient in coping with complex environments because one maintenance decision can only update one Q-value.
When dealing with practical problems in complex environments such as structural maintenance, it is often difficult to accurately represent the Q-value of each state-action. By combining a convolutional neural network (CNN) with a Q-learning algorithm, Deep Q-learning (DQL) can accurately fit each Q-value by the function Q( θ ) [18,19]. In practical application, the data used to train the neural network can be obtained from the bridge itself or from the historical maintenance data of the bridge in a similar environment, and can also be obtained by machine simulation (self-learning). In addition to learning the experience of the existing process in the training process, the agent can also propose solutions to other extreme situations that may occur in the future or verify the feasibility of the bridge structure in the design stage by means of trial and error.
Q( θ ) is used in DQL to fit Q-values, and θ values are continuously updated by training to improve the fitting accuracy. A CNN-structured neural network is used because of its powerful capability in nonlinear functions. The iterative training process is illustrated as follows:
Q s t , a t , θ i + 1 = Q s t , a t , θ i + α R t + 1 + γ U t + 1 Q s t , a t , θ i
where R t + 1 + γ U t + 1 Q ( s t , a t , θ i ) is called time-difference error and R t + 1 + γ U t + 1 is called target-Q( Y t ), i.e., the target value of the neural network fit, which can be obtained by the interaction of the agent with the environment. The structural state S t is specified (considering the effect of time on the structure), the agent selects the best action A t based on the current parameters θ i , calculates the reward from the environment R t = R ( S t , A t ) and determines the state S t + 1 at the next time based on the state transition matrix P ( s | S t , A t ), while recording the data generated by the iteration as a tuple S t , A t , P t , R t . The above interaction process is repeated until a complete life cycle t = T, and the U t of each stage is calculated using the above equation and added to the corresponding tuple S t , A t , P t , R t stored in the dataset. The input of the neural network is S t and the output is Q ( s t , a t , θ ) for different maintenance actions, where the parameters of θ are updated by the minimum mean square error:
  L o s s : L t θ = 1 2 Q s t ,   a t ,   θ i + 1 Y t 2
via gradient descent [35]:
θ i + 1 = θ i α L t θ | θ = θ i
The samples obtained in RL are correlated, however, CNN neural network, as a supervised learning model, the data are required to satisfy independent identical distribution. Therefore, an empirical replay pool is set to break the correlation and non-stationary distribution between data by the storage-sampling method. The specific approach is as follows: the appropriate batch-size is determined according to the complexity of the neural network, and the batch-size samples are extracted from the existing dataset for training, while the capacity of the dataset is not infinite, and it needs to be updated at the later stage of training. The adoption of empirical replay pool can reduce the update variance caused by correlation while greatly improving data utilization. The stability of the algorithm needs to be solved in the process of neural network fitting. In this paper, the target value is determined by U t in the training data, which can greatly improve the stability of training, and the first iteration starts with a random action strategy due to the absence of historical data, and with the increase of the number of iterations, the maintenance strategy is continuously optimized until convergence.

2.4. Multiple-Agent in Parallel

The agents constructed by DQL can choose the best maintenance strategy based on the fitted Q-value. However, in practical engineering applications, the large number of bridge components lead to the greatly increased complexity of the agent neural network, and the network optimization efficiency is usually low or even cannot converge due to the high complexity. In this paper, the complex bridge system is firstly divided into different structural categories according to the structural characteristics, mechanical properties, material properties, etc. The components in the same structural category have similar environmental characteristics, and a single agent can be used to make maintenance decisions. By calculating the overall return of the bridge system and connecting different structural category agents, the optimal maintenance strategy of the whole structure can be output [22]. The framework used for the two cases in Section 3 is shown in Figure 1. The states of different components of the same structural category at time t can be described as S t 1 , S t 2 , S t 3 , , S t n (the superscript n denotes the label of the component), and the parallel decision-making output actions of single agent are A t 1 , A t 2 , A t 3 , , A t n , then the environment feedback R t i = R S t i , A t i 1 i n can be calculated, and the state S t + 1 i of the next time is determined according to the state transition matrix P(s| S t , A t ). The obtained interaction information of different components is stored in a dataset in the form of a tuple s t i , a t i , R t i , S t + 1 i (different agents correspond to their own independent datasets), and tuples are randomly extracted from the dataset of the corresponding structural category when training policies.
Compared with the direct interaction between a single agent and complex structure which increases the parameter complexity, as the parameter update process is essentially a gradient descent process of single agent, the single-agent parallel decision-making can improve the efficiency of the algorithm and ensure the stability of the convergence. In an iteration, the agents make multiple decisions in a training process, which greatly enriches the complexity of the data, i.e., the interaction of the policy network with the multivariate environment, so that it can effectively deal with various unpredictable environmental changes in the life cycle of the components while also improving the compatibility and adaptability of the agents.
The framework makes the algorithm much more relevant and adaptable to the maintenance of the built bridges by introducing a random starting year and initial state for the interaction between the agent and the environment. Moreover, if each iteration starts from the starting year, after a certain number of training sessions, the maintenance strategy is good enough to ensure that the structural state remains stable in the later part of the service life without significant structural risks, if the bridge encounters extreme natural disasters in the latter part of the life, and the agent cannot provide correct advice, the random starting year can well solve this problem. In addition, considering the bridge maintenance year is large, the natural environment, traffic loads, differences in the maintenance plan and rare hazardous events can have a large impact on the deterioration process of bridge components, it is important to conduct regular quality and risk assessments of the components. After the assessment, the hazard model is adjusted by analyzing the performance of components, and the deterioration matrix is redefined based on the current environment and the condition of the components. Thanks to its excellent training efficiency and strong adaptability, the multi-agent framework can adjust maintenance strategies to cope with changes in the deterioration model without modifying the network parameters.

3. Case Study

3.1. Case I: A Simple Bridge Deck System

The first case used to verify the feasibility of the bridge management system proposed in this paper comes from a bridge deck system described by [34]. The database is a part of the integrated system for managing different highway structures in Quebec, which records the maintenance data of the bridges up to the year 2000, and has important reference value for the maintenance policies of subsequent bridges. In addition, the maintenance policy is developed at the component level, so the states and actions are based on the component level. The bridge deck system contains seven components, the wearing surface, the drainage system, exterior face 1, exterior face 2, end portion 1, end portion 2, and the middle portion, marked from 0 to 6.
The development of the optimal maintenance policy requires consideration of the performance change of the components under different maintenance actions, the maintenance objectives (balance between structural safety and maintenance cost) and the bridge specification requirements for the performance of the different components. The simple bridge deck system is considered as a Markov model with discrete parameters, i.e., the state of each component, the maintenance actions are represented in a discrete hierarchical order and the time effects on the performance of the components are reflected in the periodic decision nodes (assuming that the inspection time interval is 1 year). The above assumptions are made to eliminate computational complexity and simplify the decision-making process. The initial state of the components is ‘0’, and four kinds of maintenance actions are expressed from 0 to 3. The change of the natural deterioration model and the maintenance actions on the component performance are determined by the state transition matrix, the maintenance target depends on the setting of the reward model, and the maintenance year of the component is 100 years.
The structural component state of the deck system is rated from ‘0’ to ‘5’ based on the material status and performance of the components [19]. ‘0’ is ‘very good’ and ‘5’ is ‘critical’. In addition, the service life of the components has an important impact on the development of the maintenance policy, and the age information of the components at different stages has different impacts on policies. Therefore the state   S t c   of each component (t is the service life and c is the component label) is a vector of length 2 containing the component state and age information. The embedding layer of the agent can divide the state and year information in the state into two independent vectors as the input of the neural network, and in the process of policy network training, the information in the two vectors is optimized to formulate the optimal maintenance policy for different stages of the component. Because the bridge deck system contains seven components, the input state S t of the multi-agent framework is composed of the condition and year information of the seven components, which is a vector of length 8. After being preprocessed by the framework, S t c of each component is extracted as the input of the corresponding single agent. The size of the state space is S t c = 100 × 6 7 .
The maintenance actions are usually classified into four discrete levels according to their maintenance effects and corresponding costs, do nothing, preventive scenario, corrective scenario, and rebuild (expressed in 0–3, respectively). The multi-agent framework outputs the optimal maintenance actions of different components of the system in a vector of length 7, such as [1, 0, 1, 0, 0, 0, 1, 2], and the size of the action space is   A t = 4 7 . The focus of this study is not on the actual maintenance cost and therefore the relative value is more important than the absolute value [19]. The maintenance cost depends on the component category c of the bridge, the maintenance action a and the structural condition s and the structural safety is determined by the evaluation of the risk of each component. Thus the maintenance reward at the component level can be expressed as
R c ,   s , a ,   s = c o s t t o t a l c × r a t e c o n d i t i o n s + c o s t t o t a l c × r a t e c o n d i t i o n s × r a t e a c t i o n a
where c o s t t o t a l c , r a t e c o n d i t i o n s , r a t e c o n d i t i o n s , r a t e a c t i o n a are the cost rates, depending on the type of deck system components, the state of the bridge system components and the maintenance actions taken. The c o s t t o t a l c is (80, 60, 80, 60, 120, 100), the r a t e c o n d i t i o n s is (0.8, 0.85, 0.90, 0.95, 1, 1), and the r a t e a c t i o n a is (0.0, 0.1, 0.3, 0.4) [19]. Then the R e w a r d s u m of the system can be obtained by summing up the reward of each component of the bridge deck for the same service year.
For the seven components, the natural deterioration state transition matrix is shown in Figure 2. The maintenance actions matrix can be obtained as shown in Figure 3. Taking action ‘rebuild’ is equivalent to replacing the components, which all have an initial state of ‘0’.
The component 0 performance index fitting and the comparison of the obtained transition matrix of component 0 with the regression model describing its natural deterioration are shown in Figure 4 in which PI indicates performance index, and TPM indicates transition probability matrix.
Based on the Q-value, the bridge management system can develop an optimal maintenance policy. For this bridge deck system, the size of the Q table is very large and the time cost and economic cost are unacceptable using the traditional dynamic programming method. The multi-agent framework for its decision-making contains seven agents with independent network parameters. The input is S t , and s t c can be extracted for each component after the preprocessing layer which contains the condition and year information of the component as the input to the single agent. The information in the input vector is processed by two separate embedding layers, and the extracted features are integrated and input to the subsequent full connection layer. Based on this, the optimal action that the component should take under the current S t c is obtained. Considering that the deterioration process of component performance may have an impact on other components and the impact of environmental conditions on system components, R e w a r d s u m is used to evaluate the maintenance cost and structural risk of bridge deck system, and the component maintenance measures based on the overall optimization of the system are obtained. Executed in Python 3.7 and MATLAB 2021, the training process of the multi-agent framework is in Algorithm 1.
Algorithm 1 Pseudocode
Repeat (for each sample episode):
Initialize t = start year (random), S t (depend on t)
Preprocessing: S t S t 1 ,   S t 2 ,   S t 3 ,   S t 4 ,   S t 5 , S t 6 ,   S t 7
Single agent parallelism
Initialize   θ c arbitrarily
Repeat (for t < T)
 Choose A t c using policy derived from Q (epsilon greedy)
 Take action A t c , observe R t c , sample next state S t + 1 c = S t c * P ( s | S t c , A t c )
 and collect state < S t c ,   A t c ,   R t c ,   S t + 1 c >;
t = t + 1;
 Util t = T;
Calculate U t c for each step t in the episode, save the tuple
< S t c , A t c , R t c , S t + 1 c , U t c > to memory
Update θ c using Equation (16)
Calculate R e w a r d s u m
Output optimal maintenance policy
As shown in Figure 5, the agents are connected by the reward function, so the training process has a similar trend. The rapid convergence of the maintenance policy from random decisions to the optimal maintenance solution is due to the low complexity of the neural network. The differences in the training process of the component agents are due to the performance deterioration processes of different components, i.e., the differences in their deterioration models. The curve of the training process fluctuates because the component state change is based on a random sampling of the probability distribution of the transition matrix, both after natural deterioration and maintenance, the state distribution of the components has certain randomness. Figure 6 shows the probability distribution of the maintenance actions of all structural components during the training process. It shows that with the continuous optimization of the strategy, the probability of 0 and 1 increases to about 90%. After sufficient training, the agent is excellent enough to ensure that the structural state can remain stable at the later stage of service life, and there is no high structural risk. Therefore, the probability of choosing action 2 or 3 with high maintenance costs decreases unless there are unexpected situations. At the same time, the optimized maintenance policy can often take measures to prevent the deterioration of bridge performance at the correct time, which not only ensures that the risk of structural failure is always in an acceptable range, but also reduces the number of maintenance actions.
In Figure 7, the optimal maintenance policy makes the state of the bridge deck system components is always better than that of state ‘2’, which ensures the normal function of the structure in the maintenance cycle and avoids the economic losses caused by the actions 2 and 3 due to the significant security risks of the components. Figure 8 shows that there are few maintenance actions taken in the early stage of the structure because the good initial state of the bridge does not require too much maintenance. At the same time, in the last five years of the maintenance cycle, considering that the impact of the maintenance process on the structure will to some extent offset the optimization effect of the maintenance action on the structure, the benefits of maintenance and the risk sequence of non-maintenance may be balanced, and the multi-agent also reduces the maintenance frequency accordingly.

3.2. Case II: Taiping Lake Bridge

The bridge used in this example is a cable-stayed bridge in Taiping Lake, Huangshan City with 54 cables, 58 box-girder sections, one bridge towers, and three bridge piers, giving a total of 116 components. The components are divided into four structural categories after numbering from 1 to 116: Stay-cables (1 to 54), Box girders (55 to 112), Towers (113), and Piers (113 to 116). The length of state S t   is 117 and the length of action A t is 116, and the reward model settings need to be adjusted accordingly. c o s t t o t a l c are 3, 2,10, and 4 for the stay-cables, the box girder section, the tower, and the pier, respectively. The maintenance cycle is 100 years, and the state of the components in the natural condition deteriorate by at most one level. Considering that the bridge structure has a long service life, many factors may have an impact on the deterioration process of the components, therefore, the quality and risk assessment of the structural components are carried out in the 5th, 10th, and 15th years of the maintenance cycle. Therefore, the Bayesian updating is used to adjust the performance index PI to redetermine the state transition matrix. The state transition matrix determined for the first year is shown in Figure 9, and the rest of the state transition matrix is shown in Appendix A.
The maintenance effect of the corresponding action is assumed to be constant and consistent with the maintenance effect of Case I. The matrix of the maintenance actions is shown in Figure 3, but the price level fluctuates at different evaluation times, and the absolute value of c o s t t o t a l c is assumed to increase by 10% compared with the previous evaluation time. The training process of the multi-agent framework is shown in Figure 10, and Figure 11 shows the changes in the probability distribution of the four maintenance actions of all the components of the bridge system during the training process. In Figure 12, the state distribution of all the components in the bridge system under different deterioration models is displayed. As shown in Figure 13, the overall downward shift of the spending curve compared with the initial deterioration model indicates that the maintenance plan developed at the beginning is slightly conservative, and the accuracy of the component performance prediction based on the transition matrix is improved. The multi-agent framework optimizes the maintenance policy initially developed to reduce unnecessary maintenance actions and reduce the cost. At the same time, as the evaluation proceeds, the real-time updated transition matrix is more accurate in describing the deterioration process of the components, the maintenance measures are targeted to improve, the maintenance cost is further reduced, and the annual maintenance cost after the 15th year evaluation is substantially reduced compared with the initial curve. Real-time adjustment of maintenance strategies according to the bridge deterioration process is of great significance to solve practical engineering problems. Considering the long service life of a bridge structure, the deterioration process is influenced by occasional disasters, service environment, and maintenance strategies, which may deviate from the initial deterioration model, resulting in poor maintenance strategies. Based on the results of the monitoring and assessment of component performance, the deterioration model is updated and the maintenance plan is adjusted in real-time to improve the targeting of maintenance and the efficiency of resource utilization.

4. Conclusions

Based on the Markov deterioration model and multi-agent parallel framework, a decision-making model proposed in this paper provides an objective decision-making scheme for the maintenance of bridge structures. The Markov deterioration model is derived using a regression-based optimization method to predict the deterioration process of bridge structures, taking into account the influence of bridge component types, service environments, and inspection intervals to ensure the accuracy and reasonableness of the model. The multi-agent parallel framework, in which multiple agents interact together with the bridge environment to solve the problem of maintenance decisions that are difficult for a single agent to handle, simplifies the neural network nodes and improves the training efficiency of the agents. A simple bridge deck system and real bridge example are adopted for verification. The multi-agent parallel framework based on Tensorforce shows superior performance in the two cases, where only a few parameters need to be adjusted. The multi-agent framework can optimize the maintenance policy based on historical maintenance data after machine simulation training and can also converge from a random policy to the optimal maintenance policy to adapt to the current environment without prior knowledge. Compared with directly increasing network parameters, the maintenance decision-making framework regards components with similar environmental and functional characteristics as a whole based on engineering knowledge and further uses an agent to make decisions, which greatly simplifies the structural complexity for the practical application. The embedding layer greatly simplifies the number of nodes in a convolutional neural network without losing feature information. With the updated deterioration model by Bayesian updating, even if the transition matrix changes over time, the multi-agent framework can make optimal maintenance decisions after iterative training.

Author Contributions

Conceptualization, J.Z. and Y.Y.; methodology, Y.Y. and Q.-N.Z.; software, D.Y. and Q.-N.Z.; validation, D.Y.; writing—original draft preparation, Q.-N.Z.; writing—review and editing, J.Z. All authors have read and agreed to the published version of the manuscript.

Funding

The work described here has been partially supported by the Ministry of Science and Technology, China (Project No.: 2019YFB1600702).

Institutional Review Board Statement

Not applicable.

Informed Consent Statement

Not applicable.

Data Availability Statement

Not applicable.

Conflicts of Interest

The authors declare no conflict of interest.

Appendix A

Figure A1. Case II: State transition matrix of the four categories identified in year 5. (a) Stay-cables; (b) Box girders; (c) Towers; (d) Piers.
Sustainability 14 10050 g0a1
Figure A2. Case II: State transition matrix of the four categories identified in year 10. (a) Stay-cables; (b) Box girders; (c) Towers; (d) Piers.
Sustainability 14 10050 g0a2aSustainability 14 10050 g0a2b
Figure A3. Case II: State transition matrix of the four categories identified in year 15. (a) Stay-cables; (b) Box girders; (c) Towers; (d) Piers.
Sustainability 14 10050 g0a3

References

  1. Frangopol, D.M.; Dong, Y.; Sabatino, S. Bridge life-cycle performance and cost: Analysis, prediction, optimisation and decision-making. Struct. Infrastruct. Eng. 2017, 13, 1239–1257. [Google Scholar] [CrossRef]
  2. Wong, K.Y.; Lau, C.K.; Flint, A.R. Planning and implementation of the structural health monitoring system for cable-supported bridges in Hong Kong. In Proceedings of the SPIE-The International Society for Optical Engineering, San Diego, CA, USA, 31 July–2 August 2000; Volume 3995, pp. 266–275. [Google Scholar]
  3. Bao, Y.; Chen, Z.; Wei, S.; Xu, Y.; Tang, Z.; Li, H. The state of the art of data science and engineering in structural health monitoring. Engineering 2019, 5, 234–242. [Google Scholar] [CrossRef]
  4. Tsuda, Y.; Kaito, K.; Aoki, K.; Kobayashi, K. Estimating markovian transition probabilities for bridge deterioration forecasting. Kagaku Kogaku Ronbun 2006, 23, 241–256. [Google Scholar] [CrossRef]
  5. Mirzaei, Z. Overview of Existing Bridge Management Systems-Report by the IABMAS Bridge Management Committee. 2014. Available online: https://www.research-collection.ethz.ch (accessed on 7 February 2022).
  6. Robert, W.E.; Marshall, A.R.; Shepard, R.W.; Aldayuz, J. The Pontis Bridge Management System: State-of-the-Practice in Implementation and the Pontis Bridge Management System: State-of-the-Practice in Implementation and Development. 2002. Available online: https://trid.trb.org/view/644472 (accessed on 7 February 2022).
  7. Andersen, N.H. Danbro—A Bridge Management System for Many Levels; Springer: Dordrecht, The Netherlands, 1990. [Google Scholar]
  8. Kim, S.K. Intelligent Bridge Maintenance System Development for Seo-Hae Grand Bridge//Cable-Supported Bridges: Challenging Technical Limits. In Proceedings of the Cable-Supported Bridges—Challenging Technical Limits, Seoul, Korea, 12–14 June 2001. [Google Scholar]
  9. Frangopol, D.M. Life-cycle performance, management, and optimisation of structural systems under uncertainty: Accomplishments and challenges. Struct. Infrastruct. Eng. 2011, 7, 389–413. [Google Scholar] [CrossRef]
  10. Frangopol, D.M.; Kallen, M.J.; Noortwijk, J.M.V. Probabilistic models for life-cycle performance of deteriorating structures: Review and future directions. Prog. Struct. Eng. Mat. 2004, 6, 197–212. [Google Scholar] [CrossRef]
  11. Kuhn, K.D. Network-level infrastructure management using approximate dynamic programming. J. Infrastruct. Syst. 2010, 6, 103–111. [Google Scholar] [CrossRef]
  12. Medury, A.; Madanat, S. Simultaneous network optimization approach for pavement management systems. J. Infrastruct. Syst. 2014, 20, 04014010.1–04014010.7. [Google Scholar] [CrossRef]
  13. Robelin, C.A.; Madanat, S.M. Dynamic programming based maintenance and replacement optimization for bridge decks using history-dependent deterioration models. Am. Soc. Civil Eng. 2006, 13–18. [Google Scholar] [CrossRef]
  14. Mozer, M.C.; Touretzky, D.S.; Hasselmo, M. Reinforcement learning: An introduction. IEEE Trans. Neural Netw. 2005, 16, 285–286. [Google Scholar]
  15. Canese, L.; Cardarilli, G.C.; Di Nunzio, L.; Fazzolari, R.; Giardino, D.; Re, M.; Spanò, S. Multi-agent reinforcement learning: A review of challenges and applications. Appl. Sci. 2021, 11, 4948. [Google Scholar] [CrossRef]
  16. Jang, B.; Kim, M.; Harerimana, G.; Kim, J.W. Q-Learning algorithms: A comprehensive classification and applications. IEEE Access 2019, 7, 133653–133667. [Google Scholar] [CrossRef]
  17. Sutton, R.S.; Barto, A.G. Reinforcement learning: An introduction. IEEE Trans. Neural Netw. 1998, 9, 1054. [Google Scholar] [CrossRef]
  18. Mnih, V.; Kavukcuoglu, K.; Silver, D.; Rusu, A.A.; Veness, J.; Bellemare, M.G.; Graves, A.; Riedmiller, M.; Fidjeland, A.K.; Ostrovski, G.; et al. Human-level control through deep reinforcement learning. Nature 2015, 518, 529–533. [Google Scholar] [CrossRef] [PubMed]
  19. Wei, S.; Bao, Y.; Li, H. Optimal policy for structure maintenance: A deep reinforcement learning framework. Struct. Saf. 2020, 83, 101906. [Google Scholar] [CrossRef]
  20. Madanat, S.; Mishalani, R.; Ibrahim, W.H.W. Estimation of infrastructure transition probabilities from condition rating data. J. Infrastruct. Syst. 1995, 1, 120–125. [Google Scholar] [CrossRef]
  21. Chung, S.-H.; Hong, T.-H.; Han, S.-W.; Son, J.-H.; Lee, S.-Y. Life cycle cost analysis based optimal maintenance and rehabilitation for underground infrastructure management. KSCE J. Civ. Eng. 2006, 10, 243–253. [Google Scholar] [CrossRef]
  22. Wellalage, N.K.W.; Zhang, T.; Dwight, R. Calibrating Markov Chain-based deterioration models for predicting future conditions of railway bridge elements. J. Bridge Eng. 2015, 20, 04014060. [Google Scholar] [CrossRef]
  23. Veshosky, D.; Beidleman, C.R.; Buetow, G.W.; Demir, M. Comparative analysis of bridge superstructure deterioration. J. Struct. Eng. 1994, 120, 2123–2136. [Google Scholar] [CrossRef]
  24. Park, T.; Saad, W. Kolkata paise restaurant game for resource allocation in the internet of things. In Proceedings of the 2017 51st Asilomar Conference on Signals, Systems, and Computers, Pacific Grove, CA, USA, 16 April 2018; pp. 1774–1778. [Google Scholar]
  25. Kastampolidou, K.; Papalitsas, C.; Andronikos, T. The distributed Kolkata paise restaurant game. Games 2022, 13, 33. [Google Scholar] [CrossRef]
  26. Qiu, J.; Yu, C.; Liu, W.; Yang, T.; Yu, J.; Wang, Y.; Yang, H. Low-cost multi-agent navigation via reinforcement learning with multi-fidelity simulator. IEEE Access 2021, 9, 84773–84782. [Google Scholar] [CrossRef]
  27. Tham, C.K.; Prager, R.W. A modular Q-Learning architecture for manipulator task decomposition. In Proceedings of the Eleventh International Conference, Rutgers University, New Brunswick, NJ, USA, 10–13 July 1994; pp. 309–317. [Google Scholar]
  28. Machado, L.; Schirru, R. The Ant-Q algorithm applied to the nuclear reload problem. Ann. Nucl. Energy 2002, 29, 1455–1470. [Google Scholar] [CrossRef]
  29. Yang, L.; Sun, Q.; Ma, D.; Wei, Q. Nash Q-learning based equilibrium transfer for integrated energy management game with We-Energy. Neurocomputing 2020, 396, 216–223. [Google Scholar] [CrossRef]
  30. Ben-Akiva, M.; Gopinath, D. Modeling infrastructure performance and user costs. J. Infrastruct. Syst. 1995, 1, 33–43. [Google Scholar] [CrossRef]
  31. Kobayashi, K.; Do, M.; Han, D. Estimation of Markovian transition probabilities for pavement deterioration forecasting. KSCE J. Civ. Eng. 2010, 14, 343–351. [Google Scholar] [CrossRef]
  32. Jiang, Y.; Saito, M.; Sinha, K.C. Bridge Performance Prediction Model Using the Markov Chain. 1988. Available online: https://trid.trb.org/view/300339 (accessed on 7 February 2022).
  33. Walgama Wellalage, N.K.; Zhang, T.; Dwight, R.; El-Akruti, K. Bridge deterioration modeling by Markov Chain Monte Carlo (MCMC) simulation method. In Proceedings of the 8th World Congress on Engineering Asset Management & 3rd International Conference on Utility Management & Safety, Hong Kong, China, 30 October–1 November 2013; pp. 545–556. [Google Scholar]
  34. Morcous, G. Performance prediction of bridge deck systems using Markov Chains. J. Perform. Constr. Fac. 2006, 20, 146–155. [Google Scholar] [CrossRef]
  35. Lecun, Y.; Bengio, Y.; Hinton, G. Deep learning. Nature 2015, 521, 436. [Google Scholar] [CrossRef] [PubMed]
Figure 1. Multi-agent framework constitution.
Sustainability 14 10050 g001
Figure 2. Case I: Natural deterioration state transition matrix for the seven components. (a) Wearing surfaces (b) Drainage system; (c) Exterior face 1 (d) Exterior face 2; (e) End portion 1 (f) End portion 2; (g) Middle portion.
Sustainability 14 10050 g002aSustainability 14 10050 g002b
Figure 3. Case I: State transition matrix of maintenance actions. (a) Preventive scenario; (b) Corrective scenario; (c) Rebuild.
Sustainability 14 10050 g003
Figure 4. Deterioration matrix regression analysis of component 0. (a) Component 0 performance index fitting; (b) Comparison of PI and TPM.
Sustainability 14 10050 g004
Figure 5. Case I: Policy optimization process during agents training.
Sustainability 14 10050 g005
Figure 6. Case I: Probability distribution of maintenance actions.
Sustainability 14 10050 g006
Figure 7. Case I: Life-cycle condition distribution.
Sustainability 14 10050 g007
Figure 8. Case I: average maintenance cost in a life cycle.
Sustainability 14 10050 g008
Figure 9. Case II: State transition matrix of the four categories in year 0. (a) Stay-cables; (b) Box girders; (c) Towers; (d) Piers.
Sustainability 14 10050 g009
Figure 10. Case II: Policy optimization process during agents training. (a) Towers; (b) Stay-cables; (c) Piers; (d) Box girders.
Sustainability 14 10050 g010
Figure 11. Case II: Probability distribution of maintenance actions.
Sustainability 14 10050 g011
Figure 12. Case II: Life-cycle condition distribution and average maintenance cost in a life-cycle.
Sustainability 14 10050 g012
Figure 13. Case II: Comparison of annual maintenance costs.
Sustainability 14 10050 g013
Publisher’s Note: MDPI stays neutral with regard to jurisdictional claims in published maps and institutional affiliations.

