Abstract
As climate change concerns are rising rapidly, energy efficiency promotion and implementation could be sustainable solutions within energy transition. In this context, buildings, including educational ones, play an important role in reducing energy needs and promoting energy efficiency since they account for a significant share of the total energy consumption. As a case study for this research, the educational building of Kazakh-German University was selected. Following the national and international building standards, energy performance parameters were estimated. Current heat losses and performance have been estimated as baseline scenario settings. The impact of retrofitting measures on energy efficiency performance of the buildings under the four scenarios was calculated. Under the minor scenario, retrofitting interventions will lead to annual energy savings of 36.9 kWh/m2 and a 48% CO2 emission reduction, whereas under the major scenario, the annual energy savings will increase to 77.76 kWh/m2 and a nearly 82% CO2 emission reduction. The integration of a solar thermal system with capacity 400 kWh, assuming that the heat demand was reduced under the minor retrofitting scenario, can decrease heat energy consumption and CO2 emissions to 35%. As upfront costs of the energy efficiency measures are high, a carbon offset mechanism could facilitate the implementation of university building modernization.
1. Introduction
The increasing speed of global warming makes it one of the most critical problems that the world is currently confronted with. The implications of global warming necessitate immediate action to stem the tide.
The Intergovernmental Panel on Climate Change (IPCC) has recognized ‘buildings’ as a critical area of action in its recent reports [1]. According to [2], in 2020, buildings were responsible for 36 % of the total world energy demand and 37 % of energy-related CO2 emissions. While ‘buildings’ are responsible for a substantial portion of current greenhouse gas (GHG) emissions, they also have the potential to significantly cut GHG emissions through enhanced operational energy efficiency.
The authors of [3] state that the built environment must be decarbonized across its entire life cycle, while the resilience of the built environment or life expectancy of the building must be increased. This requires a three-fold approach: decreasing energy demand and enhancing energy efficiency, decarbonizing the energy system, and lowering the embedded carbon footprint of building materials. Other studies have examined how changes in technology selection can lower emissions, i.e., [4,5,6]. Typically, these analyses indicate that technological advancements could lower the total energy demand by as much as 60 percent by the end of the century.
The results of a study [7] demonstrate that depending on local climate, socio-economic, and building stock characteristics, the role of technology and energy efficiency decisions in decreasing energy demand and emissions from the residential heating sector varies across countries. Still, renovation was considered most important in regions where existing building stocks with relatively low quality prevail, while fuel switching would cut greenhouse emissions by half.
Educational buildings play an important role in reducing energy needs and promoting energy efficiency since they account for a significant share of the total energy consumption [8]. For instance, in the United States and the United Kingdom, school buildings account for 13% and 10% of total building energy consumption, respectively [9]. Moreover, educational facilities should provide appropriate indoor environments for their residents to ensure their productivity and performance. As evidenced in [10], many educational buildings in Kazakhstan as well as in other Central Asian countries are overheated during heating season due to the absence of or an insufficient control system at the building level.
Despite significant effort to diversify its highly energy-intensive economy and reduce dependence on fossil-fuel-based heat and electricity production, Kazakhstan remains the greatest emitter of greenhouse gases (GHG) in Central Asia with annual emissions of 274 million tons of carbon dioxide (Mt CO2) in 2018 [10]. To meet climate-related targets, Kazakhstan sets its economic diversification pathway towards a sustainable, green economy that will half the energy intensity of its GDP by 2050 [11].
In this context, energy efficiency policies are crucial instruments for addressing the effects of energy shortages, enhancing the energy performance of energy systems, and mitigating the effects of rapidly rising domestic energy prices. On the other hand, there are numerous benefits to improving energy efficiency in the context of energy and climate policies. In addition to reducing greenhouse gas emissions, which can facilitate reaching a country’s climate change goals, energy efficiency can help homeowners to save money on their electricity and heating bills, as well as creating new jobs in green technology and services.
The primary goal of this research is to analyze how different energy efficiency measures impact the energy performance of the educational building of Kazakh-German University in order to evaluate its energy-saving and emission-saving potential. In doing so, estimating the effect of improved building thermal insulation is a major consideration. We use a streamlined approach to develop a simple model to estimate energy and cost savings as a result of increased energy efficiency and enhanced thermal insulation. Although the water heating supply side and heating networks were not considered, the model can be adjusted for specific needs of users and be tailored for meeting defined constraints. Overall, our analysis can aid policy makers in developing a policy framework for lowering the energy demand and related CO2 emissions of education buildings in Kazakhstan.
1.1. Energy Savings Potential
The majority of the housing stock in Kazakhstan, including educational buildings, is composed of old, inefficient structures, with district heat and energy supply systems installed between 1950 and 1985 [12]. Results of auditing [11] showed that the average consumption of heat energy in buildings in Kazakhstan is about 240 kW/m2 per annum, while in comparison, this indicator in Sweden amounted to 82 kW/m2, and in Germany, 120 kW/m2.
The study, administered and conducted by the World Bank in 2018, revealed that the average heat consumption of buildings in Kazakhstan is about 240 kW/m2 per annum, while in comparison, this indicator in Sweden is 82 kW/m2 and in Germany 120 kW/m2.
The study, administered and conducted by the World Bank in 2018, revealed that Almaty has higher primary energy consumption in comparison with other Kazakh peer cities, mostly because of the availability of coal, the level of industrial activities, high losses in the energy production system and highly inefficient energy consumption by end-users. According to [10], Almaty has about 1000 public buildings with a combined floor space of 4 million m2, with 584 educational facilities comprising two-thirds of the total. Municipal buildings in Almaty had the highest heat consumption, ranging from 200 to 250 kWh/m2. The authors of [10] emphasize the lack of adequate energy audits, of financial funds, and the restrictions to local budgets to cover the restoration or renovation of buildings. In addition, renovations are usually carried out as short-term measures that do not significantly improve the thermal performance of buildings.
Each residential structure in Almaty, including public buildings, is connected to the centralized coal-fired heating system, with heat losses totaling 20%. The main challenges of the heat and power sector were considered to be insufficient regulation of the heat supply and distribution system to govern the operation and maintenance of the system, an obsolete heat network infrastructure, and a lack of financial funds supporting the modernization of the heat network. By rough estimation of [10], heat energy savings potential in Almaty was calculated at 40% through building retrofit, while a reduction in energy losses for energy generation and distribution could bring about 37% of energy savings.
1.2. State of Research on Energy Efficiency in Educational Buildings
Quite a lot of works are devoted to the study of the energy efficiency of buildings [13,14,15,16,17,18,19,20,21]. The work of [13] provides an analysis of Chinese universities; in particular, a new concept called “green performance analysis” is proposed. Another study [21] performed an energy analysis of the University of Texas building. The analysis carried out on 13 campus buildings showed that there is significant potential for energy efficiency. In particular, it is possible to save 15,391 MWh of electricity, which is 17% of the base consumption, through the introduction of energy-efficient technologies, which include replacing lamps and replacing pumps with more energy efficient ones. The study showed that solar panels are the most expensive technology, but the payback period for implementation is quite long due to the high cost of electricity. In [14], the energy reduction potential of the ventilation system at the University of Dayton was investigated. In [15], an analysis was made of the energy saving potential of a laboratory in China through the use of an adaptive system. The authors of [16] present the results of a study of creating a schedule considering energy efficiency. The results showed that rescheduling for energy efficiency can save up to 4% of energy resources. A study of the possibility of improving the energy efficiency of an educational building by prioritizing thermal zones [17] showed that it is possible to determine the highest-priority zones for modernization with limited funding. In [18], a study of the air conditioning system using cogeneration for the University of Calgary was carried out, where the main source of energy is thermal power plants based on traditional fuel. It was observed that there is potential to reduce CO2 emissions by 40% from the baseline when using heat pumps. The paper of [19] presents the results of the renovation of an old educational building in Thailand. Within the renovation framework, the lamps were replaced; the air conditioning system was improved. The study of [20] presents the results of replacing the lighting system with a more energy efficient one at the University of Melbourne. Replacing lamps saves up to 64.9% of energy compared to baseline consumption. As stated in [22], there is a significant potential for the modernization of university campuses through renewable energy sources. For example, only a small part of the energy in universities is consumed by renewable energy sources, up to about 20%. The analysis also showed that most energy efficiency measures through renewable energy are implemented in buildings and not in equipment. The work of [23] analyzes energy efficiency measures in educational institutions in Hong Kong. The analysis showed that the energy efficiency of educational institutions in Hong Kong is 0.87, i.e., there is an energy saving potential of 13%.
In [24], the energy saving potential for a building located in a humid and warm climate was investigated. Eight approaches of energy saving were considered. The analysis showed that the sum of all measures will lead to a reduction in energy consumption by 63.5%. In general, the most energy-efficient measures are the modernization of the cooling and ventilation system (29% energy savings), energy-efficient lighting (18% energy savings), and lighting that has a payback period that is much lower than the cooling and ventilation system. The emphasis of the study of [25] was the comprehensive analysis of the combination of retrofit measures and renewable sources based on four types of residential buildings that could result in the primary energy savings at 88%.
1.3. Energy Efficiency Policy and Carbon Regulation in Kazakhstan
The current framework of energy-efficiency policy in buildings is designed to meet the increased future energy demand, decrease the dependence on fossil fuel-based energy production, and reduce the energy intensity of the economy. The goals to satisfy the increasing energy demand and diversify energy efficient economy activities are primarily based on the national energy strategy—the Strategy of Transition of the Republic of Kazakhstan to a “Green Economy”, Strategy-2050—published by the government of Kazakhstan [26].
The Law on Energy Saving and Energy Efficiency Improvement [27] is one the main state regulation policies on energy efficiency that was adopted in 2012 to stimulate energy conservation and energy efficiency, including the use of energy-saving equipment and materials. This policy document establishes technical guidelines and implementation of technical regulation in the field of energy efficiency in buildings. In addition, Kazakhstan has implemented construction standards, such as [27], which specify energy-efficiency requirements for the design of new buildings. Moreover, individual consumers can receive up to 50 percent of the cost of installations to use renewable energy sources (with a total capacity of up to 5 kilowatts) in [28].
Kazakhstan, as a party to the Paris Agreement, has voluntarily committed to reducing greenhouse gas emissions by 15% by 2030 from 1990 levels. At the same time the President of the Republic of Kazakhstan, Kassym-Jomart Tokayev, announced the ambitious goal of achieving carbon neutrality by 2060 at the Climate Ambition Summit in December 2020.
In order to achieve these goals, Kazakhstan has taken a number of measures in carbon regulation. In particular, a reduction in greenhouse gas emissions by 15% by 2030 was enshrined in the Environmental Code [29].
In 2018, the maximum level of emissions was observed—401.7 million tons of CO2-equivalent, which is 5.2% higher than the 1990 level, or 20 million tons of CO2-equivalent. In 2020, greenhouse gas emissions in Kazakhstan will reach 351.2 million CO2-equivalent, which is 7.98% or 30.5 million tons of CO2-equivalent lower than in 1990. In 2020, the reason for the decrease in total national emissions was the restrictions associated with the COVID-19 pandemic. In order to achieve the country’s commitments under the Paris Agreement and to achieve carbon neutrality by 2060, Kazakhstan has developed a low-carbon development strategy. However, at the moment, the release of the document is suspended until November due to the uncertainty with the climate agenda in 2022. The Ministry of National Economy assesses the possible risks and costs for the population and businesses and plans to finalize the document before COP27. The objectives of the strategy are related to the key objectives of the country’s development, including improving the welfare and living standards of the population, entering the top 30 economies of the world, achieving the key goals of “green” development, including reducing the energy intensity of GDP, a significant increase in the share of renewable energy sources, reliable water supply, and increasing the productivity of agricultural land. In Kazakhstan, an Emissions Trading System (ETS) was introduced, which is a key mechanism for regulating greenhouse gas emissions. At present, ETS regulates about 43% of all emissions in Kazakhstan and covers installations in the energy sector, mining, metallurgy, chemical industry and in manufacturing industries. ETS is a flexible market-based instrument that aims to create incentives to reduce greenhouse gas emissions. Allocation of credits by installations is carried out within the framework of the National Plan for the allocation of carbon credits.
The legislation provides for trading carbon units on an auction basis. In addition, the mechanism of carbon offsets is introduced. Carbon offset means the reduction in greenhouse gas emissions and (or) an increase in greenhouse gas absorption achieved as a result of the activities or types of activities in any economic sectors in the Republic of Kazakhstan, aimed at reducing greenhouse gas emissions and (or) increasing greenhouse gas absorption. In this case, the reduction in quota emissions of greenhouse gases of the quoted installation shall not be recognized as a carbon offset. Quoted installation is an installation whose greenhouse gas emission quota exceeds twenty thousand tons of carbon dioxide per year in the regulated sectors of the economy. Thus, the mechanism of carbon offsets is aimed at stimulating the reduction in greenhouse gas emissions at facilities that are not regulated by the ETS. The KNU building is not a quoted installation and, therefore, is not regulated by the ETS. Thus, the reduction in greenhouse gas emissions in the university building can be registered as a carbon offset and implemented in the carbon market. Alternatively, companies, or quota subjects, can invest in improving the energy efficiency of the university building and be applicant carbon units.
1.4. Description of Kazakh-German University (KGU)
The Kazakh-German University (KGU) was founded in 1999 as a private initiative with the aim of training students according to the German standard. KGU has been the only German university in Kazakhstan and Central Asia up to the present time. The university has three faculties: Engineering & Information Technology, World Politics and Economics & Business with bachelor and master programs, and even double degree programs with German universities [30].
The university has two buildings. The figure below presents the main building; this building will be investigated in this paper, and in Figure 1. is presented one of the building of KGU with the solar modules on the roof.
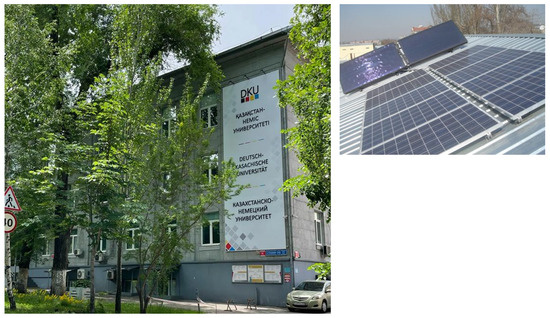
Figure 1.
The main building of KGU and solar modules on the roof.
Building Characteristics
The building under consideration was constructed in 1985. The gross area of the building is 2925 m2 and the net area of the building is 2282 m2. Figure 2 presents a schematic representation of a floor plan of the entrance level of KGU. It has 3 floors and 104 rooms. The building consists of single-skin masonry with plaster applied to the interior and exterior. The wall thickness varies and is a maximum of 51 cm. The load-bearing interior walls are also masonry and have a thickness of approx. 38 cm. The story ceilings consist of a reinforced concrete construction with a thickness of 22 cm. All windows of the building have already been replaced by plastic windows with double glazing. However, those fiberglass plastic windows are made of glass units from early generation of double glazing. Namely, those windows have metal spacer bars around the sealed unit, while the space between glasses is filled with air. Thus, their current overall U-value, which indicates the performance in retaining heat, is extremely low (U-value = 2.6 W/(m2∗K)). The roof consists of an unheated hipped roof [30].
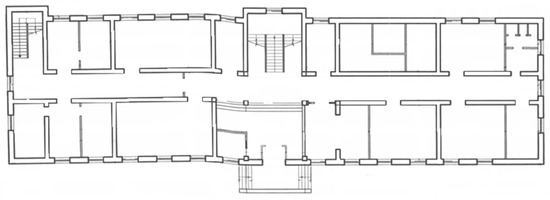
Figure 2.
Floor plan of entrance level of KGU, reprinted with permission from [31].
The measurements of the interior temperatures are particularly worth mentioning. In almost all rooms, temperatures of 297 K to 299 K (24 to 26 °C) could be measured in winter. The measurements in individual rooms clearly indicate that in order to reduce the room temperatures, the windows are repeatedly opened during lectures, as shown in Figure 3, between 10.00 and 18.00.
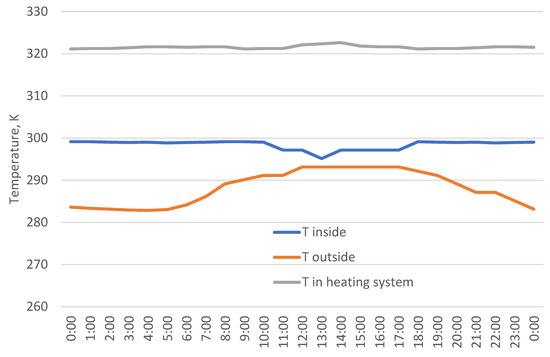
Figure 3.
Measurement of temperature on a winter day in 2016, there is no copyright issue [32].
For example, the measurement of temperature inside and outside of the building is shown in Figure 3.
The building temperature is assumed to be around 298 Kelvin (25 °C Celsius) during winter. The suggested ambient temperature for best body functionality is 294 Kelvin to 295 Kelvin (21 to 22 degrees). Various measurements were carried out at the KGU. These were mainly measurements of the temperatures of the interior, outside air and heating flow. Furthermore, the electrical power of small consumers was recorded. Temperature data loggers 175T3 from Testo were used for the temperature measurements. The university building is equipped with a conventional central heating system that is fed by a district heating network via a heat-exchanger to provide space heating and hot water needs. The heating equipment comprises insulated horizontal pipes that carry hot water to individual risers beneath the basement ceilings. The space heating is thus supplied to convection radiators that are not equipped with thermostatic valves, which make the regulation of heat transfer impossible on an individual level.
The study conducted by the group of the researchers and students of KGU revealed that there is untapped potential for energy savings through enhancement of energy efficiency in the building [33].
2. Materials and Methods
The methodology employed in this paper seeks to analyze the current energy performance of KGU, the impact of retrofitting measures in terms of energy, economic and environmental performance. For these purposes, a spreadsheet-based modeling tool was developed for undertaking simplified mathematical representation of thermal balance in the building with consideration of integrating energy efficient measures being applied. The model is designed to assist decision makers in energy-efficiency rating procedures and providing insights on the impact of retrofitting measures and renewable energy technologies on energy performance of the building. The impact can be measured and be represented in heat energy consumption reduction and cost savings in heating bills and be complied with owner-specified energy consumption reduction targets. The model is organized into three stages: (1) input data; (2) simulation computations; and (3) model output, as shown in Figure 4.
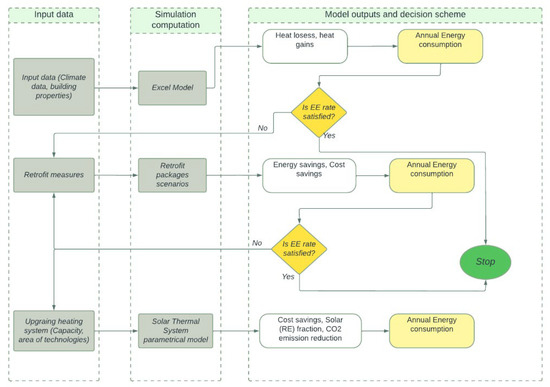
Figure 4.
Flowchart of employed methodology and the structure of the model.
Modifying the interior and exterior wall systems is a feasible solution for achieving energy savings in existing buildings through interfering with the building’s construction. Incorporating insulation materials is a practical and cost-effective solution for building retrofitting and energy upgrades. Hence, as the first affordable and reliable solution for renovating the building of KGU, thermal insulation improvements were considered, then installation of building-level automation substations as the demand-side efficiency measure for the individual level with possibility of regulation and integration of a solar thermal system with thermal collectors and storage as a renewable energy generation source for meeting the energy consumption for heating the space.
2.1. Thermal Energy Balance
The first stage of the analysis is a simulation model built on [34], which provides calculation methods for annual heat energy demand and heat transfer losses through building envelope and ventilation. Input data are gathered from building technical passports, specification lists of building elements, and internal university reports and are validated via on-site measurement (only for geometrical parameters of building elements) and include the following: size and geometry of the building; thermal insulation properties of building fabrics; building’s ventilation characteristics; solar gains through glazing; and internal heat gains captured from appliances.
The governing relationship between building properties and energy performance are complex and various. The following equations are set in accordance with [32] and describe the relationship of climate data, geometrical and physical properties of buildings.
where Qh—annual transmission heat losses, kWh/a; Um—overall heat transfer coefficient, W/m2∙K; Dd—degree—day of the heating period, K∙day; = 2841 m2—the total area of the outer enclosing surfaces.
where —total heat loss for ventilation, kWh/a; —the conditional heat transfer coefficient of the building, considering heat losses due to infiltration and ventilation;
where tint = 20.0 °C is the design temperature of the indoor air, the required temperature of each room is multiplied by its area and height; tht = −1.61 °C—average outdoor temperature during the heating period; zht = 168 days—duration of the heating period;
where —internal heat gains during the heating period, kWh/a; qint = 254.38 W/(m2 ∙day)—the level of domestic heat emissions per 1 m2 of residential premises or estimated area of a public building, determined in [35]; Al = 1684 m2—the sum of the areas of all rooms, with the exception of corridors, vestibules, stairwells, and elevator shafts.
where —the solar heat load during the heating season, kWh/a; Qs—heat gains through windows and lanterns from solar radiation during the heating period, kWh/a; v = 0.8—coefficient considering the ability of building envelopes to accumulate or release heat; ξ = 0.5—coefficient of efficiency of automatic control of heat supply in heating systems; βh = 1.13—coefficient considering the additional heat consumption of the heating system, associated with the discreteness of the nominal heat flow of the range of heating devices, with their additional heat losses through the radiator sections of the fences, increased air temperature in corner rooms, and heat losses of pipelines passing through unheated rooms.
2.2. Energy Performance Assessment
The second stage in the developing model focuses on integration of energy efficiency measures into the thermal energy balance of the buildings. Widespread, easily assessable in the Kazakhstan market and affordable at a low-cost retrofitting measures were considered for estimating potential energy and cost savings. Retrofitting measures are added to each other or grouped into packages to enhance the effect of savings. In order to estimate the impact of the measures on heat transfer properties, the resulting heat transfer coefficient (U-value) formula was employed as specified in [36]:
where —the effective U-value and the effective thermal resistance of the envelope element i, W/m2∙K, m2∗K/W;—the effective U-value and the effective thermal resistance of the envelope element i in the original state, W/m2∙K, m2∗K/W; Rmeasure,i—the thermal resistance of a thermal retrofitting measure applied to element i, m2∗K/W. In cases where an additional layer of insulation is added to the existing insulation, Rmeasure,i is expressed as division of the insulation thickness dins,i to the thermal conductivity λin,i; Radd,i—the additional thermal resistance due to unheated space bordering at the envelope element i, m2∗K/W.
Additional thermal resistance due to respective unheated spaces was selected in accordance with the recommendations of [35], while thermal conductivity and thickness of insulation were taken from official websites of insulation and construction materials’ local manufacturer and providers.
After quantifying the corresponding heat transfer coefficient for each measure, heat losses through the building envelope (roof, wall, floor) during the heating season were calculated according to EN ISO 13790:2008 [36], while differences between heat losses before and after replacing windows and doors were calculated on the assumption that the U value is changed in the calculation formula.
Therefore, reduced heat losses resulting from the introduction of energy efficiency measures are estimated as follows:
where —reduced conductive heat losses, original heat loss value, and resulting heat loss value in element i, kWh.
As a commonly established metric for evaluating the cumulated impact of retrofitting measures on energy performance of the buildings, specific annual energy consumption was used. According to the university energy bills, space heat energy consumption is recorded and fixed separately from electricity and water heating consumption; hence, actual annual heat energy consumption was taken from energy bills recorded in 2020 and used for further calculations.
Finally, the annual heat energy consumption indicator (q, %) was deployed in compliance with the requirements stated in [32] for assessing building energy efficiency classes.
where —designed normalized value of annual heat energy consumption, calculated in accordance with [32], kWh.
The resulting heat energy consumption indicator was compared with the values in Table 1, and corresponding building energy efficiency class was determined. Energy performance before retrofit is calculated according to Equation (9) and considered as a baseline point for comparison with further developed retrofit scenario outputs.

Table 1.
Energy efficiency classes of residential and public buildings, there is no copyright issue [36].
The data associated with each retrofit is utilized to obtain the energy intensity and energy savings. In conjunction with the total number of retrofit measures, this allows us to simulate the total energy savings associated with a range of retrofit combinations. The savings in costs on bills were calculated on the basis of the average value of reduction in the heat consumption due to renovation and assuming an average price for 1 kWh of heat supplied from the district heating system at KZT 7.81 (USD 0.017) [37].
2.3. Energy Saving Concept and Renovation Scenarios
The retrofitting works presented in this chapter were recommended in the study of [33] and thus, motivated to include the extended methodology for energy performance evaluation with consideration of retrofitting scenarios. Considering the data obtained from the monitoring study, optimal retrofitting actions were identified and grouped as follows:
- (1)
- Minor renovation, “baseline” retrofit that would contain measures of replacing the components that have reached, or are very close to, the end of their lifetime by new ones that could comply with the recommendation in national building code.
- (2)
- Full renovation of the entire building envelope to achieve the minimum thermal transmittance values. This scenario is different than the previous one since the whole building envelope element is updated.
- (3)
- Major renovation intervention: achieve at least 50% reduction in the base case energy consumption. This is proposed to examine how far energy savings can be pushed in order to improve the building’s energy and heating performance.
The scenario setting aims to apply constructive measures on the envelope for the first two scenarios and to implement active measures aimed to reach the objectives of the last scenario, such as installing a building-level substation that could enable operation of an automation system and regulation of thermostatic valves.
It should also be noted that no mechanical ventilation was included in the model; however, further improvements of air ventilation systems should be included in retrofitting packages to ensure thermal comfort for occupants.
2.3.1. Minor Renovation Scenario
One of the measures of this package is to change the windows from the old double-glazed or two panes to modern windows with a U-value lower than 1.3, as this intervention could bring significant heat loss reduction and strengthen the potential for further advanced measures. Even though the windows still are in operating conditions, their U-values are low. They have a U-value of 2.6 W/(m2∗K), and the majority of the windows were installed at the same time. Two different types of windows were investigated: double- and triple-glazed with different R-transmittance values of R = 0.8. 0.85. 0.9, and 0.95 m2∗K/W. All of them have been simulated to see how the energy consumption of the building is affected, and for the resulting scenarios, windows with R = 0.85 m2∗k/W were incorporated since they can gain heat reduction at low cost.
As an additional measure, the roof is insulated to achieve a reduction in heat losses, due to its present high thermal transmittance (0.44 W/(m2∗K)). The roof has been insulated externally with 150 mm expanded blast furnace slag. It was also covered with 20 additional mm of weather protection (asphalt). Due to the extremely low density of extruded polystyrene (XPS) (35 kg/m3), it will not provide a considerable amount of additional weight to the building structure.
There are five different sub-scenarios:
- “Windows”: substitution of all windows on all sides with modern triple-glazed ones;
- “Roof”: insulation of roof with an addition of 200 mm XPS on the roof;
- “Windows+roof”: same as before but with an addition of 200 mm XPS on the roof;
- “Door”: replacement of all old wooden doors with the new one with metal frames;
- “Minor: windows+roof+door”: same as “Windows+roof” but with replacement of all old wooden doors.
2.3.2. Full Renovation Scenario
In this scenario, the building envelope elements are provided with enough external insulation to further increase the energy-efficient class of buildings. There are several insulation materials that would be suitable: XPS is chosen again, since it is one the most used insulation materials in such projects. The envelope elements are insulated as shown in Table 2.
Table 2.
Renovation measures and their heat energy performance parameters.
The building also has the improvements from the previous scenario (new triple glazed windows, doors and insulated roof). Given the high amount of energy loss due to poor wall insulation, walls and floors were insulated with the same XPS layer.
There are two different sub-scenarios:
“Minor + Wall”: insulation of the opaque elements as above, windows as in the minor renovation scenario
“Minor + Wall + Floor”: same as above but with insulation of floor area.
2.3.3. Major Renovation Scenario
The goal in this renovation scenario is to reach a 50% reduction in the final energy consumption of the building compared to the baseline value. A parametric study was carried out to examine the energy performance being influenced by different insulation thicknesses and window types. The three considered window types are double glazed with U = 1.25 W/(m2∗K), and triple-glazed with U = 1.18 W/(m2∗K) and U = 1 W/(m2∗K). For every window type, three insulation thicknesses were considered, as will be shown in Chapter 4.
The installation of building-level (automatic) substations (BLS) with a 90% efficiency rate and thermostatic valves on radiators was considered in order better to allocate heat where it is needed and ensure better thermal comfort of living spaces.
3. Renewable Energy Generation Integration
The third stage envisaged in the model is a mathematical representation of integrated solar heating system as another energy efficiency measures. Given the fact that the university has a special laboratory facility that uses an installed solar photovoltaic and solar collector system for educational purposes, the focus of this research is evaluation of potential renewable generation based on these technologies. This study considers not only energy generation potential, but also rough estimation of coverage space heating needs in the buildings by renewable technologies. Essentially, the mathematical model of energy balance was developed in hourly time series and considered as a parametrical model to help any users determine technologies’ parameters and potential energy generation based on climate conditions.
Firstly, space heat demand was defined and synthesized using the PVSol software typical load library, considering the duration of the heating season specifically in Almaty city and annual space heat demand in kWh, which resulted after the implementation of baseline renovation scenario when efficient energy performance with minimal heat loss is ensured. The graphical representation of the heat profile as well as the heat load duration curve is shown in Appendix B.
Secondly, the weather data, which include local hourly ambient temperature and global solar irradiation data for a typical meteorological year (TMY), were utilized [38]. This hourly weather data are utilized by the model to estimate the potential for solar energy production in the building location.
The solar hybrid system consists of two elements: solar collectors and thermal storage systems with tanks. Solar system component parameters are contained in Appendix C.
The mathematical model of solar collector is developed on the concept of interaction between external energy balance of absorber (heat transfer flowing from absorber surface to ambient environment) and internal energy balance of absorber (heat transfer flowing from absorber surface into heat transfer fluid). The energy balance of the solar collector under steady-state conditions is expressed according to principle Hottel–Whillier equation [39] for useful energy gain:
where Aa—aperture area, m2;
FR—collector heat removal factor; τ—cover glazing transmittance; α—absorptance and U—overall heat loss coefficient of solar collector; tin, ta—heat transfer fluid input temperature and ambient temperature, respectively; G—solar irradiation, kWh/m2.
For simplification purposes, the efficiency of the solar collectors was calculated as follows:
where
- —global radiation incident on the solar collector, kWh/m2;
- —parameters taken from ASHRAE standards [40].
The model allows users to define numbers and collector sizes to estimate different solar system designs and their corresponding solar system energy yield. For this study, predetermined parameters of solar collectors were utilized; however, the number of collectors was adapted in order to maximize the renewable energy generation fraction without cost-efficiency analysis. Furthermore, a hot water storage tank equipped with two heat exchangers is integrated. The first one receiving hot fluid from the solar collector facilitates the accumulation of energy, whereas the second heat exchanger allows the tank to transfer the stored energy to the space heating floor. The storage size was designed without considering the hot water heating needs but with consideration operational needs of solar thermal system.
4. Results
The following sections present the results from the building of KGU thermal energy balance modeling and integrating energy-efficiency measures for the calculated and actual energy consumption and the savings achieved after the renovations, complemented by CO2 emission reduction and renewable energy fraction analysis after introduction of solar thermal system for space heating.
4.1. Energy Audit Modeling—Annual Energy Balance Modeling Results
Figure 5 shows an analysis of the heat loss of the building during the heating period. As can be seen from the figure, 87% of the losses are due to the walls and roof of the building, with the remaining 13% is due to ventilation losses. The losses to the environment through the walls are due to the fact that the building itself was constructed during the Soviet era and the building insulation has not changed much since then. Ventilation losses are mainly related to the opening of windows due to the uneven heating of the rooms and the increasing number of students in the classrooms. The figure also shows the share of use of internal heat sources and solar heating. Overall, they account for 30% of the total heat losses.
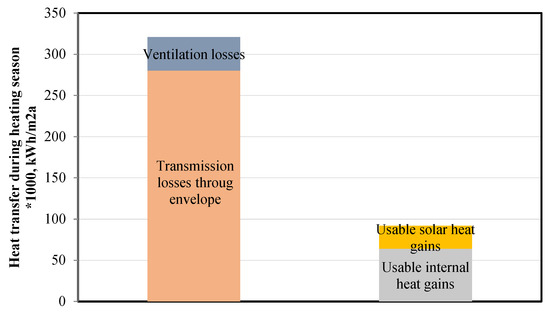
Figure 5.
Heat transfer through building envelope during heating season, kWh/m2 ∗a.
The annual final energy consumption of the building in the different sub-scenarios is shown in Figure 6. The dashed line represents the 50% reduction in annual heat energy consumption of building per m2, which corresponds to a total yearly energy consumption of 47 kWh/(m²∗K).
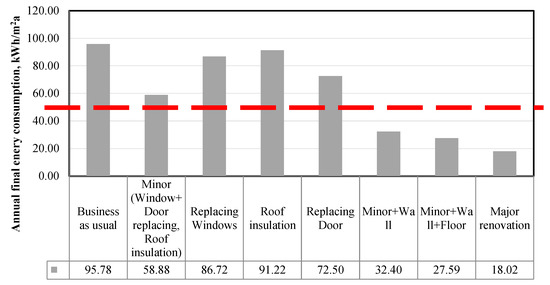
Figure 6.
Annual final energy consumption of the building in different renovation scenarios.
4.2. Results of Retrofitting Scenarios Simulation
Figure 7 shows the overall U-value of the building for the different scenarios. It can be observed that the minor renovation scenario coupled with wall and floor insulation resulted in an overall U-value below 0.4 W/(m2∗K).
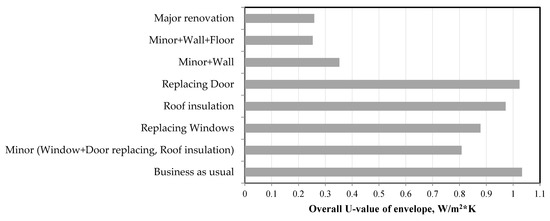
Figure 7.
Overall U-value of envelope, W/m2∗K in different renovation scenarios.
The results in Figure 7 also generally confirm the data presented in Figure 6. The lowest U-value is for minor+wall+floor and is 0.25 W/(m2∗K), the highest, respectively, for business as usual. Moreover, replacing the doors does not have a significant effect, as most of the heat loss occurs on the outer walls and the roof.
Figure 8 presents an analysis of the impact of different retrofits on the energy efficiency class of the building. As can be seen from the figure, a major renovation will move the energy efficiency class of the building from basic C++ to A++, and the specific heat energy indicator will be 82.78%. Replacing wall and floor insulation and minor renovation will also significantly raise the energy efficiency class to A++. Replacing doors will raise that up to B+, and replacing windows will increase it up to class B.
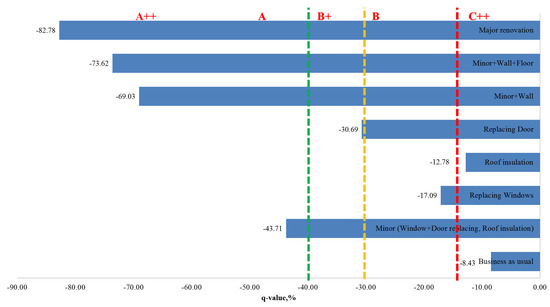
Figure 8.
Specific heat energy indicator in % for different renovation scenarios.
The different insulation thicknesses make the energy consumption differ for every window scenario. Decreasing the thermal transmittance of the windows from 1.25 to 1 W/m²∗K results in an energy saving of 1.2 kWh/(m²∗K).
From Figure 9, it is clear that there is a potential for saving money by using thinner insulation, as using 300 mm insulation can lead to significant costs compared to using 200 mm insulation. The difference between the energy consumption of 200 mm and 300 mm insulation is 0.96%. However, the price difference between the two can be significant given the insulation coverage area.
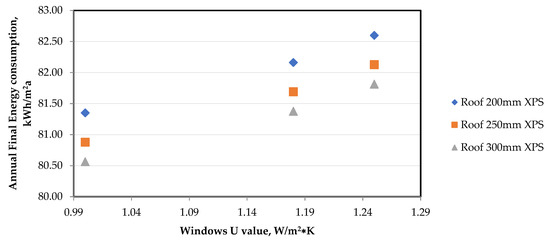
Figure 9.
Annual final energy consumption of the building for different windows and insulation thicknesses.
The insulation thickness affects the U-value as shown in Figure 10. The curves are not linear, which means that the same increase in insulation thickness does not correspond to the same decrease in heat transmittance. Obviously, there is an economic limit to increasing insulation thickness. In our case, increasing the insulation thickness from 200 mm to 350 mm, results in a U-value reduction of 33%, but this does not result in a significant improvement in the energy efficiency of the building when all heat losses are considered.
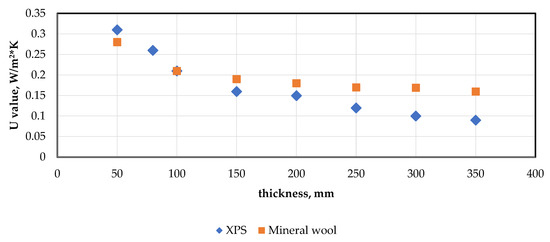
Figure 10.
U-value as a function of insulation thickness, opaque envelope elements.
Table 3 presents the results of the energy efficiency improvement analysis of the KGU building. The results of each sub-scenario simulations are presented in Appendix A. As can be seen from the table, the specific energy savings will be 77.76 kWh/m2a when applying these measures. By implementing such measures, the university can save up to KZT 1.7 million, which is equal to USD 3957. A similar result is obtained with minor replacements of walls and roofs, at which KZT 1.5 million can be saved, equivalent to USD 3470. Using minor renovation measures and replacing wall insulation will save USD 3225. All other measures save less than USD 1820.
Table 3.
Energy and cost savings in different renovation scenarios.
A minor renovation scenario entails the following interventions: replacing windows with R = 0.85 m2∗K/W, replacing wooden doors with modern ones with metal frames and roof insulation with XPS 200 mm. A full renovation scenario includes the following measures: replacing windows with R = 0.85 m2∗K/W, replacing wooden doors with modern one with metal frames, and roof insulation with XPS 200 mm, wall insulation with XPS 200 mm and floor insulation with XPS 200 mm. A major renovation scenario includes the retrofitting measures listed in the full renovation scenario and the integration of BLS automation system.
4.3. Results of Renewable Energy Generation Integration Simulation
Table 4 shows the annual simulation results of renewable energy fraction (REF) that covered heat demand, cost savings on energy bills and CO2 emission reduction obtained based on the objective of maximizing the fraction of renewable energy that is used for meeting heat demand. The critical assumption was made on a calculation of emission reduction. Fuel switching in the central heating system was considered as a key variable and contributor to emission reduction. Nonetheless, it will give an additional level of insight to the potential impact of the renewable energy technologies incorporated into the building heating system.
Table 4.
The results of simulation of solar thermal system for meeting KGU building heat demand for one year.
These results are represented for the whole year considering different thermal storage capacities (0, 100, 200, 300, 400, 500 kWh). The table proves that at storage capacity 100 to 500 kWh, the annual heat demand covered by the solar thermal system goes up from 26% to 35%, reaching the maximum fraction at 500 kWh. Further increasing the storage capacity will not lead to significant improvement due to solar system efficiency constraints and solar irradiation availability. Fuel switching from coal to gas in the heating system can bring down CO2 emission values and increase cost savings up to 60% compared to baseline results without any implementation of renewable energy technologies (Figure 11).
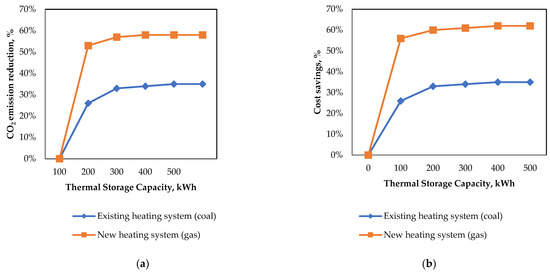
Figure 11.
Annual CO2 emission reduction (a) and cost savings (b) for different solar thermal storage capacity in coal- or gas-powered heating systems.
Detailed analysis of hourly simulation results indicated that large thermal storage capacities (300, 400, 500 kWh) satisfy the 65% of the total heat demand for more than 7 h/day in January, while in April–May, this capacity allows us to satisfy up to 100% of the total heat demand for 6 h/day. The smaller thermal storage capacities only satisfy the 56% of the total heat demand for 5 h/day in January (and 100 % of heat demand for 4 h/ day in April–May). Thus, increasing thermal storage capacity allows higher renewable energy generation fraction. Indeed, the annual average REF obtained in this case is, respectively, equal to 0, 26, 30, 33, 34, and 35% for thermal storage capacities equal to 0, 2, 3, 5, 6 and 7 m3 (Figure 12).
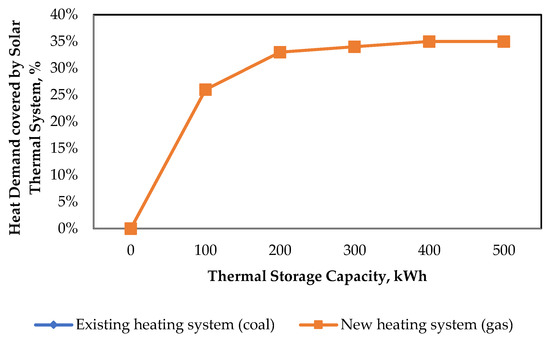
Figure 12.
Annual heat demand coverage by solar thermal system for different solar thermal storage capacity in coal- or gas-powered heating systems.
5. Discussion and Conclusions
This article presents an analysis of the potential for improving the energy efficiency of an educational building. The analysis shows that there is considerable potential for energy savings at the Kazakh-German University. The study was carried out in Almaty, a city with a sharply continental climate with high humidity, relatively cold winters and hot summers. Several options for improving energy efficiency were suggested, from the simplest, such as replacing windows and doors, to the most complex, including the use of energy-efficient windows, efficient insulation of the roof and walls, and the installation of a heating plant. For the analysis, the current energy efficiency class of the building was determined according to the standards.
Calculations show that it is least efficient to replace the roof insulation, which reduces energy consumption to 4.55 kW/m2 and saves USD 231 per year. Replacing plastic windows with triple-glazed plastic windows will reduce energy consumption by 9.06 kWh/m2, which leads to energy savings of 461 USD/year. This can be explained by the high thermal transmittance of the existing windows. The sum of the above changes we denoted as minor renovations, respectively, and all the above measures give an energy saving of 36.9 kW/m2.
The replacement of the thermal insulation of the walls, together with the insulation measures, will already result in significant energy savings. In our case, it is USD 3225 per year, as the main heat losses are on the outside walls of the building due to obsolescence of the existing insulation. Adding insulation to the roof of the building will increase the savings to 68.19 kWh/m2, as the roof is also a source of loss. The total annual savings are USD 3470. The most energy-efficient measures are replacing windows with energy-efficient ones, installing a heating plant, and insulating all outside surfaces of the building. These measures are called major. They reduce energy consumption by 77.76 per square meter of the building. The savings from these measures equals USD 3957.
The solar thermal system plays an important role in reducing heat energy consumption from the central heating system, leading consequently to a significant reduction in CO2 emissions. It provides annual energy generation of 34,248 kWh, out of which 28,874 kWh goes from the storage to cover the heat demand. Annually, nearly 35% of heat demand can be met by the solar thermal system at capacity level of 400 and 500 kWh. Consequently, a 35% reduction in CO2 emissions compared to the baseline heat balance scenario can be achieved, while cost savings can reach 460 USD/year. However, when considering heat demand with no prior retrofitting, only 13% of annual heat consumption from the central heating system can be covered by the proposed renewable energy system. Therefore, retrofitting insulation level of the building envelope is crucial for achieving significant heat demand reduction and better energy performance of the buildings. Essentially, fuel switching in the existing heating system from coal to gas can lead to significant emission mitigation, accounting for the half of the emission reduction. This is caused by low CO2 emission intensity of gas in comparison with coal. The amount of CO2 saving per year can exceed 23 tons/year/kW for small thermal storage capacities (100, 200, 30 kWh) and 20 tons/year/kW for large storage capacities (400,500 kWh). In regard to the performance of the solar thermals system, the renewable energy utilization rate could be more than 25% for small thermal storage capacities, and they could be more than 35% for large thermal storage capacities. Increasing thermal storage capacity allows a high renewable energy fraction and, thus, the heat consumption reduction, but it should be noted that cost optimality criteria was not analyzed as the focus of this study is analysis of heat demand reduction methods and their impact on energy and cost savings.
The developed model and analysis can act as a basis for improved understanding of mitigation strategies and costs, as well as a starting point for the analysis of available retrofitting measures and renewable energy technologies for educational building of KGU. As is evident from the results of different retrofit scenarios, the energy-efficiency improvement in the existing building could represent huge potential for energy and cost savings as a result of energy demand reduction and better utilization of heating demand. Moreover, increased energy efficiency can bring multiple socially valued outcomes. They could be translated into social benefits such as the better indoor environment, public health improvements, ability to acquire better energy services, increased disposable income at individual level, job creation, and reduced energy related public expenditures at the national level. In addition, there are also climate policy tools aimed to address climate change issues and bring social benefits. The implementation of retrofitting measures, energy efficiency interventions, and renewable energy technology incorporations usually require high investments and external financial support. A carbon offsetting mechanism that is functioning in Kazakhstan can consider the buildings, including educational ones, as an offset project type and facilitate the energy efficiency enhancement in KGU buildings and at the same time contribute to the mitigation of CO2 emissions.
Author Contributions
Conceptualization, N.D., N.T. and D.U.; methodology, N.D., N.T. and D.U.; software, N.T.; validation, N.D., N.T., D.U. and D.B.; formal analysis, N.T., D.U., R.S. and D.B.; investigation, N.D., N.T. and D.U., M.S., R.S. and D.B.; resources, N.D., and R.S.; data curation, N.D., D.U. and D.B.; writing—original draft preparation, N.D., N.T. and D.U.; writing—N.D., N.T. and D.U., M.S., R.S. and D.B.; visualization, N.D. and N.T.; supervision, N.D. and R.S.; project administration, N.D.; funding acquisition, N.D. and R.S.. All authors have read and agreed to the published version of the manuscript.
Funding
This research was funded by Land Schleswig-Holstein within the funding program Open Access Publikationsfonds.
Institutional Review Board Statement
Not applicable, for studies not involving humans or animals.
Informed Consent Statement
Not applicable.
Data Availability Statement
Conflicts of Interest
The authors declare no conflict of interest.
Appendix A
Table A1.
Energy and cost savings in different renovation sub-scenarios.
Table A1.
Energy and cost savings in different renovation sub-scenarios.
| Measures | q_after, kWh/m2 | Cost_Savings on Bill, Tenge | Energy_Savings, kWh/m2 | Annual Final Energy Consumption, kWh/m2a |
|---|---|---|---|---|
| BLS automation system | −17.583 | 212,527.96 | 9.578 | 86.201 |
| Floor insulation with XPS 200 mm | −13.017 | 106,545.952 | 4.802 | 90.977 |
| Replacing window with R = 0.8 m2∗K/W | −16.674 | 191,419.493 | 8.627 | 87.152 |
| Replacing window with R = 0.85 m2∗K/W | −17.092 | 201,118.081 | 9.064 | 86.715 |
| Replacing window with R = 0.9 m2∗K/W | −17.510 | 210,816.669 | 9.501 | 86.278 |
| Replacing window with R = 0.95 m2∗K/W | −17.868 | 219,129.744 | 9.875 | 85.904 |
| Replacing wooden door to modern with metal frames | −30.687 | 516,642.309 | 23.283 | 72.496 |
| Roof insulation with mineral wool 100 mm | −11.880 | 80,161.160 | 3.613 | 92.166 |
| Roof insulation with mineral wool 150 mm | −12.180 | 87,124.529 | 3.926 | 91.853 |
| Roof insulation with mineral wool 200 mm | −12.330 | 90,606.214 | 4.083 | 91.696 |
| Roof insulation with mineral wool 250 mm | −12.480 | 94,087.899 | 4.240 | 91.539 |
| Roof insulation with mineral wool 300 mm | −12.495 | 94,436.068 | 4.256 | 91.523 |
| Roof insulation with mineral wool 350 mm | −12.630 | 97,569.584 | 4.397 | 91.382 |
| Roof insulation with mineral wool 50 mm | −10.830 | 55,789.365 | 2.514 | 93.265 |
| Roof insulation with XPS 100 mm | −11.880 | 80,161.160 | 3.613 | 92.166 |
| Roof insulation with XPS 150 mm | −12.630 | 97,569.584 | 4.397 | 91.382 |
| Roof insulation with XPS 200 mm | −12.780 | 101,051.269 | 4.554 | 91.225 |
| Roof insulation with XPS 250 mm | −13.230 | 111,496.324 | 5.025 | 90.754 |
| Roof insulation with XPS 300 mm | −13.530 | 118,459.693 | 5.339 | 90.440 |
| Roof insulation with XPS 350 mm | −13.680 | 121,941.378 | 5.495 | 90.283 |
| Roof insulation with XPS 50 mm | −10.380 | 45,344.310 | 2.044 | 93.735 |
| Roof insulation with XPS 80 mm | −11.130 | 62,752.735 | 2.828 | 92.951 |
| Wall insulation East with mineral wool 200 mm | −17.914 | 220,206.892 | 9.924 | 85.855 |
| Wall insulation East with XPS 200 mm | −19.002 | 245,456.044 | 11.062 | 84.717 |
| Wall insulation South/North with XPS 100 mm | −10.714 | 53,091.668 | 2.393 | 93.386 |
| Wall insulation West with XPS 200 mm | −19.232 | 250,789.349 | 11.302 | 84.477 |
Appendix B

Figure A1.
Annual heat demand of KGU building, kW.

Figure A2.
Annual heat balance of KGU building with solar thermal system, kWh.

Figure A3.
January heat balance of KGU building with solar thermal system, kWh.
Appendix C
Table A2.
The technical parameters of solar thermal system.
Table A2.
The technical parameters of solar thermal system.
| Parameters | Values of Parameters |
|---|---|
| Solar Thermal Collector | - |
| Collector Type | Flat Plate Collector |
| Area | 2.5 m2 |
| Tilt | 35 degree |
| Azimuth | 180 degree |
| Storage tank | - |
| Solar Tank Volume | Flat Plate Collector |
| Solar Tank heat loss coefficient | 1 W/m2∗C |
| Effectiveness of heat exchanger | 85% |
| Outlet set temperature | 50 degree |
| Electric Pump | - |
| Rated Power | 110 kW |
| Pump efficiency | 90% |
References
- de Coninck, H.; Revi, A.; Babiker, M.; Bertoldi, P.; Buckeridge, M.; Cartwright, A.; Dong, W.; Ford, J.; Fuss, S.; Hourcade, J.-C.; et al. Strengthening and Implementing the Global Response. In Global Warming of 1.5 C: Summary for Policy Makers; IPCC—The Intergovernmental Panel on Climate Change: Geneva, Schwizerland, 2018; pp. 313–444. [Google Scholar]
- European Commission. In Focus: Energy Efficiency in Buildings. Available online: https://ec.europa.eu/info/news/focus-energy-efficiency-buildings-2020-lut-17_en (accessed on 17 May 2022).
- Röck, M.; Saade, M.R.M.; Balouktsi, M.; Rasmussen, F.N.; Birgisdottir, H.; Frischknecht, R.; Habert, G.; Lützkendorf, T.; Passer, A. Embodied GHG emissions of buildings—The hidden challenge for effective climate change mitigation. Appl. Energy 2020, 258, 114107. [Google Scholar] [CrossRef]
- Knobloch, F.; Pollitt, H.; Chewpreecha, U.; Daioglou, V.; Mercure, J.-F. Simulating the deep decarbonisation of residential heating for limiting global warming to 1.5 °C. Energy Effic. 2019, 12, 521–550. [Google Scholar] [CrossRef]
- Levesque, A.; Pietzcker, R.C.; Luderer, G. Halving energy demand from buildings: The impact of low consumption practices. Technol. Forecast. Soc. Change 2019, 146, 253–266. [Google Scholar] [CrossRef]
- Mastrucci, A.; van Ruijven, B.; Byers, E.; Poblete-Cazenave, M.; Pachauri, S. Global scenarios of residential heating and cooling energy demand and CO2 emissions. Clim. Change 2021, 168, 1–26. [Google Scholar] [CrossRef]
- Daioglou, V.; Mikropoulos, E.; Gernaat, D.; van Vuuren, D.P. Efficiency improvement and technology choice for energy and emission reductions of the residential sector. Energy 2022, 243, 122994. [Google Scholar] [CrossRef]
- Perez, Y.V.; Capeluto, I.G. Climatic considerations in school building design in the hot–humid climate for reducing energy consumption. Appl. Energy 2009, 86, 340–348. [Google Scholar] [CrossRef]
- Pérez-Lombard, L.; Ortiz, J.; Pout, C. A review on buildings energy consumption information. Energy Build. 2008, 40, 394–398. [Google Scholar] [CrossRef]
- World Bank Group. Unlocking Energy Efficiency Potentials in Cities in Kazakhstan. 2018. Available online: https://openknowledge.worldbank.org/handle/10986/29531 (accessed on 2 May 2022).
- The United Nations Economic Commission for Europe. Chapter 6. Energy Efficiency and Energy Saving in Residential Sector. Available online: https://unece.org/DAM/hlm/prgm/cph/countries/kazakhstan/10_CP_Kazakhstan_part1chapter6.ENG.pdf (accessed on 7 July 2022).
- Republic of Kazakhstan, Committee on Statistics of the Ministry of National Economy. Statistical Book “Housing and Communal Services”, Astana. 2017. Available online: https://www.efta.int/sites/default/files/publications/statistics-eso/reports/2017-07-kazakhstan.pdf (accessed on 12 July 2022).
- Liu, Q.; Ren, J. Research on the building energy efficiency design strategy of Chinese universities based on green performance analysis. Energy Build. 2020, 224, 110242. [Google Scholar] [CrossRef]
- Shea, R.P.; Kissock, K.; Selvacanabady, A. Reducing university air handling unit energy usage through controls-based energy efficiency measures. Energy Build. 2019, 194, 105–112. [Google Scholar] [CrossRef]
- Ge, J.; Wu, J.; Chen, S.; Wu, J. Energy efficiency optimization strategies for university research buildings with hot summer and cold winter climate of China based on the adaptive thermal comfort. J. Build. Eng. 2018, 18, 321–330. [Google Scholar] [CrossRef]
- Song, K.; Kim, S.; Park, M.; Lee, H.-S. Energy efficiency-based course timetabling for university buildings. Energy 2017, 139, 394–405. [Google Scholar] [CrossRef]
- Carbonara, E.; Tiberi, M. Local Energy Efficiency Interventions by the Prioritization of Thermal Zones in an Historical University Building. Energy Procedia 2016, 101, 988–994. [Google Scholar] [CrossRef]
- Mura, P.G.; Innamorati, R. Design of a New System of High-power Efficiency Conditioning Cogeneration Energy for a Building of the University of Cagliari with Fossil Fuel Plants. Energy Procedia 2015, 78, 1111–1116. [Google Scholar] [CrossRef][Green Version]
- Rungruengsri, C. Energy Efficiency Renovation in Historical Building. Case Study: Maha Chulalongkorn Building and Maha Vajiravudh Building, Chulalongkorn University, Thailand. Energy Procedia 2017, 138, 1110–1115. [Google Scholar] [CrossRef]
- Di Stefano, J. Energy efficiency and the environment: The potential for energy efficient lighting to save energy and reduce carbon dioxide emissions at Melbourne University, Australia. Energy 2000, 25, 823–839. [Google Scholar] [CrossRef]
- Mohammadalizadehkorde, M.; Weaver, R. Quantifying potential savings from sustainable energy projects at a large public university: An energy efficiency assessment for texas state university. Sustain. Energy Technol. Assess. 2020, 37, 100570. [Google Scholar] [CrossRef]
- Leal Filho, W.; Salvia, A.L.; Paço, A.d.; Anholon, R.; Gonçalves Quelhas, O.L.; Rampasso, I.S.; Ng, A.; Balogun, A.-L.; Kondev, B.; Brandli, L.L. A comparative study of approaches towards energy efficiency and renewable energy use at higher education institutions. J. Clean. Prod. 2019, 237, 117728. [Google Scholar] [CrossRef]
- Yeo, J.; Wang, Y.; An, A.K.; Zhang, L. Estimation of energy efficiency for educational buildings in Hong Kong. J. Clean. Prod. 2019, 235, 453–460. [Google Scholar] [CrossRef]
- Abdul Mujeebu, M.; Bano, F. Energy-saving potential and cost-effectiveness of active energy-efficiency measures for residential building in warm-humid climate. Energy Sustain. Dev. 2022, 67, 163–176. [Google Scholar] [CrossRef]
- Adly, B.; El-Khouly, T. Combining retrofitting techniques, renewable energy resources and regulations for residential buildings to achieve energy efficiency in gated communities. Ain Shams Eng. J. 2022, 13, 101772. [Google Scholar] [CrossRef]
- Government of Kazakhstan. Decree of the President of the Republic of Kazakhstan. Available online: https://greenkaz.org/images/for_news/pdf/npa/koncepciya-po-perehodu.pdf (accessed on 20 May 2022).
- The Law of the Republic of Kazakhstan No. 541-IV on Energy Saving and Energy Efficiency. Available online: https://adilet.zan.kz/eng/docs/Z1200000541 (accessed on 20 May 2022).
- Government of Kazakhstan. The Law of the Republic of Kazakhstan No. 165-IV On Support of the Use of Renewable Energy Sources. Available online: https://adilet.zan.kz/eng/docs/Z090000165_ (accessed on 20 May 2022).
- Government of Kazakhstan. Environmental Code of the Republic of Kazakhstan No. 212. Available online: https://adilet.zan.kz/eng/docs/K070000212_ (accessed on 22 May 2022).
- Kazakh-German University. Available online: https://dku.kz/en/content/view/?slug=history (accessed on 22 May 2022).
- Kazakh-German University; German Federal Foundation for the Environment. Abschlussbericht über ein Praxisorientiertes Forschungsprojekt “Energetische Sanierung in Kasachstan am Beispiel Typischer Wohn- und Nichtwohngebäuden”, Gefördert von Deutschen Bundesstiftung Umwelt, Aktenzeichen 26646, Almaty. 2010. Available online: https://silo.tips/queue/energetische-gebudesanierung-in-kasachstan-am-beispiel-des-gebudes-der-deutsch-k?&queue_id=-1&v=1659964567&u=ODUuMjEyLjU3LjE3OQ== (accessed on 12 July 2022).
- Dyussembekova, N.; Rusack, M.; Orozaliev, J.; Vajen, K.; Akparaliev, R.; Mederov, T.; Obozov, A.; Kojonov, R. Energieeffizienz an Zentralasiatischen Hochschulen (EnEffUni), Kassel. 2016. Available online: https://www.uni-kassel.de/maschinenbau/institute/thermische-energietechnik/fachgebiete/solar-und-anlagentechnik/forschung/thermische-komponenten-und-systeme/eneffuni-energieeffizienz-in-zentralasiatischen-hochschulen (accessed on 12 July 2022).
- SN RK 2.04-21-2004. Energy Consumption and Thermal Performance of Buildings. Available online: https://online.zakon.kz/Document/?doc_id=30049118 (accessed on 20 May 2022).
- SN RK 2.04-04-2011. Thermal Protection of Buildings. Available online: https://online.zakon.kz/Document/?doc_id=31230347 (accessed on 20 May 2022).
- EN ISO 13790:2008. Energy Performance of Buildings—Calculation of Energy Use for Space Heating and Cooling. Available online: https://www.iso.org/standard/41974.html (accessed on 12 July 2022).
- EN ISO 6946:2017. Building Components and Building Elements—Thermal Resistance and Thermal Transmittance—Calculation Methods. Available online: https://www.iso.org/obp/ui/#iso:std:iso:6946:ed-3:v2:en (accessed on 12 July 2022).
- National Bank of Kazakhstan. Available online: https://nationalbank.kz/en?switch=english (accessed on 25 May 2022).
- Meteonorm. Available online: https://meteonorm.com/ (accessed on 22 May 2022).
- Duffie, J.A.; Beckman, W.A. Solar Engineering of Thermal Processes, 4th ed.; Wiley: New York, NY, USA, 2013; ISBN 978-0-470-87366-3. [Google Scholar]
- ANSI/ASHRAE Standard. Methods of Testing to Determine Thermal Performance of Solar Collectors; ASHRAE: Atlanta, GA, USA, 2003; ISSN 1041-2336. [Google Scholar]
Publisher’s Note: MDPI stays neutral with regard to jurisdictional claims in published maps and institutional affiliations. |
© 2022 by the authors. Licensee MDPI, Basel, Switzerland. This article is an open access article distributed under the terms and conditions of the Creative Commons Attribution (CC BY) license (https://creativecommons.org/licenses/by/4.0/).