Abstract
Non-aqueous reactive polymer grouting technology has been widely used in the repair engineering of dikes and dams with shallow diseases. By using the finite difference time-domain method and perfectly matched layer boundary conditions, the calculation model of dikes and dams with shallow diseases such as water-filled cave, air-filled cave and incompact area is established. The propagation process of electromagnetic waves of ground-penetrating radar in dikes and dams with shallow diseases using polymer grouting repair is simulated, and the forward simulation profiles and single-channel waveforms are obtained. The propagation characteristics such as waveform amplitude, waveform shape, transmission time, and reflection time are compared and analyzed. The results show that the forward simulation profiles of dikes and dams with water-filled caves before and after polymer grouting repair present two clusters of hyperbolas, but three clusters of hyperbolas with different amplitudes were observed at 50% repair. The amplitude of the hyperbola and the single-channel reflected waves before repair and 50% repair of the cave and incompact area are greater than those of 100% repair. The propagation characteristics of ground-penetrating radar can effectively explain the degree of polymer grouting repair for dikes and dams with shallow diseases, and provide a theoretical basis for using the ground-penetrating radar to evaluate the effect of polymer grouting technology to repair dikes and dams with shallow diseases.
1. Introduction
There are nearly 100,000 reservoirs and more than 420,000 km of river and lake dikes in China. The majority of these water-saving infrastructures are of great significance to the country’s economic development, environmental improvement, and sustainable development. Most of those dikes and dams were constructed between the 1950s and the 1970s. Some of them had congenital defects as a result of the technical level and economic conditions at that time. In addition to the effects of natural disasters such as over-level floods and earthquakes [1], shallow hidden diseases such as water-filled caves, air-filled caves and incompact areas gradually appeared in the dikes and dams. The safety situation of the dikes and dams was severe.
As a new type of trenchless repair technology, polymer grouting technology has many advantages, such as small disturbance to dikes and dams, anti-seismic and crack resistance, strong ability to coordinate deformation with soil, low cost, and no pollution to water quality, and has been used to repair dikes and dams with shallow hidden diseases [2]. Non-aqueous reactive polyurethane grouting material that is used in polymer grouting technology mainly consists of component A (polyisocyanates) and component B (polyhydric alcohol). The chemical reaction rate and expansion rate of polyurethane polymers can be adjusted by adding different types of polyhydric alcohols, catalysts, blowing agents, etc. without the involvement of water [3]. Polyurethane grouting material which is used in polymer grouting technology has obvious advantages such as good impermeability, durability, and no environmental pollution [4]. Chen et al. [5] carried out an experimental study on the durability of Porous Polyurethane Mixture (PPM) in porous pavement. The results show that the use of PPM in porous pavement has long-term durability in terms of anti-clogging. Li et al. [6] carried out uniaxial compression tests on polyurethane grouting materials with different densities and geometrical sizes. The results show that the compressive strength of polyurethane grouting material increases with the increase of density and presents a power function distribution. Shi et al. [7] carried out uniaxial compression tests at different temperatures. The results show that the compressive strength of polymer grouting material increases with increasing temperature at the same density. Fang et al. [8] and Wang et al. [9], respectively, studied the bonding and shearing properties of the interface between polymer and concrete. The results show that the polymer can penetrate into the pores of the grouting surface of concrete, and the permeability and polymer strength increase with the increase of grouting volume, which results in a higher bonding strength. Through experiments, Li et al. [10] found that the shear strength of the interface of pure bentonite was lower than that of polymer and bentonite. Wang et al. [11] simulated the injection process of a polymer thin wall by a level set method and compared it with a field test. The results show that polymer grouting technology can rapidly form a thin wall. Li et al. [12,13] carried out relevant research on the seismic dynamic response law and seismic test of the polymer anti-seepage walls of dikes and dams. The results show that the seismic performance of the polymer anti-seepage wall is better than that of the concrete anti-seepage wall. Fang et al. [14] studied the influence of traffic load on the deformation of the polymer anti-seepage wall and soil. Zhang et al. [15] simulated the polymer anti-seepage wall under different damage forms, providing a theoretical basis for the nondestructive testing of polymer anti-seepage walls. Guo et al. [16] applied the polymer grouting technology to the seepage prevention of tailings reservoirs. The results show that the polymer grouting technology has little disturbance to the dam, good seepage resistance, and perfect durability. These studies mainly focus on the material characteristics of polymer and the interaction mechanism between polymer anti-seepage wall and soil, but there is no in-depth study on the evaluation method of polymer grouting effect for dikes and dams with different shallow diseases.
Ground-penetrating radar (GPR) is a non-destructive detection technology for detecting and identifying underground targets. Compared with other conventional underground detection methods, GPR has the advantages of a continuous detection process, wide detection range, low detection cost, fast detection speed, high resolution, flexible operation, and no need for excavation. The detection results can reflect the internal structure distribution of the target in real time [17]. With the continuous research and development of ground-penetrating radar technology, the detection depth and accuracy have been greatly improved [18]. It is now widely used in the fields of archaeology [19], road subgrade quality detection [20], tunnel cavity detection [21,22], urban engineering quality identification [23], resource development [24], military [25], dikes and dams detection and repair [26,27]. Alsharahi, G, et al. [28] have simulated the voids with different shapes and dielectric properties in urban areas. The results show that voids can be identified accurately according to the amplitude changes of reflection waves on the surface of the voids. Xie et al. [29] used ground-penetrating radar to detect shield tunnels and established high-quality visualization of grouting by using bi-frequency back projection algorithm to evaluate the quality of backfilling grouting in shield tunnels. Zhang et al. [30] used ground-penetrating radar to detect the grouting thickness of shield tunnel construction in soft soil area. The results show that ground-penetrating radar detection can be used to reduce the risk of long-term ground settlement. Alsharahi, Gamil, and others [31,32] used ground-penetrating radar to detect voids in soil and other circular objects with physical properties, electrical conductivity, and dielectric properties, and obtained their radar profiles and signal evolution diagrams. Li et al. [26] described the data processing and interpretation methods, the detection methods of GPR, and their application in dam detection, and studied the dam body leakage problem. Chen et al. [27] established a GPR two-dimensional simulation for common defects such as concealed cracks and holes in a concrete dam, and compared the image features of various defect waveforms and reflection waves.
Therefore, by using the finite-difference time-domain (FDTD) method and perfectly matched layer (PML) boundary conditions [33], the calculation model of dikes and dams with shallow diseases such as water-filled caves, air-filled caves, and incompact area is established. The propagation process of the electromagnetic waves of ground-penetrating radar in dikes and dams with shallow diseases using polymer grouting repair is simulated, and the forward profiles and single-channel waveforms are obtained. The propagation characteristics such as waveform amplitude, waveform shape, transmission time, and reflection time are compared and analyzed. The results show that the propagation characteristics of ground-penetrating radar can effectively explain the degree of polymer grouting repair for dikes and dams with shallow diseases.
The rest of this paper is structured as follows: Section 2 outlines the basic principles of ground-penetrating radar and the FDTD method. Section 3 describes the model parameters of dikes and dams. Section 4 carries out forward simulation for dikes and dams with shallow diseases and compares and analyzes the propagation characteristics of ground-penetrating radar. Finally, the discussion and conclusion are given in Section 5.
2. Basic Principles
2.1. Ground-Penetrating Radar
Ground-penetrating radar transmits high frequency and short-pulse electromagnetic waves into dikes and dams. When electromagnetic waves encounter different dielectric mediums (such as voids, cracks, incompact areas, material interface, etc.) during transmission, the route, reflection waveform, and magnitude of the electromagnetic wave will change. The reflection signal of the electromagnetic wave is then received. Ground-penetrating radar detection analyzes the amplitude characteristics and time frequency of reflection electromagnetic waves to assess the location and internal structure of shallow hidden diseases.
According to the theory of electromagnetic waves, the propagation law of high frequency electromagnetic waves in a homogeneous and isotropic medium can be written as the Maxwell equation group. The Maxwell equations [34] in the conventional form are:
where E means the electric field strength, B means the magnetic inductive intensity, H means the magnetic field strength, D means the electric displacement, ρ means the charge density, and J means the electric current density.
2.2. Finite Difference Time-Domain Method
The finite difference time-domain method [35] is a forward numerical simulation method that is based on the difference principle, which employs the method of alternate sampling of E and H components in an electromagnetic field in space and time. It uses the second-order central difference equation to approximately replace the differential equation in Maxwell’s rotation equation, so as to directly correlate the electric field (or magnetic field) at a point in space with the magnetic field (or electric field) at the surrounding grid point. The distribution of space electromagnetic field is solved step by step in the time domain.
In order to simulate the propagation of ground-penetrating radar electromagnetic waves in dikes and dams, a Yee [36] grid is used to establish the model, and the FDTD method selects the TM mode of radar electromagnetic wave to propagate on the X and Y plane. The continuous variable is discretized by using the central difference quotient instead of the differential quotient. The finite difference form of the Maxwell equation in the two-dimensional case is:
where is the dielectric constant, is the conductivity, is the magnetic permeability, is the equivalent reluctance, t is time, and and are the electric and magnetic fields in the Yee cell group.
The perfectly matched layer (PML) [37] absorbing boundary is a special non-physical absorbing medium layer that is set at the boundary so that the incident wave does not reflect and enters the medium directly through the interface. In the case of two-dimensional TM wave, the difference format of FDTD with PML is as follows:
where represent conductivity, respectively; represent magnetic loss, respectively; and are two sub-components of .
The FDTD method replaces the solution of the original Maxwell rotation equation with the solution of the difference equation group. The sampling of the magnetic field and electric field is discrete in space and time, and the space step and time step are not independent, so there may be numerical instability. Therefore, the FDTD method needs to satisfy the stability condition (CFL) of the solution.
where, c is the speed of light (0.3 m/ns), and are space steps in the X direction and Y direction, respectively, and is the time step.
In order to reduce the frequency scattering effects that are caused by the discretization of the model due to the mesh step size, the stability conditions of the calculation time need to be satisfied:
where, is the grid step and is the minimum wavelength of the medium.
3. Calculation Model
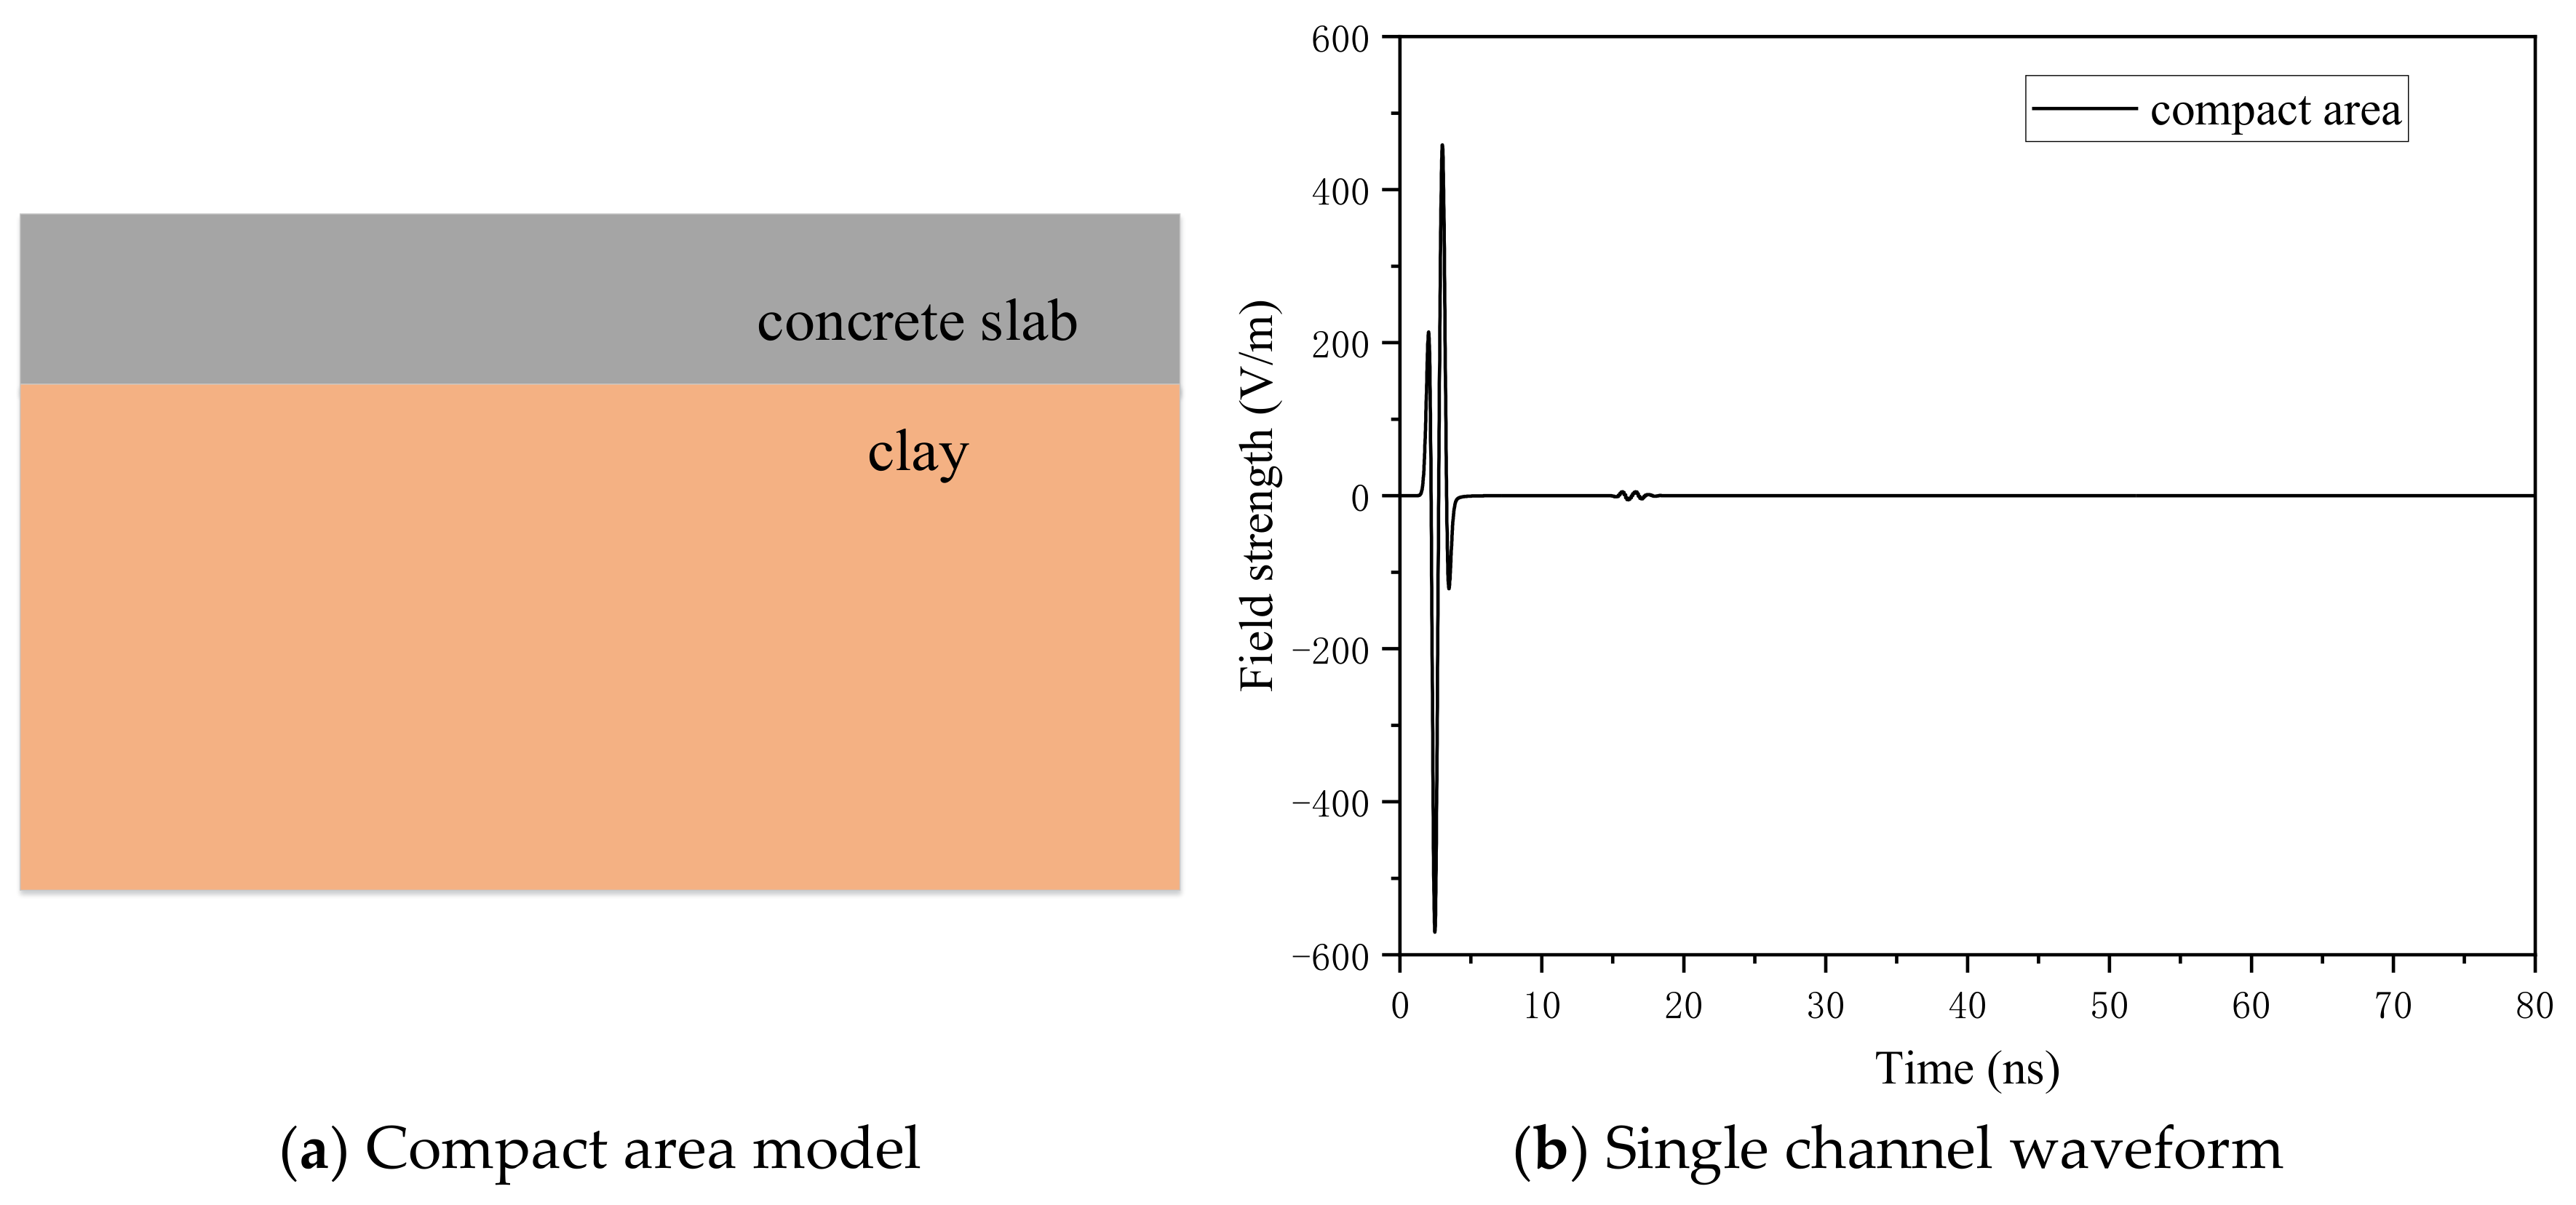
3.1. Application Conditions
In the non-magnetic medium inside the dikes and dams, the propagation velocity of the high frequency short pulse electromagnetic wave that is emitted by the ground-penetrating radar in the medium depends on the dielectric constant of the medium. The relationship between the propagation velocity of the electromagnetic wave in the medium and the dielectric constant can be expressed as follows:
where, c means the propagation velocity of electromagnetic wave in vacuum, c = 0.30 m/ns, and means the relative dielectric constant of the medium.
During the propagation of the electromagnetic waves, when encountering the interface of different mediums, a reflection wave and transmission wave will be generated. The magnitude of the reflection wave energy depends on the reflection coefficient. The magnitude of the reflection coefficient is related to the relative dielectric constant of the mediums on both sides of the interface. Its mathematical expression is as follows:
where, and are the relative dielectric constants of mediums 1 and 2, respectively.
3.2. The Model Parameters of Dikes and Dams
Survey lines are arranged on the surface of the dikes and dams to measure the dikes and dams with different shallow hidden diseases. Therefore, a two-dimensional model is set on the X and Y planes and a grid length is set in the Z direction. The model size is 5 m × 3 m, in which the length of the dikes and dams survey line (X-axis) is 5 m and the detection depth (Y-axis) into the dikes and dams is 3 m. According to the actual structure of the dikes and dams, the dikes and dams body model is divided into two layers: the first layer is a concrete panel, which is composed of concrete material with a thickness of 80 cm and the relative dielectric constant and the conductivity of concrete are 8 and 0.005 S/m, respectively. The second layer is a clay layer, which is composed of a clay material with a thickness of 2.15 m. The relative dielectric constant and the conductivity of clay are 10 and 0.001 S/m, respectively. The relative dielectric constant and the conductivity of water are 81 and 0.001 S/m, respectively. The relative dielectric constant and the conductivity of air are 1 and 0 S/m, respectively. The relative dielectric constant and the conductivity of the polymer is 3.4 and 0.001 S/m, respectively.
Different center frequencies of ground-penetrating radar are suitable for different detection depths. When the center frequency is 900 MHz, the detection depth is 1–2 m, which is more suitable for the actual conditions of the diseases in this paper. According to the previous research, the reflection hyperbola with a radius of 0.05 m cave can only appear in the upper layer without stratification [38]. Therefore, 0.05 m is taken as the minimum detection size of ground-penetrating radar in this paper. The polymer and clay are mixed in practical engineering. The equivalent dielectric constant of the mixtures is generally considered as a function of the dielectric constant of each component and its volume content. Empirical models such as the Rayleigh model and CRIM model are often used to estimate the equivalent dielectric constants of mixtures [39]. Due to the complex way of adding the equivalent dielectric constant of mixed medium, all the dielectric layers are assumed to be a uniform medium in this paper. When the medium in the cave is air or water, the polymer will not mix with the clay and the dielectric constant of the polymer is used in those cave areas after repair.
4. Forward Simulation
4.1. Water-Filled Cave
According to the parameters of the dikes and dams structure model, the calculation model of dikes and dams without shallow diseases is established as the control group. The model and single channel waveforms are shown in Figure 1.
Figure 1.
The calculation model of dikes and dams without shallow diseases.
As shown in Figure 2, three kinds of water-filled cave models with different degrees of polymer grouting repair (0%, 50%, and 100%) are established, respectively. The 0% repair is the water-filled cave model before repair, 50% repair is the half-repair water-filled cave model, and 100% repair is the full-repair water-filled cave model. The distance from the center point of the water-filled cave area to the dam surface is 1.45 m. The center coordinate and the radius of the water-filled cave area are 2.5 m, 1.5 m, and 0.3 m, respectively. The Ricker wave with dominant frequencies of 900 MHz are used, the time window is 80 ns, and the step size of spatial grid is 0.0025 m × 0.0025 m. The other parameters are listed in Table 1. The forward simulation results are shown in Figure 3 and Figure 4.
Figure 2.
The different degree of polymer grouting repair for a water-filled cave model.
Table 1.
FDTD forward simulation parameters.
Figure 3.
Forward simulation profile of the water-filled cave at the different degrees of polymer grouting repair.
Figure 4.
Single channel waveforms for the water-filled cave repair.
As shown in Figure 3a,c, the forward simulation profile presents two clusters of the hyperbola. Before repair (0% repair), the top amplitude of the lower hyperbola is greater than that of the upper hyperbola, while after complete repair, the top amplitude of the lower hyperbola is less than that of the upper hyperbola. The interval between two clusters of hyperbolas before repair was significantly longer than that of 100% repair. As shown in Figure 3b, the forward simulation profile of 50% repair presents three clusters of the hyperbola, the amplitude of the middle hyperbola is bigger than that of the lower hyperbola, and the amplitude of lower hyperbola is bigger than that of the upper hyperbola.
As shown in Figure 4, the A-scan images of the compact area model do not generate reflected waves after passing through the interface between the concrete and clay medium. The A-scan images of the water-filled cave with 0% repair and 100% repair show two reflected waves, but the time and amplitude are different. For 0% repair, the reflection waves of the water-filled cave appear near 23 ns and 61 ns and the amplitude of reflection wave is bigger than that of 100% repair. This phenomenon is consistent with the occurrence time and the top amplitude of the reflection hyperbola in Figure 3a,c. For 100% repair, the reflection waves of the water-filled cave appear near 23 ns and 31 ns, and the amplitude of the reflection waves are less than that of 0% repair and 50% repair. The A-scan images of the water-filled cave with 50% repair shows three reflection waves, which appearing near 23 ns, 42 ns, and 61 ns, respectively. The amplitude of the middle reflection wave is bigger than that of the first and third reflection waves, and the first and third reflection waves show reverse phenomenon. The time and amplitude of the reflection wave also corresponds to the top amplitude of the three hyperbolas that are generated in Figure 3b.
The relative dielectric constant of the medium has a big impact on the reverse phenomena of the reflected wave in the A-scan. Clay has a relative dielectric constant of 10, water has a relative dielectric constant of 81, and polymer has a relative dielectric constant of 3.4. The reflection coefficient is positive when an electromagnetic wave is transferred from a medium having a big dielectric constant to a medium with a little dielectric constant. The reflection coefficient is negative when an electromagnetic wave is transferred from a medium with a little dielectric constant to a medium with a big dielectric constant.
Figure 3 and Figure 4 show that the forward simulation profile and the A-scan images of the 50% repair are reflected three times at the water-filled cave, which is significantly different from that before and after repair. The two amplitudes of the water-filled cave model before repair are larger than those of 100% repair. Therefore, the degree of polymer diffusion in the water-filled cave can be evaluated by the forward simulation profiles and the single channel waveforms.
4.2. Air-Filled Cave
As shown in Figure 5, three kinds of air-filled cave models with different degrees of polymer grouting repair (0%, 50%, and 100%) are established, respectively. The 0% repair is the air-filled cave model before repair, 50% repair is the half-repair air-filled cave model, and 100% repair is the full-repair air-filled cave model. The distance from the center point of the cave area to the dam surface is 1.45 m. The center coordinate and the radius of the air-filled cave area are 2.5 m, 1.5 m, and 0.3 m, respectively. The Ricker wave with dominant frequencies of 900 MHz is used, the time window is 50 ns, and the step size of the spatial grid is 0.005 m × 0.005 m. Other parameters are listed in Table 1. The forward simulation results are shown in Figure 6 and Figure 7.
Figure 5.
The different degree of polymer grouting repair for the air-filled cave model.
Figure 6.
Forward simulation profile of the air-filled cave at the different degrees of polymer grouting repair.
Figure 7.
Single channel waveforms for the air-filled cave repair.
As shown in Figure 6, the forward simulation profiles before and after repair show hyperbolic characteristics. The curve opening of the hyperbola is downward, the top reflection amplitude of the hyperbola is the strongest, and the amplitude at both ends is weak. The amplitude of the hyperbola gradually decreases with the increase of depth. As shown in Figure 6a,c, the forward simulation profiles present two obvious clusters of the hyperbola, and the top amplitude of the hyperbola before repair is bigger than that of 100% repair. As shown in Figure 6b, the forward simulation profile of 50% repair is only one cluster of the parabola, and the top amplitude of is not different from that of before repair. Figure 6a shows the top of the first parabola is about 23 ns, the top of the second parabola is about 27 ns, and the time interval between the two parabolas is about 4 ns. The propagation velocity of the electromagnetic waves in the air is about 0.3 m/ns, and the calculated diameter of the air-filled cave is 0.3 × 4/2 = 0.6 m, the same as the air-filled cave diameter in the model. In Figure 6c, the top of the first parabola is about 23 ns, the top of the second parabola is about 31 ns, and the time interval between the two parabolas is about 8 ns. The propagation velocity of electromagnetic waves in polymer is about 0.163 m/ns, and the diameter of the air-filled cave is 0.163 × 8/2 = 0.652 m, which is close to the air-filled cave diameter of 0.6 m in the model parameters. The top position of the first parabola before and after repair is basically the same, which appears near 23 ns.
The amplitude of the B-scan before and after the cave is mainly affected by the relative dielectric constant of the medium. The relative dielectric constant of clay is 10, the relative dielectric constant of air is 1, and the relative dielectric constant of polymer is 3.4. The reflection coefficient is the ratio of the reflection wave intensity to the incident wave intensity. The reflection coefficient of the electromagnetic waves that are transmitted from clay to air is bigger than that of which is transmitted from clay to polymer. With the increase of the reflection coefficient, the amplitude of the reflection wave increases.
As shown in Figure 7, the A-scan images of the compact area model does not generate reflected waves after passing through the interface between the concrete and clay mediums. The reflection waves of the air-filled cave appear near 17 ns, 23–24 ns, and 27–28 ns in before repair, the reflection waves of the air-filled cave appear near 17 ns, 23–24 ns and 26 ns in 50% repair, and the reflection waves of the air-filled cave appear near 17 ns, 23–24 ns, and 31–32 ns in 100% repair. The reflection wave near 17 ns is due to the encounter of the interface between concrete and clay. The reflection wave near 23–24 ns is due to encountering the air-filled cave upper interface. For 100% repair, the reflection coefficient of the air-filled cave upper interface is least than that of 0% repair and 50%repair, so the amplitude of the reflection waves are least than that of 0% repair and 50% repair. For 0% repair and 100% repair, the reflection waves near 27–28 ns and 31–32 ns are the lower interface, respectively. For 50% repair, the reflection waves near 26 ns are the interface between air and polymer and are close to the upper interface of the air-filled cave, and the reflection phenomenon is not obvious.
Figure 6 and Figure 7 show that the top amplitude of the hyperbola and the amplitude of the reflection wave of before repair and 50% repair are greater than that of 100% repair, and the occurrence time of the reflection waves before and 50% repair is different. Therefore, the degree of polymer diffusion in the air-filled cave can be evaluated by the forward simulation profiles and the single channel waveforms.
4.3. Incompact Area
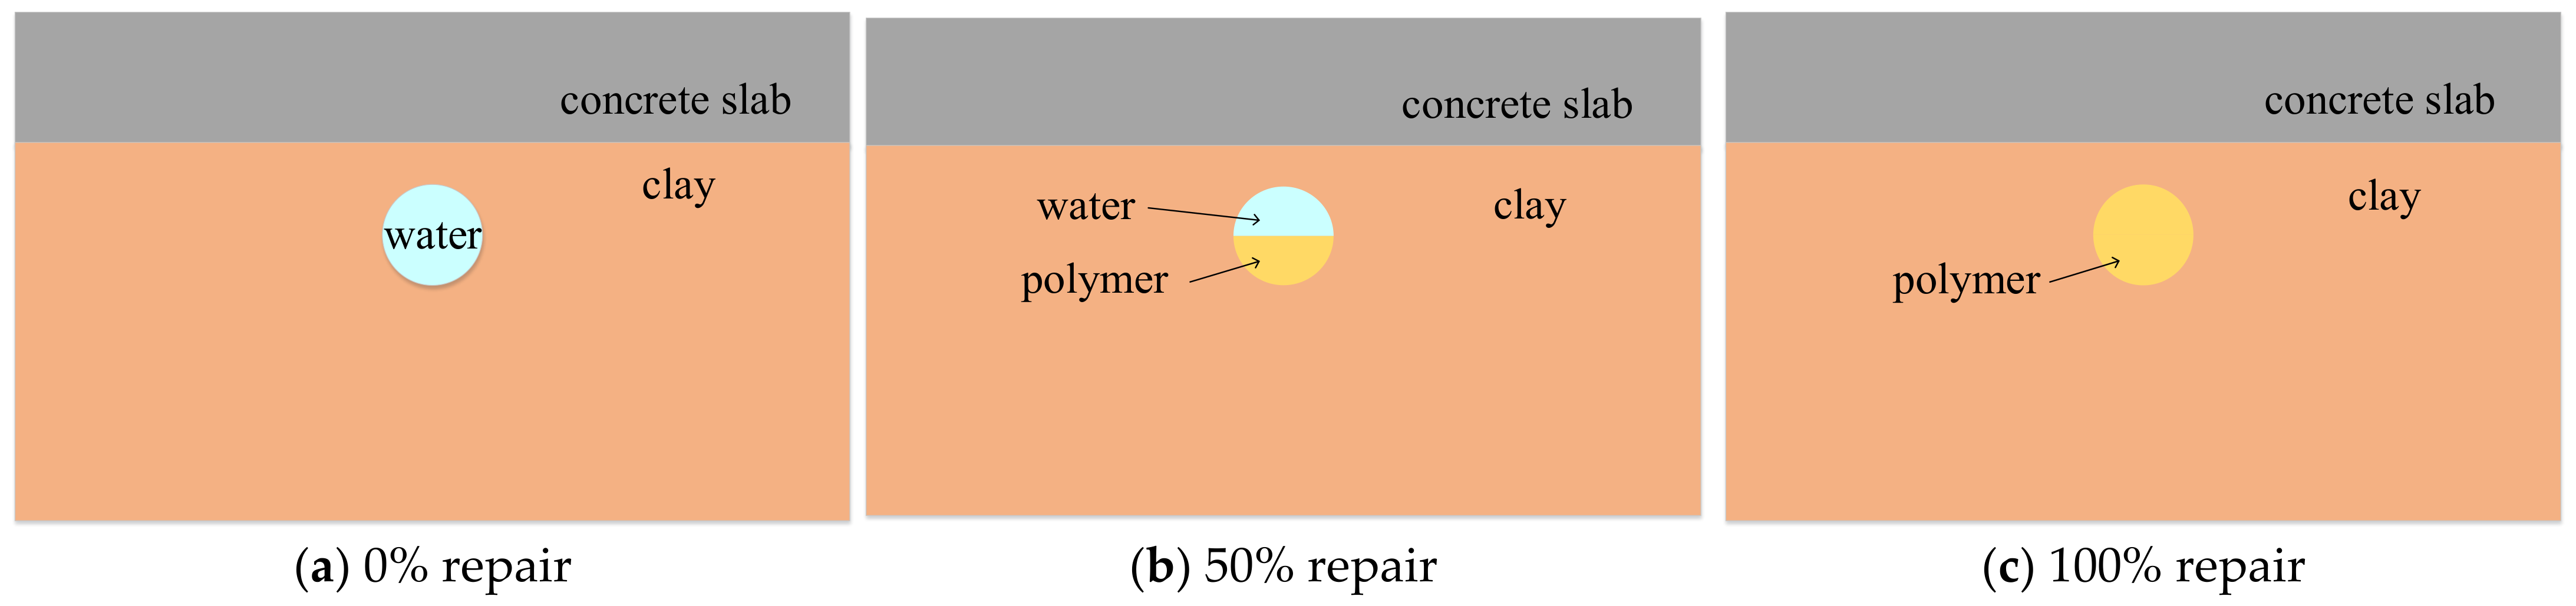
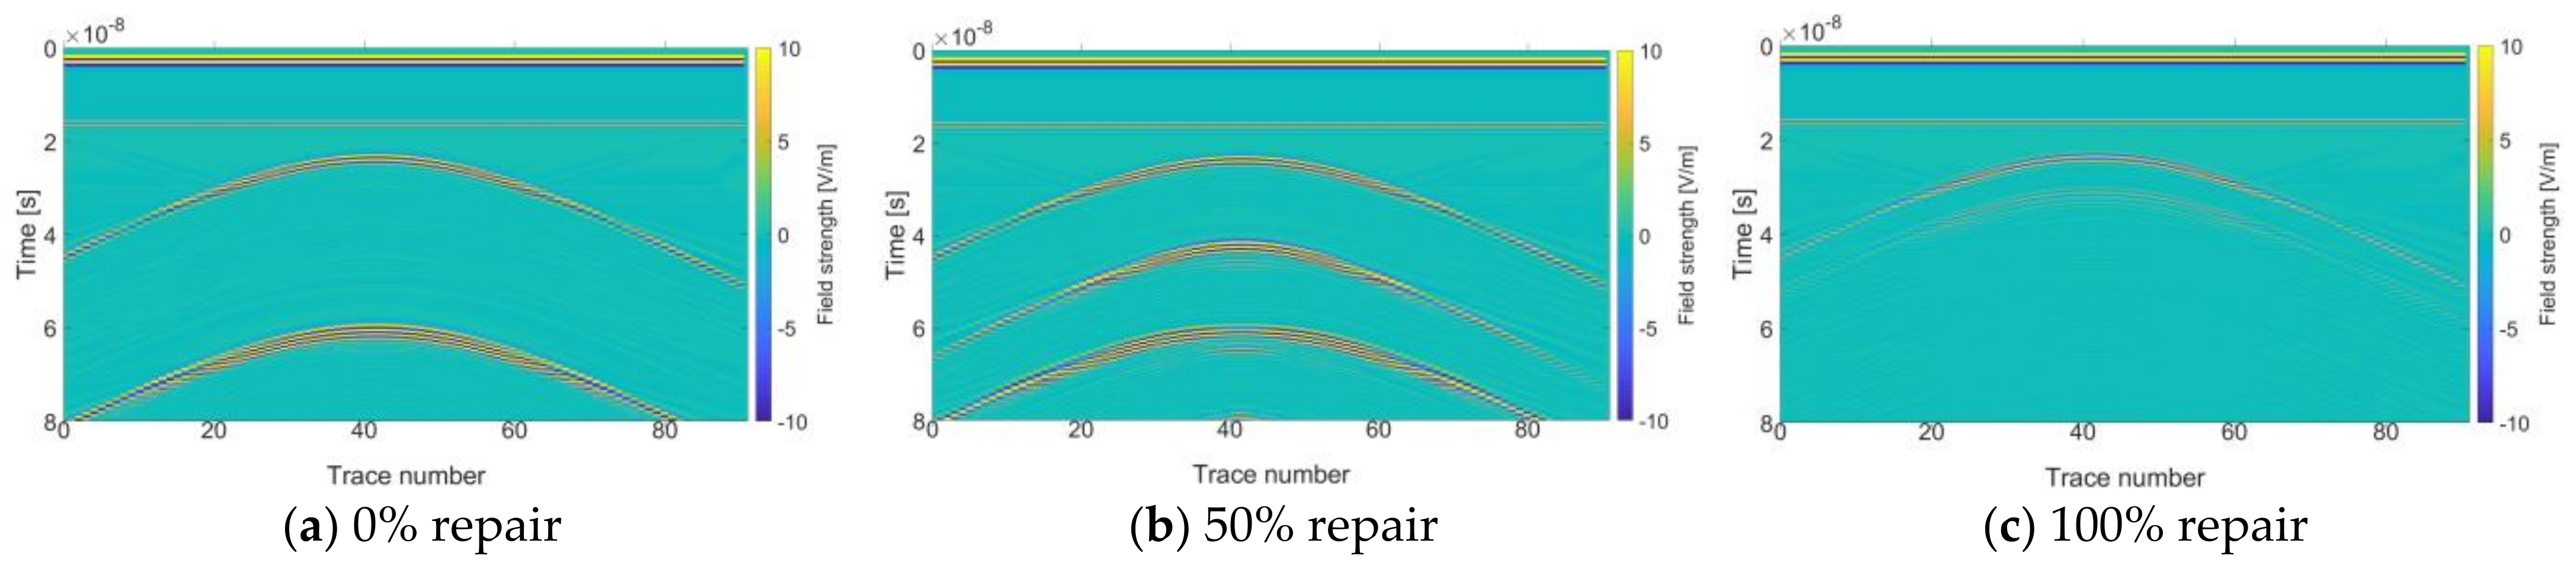
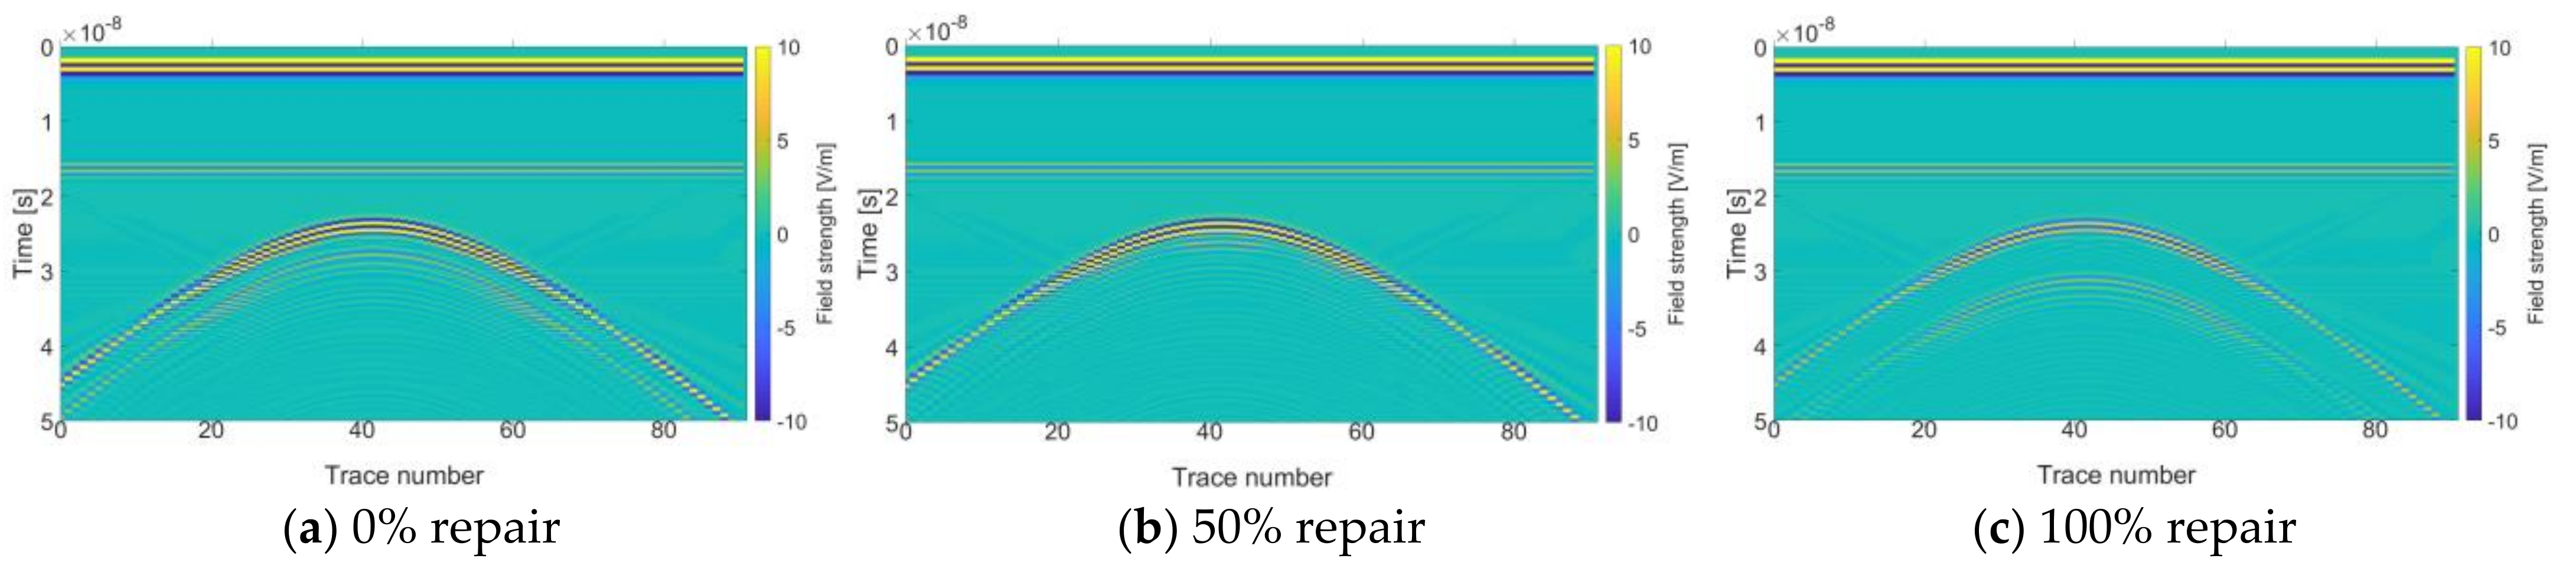
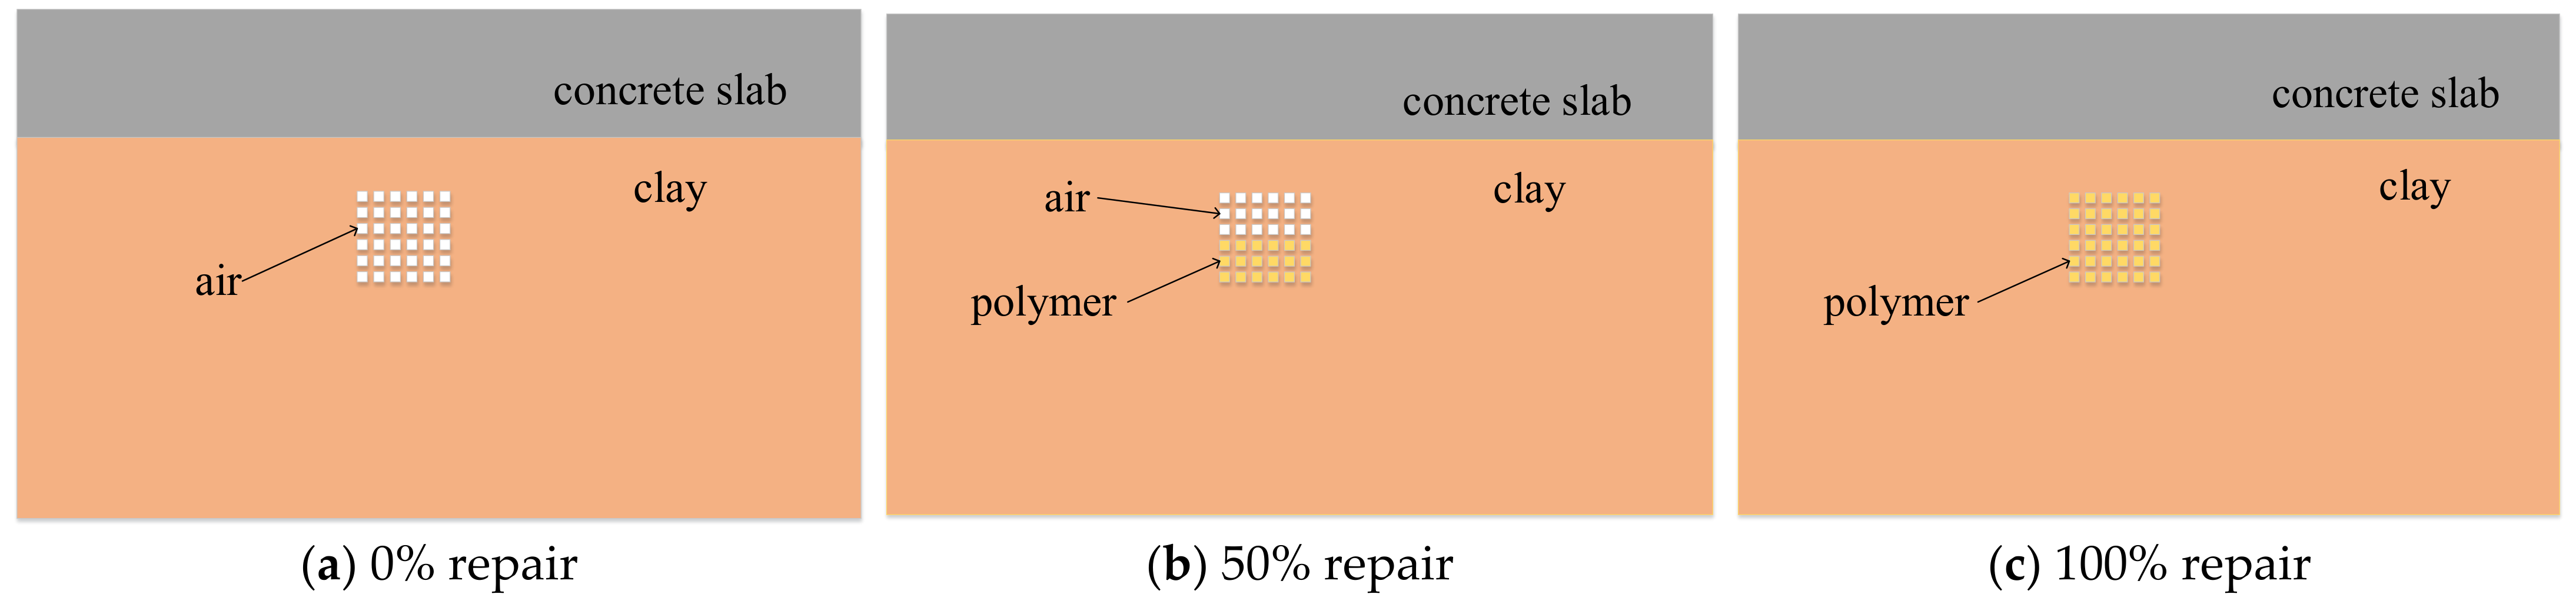
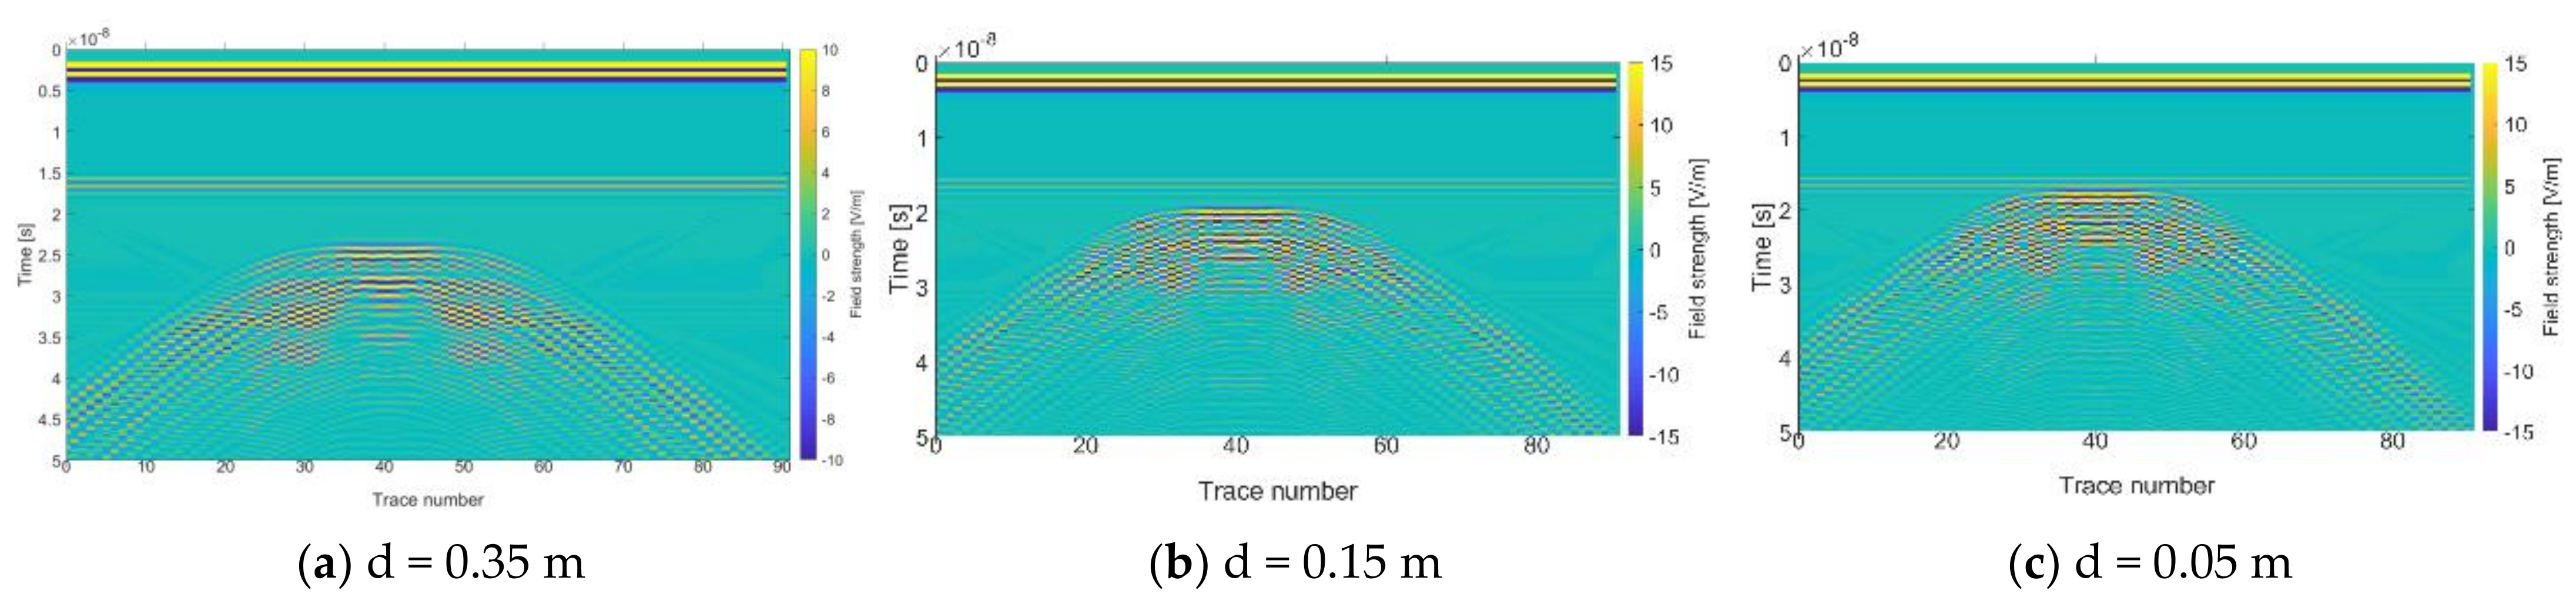
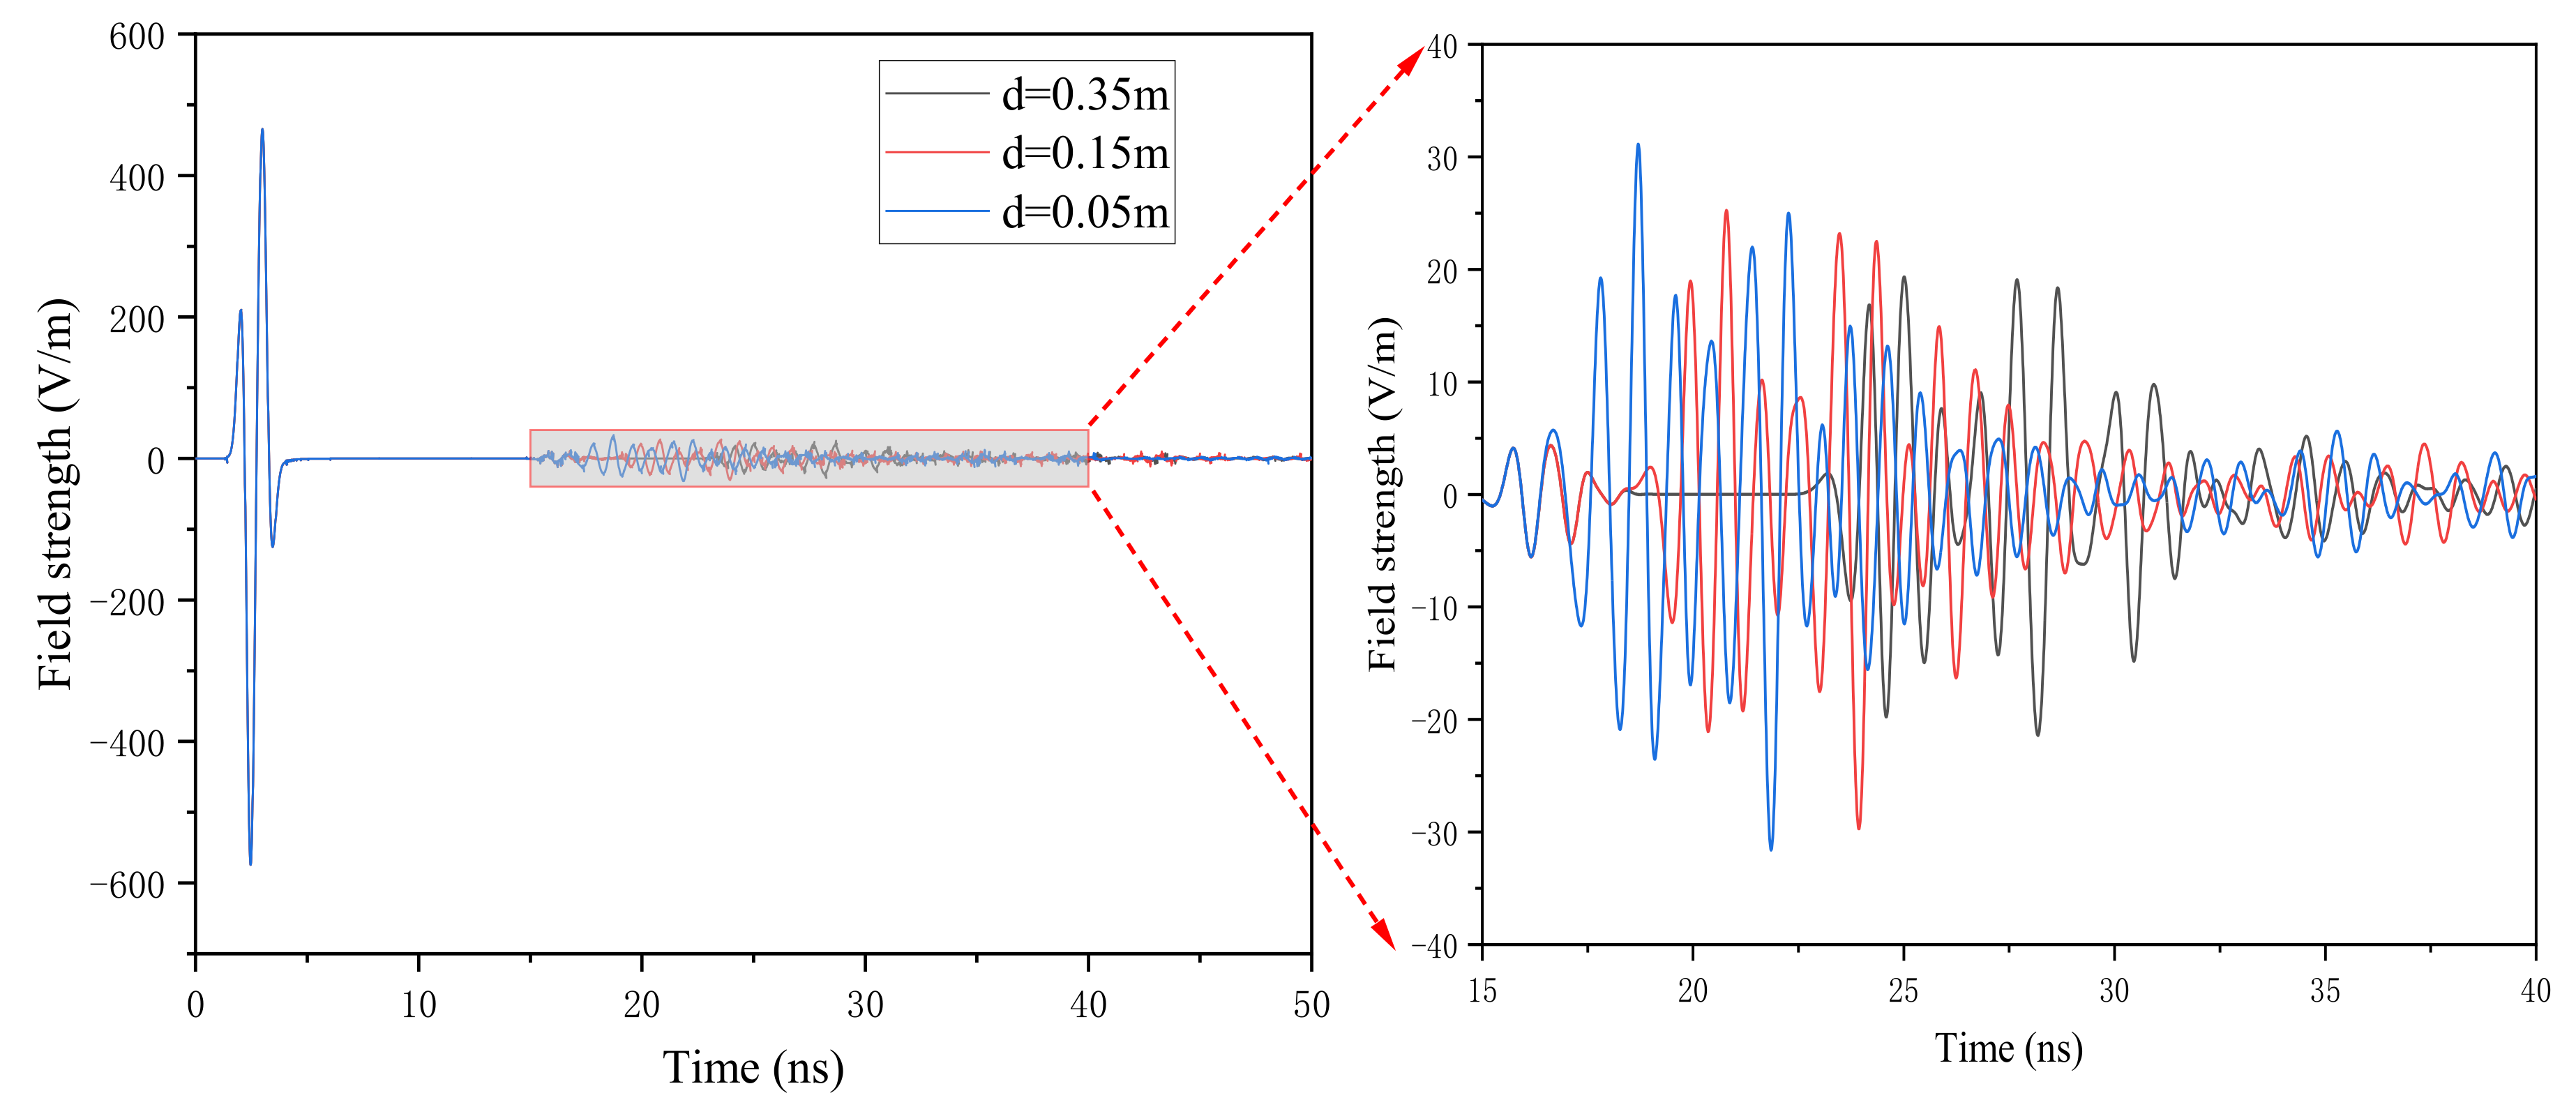
4.3.1. Different Degrees of Repair
As shown in Figure 8, three kinds of incompact area models with different degrees of polymer grouting repair (0%, 50%, and 100%) are established, respectively. The 0% repair is the incompact area model before repair, 50% repair is the half-repair incompact area model, and 100% repair is the full-repair incompact area model. The distance from the center point of the incompact area to the dam surface is 1.45 m. The square of 0.72 m × 0.72 m is used in the incompact area, and the squares of 0.06 m × 0.06 m with air are used in the middle array. The center coordinates of the incompact area are 2.44 m and 1.44 m. The Ricker wave with dominant frequencies of 900 MHz is used, the time window is 50 ns, and the step size of the spatial grid is 0.005 m × 0.005 m. Other parameters are listed in Table 1. The forward simulation results are shown in Figure 9 and Figure 10.
Figure 8.
The different degree of polymer grouting repair for the incompact area model.
Figure 9.
Forward simulation profile of the incompact area at the different degrees of polymer grouting repair.
Figure 10.
Single channel waveforms for the incompact area repair.
As shown in Figure 9, the forward simulation profiles present multiple clusters of trapezoidal curves, the curve opening of the trapezoidal curves are downward. The top reflection amplitude of the trapezoidal curves is clear and attenuates in layers. The amplitude of the trapezoidal curves gradually decreases with the increase of depth. For 0% repair, the top horizontal line of the trapezoidal curves becomes shorter. For 50% repair and 100% repair, the top horizontal line of the trapezoidal curves gets shorter with depth and becomes a hyperbola. The top amplitude of the trapezoidal curves before repair and 50% repair is significantly bigger than that of 100% repair.
As shown in Figure 10, the high-frequency electromagnetic waves reach the incompact area at about 24 ns and forms multiple reflection waves. For 0% repair and 50% repair, the reflection waveform of the incompact area basically overlaps before 30 ns, and the reflection amplitude of before repair is bigger than that of 50% repair after 34 ns. At 30–34 ns, because the propagation speed of electromagnetic waves in air is higher than that of polymer, the depth of the soil foundation that is reached at the same time is greater than 50% before repair, and the energy consumption of electromagnetic waves before repair is greater than 50% repair, so the reflection amplitude of 50% repair is greater than that before repair. After passing through the incompact area, the energy consumption of electromagnetic waves after repair is greater than that before repair. For 100% repair, the reflection amplitude of a single channel wave is significantly less than that of before repair and 50% repair, and the occurrence time of the reflection wave is later than that of before repair and 50% repair. Figure 9 and Figure 10 show that the amplitude of the reflection wave and the top amplitude of the curve before and 50% repair are greater than that after repair. Therefore, the degree of polymer diffusion in the incompact area can be evaluated by the forward simulation profiles and the single channel waveforms.
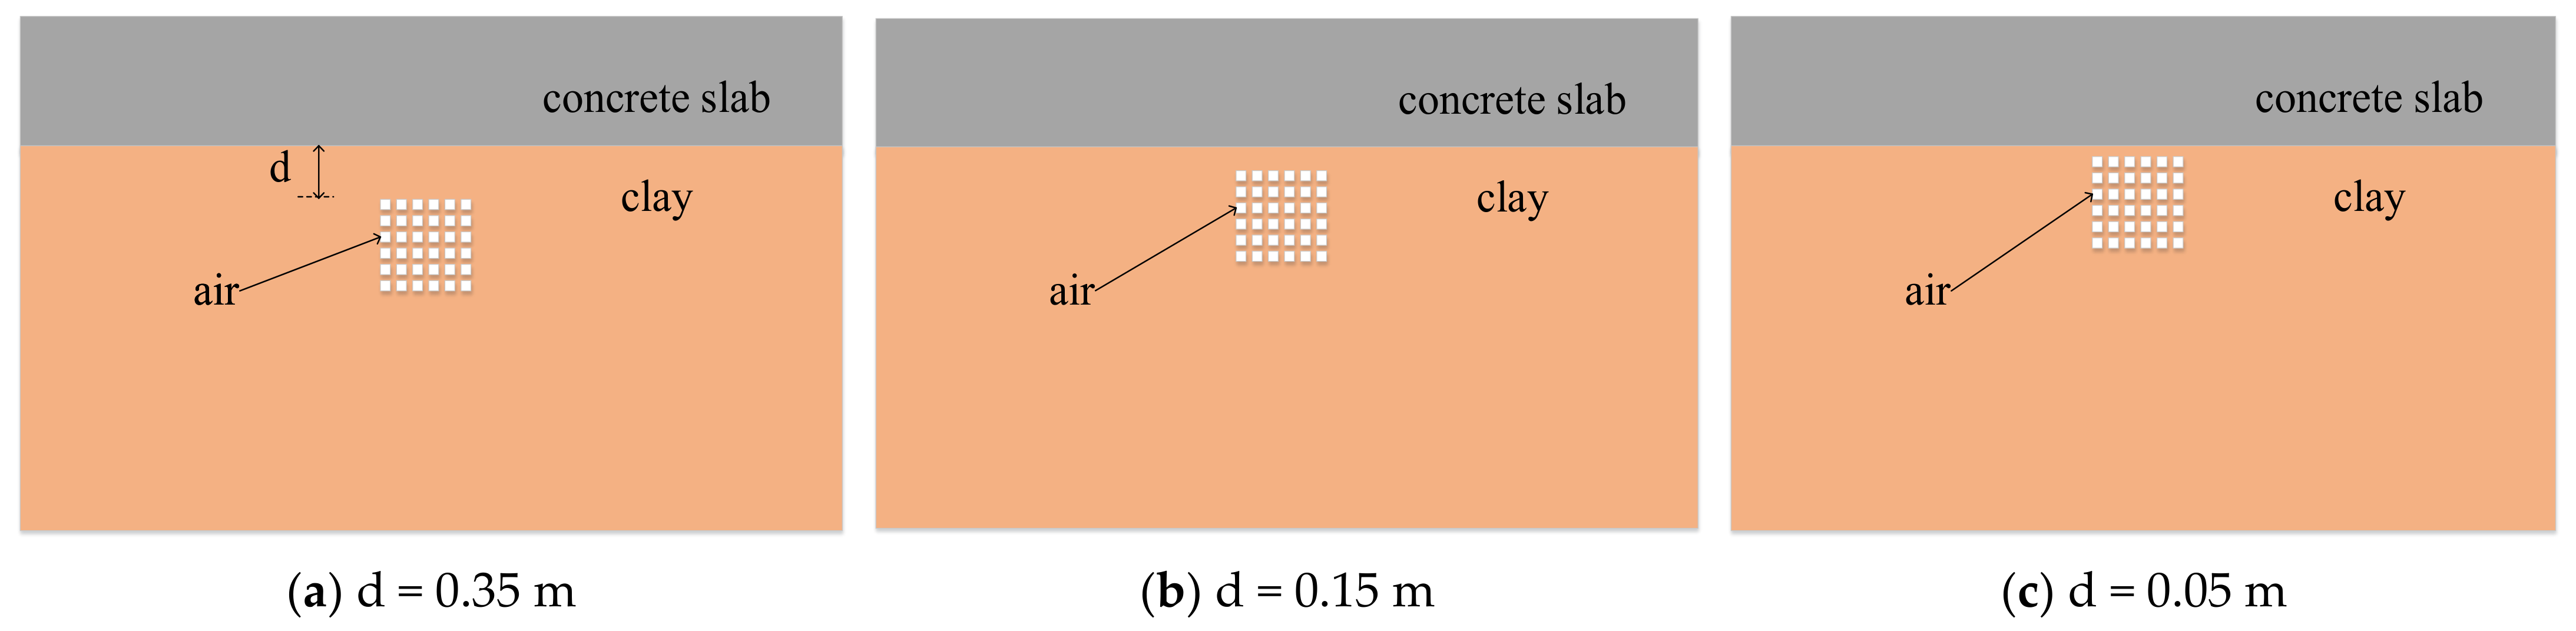
4.3.2. Different Distance between Center Point of the Incompact Area to the Dam Surface
As shown in Figure 11, three kinds of incompact area models with different distances between the center point of the incompact area to the dam surface are established according to the actual situation. The distance between the lower interface of the concrete and the upper interface of the incompact area is d. The model parameters are consistent with Figure 8. The forward simulation results are shown in Figure 12 and Figure 13.
Figure 11.
The different distance between the center point of the incompact area to the dam surface for the incompact area model.
Figure 12.
Forward simulation profile of the incompact area at the different distance between the center point of the incompact area to the dam surface.
Figure 13.
Single channel waveforms for incompact area distance.
Figure 12 and Figure 13 show that the distance between the center point of the incompact area to the dam surface gradually decreases, the top of the curve in the forward simulation profile moves upward, the amplitude of the curve becomes larger, and the time of generating single channel reflection wave is gradually advanced. The reflection wave that is generated in the incompact area is adjacent to the reflection wave on the surface of the concrete and clay medium when d = 0.05 m. Therefore, we should pay attention to distinguish the reflection waves when the incompact area is close to the interface of concrete and clay in the actual project.
5. Conclusions
Based on the FDTD method and PML absorption boundary conditions, the calculation model of dikes and dams with shallow diseases such as water-filled caves, air-filled caves, and incompact areas is established. The propagation process of GPR electromagnetic wave in dikes and dams with shallow diseases using polymer grouting repair is simulated. By comparing the single channel waveforms and forward simulation profiles of different shallow diseases, the following conclusions can be drawn:
- (1)
- GPR can accurately identify shallow diseases such as water-filled caves, air-filled caves, and incompact areas. According to the reflection wave shape, amplitude, transmission time interval in the forward simulation profiles, and the reflection amplitude of single channel waveforms, the spatial distribution characteristics such as the water level position, the type, and depth of shallow diseases can be obtained.
- (2)
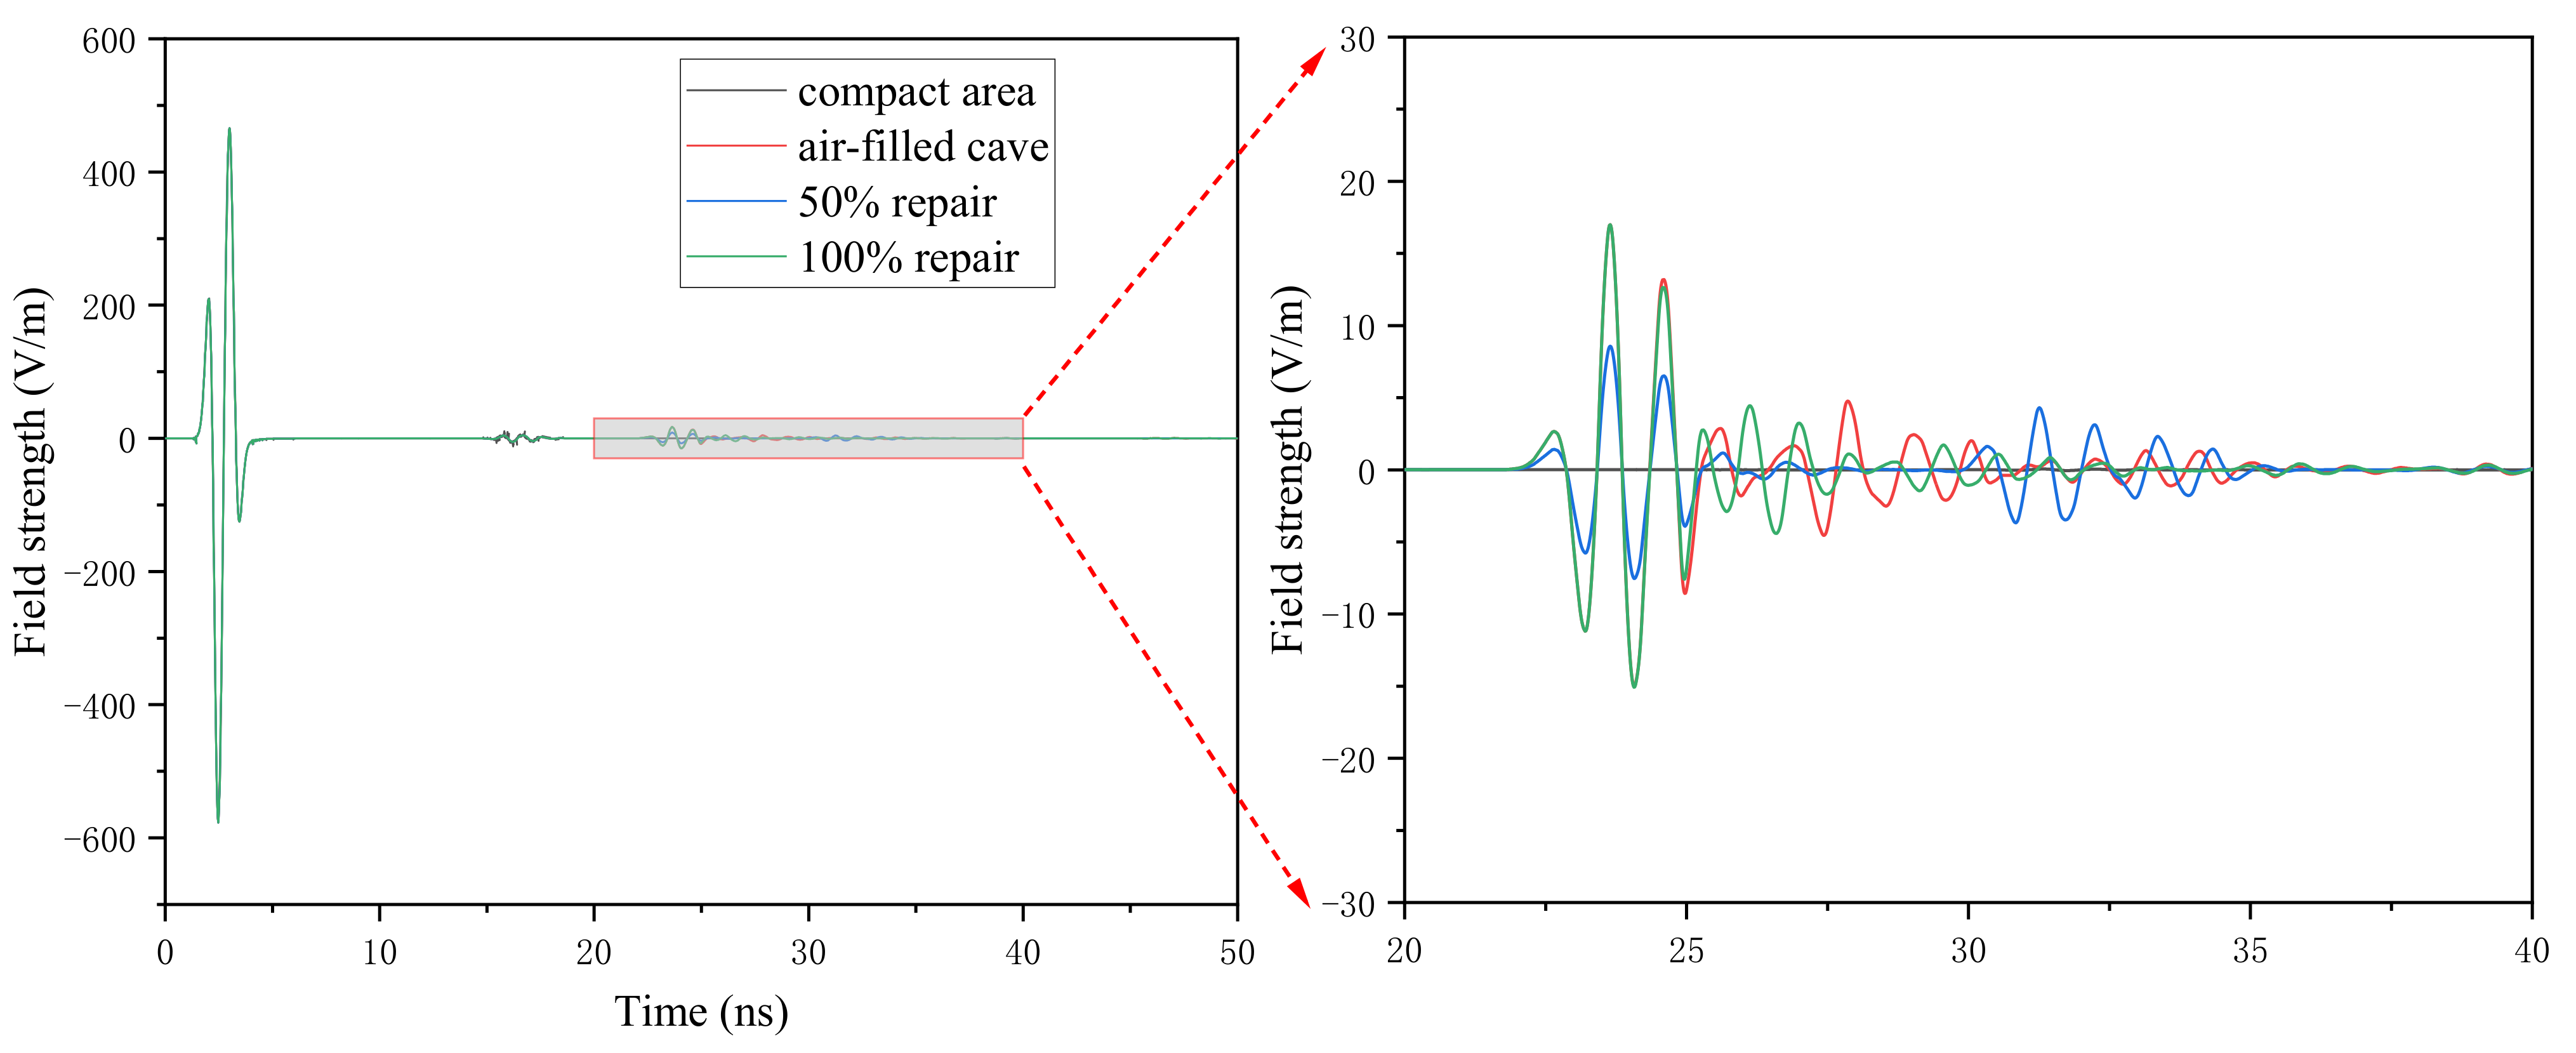
- The forward simulation profiles of dikes and dams with water-filled caves before and after polymer grouting repair present two clusters of hyperbolas. There were three clusters of hyperbolas with different amplitudes that were observed at 50% repair. The A-scan images of water-filled cave before and after repair showed two reflection waves, while the A-scan images of 50% of water-filled cave showed three reflection waves. When polymer grouting is used to repair the air-filled cave, the amplitude and reflection interval in the forward simulation profiles and the single channel waveforms before repair, 50% repair, and 100% repair are different. The air-filled cave repair can be evaluated by the amplitude of the forward simulation profile and the reflections the interval in the single channel waveform.
- (3)
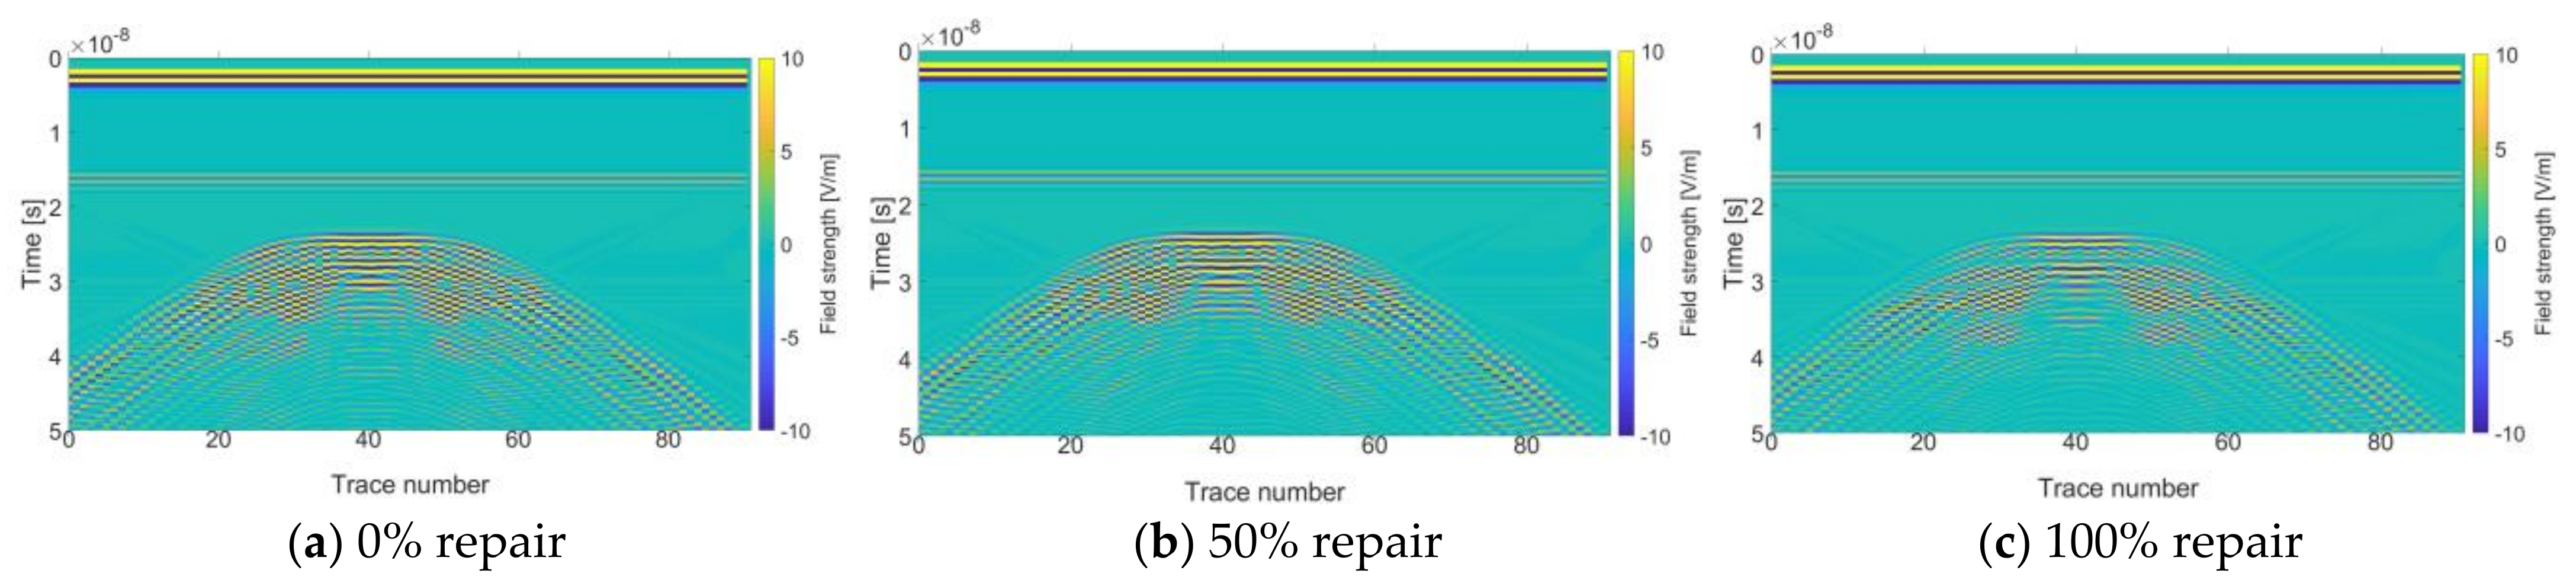
- When detecting the incompact area, as the distance between center point of the incompact area to the dam surface gradually decreases, the top of the curve in the forward profile moves upward and the top amplitude of the curve becomes larger. When polymer grouting is used to repair the incompact area, the top amplitude of the forward simulation profiles and single channel waveforms before repair and 50% repair are significantly bigger than that of 100% repair. The incompact area can be evaluated by the amplitude of the forward simulation profile and single channel waveform.
- (4)
- The GPR propagation characteristics in dikes and dams with different shallow diseases using polymer grouting repair are analyzed. It provides theoretical basis for using the ground-penetrating radar to evaluate the effect of polymer grouting technology to repair dikes and dams with shallow diseases.
Author Contributions
Conceptualization, B.X. and X.Z.; Data curation, Z.D.; Formal analysis, B.X.; Funding acquisition, J.G.; Investigation, J.G.; Project administration, B.X., X.Z. and J.G.; Resources, B.X., J.L., X.Z. and J.G.; Software, Z.D.; Supervision, B.X. and X.Z.; Validation, J.L.; Visualization, J.L.; Writing—original draft, Z.D.; Writing—review and editing, B.X. and J.L. All authors have read and agreed to the published version of the manuscript.
Funding
This research was funded by the National Natural Science Foundation of China with grant No. 52109169, the Natural Science Foundation of Henan with grant No. 212300410279, the Chinese Postdoctoral Science Foundation with grant No. 2021M702951, and the Open Research Fund of Guangxi Key Laboratory of Water Engineering Materials and Structures, Guangxi Institute of Water Resources research with grant No. GXHRI-WEMS-2020-12.
Institutional Review Board Statement
Not applicable.
Informed Consent Statement
Not applicable.
Data Availability Statement
Not applicable.
Conflicts of Interest
The authors declare no conflict of interest.
References
- Pang, R.; Xu, B.; Zhou, Y.; Zhang, X.; Wang, X. Fragility analysis of high CFRDs subjected to mainshock-aftershock sequences based on plastic failure. Eng. Struct. 2020, 206, 110152. [Google Scholar] [CrossRef]
- Wang, F.; Li, J.; Shi, M.; Guo, C. New seepage-proof and reinforcing technologies for dikes and dams and their applications. J. Hydroelectr. Eng. 2016, 35, 1–11. [Google Scholar]
- Liang, J.; Du, X.; Fang, H. Numerical and experimental study of diffusion law of foamed polymer grout in fracture considering viscosity variation of slurry. Tunn. Undergr. Space Technol. 2022, 128, 10467. [Google Scholar] [CrossRef]
- Miao, Y.; He, H.; Li, Z. Strain hardening behaviors and mechanisms of polyurethane under various strain rate loading. Polym. Eng. Sci. 2020, 60, 1083–1092. [Google Scholar] [CrossRef]
- Chen, J.; Yin, X.; Wang, H.; Ding, Y. Evaluation of durability and functional performance of porous polyurethane mixture in porous pavement. J. Clean. Prod. 2018, 188, 12–19. [Google Scholar] [CrossRef]
- Li, M.; Du, M.; Wang, F.; Xue, B.; Zhang, C.; Fang, H. Study on the mechanical properties of polyurethane (PU) grouting material of different geometric sizes under uniaxial compression. Constr. Build. Mater. 2020, 259, 119797. [Google Scholar] [CrossRef]
- Shi, M.; Wang, F.; Luo, J. Compressive strength of polymer grouting material at different temperatures. J. Wuhan Univ. Technol.-Mater. Sci. Ed. 2010, 25, 962–965. [Google Scholar] [CrossRef]
- Fang, H.; Su, Z.; Li, X.; Wang, F.; Fu, Y. Interfacial bond performance between self-expansion polymer and concrete. Constr. Build. Mater. 2021, 270, 121459. [Google Scholar] [CrossRef]
- Wang, Y.; Han, M.; Cao, T.; Yu, X.; Song, Y. Cyclic interface behavior of non-water reactive polymer and concrete during dam restoration. Structures 2021, 34, 748–757. [Google Scholar] [CrossRef]
- Li, M.; Fang, H.; Du, M.; Zhang, C.; Su, Z.; Wang, F. The behavior of polymer-bentonite interface under shear stress. Constr. Build. Mater. 2020, 248, 118680. [Google Scholar] [CrossRef]
- Wang, F.; Guo, C.; Gao, Y. Formation of a Polymer Thin Wall Using the Level Set Method. Int. J. Geomech. 2014, 14, 4014021. [Google Scholar] [CrossRef]
- Li, J.; Zhang, J.; Xu, J.; Wang, F.; Wang, B.; Li, Q. Dynamic behavior of polymer antiseepage wall for earth dam by centrifuge test. Int. J. Geomech. 2018, 18, 04018179. [Google Scholar] [CrossRef]
- Li, J.; Zhang, J.; Wang, Y.; Wang, B. Seismic Response of Earth Dam with Innovative Polymer Antiseepage Wall. Int. J. Geomech. 2020, 20, 04020079. [Google Scholar] [CrossRef]
- Fang, H.; Zhang, H.; Xue, B.; Gao, J.; Li, Y.; Gao, X.; Tian, A. Coordination Characteristics Analysis of Deformation between Polymer Anti-Seepage Wall and Earth Dam under Traffic Load. Water 2022, 14, 1442. [Google Scholar] [CrossRef]
- Zhang, S.; Xue, B.; Wang, J.; Gao, J.; Wang, C.; Li, W. Preliminary Study of Nondestructive Testing of the Polymer Cutoff Wall Based on Vibration Theory. Adv. Mater. Sci. Eng. 2021, 2021, 4444684. [Google Scholar] [CrossRef]
- Guo, C.; Chu, X.; Wang, F. The feasibility of non-water reaction polymer grouting technology application in seepage prevention for tailings reservoirs. Water Sci. Technol.—Water Supply 2018, 18, 203–213. [Google Scholar] [CrossRef]
- Luo, T.X.H.; Lai, W.W.L.; Chang, R.K.W.; Goodman, D. GPR imaging criteria. J. Appl. Geophys. 2019, 165, 37–48. [Google Scholar] [CrossRef]
- Lei, J.; Fang, H.; Xue, B.; Li, Y. A Parallel Conformal Symplectic Euler Algorithm for GPR Numerical Simulation on Dispersive Media. IEEE Geosci. Remote Sens. Lett. 2022, 19, 3502605. [Google Scholar] [CrossRef]
- Nelson, P.A. The Role of GPR in Community-Driven Compliance Archaeology with Tribal and Non-tribal Communities in Central California. Adv. Archaeol. Pract. 2021, 9, 215–225. [Google Scholar] [CrossRef]
- Solla, M.; Pérez-Gracia, V.; Fontul, S. A Review of GPR Application on Transport Infrastructures: Troubleshooting and Best Practices. Remote Sens. 2021, 13, 672. [Google Scholar] [CrossRef]
- Jiao, L.; Ye, Q.; Cao, X.; Huston, D.; Xia, T. Identifying concrete structure defects in GPR image. Measurement 2020, 160, 107839. [Google Scholar] [CrossRef]
- Xie, X.; Yao, R.; Qin, H.; Liu, H. Study on radargram characteristics of the backfill grouting quality evaluation of a shield tunnel using GPR. In Proceedings of the 15th International Conference on Ground Penetrating Radar, Brussels, Belgium, 30 June–4 July 2014; pp. 407–412. [Google Scholar]
- Hugenschmidt, J.; Kalogeropoulos, A. The inspection of retaining walls using GPR. J. Appl. Geophys. 2009, 67, 335–344. [Google Scholar] [CrossRef]
- Zajícová, K.; Chuman, T. Application of ground penetrating radar methods in soil studies: A review. Geoderma 2019, 343, 116–129. [Google Scholar] [CrossRef]
- Al-Dujaili, M.J.; Zalzala, R.A. Implementation of SAR Radar Imaging Algorithm on GPR and Correction of Its Phase Error in War Mine Detection. Sens. Imaging 2021, 22, 29. [Google Scholar] [CrossRef]
- Hui, L.; Haitao, M. Application of Ground Penetrating Radar in Dam Body Detection. Procedia Eng. 2011, 26, 1820–1826. [Google Scholar] [CrossRef]
- Chen, L.; Liu, J.G.; Wang, Y.F.; Niu, J. The Application of Two Dimensional Numerical Simulation Method of Ground Penetrating Radar in Concrete Dam Nondestructive Testing. Adv. Mater. Res. 2014, 1030–1032, 879–884. [Google Scholar] [CrossRef]
- Alsharahi, G.; Faize, A.; Louzazni, M.; Mostapha, A.M.M.; Bayjja, M.; Driouach, A. Detection of cavities and fragile areas by numerical methods and GPR application. J. Appl. Geophys. 2019, 164, 225–236. [Google Scholar] [CrossRef]
- Xie, X.; Zhai, J.; Zhou, B. Back-fill grouting quality evaluation of the shield tunnel using ground penetrating radar with bi-frequency back projection method. Autom. Constr. 2021, 121, 103435. [Google Scholar] [CrossRef]
- Zhang, F.; Xie, X.; Huang, H. Application of ground penetrating radar in grouting evaluation for shield tunnel construction. Tunn. Undergr. Space Technol. 2010, 25, 99–107. [Google Scholar] [CrossRef]
- Alsharahi, G.; Faize, A.; Maftei, C.; Bayjja, M.; Louzazni, M.; Driouach, A.; Khamlichi, A. Analysis and Modeling of GPR Signals to Detect Cavities: Case Studies in Morocco. J. Electromagn. Eng. Sci. 2019, 19, 177–187. [Google Scholar] [CrossRef]
- Alsharahi, G.; Faize, A.; Driouach, A.; Mostapha, A.M.M. Determination of the Physical Properties and Geometric Shape of Objects Buried by Simulation Signals Radar GPR. In Proceedings of the 2019 8th International Conference on Modeling Simulation and Applied Optimization (ICMSAO), Manama, Bahrain, 15–17 April 2019; pp. 1–4. [Google Scholar]
- Warren, C.; Giannopoulos, A.; Gray, A.; Giannakis, I.; Patterson, A.; Wetter, L.; Hamrah, A. A CUDA-based GPU engine for gprMax: Open source FDTD electromagnetic simulation software. Comput. Phys. Commun. 2019, 237, 208–218. [Google Scholar] [CrossRef]
- Lax, M.; Nelson, D.F. Maxwell equations in material form. Phys. Rev. B Solid State 1976, 13, 1777–1784. [Google Scholar] [CrossRef]
- Chen, H.; Huang, T. Finite-difference time-domain simulation of GPR data. J. Appl. Geophys. 1998, 40, 139–163. [Google Scholar] [CrossRef]
- Yee, K.S. Numerical solution of initial boundary value problems involving Maxwell’s equation in isotropic media. IEEE Trans. Antennas Propag. 1966, 14, 302–307. [Google Scholar]
- Berenger, J.P. A perfectly matched layer for the absorption of electromagnetic waves. J. Comput. Phys. 1994, 114, 185–200. [Google Scholar] [CrossRef]
- Chen, J. Forward Simulation and Data Analysis of GPR for the Concrete Cavity Based on GprMax3.0. Master’s Thesis, Changsha University of Science & Technology, Changsha, China, 2018. [Google Scholar]
- Li, B.; Guo, S.; Yue, G.; Tian, P.; Cai, W. Study on effective permittivity of two-phase mixture based on GPR numerical simulation. Prog. Geophys. 2021, 36, 736–745. [Google Scholar] [CrossRef]
Publisher’s Note: MDPI stays neutral with regard to jurisdictional claims in published maps and institutional affiliations. |
© 2022 by the authors. Licensee MDPI, Basel, Switzerland. This article is an open access article distributed under the terms and conditions of the Creative Commons Attribution (CC BY) license (https://creativecommons.org/licenses/by/4.0/).


