1. Introduction
The permafrost regions of the Qinghai–Tibet Plateau are the largest permafrost regions in China, and the permafrost regions are very sensitive to temperature changes [
1,
2,
3]. The temperature changes caused by the greenhouse effect can thermally degrade permafrost [
4,
5]. According to an investigation of thawing geological disasters in Qinghai permafrost regions from 2019 to 2021, there were 644 actual or potential geological disasters caused by thawing conditions, resulting in a property loss of CNY 993 million. Moreover, slope instability affects the safety of nearby infrastructure [
6]. Therefore, it is important to explore the mechanism of slope instability under the various conditions of permafrost regions. This can guide the design of strategies to protect against slope instability and against the destruction of infrastructure.
Temperature increases lead to the thawing of permafrost soil [
7,
8]. With the increasing amount of liquid water, the water content and shear strength of permafrost soil also increase. A series of factors affect the physical and mechanical parameters of frozen soil under the freeze–thaw cycle. Wang et al. [
9] explored the relationship between shear strength and water content under the freeze–thaw cycle. Xin et al. [
10] studied the stability of slopes in seasonally frozen regions, explored the effects of the freeze–thaw cycle on the mechanical behaviors of soils and found that bentonite can effectively increase the cohesion after freeze–thaw action.
In addition to shear strength, some scholars have continued to conduct research on slope stability under freeze–thaw conditions using numerical simulations [
11,
12,
13]. Combined with the field monitoring data, the temperature distribution and seepage distribution can be determined using the finite element method to comprehensively analyze slope stability. Ge et al. [
14] used the continuous explicit finite difference method to numerically simulate the thawing process of slopes in permafrost regions, concluding that the slope slide surface is the freeze–thaw interface. Based on thermal–mechanical coupling and the elastic–plastic theory, Chen et al. [
15] divided the displacement development process of a freeze–thaw slope into rapid and stable stages using a finite element numerical simulation method combined with shear strength parameters (cohesion and internal friction angle). The above studies compared the temperature field and stress field to extensively explore the mechanism of slope instability from the perspective of a sliding surface and the displacement of monitoring characteristic points in the freeze–thaw slope.
However, the above studies did not consider pore water pressure development and water–ice phase transition during the analysis of slope instability. Pore water pressure is an important parameter in the analysis of slope stability [
16,
17,
18]. According to the partial differential equation determined by the COMSOL multiphysics software, Zhan et al. [
19] established a thermal fluid–solid coupling model that considered the changes in the temperature field and liquid water migration. The authors separated the freezing and thawing stages and calculated the water content, maximum freezing depth, and displacement data. Additionally, the study analyzed the mechanism of slope instability in seasonal frozen soil regions. According to the Darcy seepage and heat conduction law of unsaturated soil, Deng et al. [
20] established a thermal–fluid coupling model that considered ice–water phase change, convective heat transfer, and the anti-ice effect. At the same time, based on the standard deviation of the numerical solution of subgrade ice content in the freeze–thaw cycle obtained by the model, the concept reflecting the subgrade freeze–thaw characteristics and the degree of freeze–thaw damage was proposed.
In summary, under the conditions of the freeze–thaw cycle, the external temperature and pore water pressure affect the stress field of slope, and the freeze–thaw cycle causes changes in cohesion and shear strength. However, few studies conducted a slope instability analysis in permafrost regions of the Qinghai based on the shear strength parameter and numerical simulation. In this study, we obtained shear strength parameters through a direct shear test of soil samples that were collected from the Qinghai (Qinghai–Tibet Plateau). Secondly, we analyzed the corresponding geological disasters according to the temperature monitoring data and observation results of slope instability. Thirdly, we qualitatively analyzed slope instability using existing theories. Finally, the factors of safety were compared under various temperatures, slope gradients, shear strength parameters, and pore water pressures to analyze the slope instability mechanism in permafrost regions.
3. Results and Discussion
3.1. Shear Strength Parameters under Different Water Contents
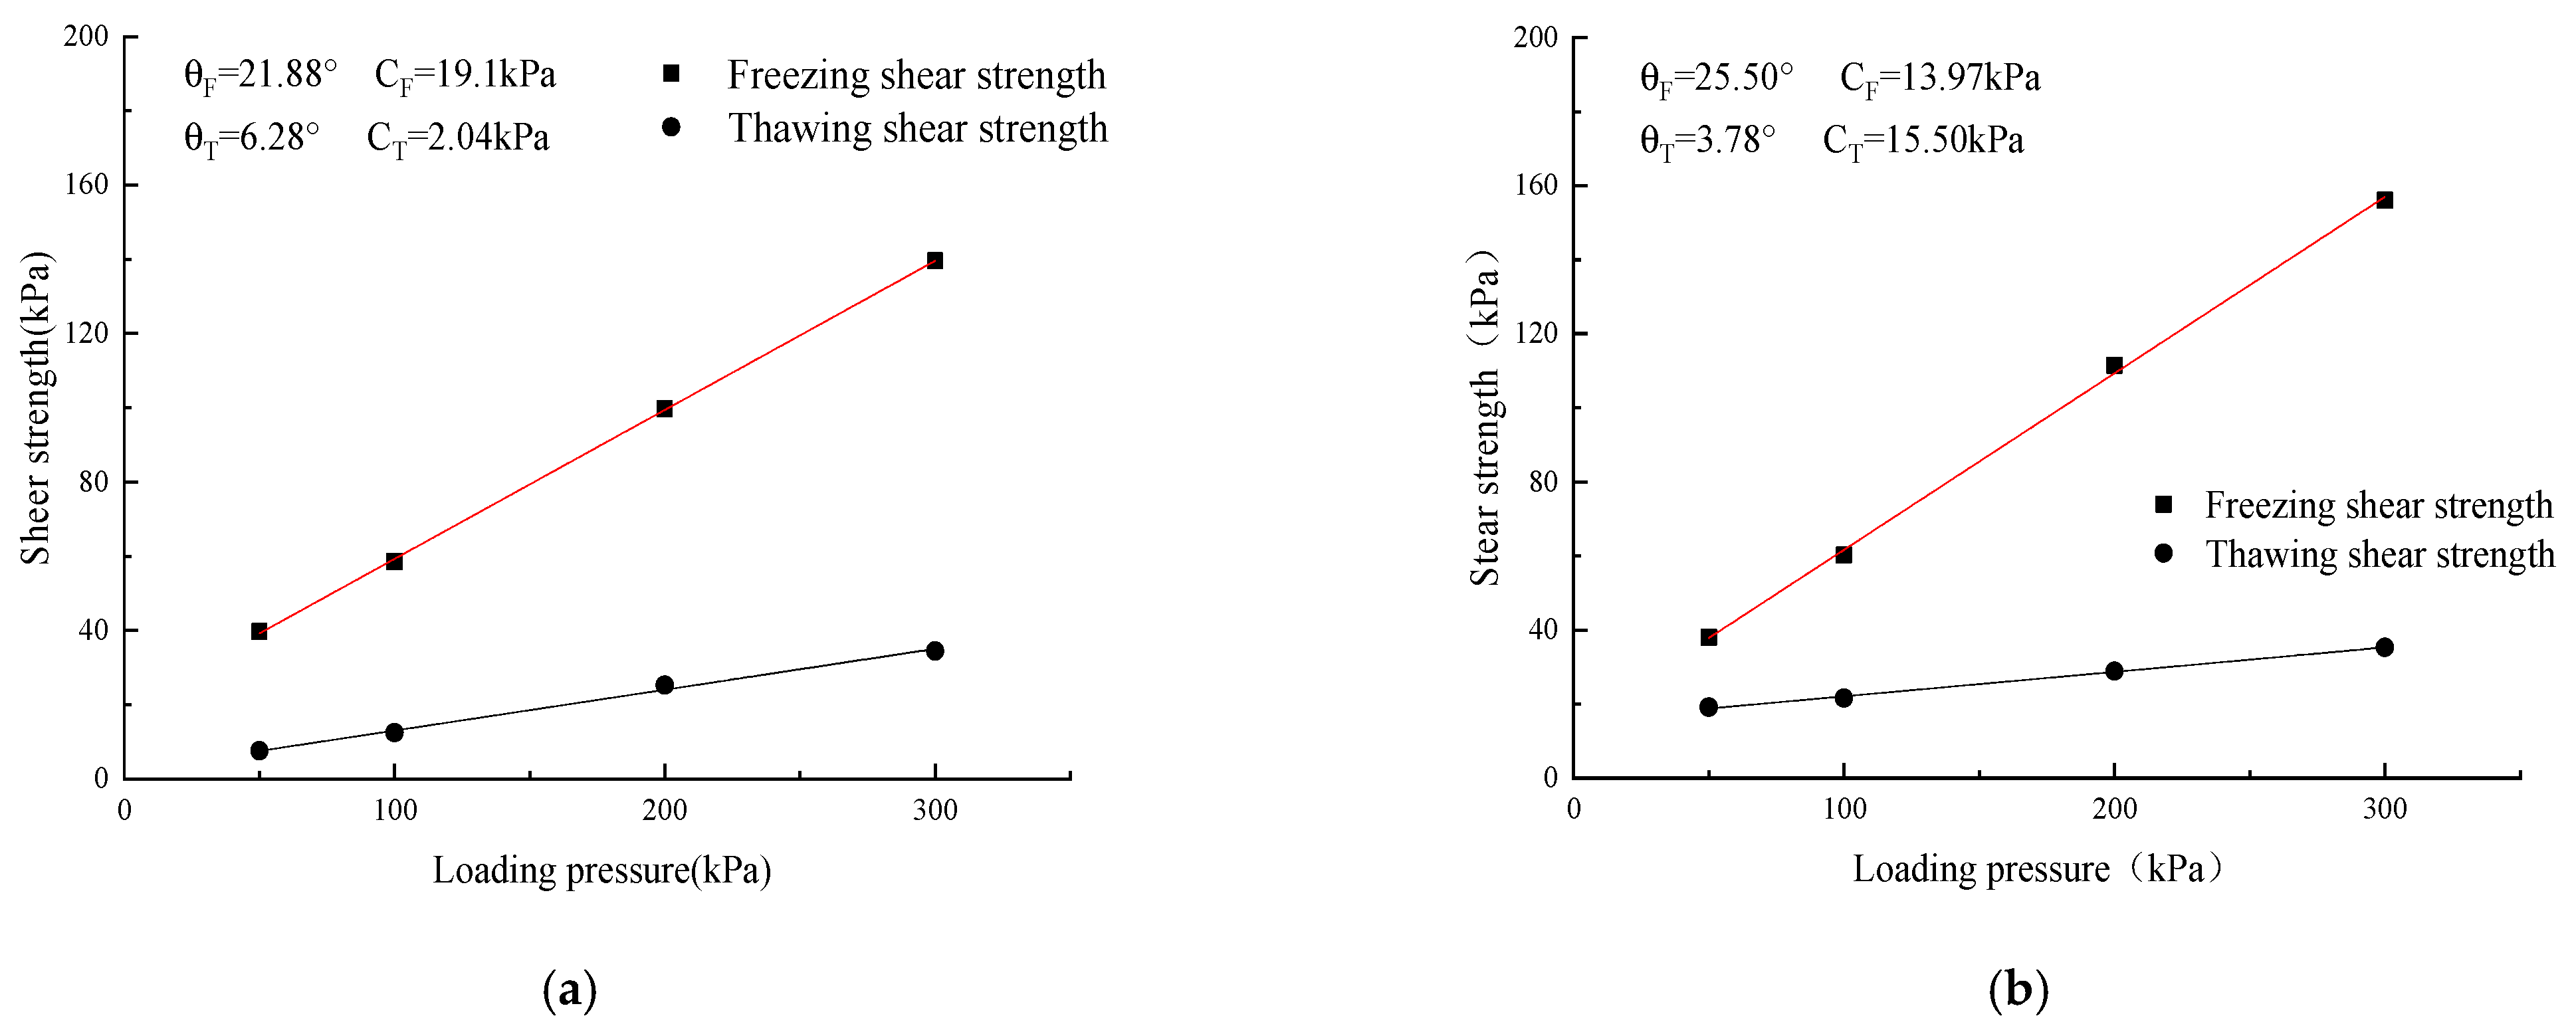
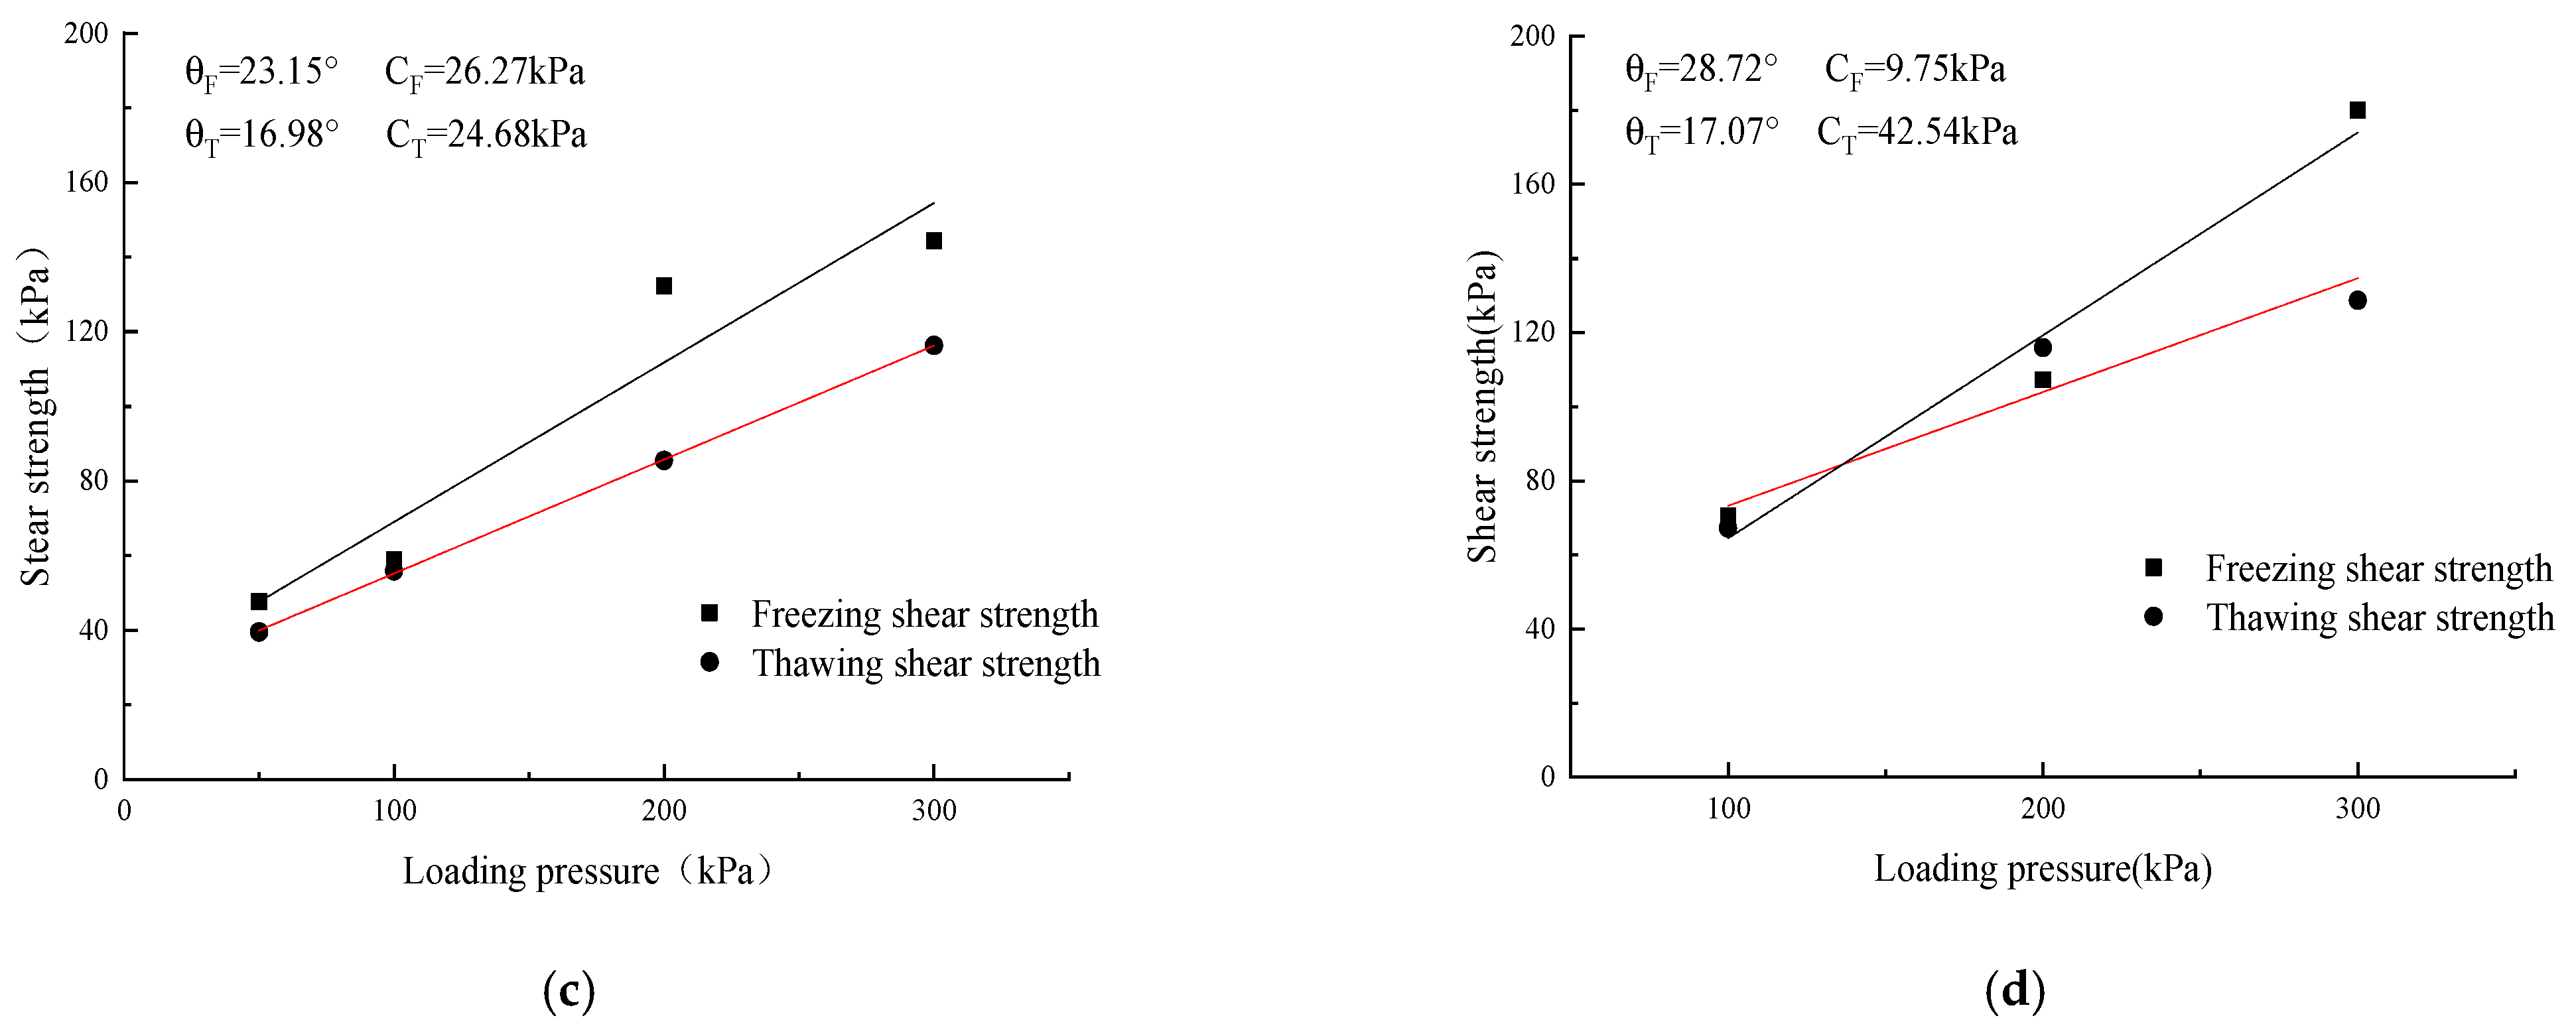
Figure 2 shows the relationship between the loading pressure and shear strength under the various water contents with the freezing and thawing condition. The shear strength decreased with the increase in water content. Specifically, the shear strength increased from 12.4 kPa (102% water content) to 21.6 kPa (80% water content) under 100 kPa loading pressure with a thawing condition. In addition, the shear strength of the freezing soil sample was much higher than that of the thawing sample. This is mainly because the shear stress on the liquid water is intolerable, and the shear strength of the soil is improved due to the conversion of water into ice at a low temperature. The relationships between the shear strength parameters and the water content under the freezing and the thawing conditions are shown in
Figure 3. In general, the internal friction angle decreases with the increase in water content under the thawing condition. In other words, the increase in water content can reduce the contact friction between soil particles in the thawing condition. To be specific, the internal friction angle decreased from 17.1° to 6.3° when the water content increased from 52% to 102% in the thawing condition. This is because when the liquid water increases in the soil, the shear strength of the soil can only be provided by the bite friction between soil particles, while the increase in pore water loosens the dense structure of soil particles and reduces the contact area of particles.
When the pore water is frozen, the contact area among the particles decreases, but the reduced shear strength can be compensated by crystalline ice. Therefore, the internal friction angle in the freezing condition is significantly higher than that in the thawing condition under different water contents. In addition, there is no clear change in the cohesion under different water contents in the freezing condition. However, this cohesion caused a decrease in the thawing condition. This is because the cohesion of soil is determined by the double layer around the soil particle; the liquid water can increase the distances between soil particles and reduce the cohesion of the soil. However, the effect of water content on shear strength parameters under the freezing condition is unclear. As a result, the shear strength difference increased with the increased water content, which was observed between the freezing condition and thawing condition.
3.2. Temperature Monitoring Data and Corresponding Geological Disasters
Geological disasters can be observed in these permafrost regions, and temperature sensors were installed below-ground to monitor the change in temperature.
Figure 4 shows the temperature monitoring data of each station and the corresponding geological disasters between October 2020 and August 2021. The temperature monitoring data of station 3 are regular, and the temperature monitoring data are shown in
Figure 4a. Since July 2021, the data have shown that the temperature at a depth of 13−15 m has risen to 1.58 °C, and there are cracks and collapses on the surface, as shown in
Figure 4b. The temperature monitoring data of station 6 show that the temperature at −15 m has risen to a positive temperature since 15 July 2021, as shown in
Figure 4c. There are some cracks and landslides on the surface, as shown in
Figure 4d.
According to the temperature monitoring data of each station, the disasters occurred when the soil temperature of −15 m was higher than 0 °C. Therefore, it is of great significance to explore shear strength parameters to analyze the occurrence of local landslides and other disasters.
3.3. The Slope Instability Analysis
When soil from the Qinghai has a relatively higher water content in the thawing condition, it is known as soft soil. There is a relatively higher level of excess pore water pressure when the soil water content is saturated; therefore, the load pressure was applied on the soil. This higher level of water pressure occurs because the pores between the soil particles are complicated and narrow, making it difficult for the pore water inside to escape. According to Coulomb’s law, the shear strength of soil is related to the effective stress between soil particles, the internal friction angle, and cohesion. The shear strength of soil samples from the Qinghai is described in Formula (1) [
22]:
where τ is the shear strength of soil samples, σ
n is the normal stress on the failure shear plane, Pe is the excess pore water pressure on the failure shear plane, φ is the internal friction angle of soil samples, and C is the cohesion of soil samples.
In the saturation soil, water and solid particles share the loading pressure, and the loading pressure that is shared by water becomes the excess pore water pressure (Pe). When the soil sample is frozen, the pore water exists in the form of crystalline ice, and there is almost no or only a small amount of excess pore water pressure in the soil sample, which has little impact on the shear strength of the soil and the stability of the slope structure. However, when the soil sample is in the thawing condition, the liquid water bears part of the loading pressure, the excess pore water pressure reduces the shear strength of the soil, and finally, the slope slides.
To analyze slope instability, previous studies adopted the infinite slope module type and effective stress limit equilibrium method to obtain the safety factor of slope stability, which is shown in Formula (2) [
23].
where
Fs,
c′,
,
,
, and
are the factors of safety, cohesion, internal friction angle, specific weight, saturation specific weight, and specific water weight, respectively;
m is the liquid water thickness divide thawing depth; and
z is vertical depth of the slip surface.
As can be seen in Formula (2), the slope instability have a relationship with the internal friction angle, cohesion, and the slope gradient. However, Formula (2) ignores the pore water pressure increase. In addition, Formula (2) cannot obtain the distribution of temperature, displacement, or stress. Moreover, pore water pressure does not easily dissipate in the soil of the Qinghai, which is an important parameter in slope instability analysis. Therefore, the FLAC3D (finite difference method) needs to adopt a stabilization process of slopes, considering the slope gradient, temperature distribution, internal friction angle, cohesion, and pore water pressure distribution.
3.4. Numerical Simulation
3.4.1. Temperature Distribution of Slopes
Based on field investigations and local climate data, we set the initial conditions of the temperature field according to the monitored temperature below the surface and the influence depth. Additionally, we selected the most dangerous month of the freeze–thaw conditions so as to simulate the maximum freeze–thaw depth at the top and toe of the slope. The temperature distributions of the slopes with the slope gradients 5°, 10°, and 15° were simulated. According to the field temperature monitoring data, the range of atmospheric heat affecting the slope is limited, and this atmospheric heat is only conducted downward over time and at a shallow depth. Moreover, the underlying permafrost is less affected by the change in atmospheric temperature and remains a low temperature throughout the year, which do not belong to the influence depth of atmospheric temperature. The surface temperature of the temperature field model was set as 15 °C and 29.8 °C to form a control group based on the temperature monitoring data. The numerical simulation plan is shown in
Table 2.
The simulations of temperature distributions with different slopes are shown in
Figure 5a,f. From
Figure 5, it can be calculated that the higher the surface temperature is, the greater the thawing depth. The thawing line gradient is similar to the slope gradient. The temperatures below the feature points at the slope bottom and slope top are extracted for calculation. In order to reflect the actual situation of the slope in permafrost regions, the soil layer is divided into the freezing layer and thawing layer. The shear strength parameters under freeze–thaw conditions are described in
Section 3.1.
3.4.2. Influence of the Slope Gradient on Slope Instability Analysis
According to the calculated thawing depth, the slope models with a slope gradient of 5°, 10°, and 15° were established using the shear strength parameters of 80% water content. The Mohr–Coulomb failure rule and elastic–plastic constitutive model were adopted, and the initial stress field was selected according to the self-weight stress field. When using the constraint method, the boundary conditions were that the displacement of the lower soil was 0, the left and right sides were fixed boundaries, and the top surface was a free surface. The internal friction angle and cohesion change with freeze–thaw conditions, which was measured in
Section 3.1. Slope instability under various conditions (which is shown in
Table 3) is compared. The physical and mechanical parameters are shown in
Table 1.
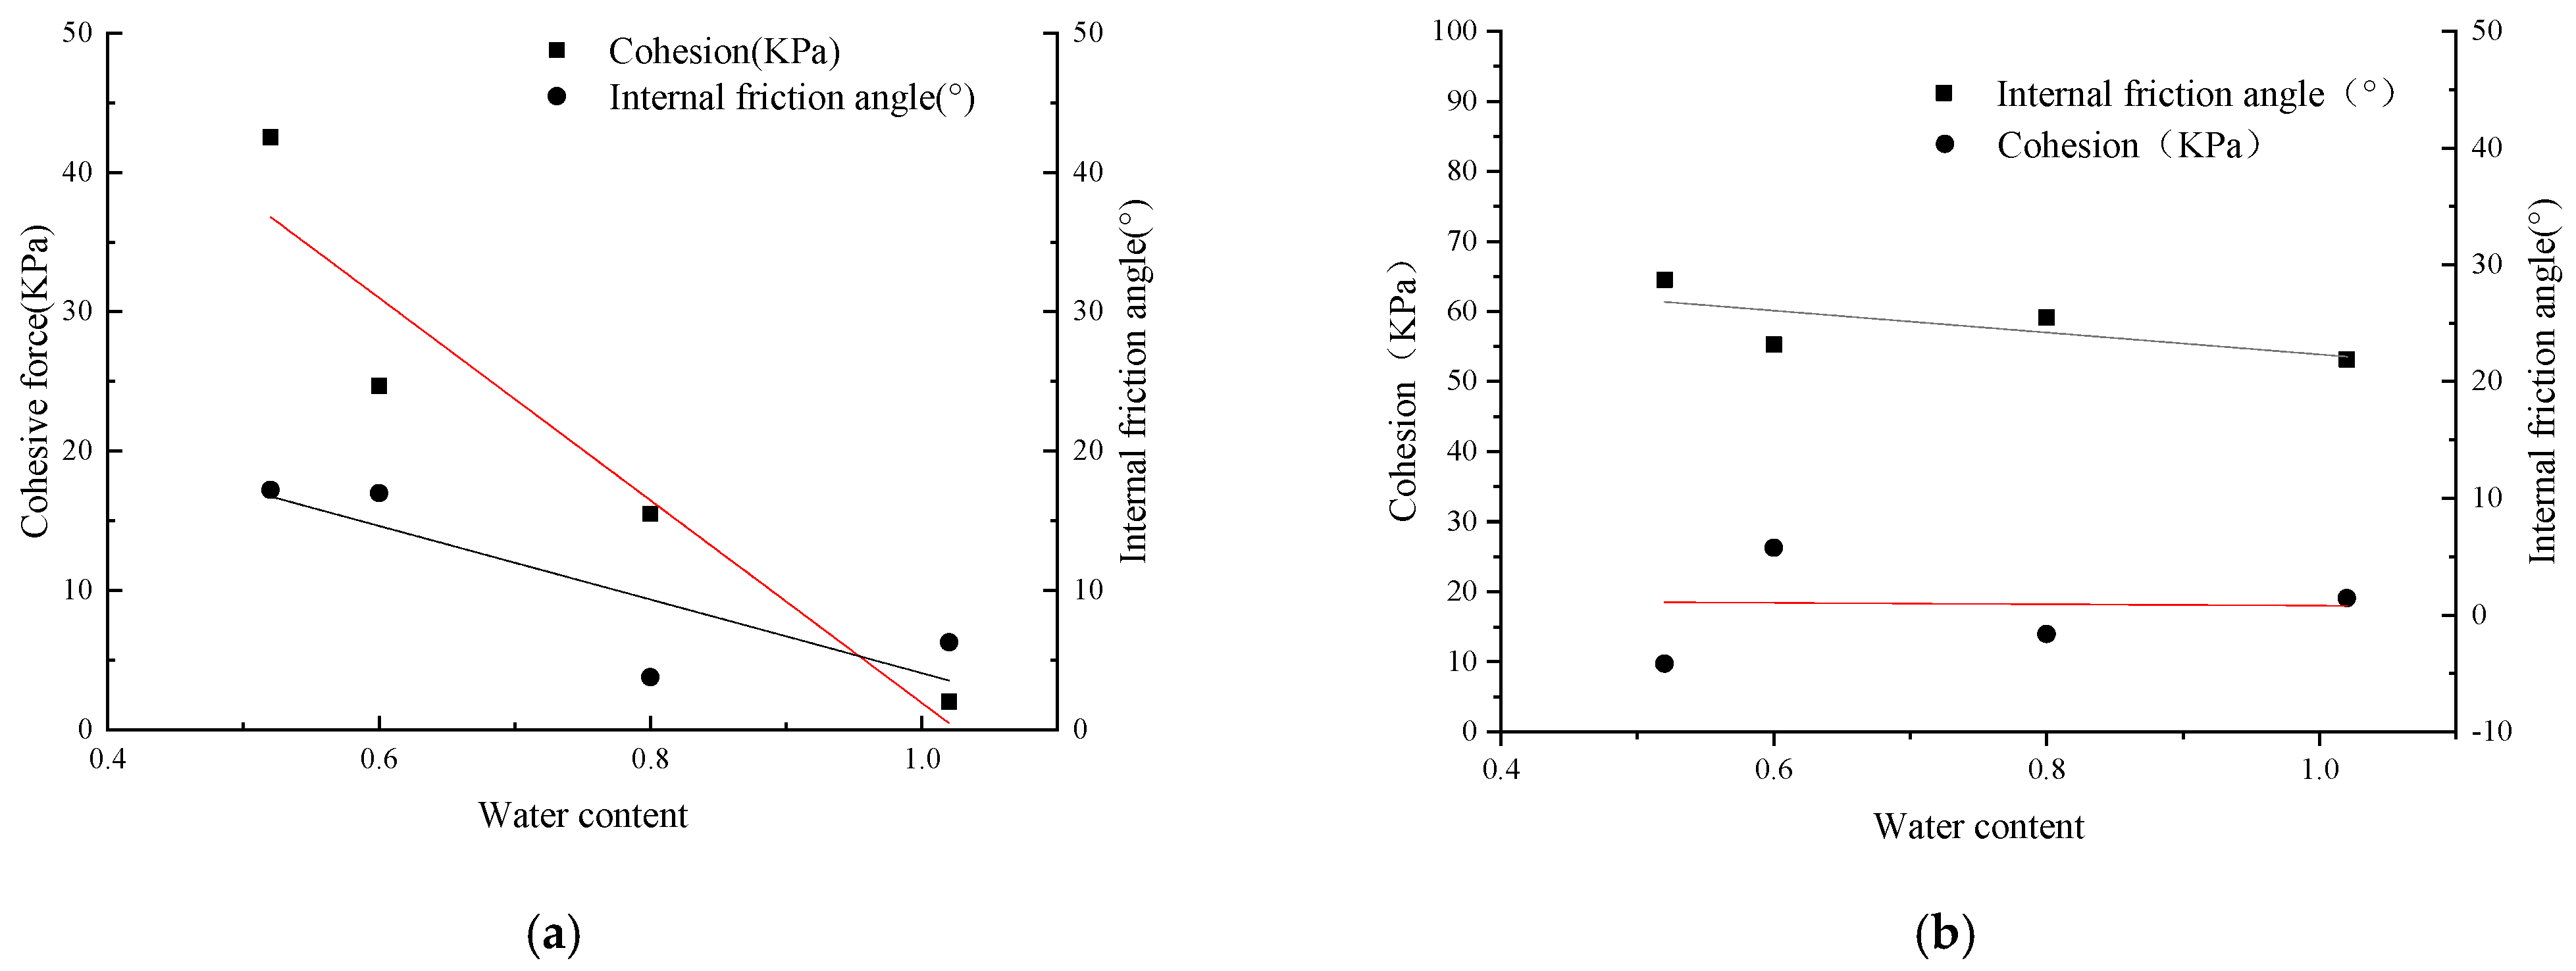
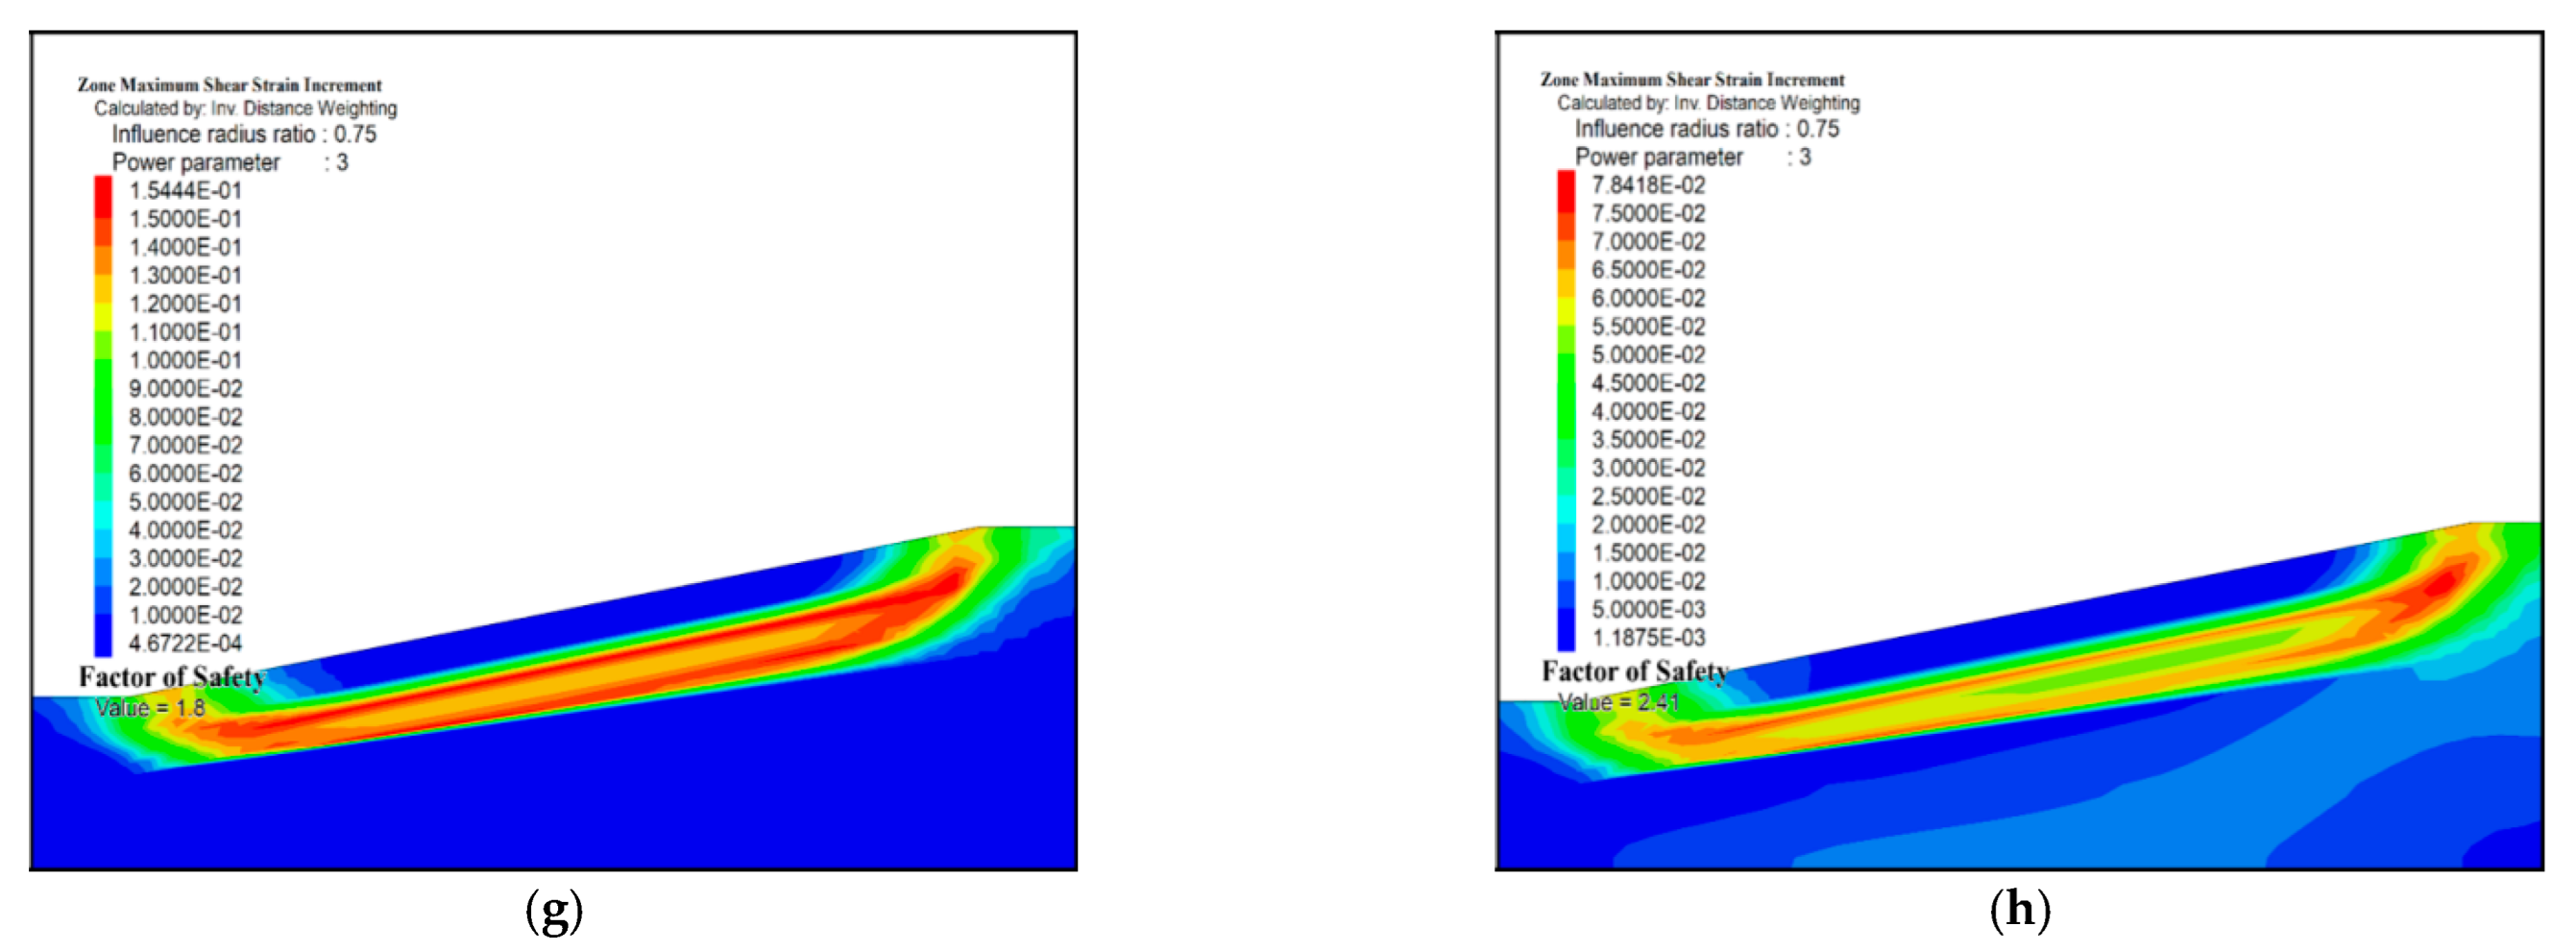
Figure 6a–c show the slope gradient influence on the slope instability. As shown in
Figure 6a–c, under the self-weight and freeze–thaw conditions, an arc-shaped shear zone is gradually generated towards the slope top. It is worth noting that the sliding surface essentially coincides with the interface of freeze–thaw under the different slope gradients, indicating that the slope slides along the weak surface during the slope instability process. After freeze–thaw action, the soil structure is damaged within the thawing depth. As a result, the shear strength was reduced and the weak interlayer formed at the freeze–thaw interface, resulting in slope instability.
It can be seen from
Figure 6 that the factor of safety gradually decreases with the increase in slope gradient. When the slope gradient increases from 5° to 15°, the factor of safety decreases from 1.977 to 0.764. Moreover, the decrease rate of the factor of safety (5°–10°) is much higher than that of 10°–15°. Firstly, the higher the slope gradient is, the deeper the thawing potential of soil layer is. This causes the shear strength reduction area of the high slope gradient to be much higher than that of the low slope gradient under the same conditions. Secondly, slope gradient has a positive relationship with the tangential force, along with the slope surface. In other words, the high slope gradient has a lower shear strength and a higher tangential force than those of the low slope gradient, resulting in a relatively lower factor of safety.
3.4.3. Influence of Shear Strength Parameter on Slope Instability Analysis
According to the discussion in
Section 3.1 and
Section 3.3, the shear strength parameter greatly affects the shear strength of soil and slope instability. Taking the shear strength parameters obtained from
Section 3.1, the cohesion increases from 2 kPa to 42.5 kPa under the thawing condition and from 9.8 kPa to 26.3 kPa under the freezing condition. Correspondingly, the internal friction increases from 3.8° to 17.1° under the thawing condition and from 21.9° to 28.7° under the freezing condition. To explore the contribution of the cohesion and internal friction angle of slope instability, we separately described the cohesion and internal friction angle affecting slope instability. When the internal friction angle is kept at a constant value of 6.3°, the cohesion increases from 2 kPa to 42.5 kPa. Correspondingly, when cohesion is kept at a constant value of 2 kPa, the internal friction angle increases from 6.3° to 28.7°. The numerical simulation plan is shown in
Table 4.
Figure 7 shows the factor of safety under various cohesion and internal friction angle values. It can be seen that the factor of safety increases with the increase in internal friction angle and cohesion.
Moreover, the increasing rate of the factor of safety was calculated using Formula (3):
where FOSC1(C1) and FOSC2(C2) are the factors of safety (cohesion) under condition 1 and condition 2, respectively, with the same internal friction angle. FOSF1(F1) and FOSF2(F2) are the factors of safety (internal friction angle) under condition 1 and condition 2, respectively, with the same cohesion. FOS
cr and FOS
Fr are the change rates of the factor of safety under the changing cohesion and changing internal friction angle, respectively.
The factor of safety increases from 0.76 to 3.086 when the internal friction angle increases from 6.3° to 28.7°. Additionally, the factor of safety has a linear relationship with the increase in cohesion and internal friction angle (for which a regression analysis between the factor of safety and cohesion or internal friction angle is conducted) based on the FOScr and FOSFr values under various conditions. Moreover, the changing rate of the factor of safety in the changing internal friction angle is higher than that in the changing cohesion. Therefore, the internal friction angle has a great effect on slope instability compared with cohesion in permafrost regions. In other words, the internal friction angle and cohesion reduced with the thawing condition, causing slope instability in permafrost regions.
3.4.4. Influence of Pore Water Pressure on Slope Stability Analysis
Due to the impermeability and weak permeability of the permafrost soil, the pore water pressure develops during the thawing period. Additionally, the existence of pore water may assemble at the freeze–thaw interface. Based on the discussion in
Section 3.3, the increases in pore water pressure and the water content reduce the shear strength of the permafrost soil, which affects slope instability in permafrost regions. Considering pore water pressure during slope instability in permafrost regions, this section details the numerical simulations based on
Table 4. Firstly, pore water pressure was applied on the slope surface. Secondly, the frozen layer was set as the impermeable layer. Thirdly, we opened the seepage field and stress field for coupling calculations.
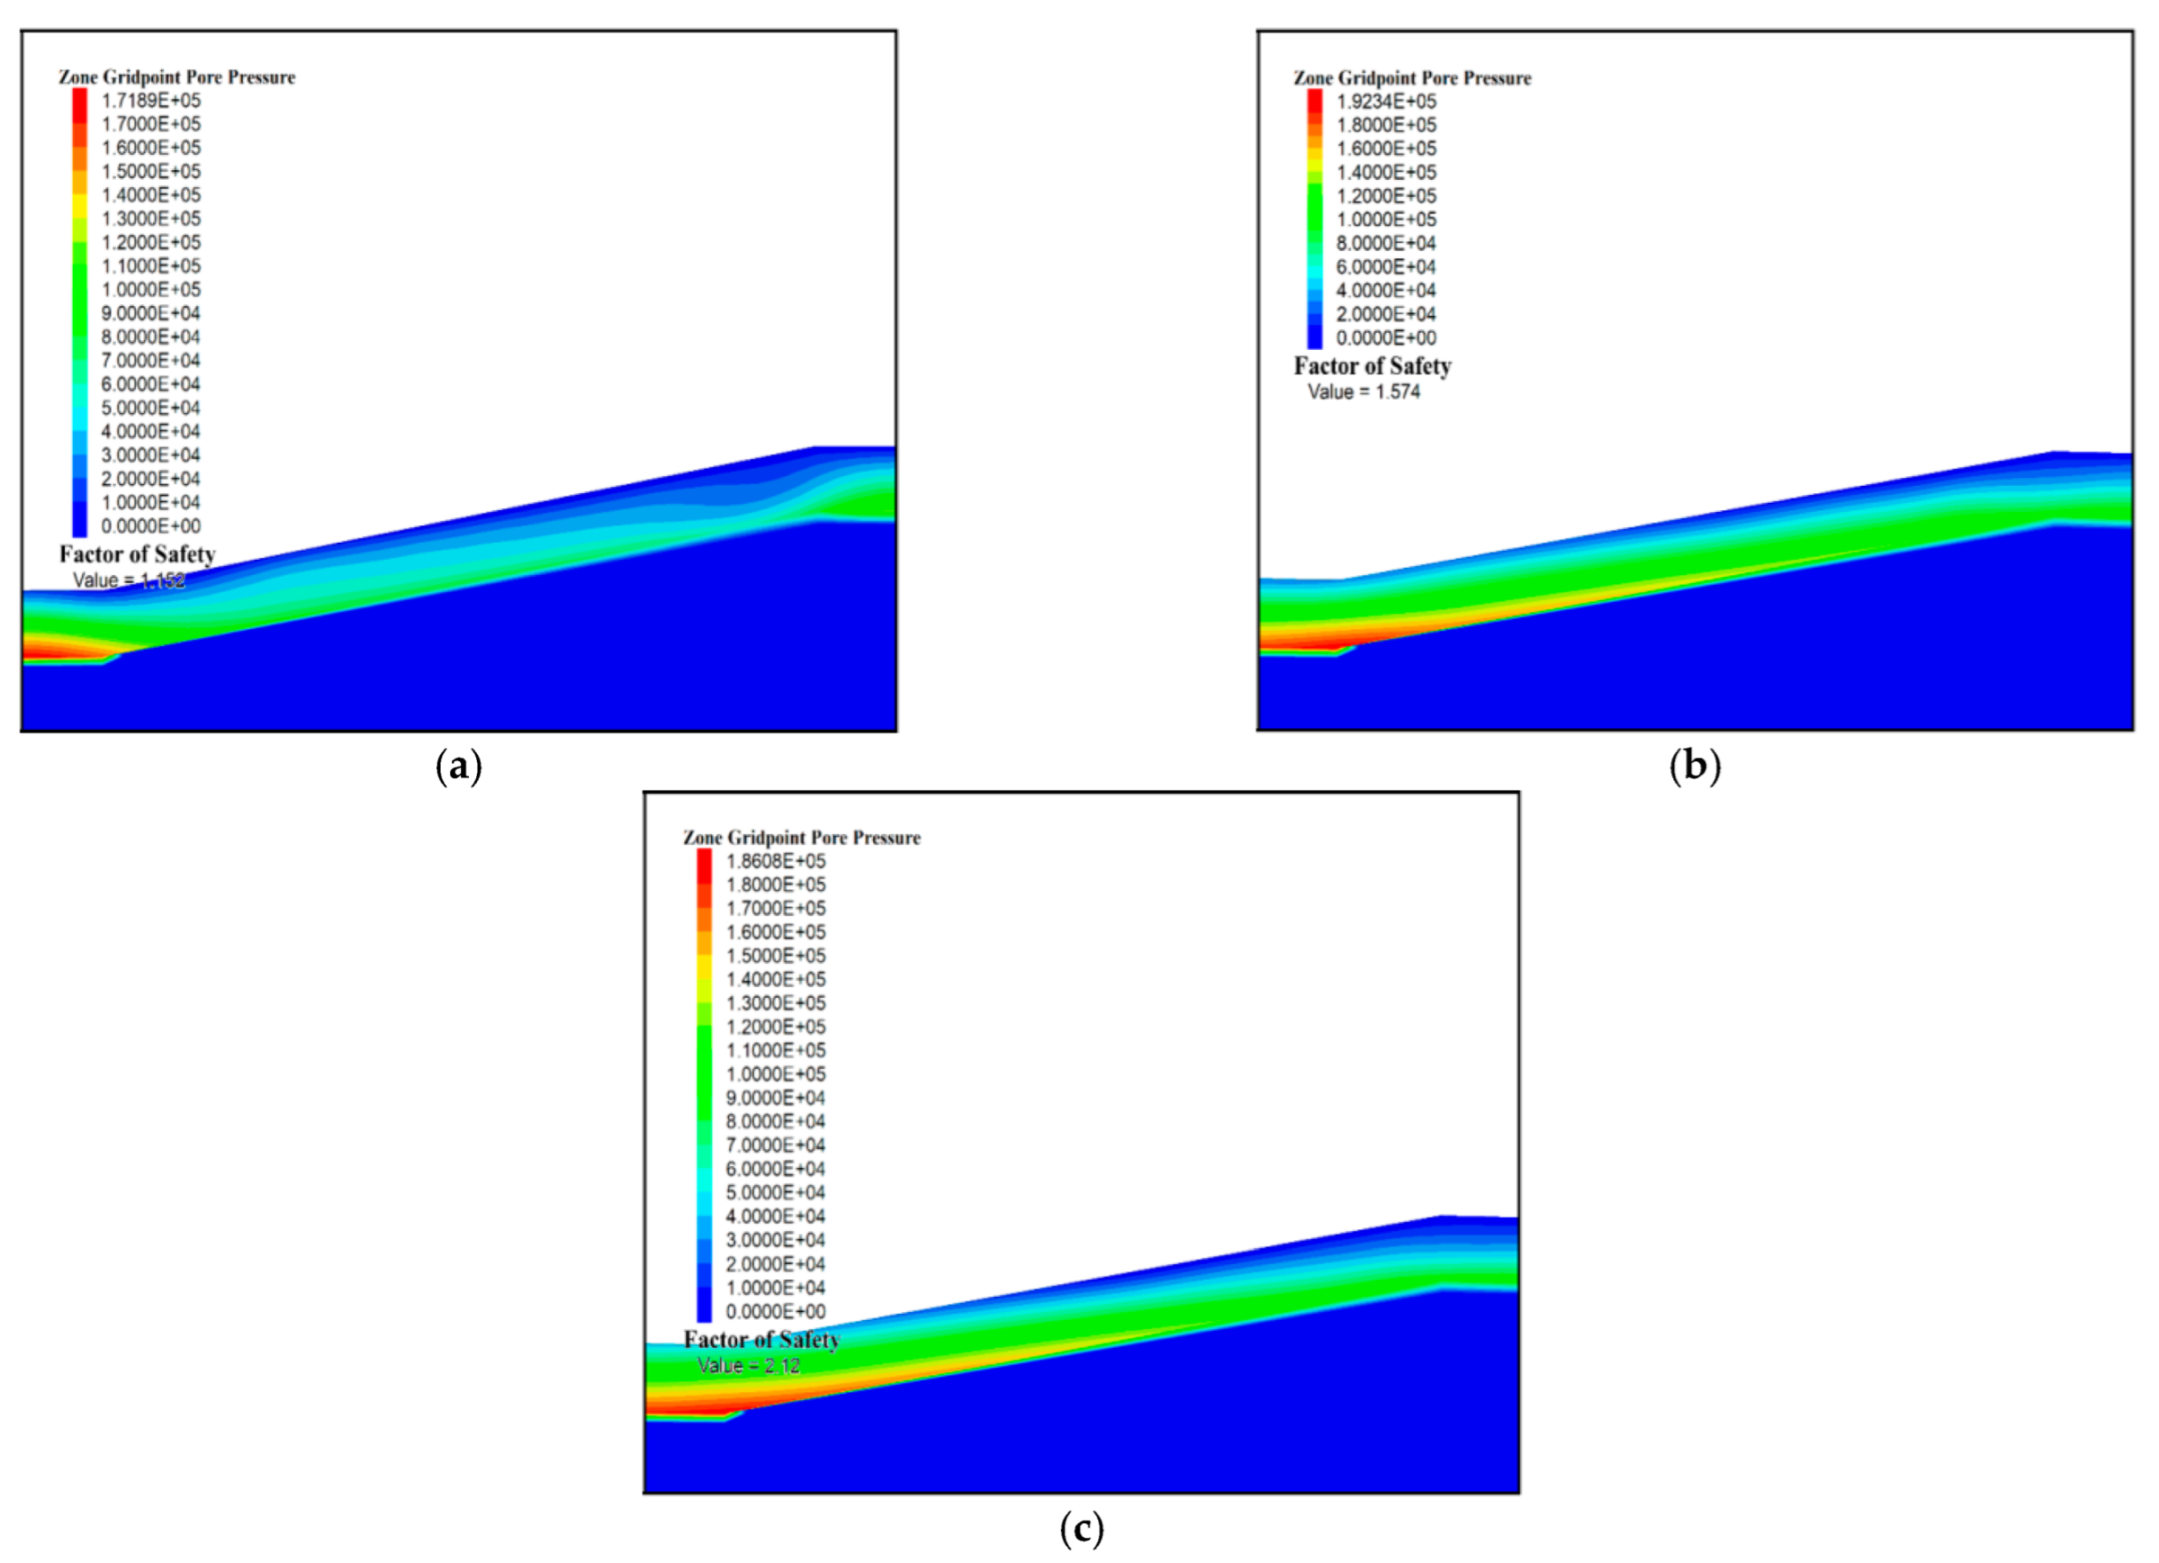
Figure 8 shows the pore water pressure distribution. The simulation results show that the slope gradient influences the pore water pressure distributions. However, the pore water pressure increased with depth increasing and the pore water pressure is about zero in the freezing layer. Moreover, the numerical simulation results prove that liquid water accumulation occurred at the freeze–thaw interface.
In addition, the variation in pore water pressure has a certain influence on the safety of a slope. In other words, the factor of safety reduced pore water pressure by 12% compared to the simulation results without a fluid mechanical analysis under 42.5 kPa cohesion. Therefore, slope instability includes two contributions: liquid water enrichment in the freeze–thaw interface and pore water pressure development in the thawing layer. During thawing in permafrost regions, the ice crystal translated into the liquid water in the soil layer. In addition, liquid water gathered at the freeze–thaw interface. The increase in water content near the slide interface decreased the cohesion and internal friction angle. In addition, pore water pressure developed, which was difficult to dissipate due to the low permeability of permafrost soil. Thus, the pore water pressure reduced the effective stress in the soil skeleton. Based on the experimental data in
Section 3.1 and Formula (2), cohesion, internal friction, and effective stress were all reduced during the thawing action in the permafrost regions. Therefore, slope instability increased with the pore water pressure development.


