
Measuring the Effect of Circular Public Procurement on Government’s Environmental Impact


Abstract
:1. Introduction
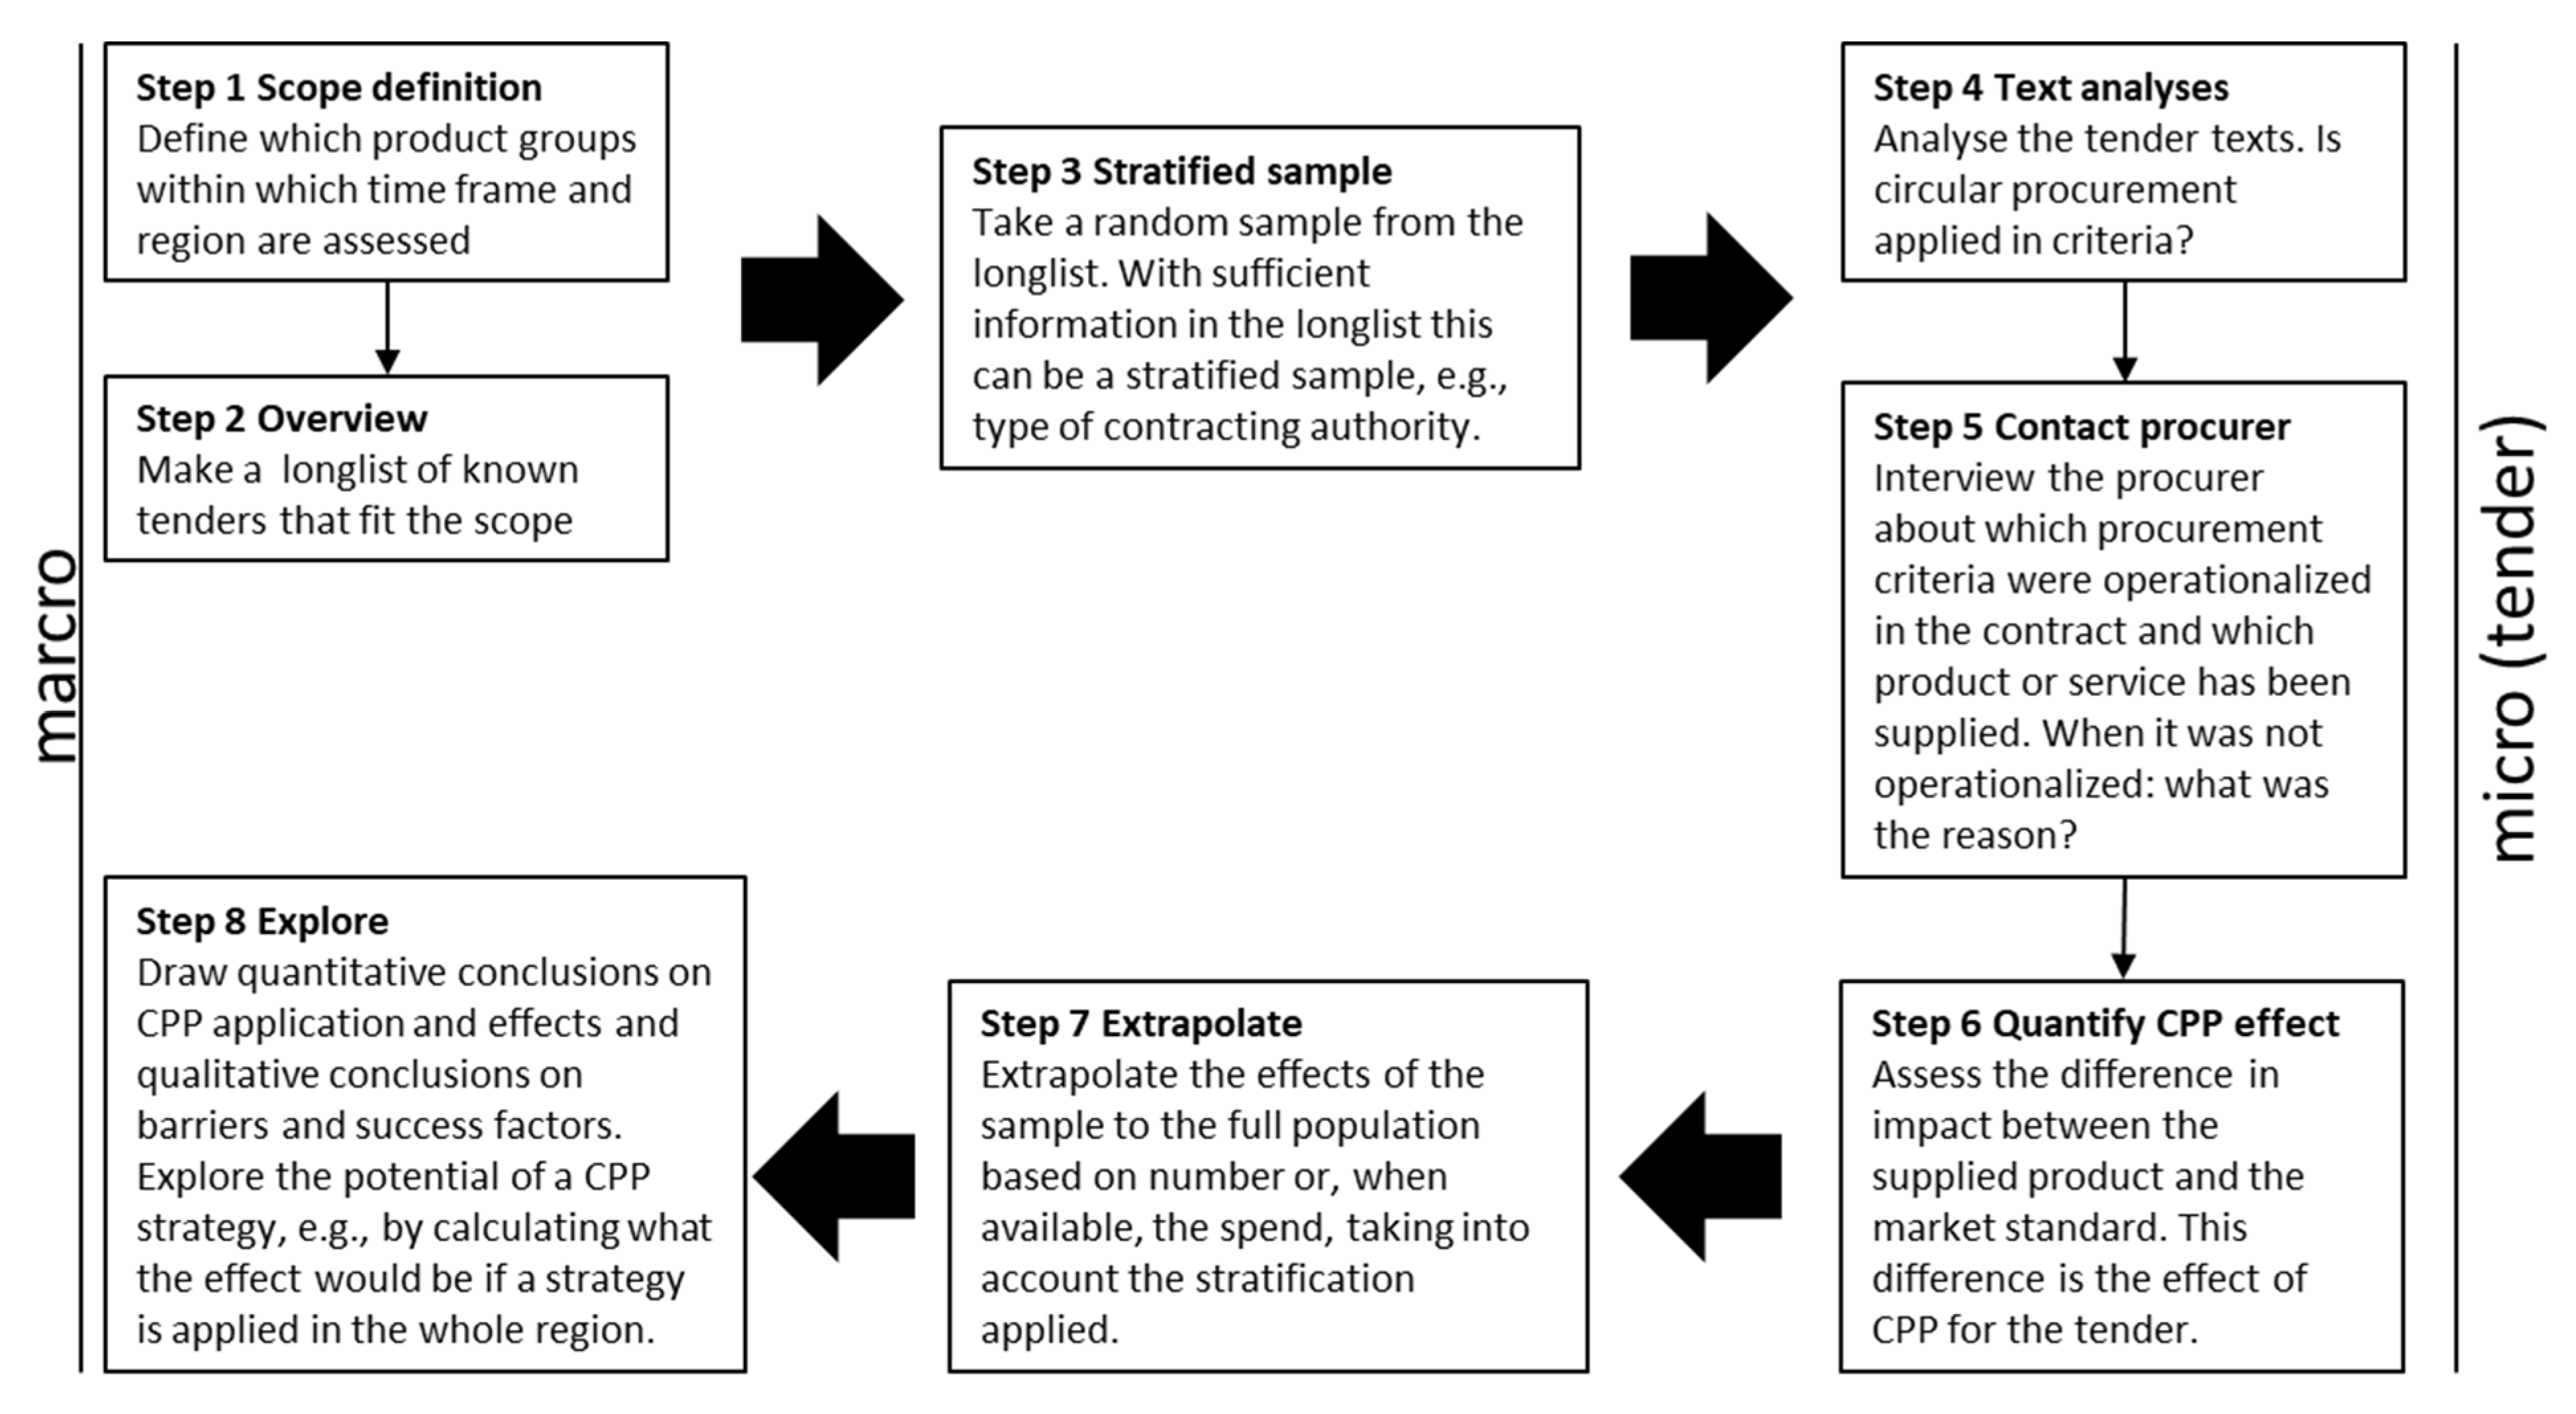
2. Materials and Methods
- (a)
- The percentage or number of tenders with criteria that directly ask for circular strategies (reuse, recycling, etc.);
- (b)
- The percentage or number of tenders with criteria that trigger circular strategies;
- (c)
- The percentage or number of tenders with criteria that trigger more ambitious circular strategies than the present market standard;
- (d)
- The percentage or number of tenders with criteria that successfully trigger more ambitious circular strategies than the present market standard.
3. Results
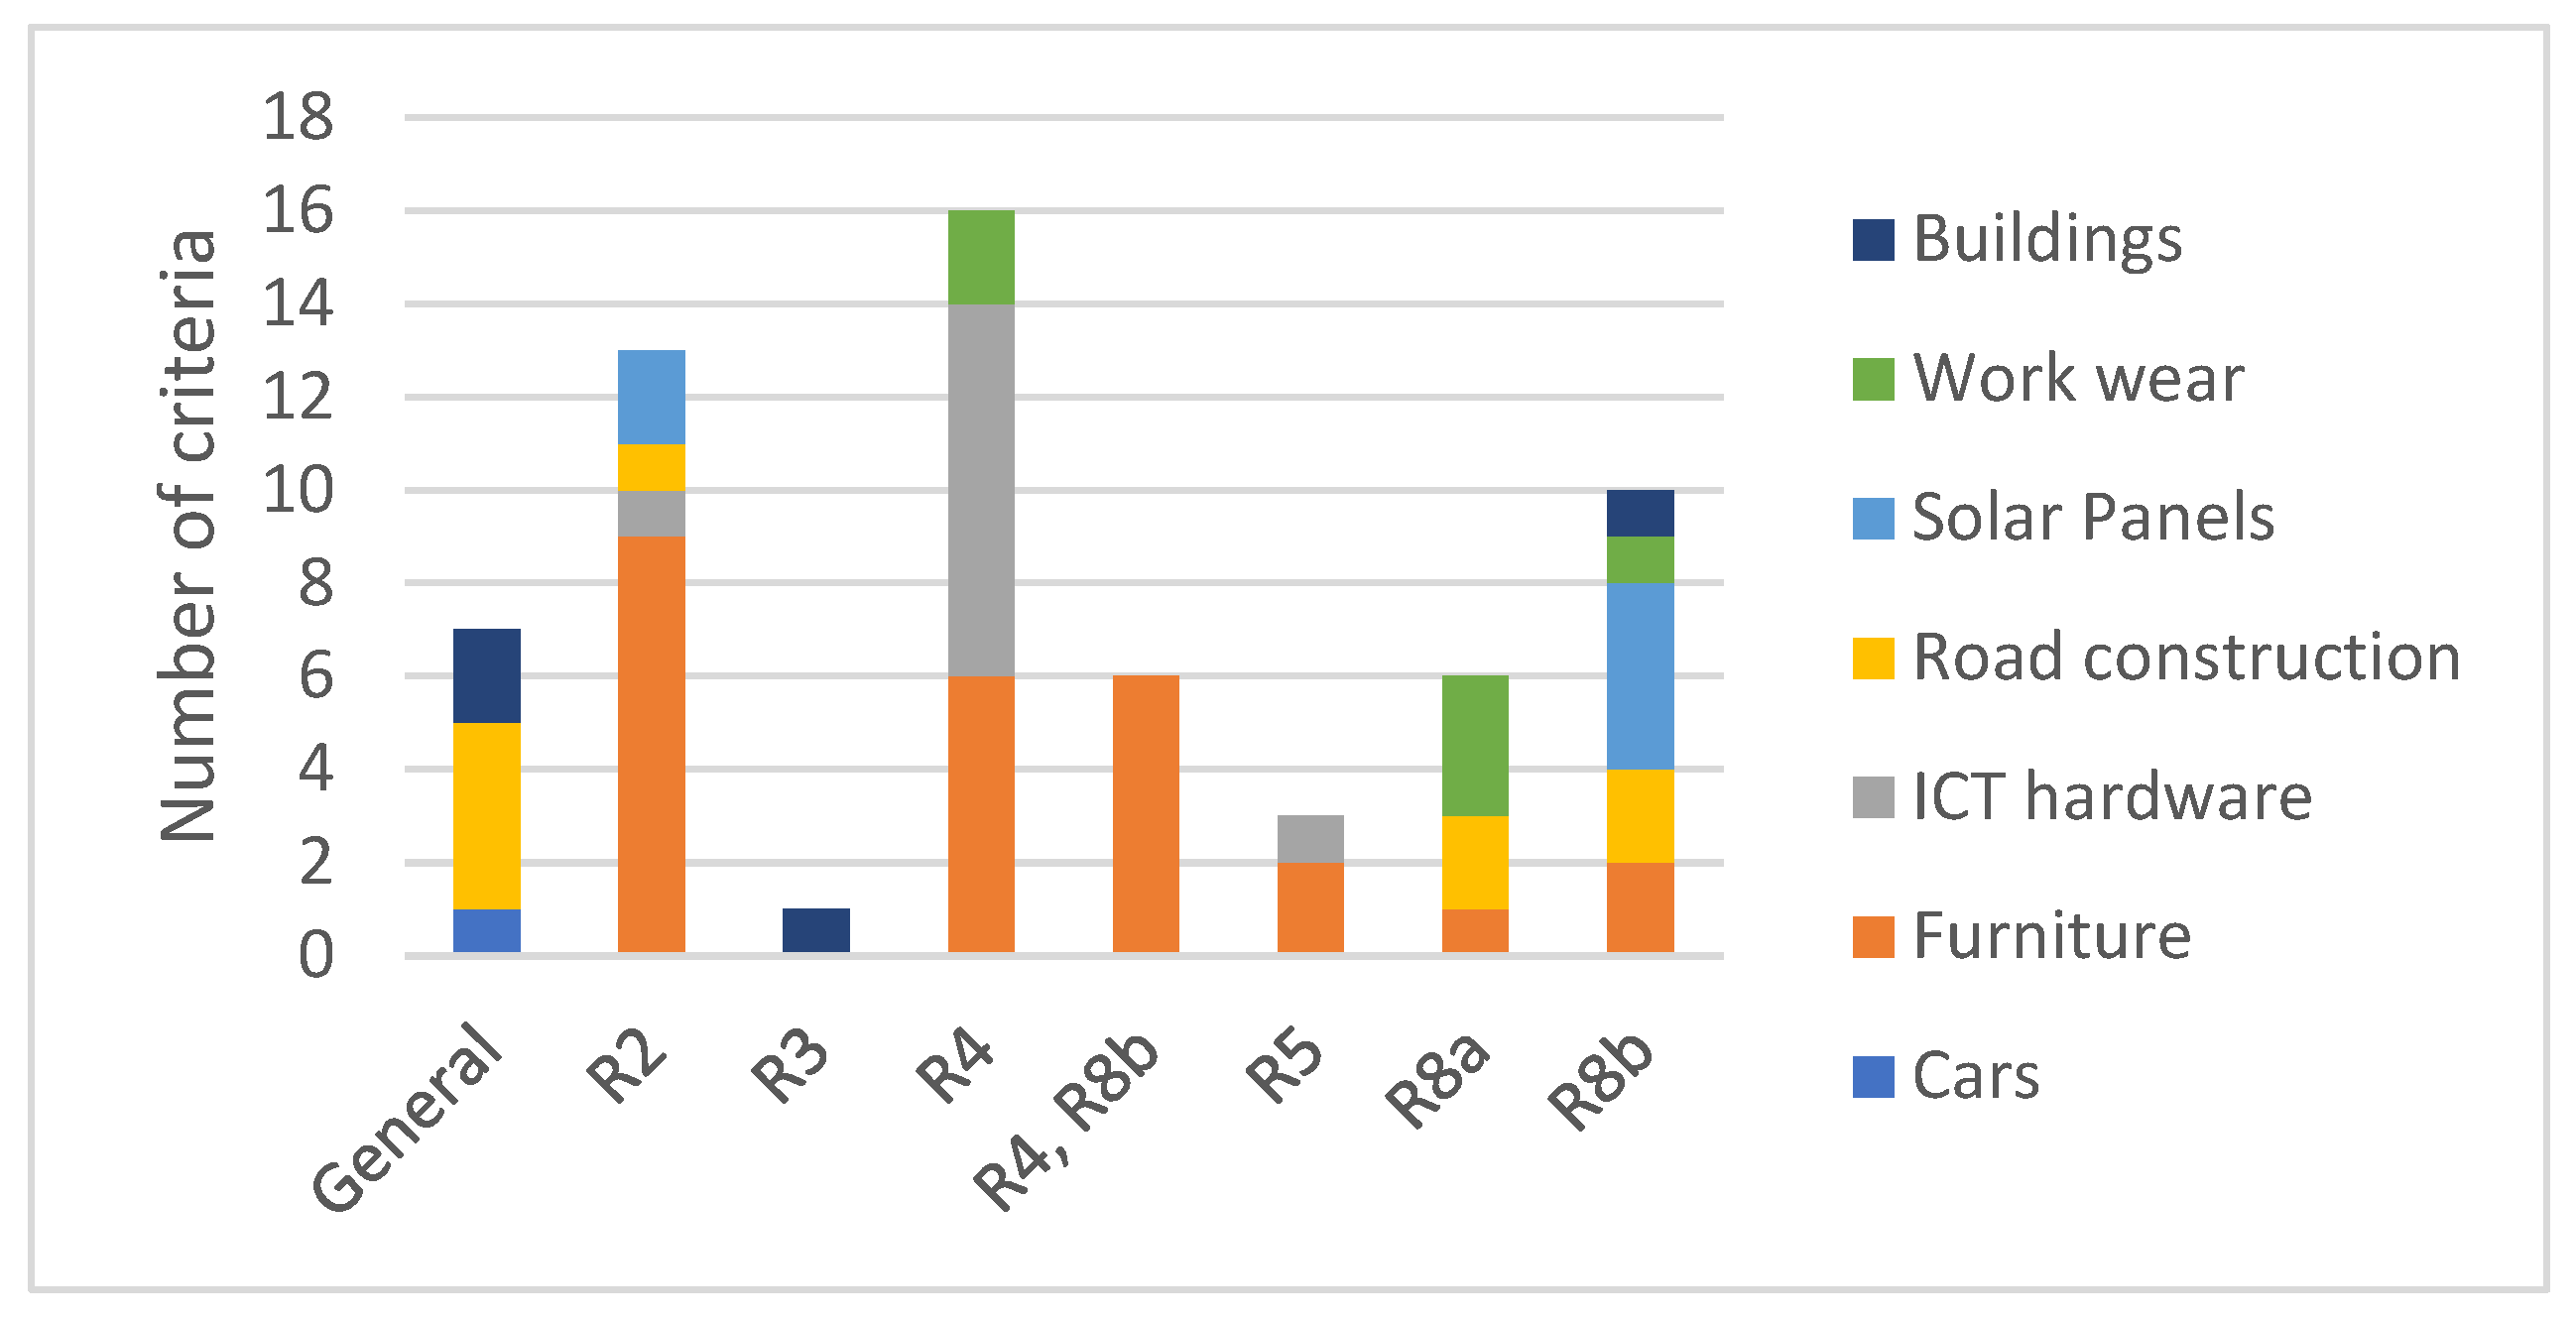
3.1. Text Analysis
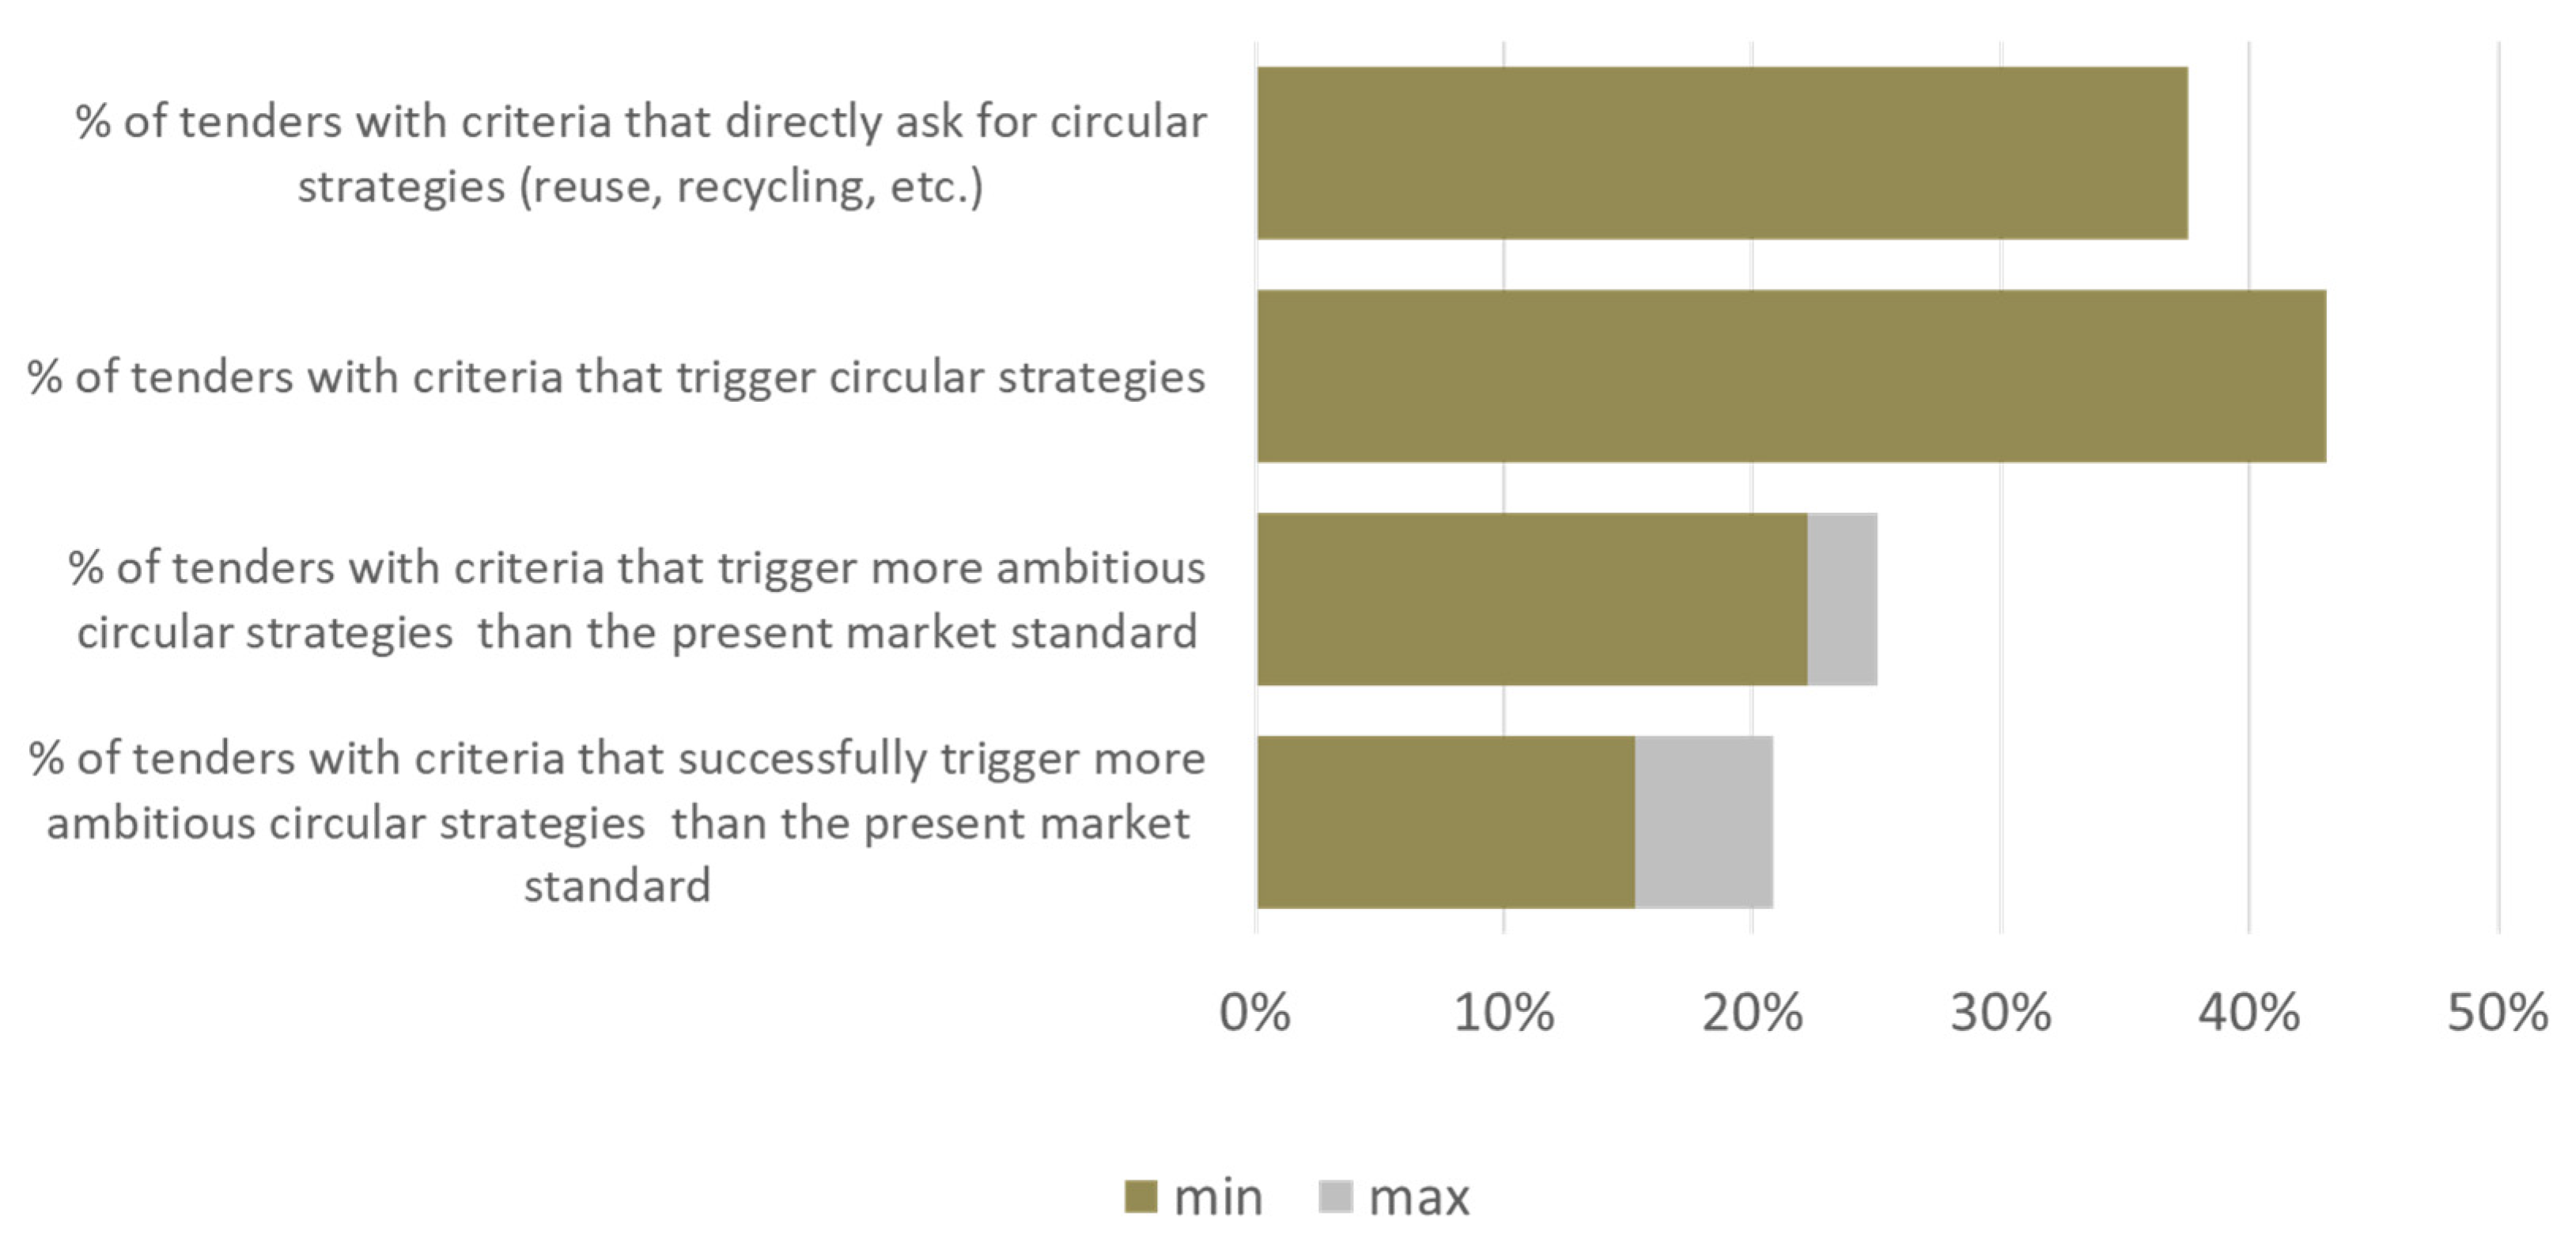
3.2. Effect Estimation Based on Interviews
- Twenty were not clearly deviating from common practice and thus comparable to the market standard. This was the case with, for example, ICT hardware, where requirements regarding availability of spare parts were defined in a very general way, as is common practice. It also occurred with the collection and recycling of solar panels after use, which does not deviate from the common practice described in the WEEE directive [35]. Without more specific requirements for recycling, no extra benefits are to be expected.
- Seven were not operationalized in the contracting phase. Examples included criteria on the recyclability of furniture and workwear after use, which were not operationalized in the contract with the supplier nor secured in the organization of the contracting authority.
- For 21 applications, the ambition and level of operationalization remained unclear. For example, in the case of ICT, the tendering organizations did not administrate how often the option to order refurbished ICT devices within the contract was used. Additionally, no data were gathered to evaluate if the longer guarantee period indeed resulted in longer use of the devices. In the case of furniture, it remained unclear if and how a criterion on easier disassembling was operationalized. Furthermore, agreements on maintenance and repair were not monitored. Data on the type and number of repairs were not gathered for either the reference or the new situation. This type of administration is necessary to assess if CPP application leads to any impact or should be adjusted.
- Fourteen applications were both more ambitious than the market standard and operationalized specifically.
- A total of 43% of the tenders contained one or more CPP criteria;
- Of this, the larger part (38%) used criteria directly related to circularity, and 5% used criteria that triggered circularity indirectly;
- Between 22 and 25% of the tenders contained one or more CPP criteria that were more ambitious than the market standard;
- Between 15 and 21% of the tenders contained one or more CPP criteria that were more ambitious than the market and were also operationalized specifically.
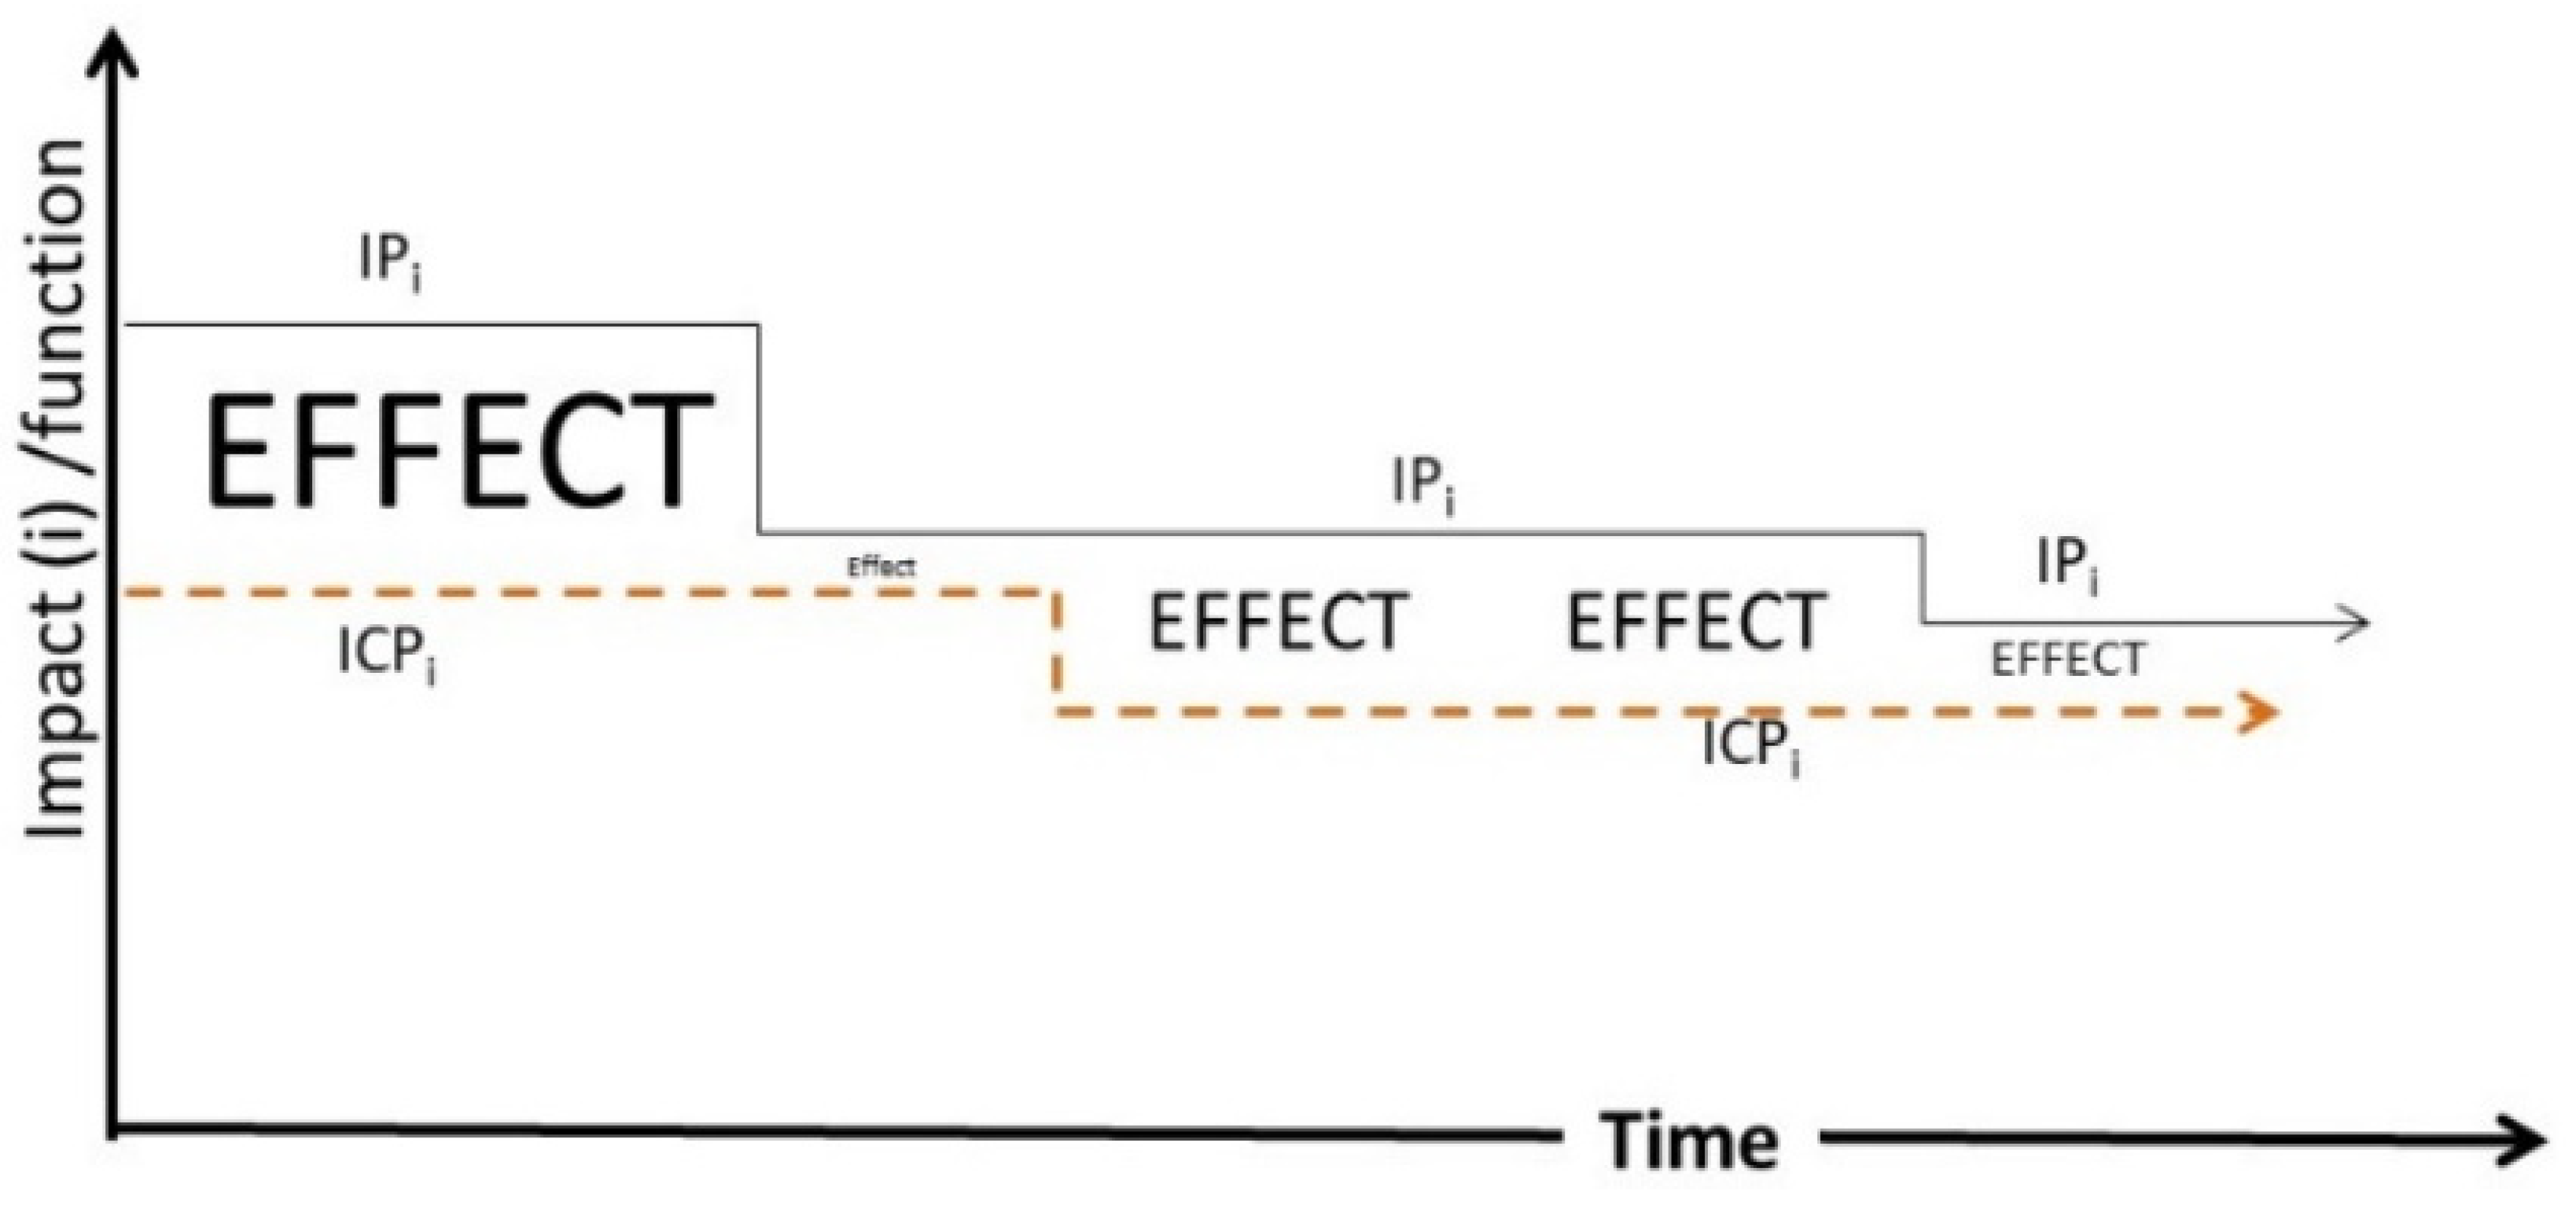
3.3. Calculated Effects
- A longer lifetime than the average product (furniture and road construction);
- Refurbishment (furniture);
- Higher recycled contents than the average product (workwear and road construction);
- Sustainability scores or certificates (road construction) which lead to products with longer lifetimes and higher recycled contents.
3.4. Exploration of Measures
4. Discussion and Conclusions
Supplementary Materials
Author Contributions
Funding
Institutional Review Board Statement
Informed Consent Statement
Data Availability Statement
Acknowledgments
Conflicts of Interest
References
- UN. Transforming Our World: The 2030 Agenda for Sustainable Development; General Assembly of the United Nations, Ed.; A/RES/70/1; United Nations: Barcelona, Spain, 2015. [Google Scholar]
- Raworth, K. A Safe and Just Space for Humanity: Can We Live Within the Doughnut? Oxfam: Oxford, UK, 2012. [Google Scholar]
- Steffen, W.; Richardson, K.; Rockström, J.; Cornell, S.E.; Fetzer, I.; Bennett, E.M.; Biggs, R.; Carpenter, S.R.; De Vries, W.; De Wit, C.A.; et al. Planetary boundaries: Guiding human development on a changing planet. Science 2015, 347, 736–747. [Google Scholar] [CrossRef] [PubMed]
- Steenmeijer, M.A.; van der Zaag, J.D.; Corts, J.C.; Tauber, J.M.; Hollander, A.; van den Berg, T.; van der Zande, C.P.L.; Zijp, M.C. The Environmental Impact of EUR 85 Billion in Annual Procurement by All Dutch Governments. A Study That Helps to Pri-Oritise in Sustainable Public Procurement (SPP). RIVM Report 2021-0220. Available online: https://www.rivm.nl/bibliotheek/rapporten/2021-0220.pdf (accessed on 2 May 2022).
- EC. Public Procurment—Why Public Procurement Is Important. 2021. Available online: https://ec.europa.eu/growth/single-market/public-procurement_en (accessed on 23 February 2021).
- Bratt, C.; Hallstedt, S.; Robèrt, K.H.; Broman, G.; Oldmark, J. Assessment of criteria development for public procurement from a strategic sustainability perspective. J. Clean. Prod. 2013, 52, 309–316. [Google Scholar] [CrossRef]
- EC. Buying Green! A Handbook on Green Public Procurement, 3rd ed.; European Commission: Brussels, Belgium, 2016. [Google Scholar]
- Lundberg, S.; Marklund, P.-O. Green public procurement and multiple environmental objectives. Econ. E Politica Ind. 2018, 45, 37–53. [Google Scholar] [CrossRef]
- OECD. Governments at a Glance 2017; OECD Publishing: Paris, France, 2017. [Google Scholar]
- Sönnichsen, S.D.; Clement, J. Review of green and sustainable public procurement: Towards circular public procurement. J. Clean. Prod. 2020, 245, 118901. [Google Scholar] [CrossRef]
- EC. Public Procurement for a Circular Economy: Good Practice and Guidance. 2017. Available online: http://ec.europa.eu/environment/gpp/ (accessed on 23 February 2021).
- Kirchherr, J.; Reike, D.; Hekkert, M. Conceptualizing the circular economy: An analysis of 114 definitions. Resour. Conserv. Recycl. 2017, 127, 221–232. [Google Scholar] [CrossRef]
- Bocken, N.M.P.; de Pauw, I.; Bakker, C.; van der Grinten, B. Product design and business model strategies for a circular economy. J. Ind. Prod. Eng. 2016, 33, 308–320. [Google Scholar] [CrossRef]
- Harley, K.; van Santen, A.; Kirchherr, J. Policies for transitioning towards a circular economy: Expectations from the European Union (EU). Res. Conserv. Recyl. 2020, 155, 104634. [Google Scholar] [CrossRef]
- Alhola, K.; Ryding, S.O.; Salmenperä, H.; Busch, N.J. Exploiting the Potential of Public Procurement: Opportunities for Circular Economy. J. Ind. Ecol. 2018, 23, 96–109. [Google Scholar] [CrossRef]
- Kannan, D. Sustainable procurement drivers for extended multitier context: A multi-theoretical perspective in the Danish supply chain. Transp. Res. Part E: Logist. Transp. Rev. 2021, 146, 102092. [Google Scholar] [CrossRef]
- Large, R.O.; Thomsen, C.G. Drivers of green supply management performance: Evidence from Germany. J. Purch. Supply Manag. 2011, 17, 176–184. [Google Scholar] [CrossRef]
- Roman, A.V. Institutionalizing sustainability: A structural equation model of sustainable procurement in US public agencies. J. Clean. Prod. 2017, 143, 1048–1059. [Google Scholar] [CrossRef]
- Walker, H.; Brammer, S. Sustainable procurement in the United Kingdom public sector. Supply Chain Manag. Int. J. 2009, 14, 128–137. [Google Scholar] [CrossRef]
- Zaidi, S.A.H.; Mirza, F.M.; Hou, F.; Ashraf, R.U. Addressing the sustainable development through sustainable procurement: What factors resist the implementation of sustainable procurement in Pakistan? Soc. Econ. Plan Sci. 2019, 68, 100671. [Google Scholar] [CrossRef]
- Cheng, W.; Appolloni, A.; D’Amato, A.; Zhu, Q. Green Public Procurement, missing concepts and future trends—A critical review. J. Clean. Prod. 2018, 176, 770–784. [Google Scholar] [CrossRef]
- Lundberg, S.; Marklund, P.O.; Strömbäck, E. Is Environmental Policy by Public Procurement Effective? Public Financ. Rev. 2014, 44, 478–499. [Google Scholar] [CrossRef]
- Zijp, M.C.; Kok, L.; de Valk, E. Measuring the Effect of Sustainable Public Procurement. Bilthoven, The Netherlands. RIVM Report 2018-0069. 2018. Available online: https://www.rivm.nl/bibliotheek/rapporten/2018-0069.html (accessed on 23 February 2021).
- Cerutti, A.K.; Ardente, F.; Contu, S.; Donno, D.; Beccaro, G.L. Modelling, assessing, and ranking public procurement options for a climate-friendly catering service. Int. J. Life Cycle Assess. 2018, 23, 95–115. [Google Scholar] [CrossRef]
- Larsen, H.N.; Hertwich, E.G. Implementing Carbon-Footprint-Based Calculation Tools in Municipal Greenhouse Gas Inventories. J. Ind. Ecol. 2010, 14, 965–977. [Google Scholar] [CrossRef]
- Alvarez, S.; Rubio, A. Carbon footprint in Green Public Procurement: A case study in the services sector. J. Clean. Prod. 2015, 93, 159–166. [Google Scholar] [CrossRef]
- Creswell, J.W.; Clark, V.L. Designing and Conducting Mixed Methods Research, 2nd ed.; Sage: Thousand Oaks, CA, USA, 2011. [Google Scholar]
- Zijp, M.C.; Dekker, E.; de Graaff, L.H.; Hollander, A.M.; van Snijder, L.; van Bruggen, A. Measuring the effect of circular procurement. In Definitions, Method and Test for the Dutch National CE Report; RIVM Report 2020-002: Bilthoven, The Netherlands, 2020. [Google Scholar]
- TenderNed. TenderNed E-Procurement Platform. 2021. Available online: https://www.tenderned.nl/cms/english (accessed on 26 April 2021).
- Rosell, J. Getting the green light on green public procurement: Macro and meso determinants. J. Clean. Prod. 2020, 279, 123710. [Google Scholar] [CrossRef]
- Crafoord, K.; Dalhammar, C.; Milios, L. The use of public procurement to incentivize longer lifetime and remanufacturing of computers. Procedia CIRP 2018, 73, 137–141. [Google Scholar] [CrossRef]
- van Buren, N.; Demmers, M.; van der Heijden, R.; Witlox, F. Towards a circular economy: The role of Dutch logistics industries and governments. Sustainability 2016, 8, 647. [Google Scholar] [CrossRef]
- Wernet, G.; Bauer, C.; Steubing, B.R.; Moreno-Ruiz, E.J.; Weidema, B. The ecoinvent database version 3 (part I): Overview and methodology. Int. J. Life Cycle Assess. 2016, 21, 1218–1230. [Google Scholar] [CrossRef]
- UN. Monitoring Sustainable Public Procurement Implementation; Recommendations and case studies; United Nations: Barcelona, Spain, 2015. [Google Scholar]
- EC. Directive 2012/19/EU of the European Parliament and of the Council on waste electrical and electronic equipment (WEEE) (recast). Off. J. Eur. Union 2012, 197, 38–71. [Google Scholar]
- Rietbergen, M.G.; Van Rheede, A.; Blok, K. The target-setting process in the CO2 Performance Ladder: Does it lead to ambitious goals for carbon dioxide emission reduction? J. Clean. Prod. 2015, 103, 549–561. [Google Scholar] [CrossRef]
- Yu, C.; Morotomi, T.; Yu, H. What Influences Adoption of Green Award Criteria in a Public Contract? An Empirical Analysis of 2018 European Public Procurement Contract Award Notices. Sustainability 2020, 12, 1261. [Google Scholar] [CrossRef]
- DGBC. Building Research Establishment Environmental Assessment Method. 2021. Available online: https://www.breeam.nl/english-9 (accessed on 26 April 2021).
- DGBC. INSIDE/INSIDE. 2021. Available online: https://www.insideinside.nl/en/ (accessed on 26 April 2021).
- De Vos, S. LCA Achtergrondrapport voor Nederlandse Asfaltmengsels; Rapport voor Opname van Branch Representatieve Asfaltmengsels in de Nationale Milieudatabase, Versie 2.1.; TNO: Utrecht, The Netherlands, 2018. [Google Scholar]
- Becker, M.C.; Lazaric, N.; Nelson, R.R.; Winter, S.G. Applying organizational routines in understanding organizational change. Ind. Corp. Change 2005, 14, 775–791. [Google Scholar] [CrossRef]
- Rolfstam, M. An institutional approach to research on public procurement of innovation. Innov. Eur. J. Soc. Sci. Res. 2012, 25, 303–321. [Google Scholar] [CrossRef]
- Lenderink, B.; Halman, J.I.; Boes, J.; Voordijk, H.; Dorée, A.G. Procurement and innovation risk management: How a public client managed to realize a radical green innovation in a civil engineering project. J. Purch. Supply Manag. 2022, 28, 100747. [Google Scholar] [CrossRef]
- Grandia, J.; Groeneveld, S.M.; Kuipers, B.S.; Steijn, A.J. Sustainable Procurement in Practice: Explaining the Degree of Sustainable Procurement from an Organisational Perspective. Riv. Politica Econ. 2013, 2, 41–66. [Google Scholar]
- Ye, M.; Ma, Y.; Liu, J. Why do public sectors perform high-level green public procurement practice? A new insight with fsQCA approach. J. Environ. Plan. Manag. 2021, 1–29. [Google Scholar] [CrossRef]
- Grandia, J. The role of change agents in sustainable public procurement projects. Public Money Manag. 2015, 35, 119–126. [Google Scholar] [CrossRef]
- Kleijn, R.; van der Voet, E.K.; Kramer, G.J.; van Oers, L.; van der Giesen, C. Metal requirements of low-carbon power generation. Energy 2011, 36, 5640–5648. [Google Scholar] [CrossRef]
Publisher’s Note: MDPI stays neutral with regard to jurisdictional claims in published maps and institutional affiliations. |
© 2022 by the authors. Licensee MDPI, Basel, Switzerland. This article is an open access article distributed under the terms and conditions of the Creative Commons Attribution (CC BY) license (https://creativecommons.org/licenses/by/4.0/).
Share and Cite
Zijp, M.; Dekker, E.; Hauck, M.; De Koning, A.; Bijleveld, M.; Tokaya, J.; De Valk, E.; Hollander, A.; Posthuma, L. Measuring the Effect of Circular Public Procurement on Government’s Environmental Impact. Sustainability 2022, 14, 10271. https://doi.org/10.3390/su141610271
Zijp M, Dekker E, Hauck M, De Koning A, Bijleveld M, Tokaya J, De Valk E, Hollander A, Posthuma L. Measuring the Effect of Circular Public Procurement on Government’s Environmental Impact. Sustainability. 2022; 14(16):10271. https://doi.org/10.3390/su141610271
Chicago/Turabian StyleZijp, Michiel, Erik Dekker, Mara Hauck, Arjan De Koning, Marijn Bijleveld, Janot Tokaya, Elias De Valk, Anne Hollander, and Leo Posthuma. 2022. "Measuring the Effect of Circular Public Procurement on Government’s Environmental Impact" Sustainability 14, no. 16: 10271. https://doi.org/10.3390/su141610271
APA StyleZijp, M., Dekker, E., Hauck, M., De Koning, A., Bijleveld, M., Tokaya, J., De Valk, E., Hollander, A., & Posthuma, L. (2022). Measuring the Effect of Circular Public Procurement on Government’s Environmental Impact. Sustainability, 14(16), 10271. https://doi.org/10.3390/su141610271